

Crypto World
XRP Traders Face $50B in Unrealized Losses as Price Slips Below $1.40
XRP price has taken a brutal hit.
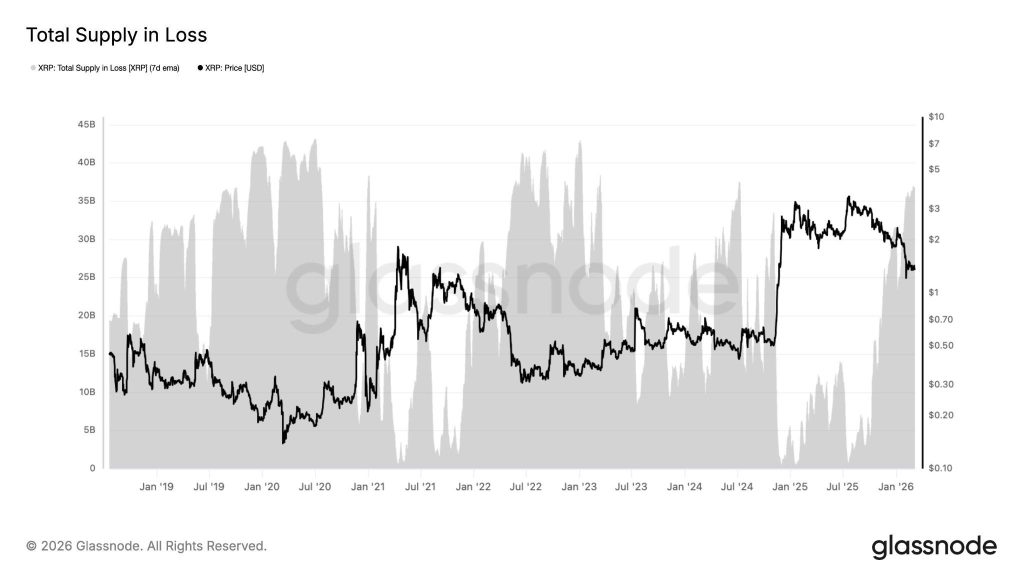
The token is down about 63% from its multi-year high and has slipped below $1.40. That drop has left more than $50.8 billion in unrealized losses in XRP, with a large portion of holders now underwater.
With price hovering near $1.35, traders are facing a big question. Is this deep pullback finally forming a market bottom, or is more downside still ahead?
The answer likely comes down to a few key levels that could decide where XRP moves next.
What the $50B Unrealized Loss Figure Actually Means for XRP Holders
On-chain data shows how heavy the pressure has become.
According to Glassnode, about 36.8 billion XRP are currently held at a loss. That puts the average holder cost around $1.44, meaning a large portion of investors are underwater while price trades below that level.

That creates an interesting dynamic. Traders sitting at a loss usually avoid selling unless support breaks and panic kicks in. But the moment price recovers near their entry, many rush to exit at break-even, turning that area into strong resistance.
At the same time, broader market pressure is not helping. XRP ETFs have seen steady outflows, including a $16.2 million redemption late last week.
With so many holders trapped and liquidity thinning, any sharp drop below current support could trigger a wave of forced selling.
Capitulation Risk: The Levels That Change Everything for XRP Price
Right now, everything revolves around a few key levels on the chart.
The biggest danger sits at $1.28. That is the monthly low XRP printed when momentum completely stalled earlier this year. If price breaks below that level, the next downside target appears near $1.11.
On the other hand, buyers have been defending the $1.31 to $1.34 zone. This area has repeatedly absorbed selling pressure and helped stabilize the market during recent dips.
For sentiment to improve, XRP needs to climb back above $1.48. That level roughly matches the average cost basis for many holders, meaning a recovery there could remove some of the heavy selling pressure.
In the short term, $1.43 is the first barrier to watch. A daily close above it would suggest the market is starting to recover.
The post XRP Traders Face $50B in Unrealized Losses as Price Slips Below $1.40 appeared first on Cryptonews.

Bitcoin price is eyeing a technical breakout from an ascending parallel channel pattern as institutional demand returns for the bellwether asset.
Summary
- Bitcoin price is trading within a bullish continuation pattern that hints at more upside over the coming sessions.
- Bitcoin ETFs hit a weekly inflow streak for the first time in 5 months.
According to data from crypto.news, Bitcoin (BTC) price rose 4.2% in the past 24 hours, trading at $70,197 at press time. Now, charts suggest Bitcoin could see more recovery over the following sessions.
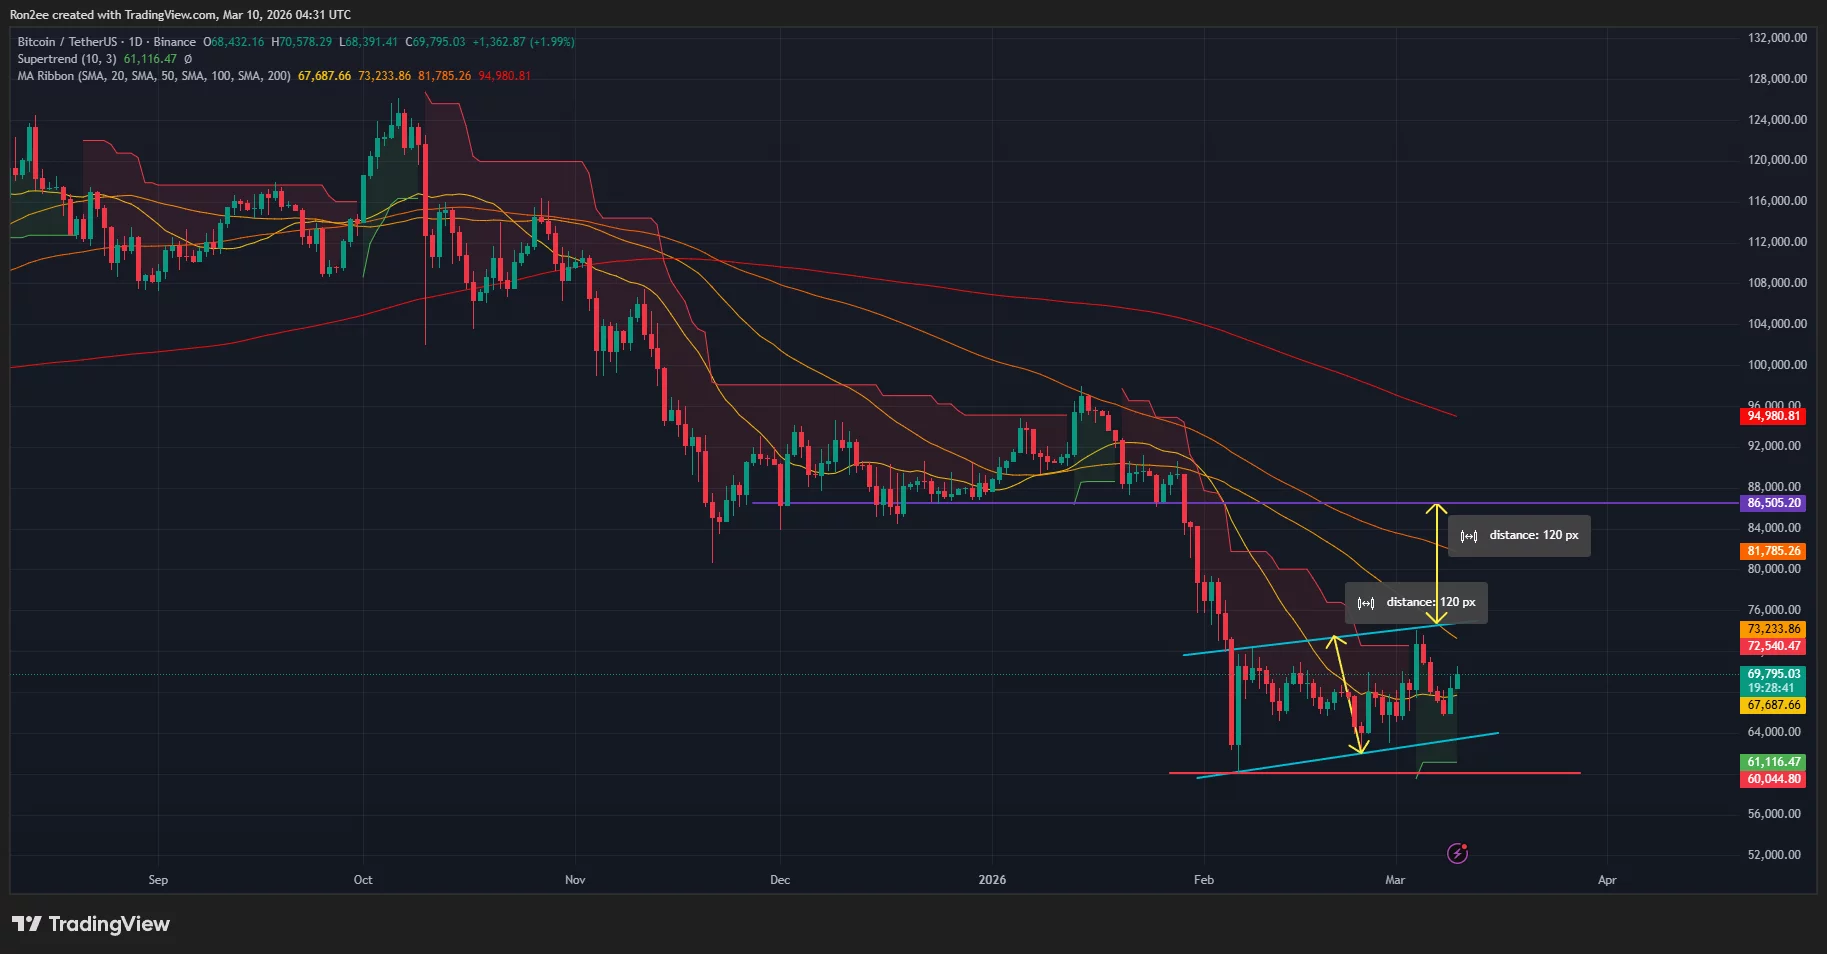
On the daily chart, Bitcoin price has formed an ascending parallel channel pattern following its sharp drop in early February. The popular bullish continuation pattern hints at sustained gains as long as an asset’s price remains within the two trendlines that define the corridor.

Further, a breakout from the upper side of the channel tends to accelerate bullish momentum for the related asset.
At the time of writing, technical indicators seemed to suggest that Bitcoin price is on the cusp of such a breakout from the pattern. The 20-day and 50-day moving averages are closing in on a bullish crossover, while the Supertrend flashed green as BTC price moved above it.
As such, $73,226, which aligns with the 50-day SMA, is the most immediate key resistance level traders would be keeping an eye on. A sharp rebound from it could springboard its price to around $86,500, a level that had previously served as a key support area during most of January this year.
On the contrary, if Bitcoin price falls below $67,674, the 20-day SMA, the bullish forecast would be invalidated. Bears could then drag BTC price back to the $65,000 key psychological support level.
A major catalyst that has been providing support for Bitcoin’s recent rebound is the surging demand from institutional investors for the asset.
According to data from SoSoValue, the 12 spot Bitcoin ETFs recorded over $1.35 billion in net inflows over the past two weeks. This marked the first time these investment products managed to draw in back-to-back weekly inflows since early October last year. Additionally, March has also marked the first positive month for these funds after four consecutive months of bleeding.
Meanwhile, firms like Strategy have also played a key role in supporting price action. In its latest filing, the firm noted that it bought $1.28 billion worth of BTC, pushing its total holding valuation to $56.04 billion.
Disclosure: This article does not represent investment advice. The content and materials featured on this page are for educational purposes only.
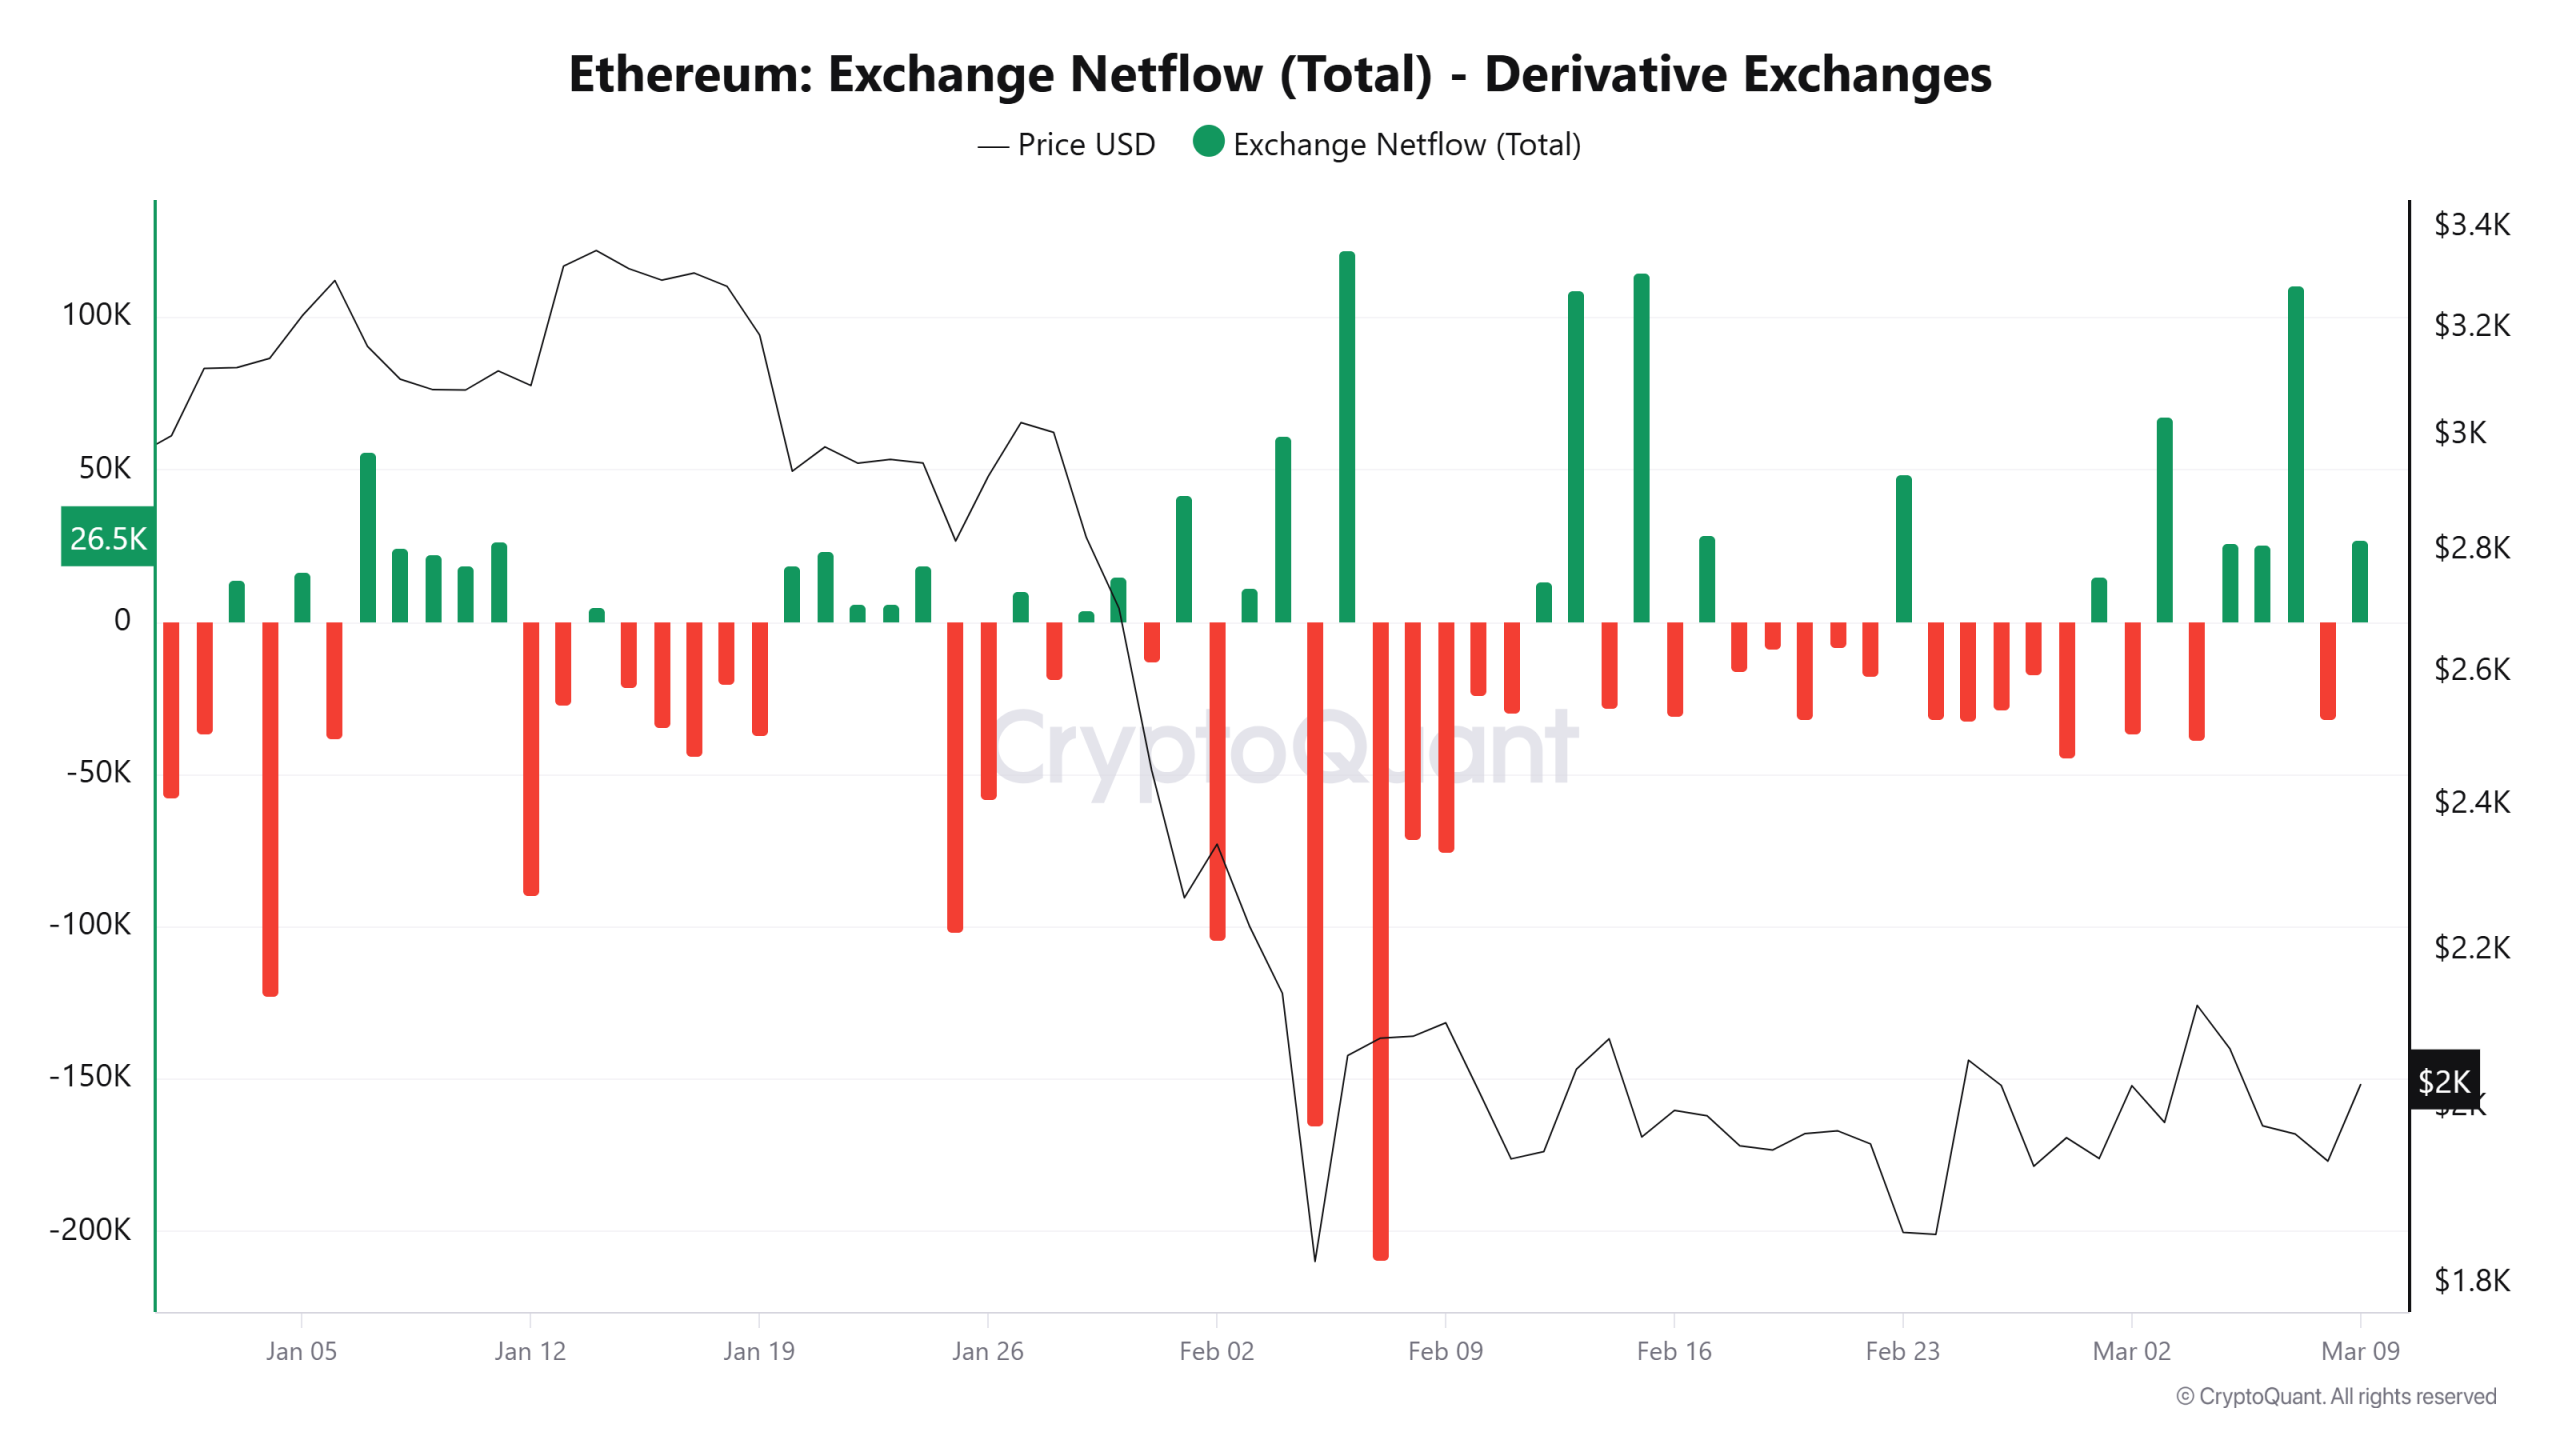
Ether (ETH) climbed back above $2,000 on Monday as the altcoin’s derivatives market activity intensified across major exchanges. Data shows more than 110,000 Ether flowed into derivatives platforms, while a key leverage indicator surged to new highs.
The activity points to a rapid buildup of speculative positioning, suggesting traders are preparing for increased volatility as ETH attempts to break out of its monthly trading range.
Ether derivatives inflows meet rising leverage ratio
Ether derivatives exchanges recorded a netflow of 110,343 ETH on March 7, the third-largest spike in 2026. A larger move occurred on Feb. 6, when ETH rallied roughly 13% from its yearly low at $1,736.

CryptoQuant data shows that the earlier spikes in derivatives inflows frequently preceded short-term drawdowns or periods of sharp volatility.
At the same time, Ether’s estimated leverage ratio climbed to a record 0.78 on Wednesday, exceeding the previous high of 0.778 recorded on Jan. 1. The metric tracks the amount of open interest relative to exchange reserves, and it is widely used to gauge how aggressively traders employ borrowed capital.

A higher reading means a larger share of the positions rely on leverage. Such conditions tend to amplify the price move in either direction as liquidations build across the derivatives markets.
Related: Banks will run RWAs on two blockchain rails, says RedStone co-founder
Key liquidity sits near $2,050
Ether trades inside a monthly range between $1,800 and $2,000 following a swing failure pattern near $2,150 last Wednesday. The rejection signaled profit-taking above local highs, and the price retraced to the internal liquidity levels near $1,900 and $1,950 formed early last week.
The one-hour chart now shows a bullish pivot on the one-hour timeframe, which tracks the recovery on Monday after a liquidity sweep happened near $1,908 on Sunday.

The market’s current attention may shift toward the supply zone between $2,050 and $2,100 formed late last week. A clear breakout above that range and establishing it as support may allow ETH to break significantly above $2,150.
The seven-day liquidation data from CoinGlass shows a dense cluster of short positions above the current price. Roughly $273 million in cumulative short-liquidation leverage sits near $2,030.
Large concentrations of short liquidations often act as magnet levels for the price. A move into that zone may trigger forced buybacks from the overleveraged short positions, which may accelerate the upside volatility if tagged in quick succession.

Crypto analyst Cyril-DeFi noted that ETH/USD is also testing a long-term ascending trendline that has supported the price several times since the last market cycle. The analyst said,
“Every time the price touched this support, it eventually led to a strong bounce. Right now, the $1.9k–$2k area looks like a key level that could determine the next move.”

Related: Crypto funds gain $619M as markets hold up despite oil and war fears
This article does not contain investment advice or recommendations. Every investment and trading move involves risk, and readers should conduct their own research when making a decision. While we strive to provide accurate and timely information, Cointelegraph does not guarantee the accuracy, completeness, or reliability of any information in this article. This article may contain forward-looking statements that are subject to risks and uncertainties. Cointelegraph will not be liable for any loss or damage arising from your reliance on this information.
Oil prices fell while cryptocurrencies posted modest gains on Monday after US President Donald Trump told reporters that war with Iran could be coming to an end — even as he later ramped up the war rhetoric again on social media.
In a phone interview with CBS News on Monday, Trump made it appear that the war in Iran was wrapping up. The US military claims to have struck more than 3,000 Iranian targets in the first week of operations.
“I think the war is very complete, pretty much,” Donald Trump told CBS News. “If you look, they have nothing left. There’s nothing left in a military sense,” he added.
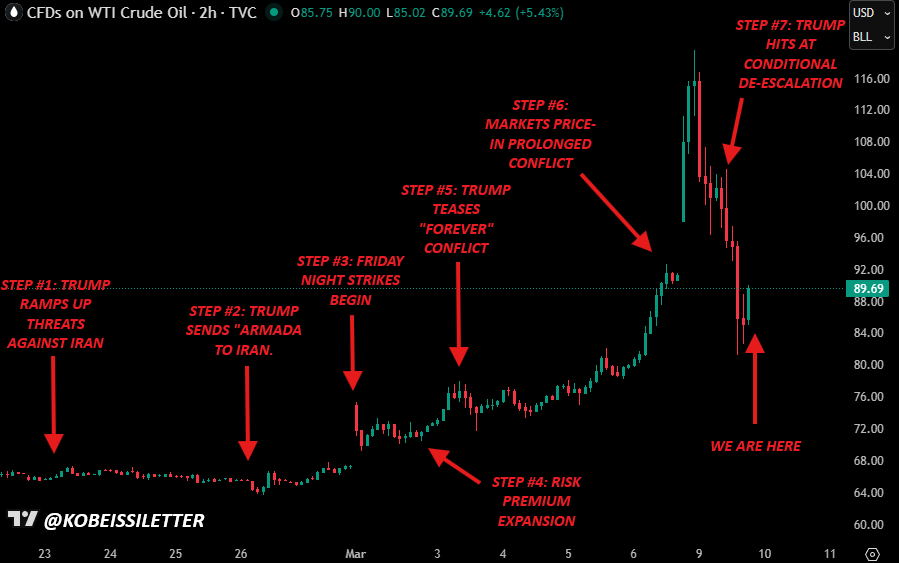
The comments saw oil prices fall 28% from their four-year high of $118 on Monday to around $85 in the hours that followed, according to OilPrice.

However, in his latest post on Truth Social on Tuesday, Trump ramped up the war rhetoric again, stating that “If Iran does anything that stops the flow of oil within the Strait of Hormuz, they will be hit by the United States of America TWENTY TIMES HARDER than they have been hit thus far.”
“Additionally, we will take out easily destroyable targets that will make it virtually impossible for Iran to ever be built back, as a Nation, again,” the President added.
“Death, Fire, and Fury will reign upon them — But I hope, and pray, that it does not happen!”
Trump’s comments in a Republican congressional fundraising event in Florida on Monday also hinted that the war may still have room to run.
“We’ve already won in many ways, but we haven’t won enough,” Trump said. “We go forward more determined than ever to achieve ultimate victory that will end this long-running danger once and for all.”
Crypto will follow other risk assets
Crypto markets are up 3.1% over the past 24 hours, with Bitcoin (BTC) reclaiming $70,000, and Ether (ETH) is hovering just above $2,000 at the time of writing.
Augustine Fan, partner and head of insights at crypto trading software service provider SignalPlus, told Cointelegraph that it is generally “hard to take these headline comments at face value, especially with other members of his [Trump’s] cabinet stating that things are still in the beginning phase, and US military assets still deployed in the region.”
“Crypto prices will continue to follow other risk assets without a fundamental narrative of its own in the near term, and macro leadership will still be driven by oil, which has seen a +$30 turnaround over the span of just 24 hours.”
Related: Bitcoin relief rally faces headwinds as bear market persists: analysts
“We don’t expect the conflict to be resolved any time soon,” he said, adding that “we would expect tradable bounces and BTC to do relatively better as a potential store of value during these times.”
Potential for prolonged uncertainty persists
Meanwhile, Andri Fauzan Adziima, research lead at Bitrue, told Cointelegraph that if Trump’s claim that the Iran war is almost over proves accurate, “I’m expecting a strong relief rally in crypto, driven by plunging oil prices, eased inflation/geopolitical fears, and renewed risk appetite.”
However, “doubts persist amid mixed signals from Iran and potential for prolonged uncertainty,” he added.
Iran’s Revolutionary Guard reportedly responded to Trump by saying that his comments were “nonsense” and “we are the ones that will determine the end of the war.”
Magazine: Bitcoin to outperform gold soon, FBI busts $46M crypto heist: Hodler’s Digest

Oil prices declined on Monday as President Donald Trump signaled a potential de-escalation in tensions with Iran, while cryptocurrencies posted modest gains in a risk-on session. In a phone interview with CBS News, Trump framed the conflict as nearing resolution, saying the war “is very complete” and suggesting Iran’s military capabilities had been diminished in the opening days of hostilities. The US military later asserted it had struck more than 3,000 Iranian targets in the first week of operations, a figure used to illustrate the scale of the campaign. The messaging volatility underscored the fragility of the macro backdrop, where energy markets remain volatile and crypto assets are increasingly tethered to risk sentiment. By the close, crypto markets were firmer, with Bitcoin reclaiming around $70,000 and Ether hovering near $2,000.
Key takeaways
- Oil prices retraced about 28% from a four-year high near $118 to roughly $85 as de-escalation chatter took hold, according to OilPrice.
- Crypto markets rose roughly 3.1% in the last 24 hours, with Bitcoin reclaiming around $70,000 and Ether just above $2,000.
- Trump’s later posting on Truth Social reignited war rhetoric, warning that Iran would be hit “TWENTY TIMES HARDER” if oil flow is disrupted, signaling renewed uncertainty for risk assets.
- Iran’s Revolutionary Guard dismissed the president’s remarks as “nonsense,” signaling that Tehran views the conflict as ongoing and unresolved.
- Analysts stressed that headlines may not reflect durable shifts in risk appetite; traders expect crypto to track broader macro moves rather than develop a standalone narrative in the near term.
- If oil continues to retreat and geopolitical tensions ease, a relief rally for crypto remains possible, though a protracted period of uncertainty cannot be ruled out.
Sentiment: Neutral
Price impact: Positive. Crypto prices moved higher as risk sentiment improved on de-escalation signals and softer oil prices.
Trading idea (Not Financial Advice): Hold. In the face of headline-driven moves and ongoing geopolitical ambiguity, traders may favor patience over active repositioning in BTC and ETH.
Market context: The day’s moves highlight how crypto markets often track broader risk assets amid macro headlines. Oil dynamics continue to exercise outsized influence on sentiment, and any shifts in geopolitical risk can quickly reprice crypto exposures as traders reassess risk premiums and liquidity conditions.
Why it matters
Geopolitical headlines have a well-established impact on both traditional and digital asset markets, and this episode underscores the permeability of crypto to macro narratives. When leadership signals the possibility of de-escalation, risk assets—including cryptocurrencies—tend to rally as liquidity conditions improve and investors seek higher-yield opportunities. Conversely, any escalation can trigger rapid risk-off moves, given the sensitivity of energy prices and the potential for volatility to spill over into crypto markets.
Market participants are watching the narrative closely because the outcome touches several interconnected pillars: the geopolitical backdrop, energy markets, and the evolving sentiment toward digital assets as potential hedges or risk-on plays. Analysts highlighted the risk of reading headlines as a sole predictor of direction, emphasizing the need to observe corroborating signals from official channels and macro data. The episode also emphasizes the ongoing debate about whether crypto can function as a stable store of value during periods of geopolitical stress or whether it will continue to mirror broader risk-on/risk-off cycles.
For investors and builders in the crypto space, the episode offers a reminder that macro risks remain a central driver of liquidity and price action. It also points to potential liquidity opportunities in more volatile periods, while cautioning that a longer-term resolution remains uncertain and could hinge on developments outside the crypto ecosystem.
What to watch next
- Official updates from the White House, the Pentagon, or Iran’s leadership in the coming 24–72 hours for signs of escalation or de-escalation.
- Oil price direction in subsequent sessions and its correlation with crypto price action, particularly around the $85 level and beyond.
- Trajectory of major crypto assets, especially BTC and ETH, in response to macro headlines and any shifts in risk appetite.
- Any new commentary from geopolitical actors or market analysts that could confirm a durable shift in sentiment or prolong the period of uncertainty.
Sources & verification
- CBS News interview: https://www.cbsnews.com/news/trump-iran-cbs-news-the-war-is-very-complete-strait-hormuz/
- Truth Social post by Donald Trump: https://truthsocial.com/@realDonaldTrump/posts/116202054617775180
- The Kobeissi Letter tweet: https://x.com/KobeissiLetter/status/2031156579630731462
- OilPrice article on oil price movement: https://oilprice.com/oil-price-charts/#WTI-Crude
- Cointelegraph discussion referencing oil-driven BTC moves: https://cointelegraph.com/markets/will-bitcoin-follow-oil-historic-surge-and-rally-to-79k-before-end-of-march
Oil tensions, Trump rhetoric and crypto markets: a 24-hour snapshot
Oil markets settled lower after President Trump’s remarks hinted at de-escalation in the Iran dispute, a move that coincided with a broad uptick in crypto prices. In a phone interview with CBS News, the president framed the ongoing exchanges as nearing resolution, saying, “the war is very complete, pretty much,” and suggesting Iran had little left militarily. The claim echoed a line of messaging from U.S. officials who have described the initial campaign as a broad and sustained campaign against Iran’s military targets. In the first week of hostilities, the U.S. military said it had struck more than 3,000 Iranian targets, a figure presented to emphasize the scope of the action while the diplomatic channel remains a subject of intense scrutiny.
The price action in crude oil reflected this ambiguity. Oil prices fell from a four-year high of around $118 to near $85 within hours, a move attributed in part to the perception that risk of a full-scale conflict could be receding. Market observers cautioned that headlines alone are not a reliable predictor of outcomes, as multiple officials signaled divergent views on the trajectory of hostilities. The interplay between geopolitical risk and energy markets continued to influence broader risk sentiment, with crypto assets showing resilience in a volatile environment.
Despite the early signals of de-escalation, later developments added a layer of complexity. A Truth Social post from Trump on Tuesday escalated the rhetoric, warning that Iran would be “hit by the United States of America TWENTY TIMES HARDER than they have been hit thus far” if the flow of oil through the Strait of Hormuz was interrupted. He also warned of taking out “easily destroyable targets” that would make it nearly impossible for Iran to emerge as a nation again. In a separate passage, Trump warned that “Death, Fire, and Fury will reign upon them — But I hope, and pray, that it does not happen!” The shifting tone underscored the persistent ambiguity around the ultimate outcome of the conflict, even as the market absorbed the implications of the rhetoric for risk assets.
Market observers tried to separate headline risk from the underlying price action. Augustine Fan, partner and head of insights at SignalPlus, noted that the crypto market tends to follow broader risk assets in the near term, lacking a standalone macro narrative in the absence of fundamental drivers. He said, “Crypto prices will continue to follow other risk assets without a fundamental narrative of its own in the near term, and macro leadership will still be driven by oil, which has seen a +$30 turnaround over the span of just 24 hours.” The interpretation reflected the broader consensus that headlines alone may not establish a durable directional shift, at least in the immediate aftermath of volatile news cycles.
Andri Fauzan Adziima, a research lead at Bitrue, suggested a potential relief rally if Trump’s claim of a quickly resolved Iran scenario proves accurate, pointing to falling oil prices, diminished geopolitical fears, and renewed risk appetite as drivers for crypto. Yet he cautioned that uncertainty remains because Iran’s leadership and the broader regional dynamic could unfold in unexpected ways. Tehran’s response to Trump’s remarks appeared to reinforce that the war’s end remains a contested proposition; the Revolutionary Guard reportedly described the president’s comments as “nonsense” and insisted that Tehran itself would determine the conflict’s end, underscoring the fragility of any near-term de-escalation narratives.
In this environment, the crypto market’s response was to press higher, with Bitcoin and Ether nudging back toward levels last seen during the volatility of the past week. The price movement reflected a broader pattern in which digital assets react to risk-on signals and macro shifts, even as the industry grapples with questions about whether these assets can act as a reliable hedge during geopolitical stress. While the immediate reaction suggested a tactical rally, market participants stressed the importance of watching the next set of statements and data to determine whether the momentum can be sustained beyond the headlines.
The evolving story remains a reminder that geopolitical risk continues to be a meaningful driver for both energy markets and crypto. The immediate question for traders is whether the lull in rhetoric represents a temporary pause or a longer-term turn in policy and strategy. As the political landscape evolves and oil prices stabilize or retreat further, the crypto market will likely reflect the aggregate of those macro signals, rather than presenting a self-contained narrative.)

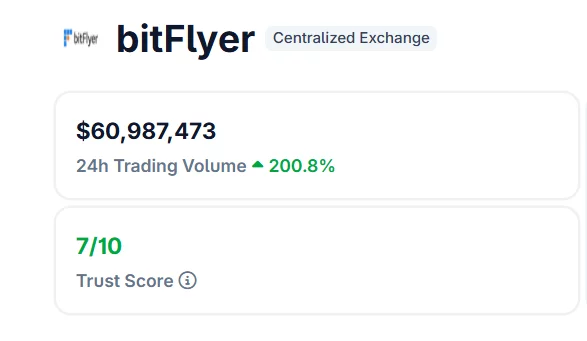
Trading activity on Japanese crypto exchange bitFlyer surged sharply as volatility in energy and equity markets pushed investors toward digital assets.
Summary
- Trading volume on bitFlyer jumped over 200% in 24 hours amid market volatility.
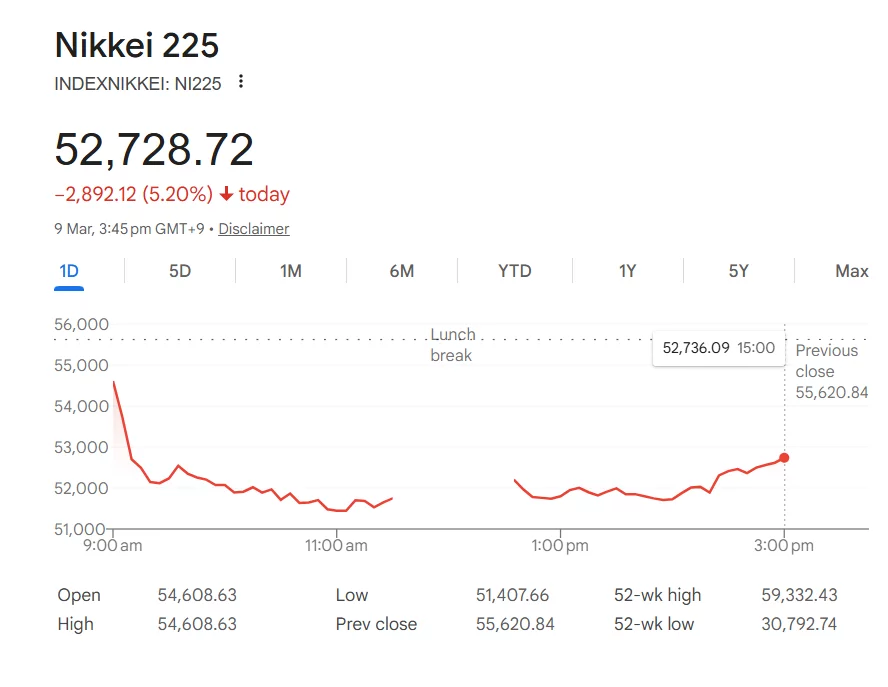
- Japan’s Nikkei 225 fell after oil prices surged toward $120 per barrel, sparking a risk-off move in equities.
- Bitcoin trading dominated activity on the exchange, with the asset holding near $67,000 during the turbulence.
According to market data, trading volumes on the Tokyo-based exchange jumped more than 200% within 24 hours, coinciding with a sharp sell-off in the Japanese stock market after oil prices spiked on escalating geopolitical tensions in the Middle East.
Japan’s benchmark equity index, the Nikkei 225, slid as energy prices surged, raising concerns over inflation and corporate costs in one of the world’s largest oil-importing economies. The sell-off came as crude prices briefly rallied toward the $120 per barrel level, triggering risk-off sentiment across Asian markets.
Against this backdrop, crypto trading activity surged as traders repositioned portfolios amid heightened macro uncertainty.
Data from BitFlyer showed that Bitcoin and yen trading pairs accounted for the majority of the spike, with Japanese investors increasing exposure to digital assets as traditional markets came under pressure.
The increase in activity reflects a broader pattern seen during periods of macro volatility, where cryptocurrencies often experience bursts of trading volume as investors seek alternative assets or hedge against currency and equity fluctuations.
The move was particularly notable for Bitcoin, which held relatively stable during the equity market turbulence, trading near the $67,000 level during Asian hours.
The surge in trading activity highlights the growing integration between crypto markets and global macro events. Energy shocks, currency fluctuations, and equity market sell-offs are increasingly influencing trading behavior across digital asset exchanges.
For Japanese traders, the combination of rising oil prices and equity weakness created an environment ripe for rapid repositioning — with cryptocurrencies becoming one of the most actively traded outlets during the market turmoil.
If volatility in global energy markets persists, analysts expect crypto trading activity in Asia to remain elevated in the near term.

Disclosure: The views and opinions expressed here belong solely to the author and do not represent the views and opinions of crypto.news’ editorial.
The energy transition is accelerating. Rooftop solar is scaling. Batteries are proliferating. Electric vehicles are becoming mainstream. Virtual Power Plants are aggregating distributed resources into grid-responsive portfolios. But beneath this progress lies a structural weakness that few are talking about: we are trying to run a real-time energy system on delayed financial rails.
Summary
- Energy moves fast, money doesn’t: Distributed energy and EV participation are growing, but settlement lags by days or weeks, creating friction, mistrust, and weak incentives.
- Tokenized accounting aligns finance with physics: Representing kilowatt-hours and flexibility as digital tokens enables verifiable, programmable transactions tied directly to energy flows.
- Real-time settlement drives behavior: Instant compensation and loyalty rewards encourage active participation, reduce reconciliation costs, and make distributed energy markets efficient and scalable.
Electricity moves in milliseconds, while settlement still moves in days. If distributed energy resources, independent power producers, behind-the-meter assets, and EV charging networks are going to deliver on their promise, we must modernize the accounting and settlement layer that underpins them. In my view, on-chain, real-time settlement is not a speculative upgrade. It is the financial backbone required for the next phase of energy market design.
Distributed energy is growing, but settlement hasn’t caught up
Distributed energy resources are no longer peripheral. The International Energy Agency has highlighted the growing role of distributed energy and flexibility resources in modern grids, particularly as systems integrate higher shares of renewables.
At the same time, research in renewable and sustainable energy reviews shows the rapid expansion of blockchain-based energy pilots designed to enable peer-to-peer trading and decentralized market participation.
Despite this progress, most energy markets still reconcile transactions through batch processing and legacy billing cycles. Meter data may be granular and near real-time, but financial settlement is often delayed by weeks, particularly in demand-side programs that rely on post-event measurement and verification.
This lag introduces friction:
- Delayed compensation for energy exports
- Opaque reconciliation processes
- Reduced trust between participants
- Weak incentives for real-time behavior
For centralized generation, settlement delays are manageable. For distributed markets, where thousands or millions of small assets interact dynamically, they are corrosive. The grid is becoming distributed and programmable. The financial layer supporting it is not.
Why real-time accounting changes market behavior
Tokenization in energy is often misunderstood. Properly implemented, it does not represent financial abstraction. It represents physical reality. Tokenization transforms physical grid resources (kilowatts of capacity, kilowatt-hours of flexibility, verified load reductions) into standardized, digital representations that can be measured, dispatched, and settled with precision.
Each token can represent a verifiable unit of capacity or flexibility, backed by telemetry and revenue-grade measurement. Integrated into open and standardized VPP architectures, tokenized energy enables granular coordination across millions of distributed devices while maintaining auditability and regulatory compliance.
This is not about creating new financial instruments. It is about creating digital accounting units aligned with physical energy flows. When standardized digital representations of flexibility exist, grid operators gain clearer visibility, utilities reduce reconciliation costs, and customers receive transparent and immediate value for participation. The missing piece is settlement frequency.
EV charging makes the problem visible
Electric vehicles illustrate this mismatch clearly. An EV plugged into the grid is not just consuming electricity. It may:
- Respond to time-of-use pricing
- Participate in demand response
- Provide vehicle-to-grid (V2G) services
- Export stored energy during peak demand
Research exploring blockchain-enabled EV energy trading shows how distributed ledgers can automate pricing and settlement between EVs and grids. Yet in most real-world deployments, compensation for these services flows through traditional billing systems.
Imagine an EV owner exporting energy during a peak pricing window, but waiting weeks for a credit to appear on a statement. That delay erodes trust and reduces participation. If the grid is becoming dynamic, settlement must be dynamic too.
Loyalty and rewards should be embedded in the settlement
We often talk about energy markets in engineering terms. But adoption is a customer experience issue. Behavioral economics consistently shows that immediate feedback is far more effective than delayed rewards. Traditional loyalty systems, airline miles, and retail points operate on delayed accounting models. Energy markets cannot.
When settlement becomes near real-time, loyalty can be integrated directly into the transaction layer. For example:
- Instant credits for charging during off-peak hours
- Immediate rewards for exporting solar during grid stress
- Automated incentives for participating in demand-response events
Market research on blockchain in energy trading notes its potential to enable transparent, tokenized credits and automated reconciliation across participants. The point is not token speculation. It is behavioral alignment. If customers can see, verify, and access value instantly, they become active market participants rather than passive ratepayers.
The strategic imperative
The global energy system is undergoing digital transformation through smart meters, AI-based load forecasting, distributed storage, and electrified transport, which are reshaping grid architecture. But digitization without financial modernization creates an imbalance.
Distributed energy resources are increasing system flexibility, as emphasized by the IEA. But flexible markets only function if incentives are immediate and reliable (IEA).
Real-time settlement closes that gap.
- It reduces reconciliation costs.
- It improves working capital efficiency.
- It strengthens trust between participants.
- It enables loyalty mechanisms that reward beneficial behavior instantly.
Most importantly, it aligns financial infrastructure with physical infrastructure.
The future is participation, not just generation
The next phase of the energy transition is not just about generating clean electricity. It is about enabling and widening participation. This means households with solar panels, EV drivers, battery owners, and commercial facilities with flexible loads have to become market actors. But markets are defined by how value is exchanged.
If energy participation remains tied to delayed settlement and opaque billing cycles, distributed systems will underperform their potential. And if settlement becomes transparent, programmable, and near real-time, energy markets begin to feel modern, because they are.
So real-time, on-chain accounting is not a peripheral innovation; it is the infrastructure layer that determines whether distributed energy remains experimental or becomes foundational. Electricity already moves at the speed of physics. Data already moves at the speed of networks. Capital must move at the same speed, or the system will never fully evolve.

Binance’s Bitcoin derivatives index has fallen to 0.35, with analysts noting similar readings appeared near past market lows.
Bitcoin (BTC), which was trading nearly 300 bucks around the $69,000 level at the time of this writing, has recorded readings from multiple on-chain indicators that often precede major trend changes, including weakening derivative momentum and falling short-term holder capital.
The signals have come at a time when the flagship cryptocurrency is struggling to hold recent gains, leaving traders divided over whether the current setup hints at a rebound or deeper weakness.
Derivatives Index and Short-Term Holder Capital Draw Attention
In a March 9 update, on-chain analyst Amr Taha wrote that the Binance Bitcoin derivatives market index has dropped to about 0.35. According to the analyst, the reading is close to the levels seen in July and August 2024 and lower than the 0.43 recorded in April 2025. In the past, readings near these levels appeared during major market lows, which were followed by prices going up significantly.
In the same post, the analyst shared a chart tracking the market cap of BTC in the possession of short-term holders, and per that chart, the figure has fallen to about $390 billion, down from around $437 billion recorded on April 7, 2025.
According to Taha, large declines in this metric have often been precursors to major capitulation events among short-term holders. For example, the same situation happened on April 8, 2025 (which is the day after the previous value of $437 billion was recorded), when heavy selling pressure pushed BTC toward $78,000 before it later climbed above $108,000.
Elsewhere, analyst GugaOnChain described the current situation as a “No Traction Engine” diagnosis, pointing to the Network Value to Transaction Value (NVT) ratio, which jumped 77% to reach 41.34.
NVT compares BTC’s market cap to its on-chain transaction volume, and the increase recorded suggests that the price is moving without corresponding network activity.
You may also like:
According to the expert, STH-MVRV sitting at 0.76 is a confirmation that retail investors are realizing losses, while the Coinbase Premium turning negative at -0.0048 shows that there is institutional selling pressure.
“The ‘No Traction Engine’ diagnosis is a severe warning,” they wrote. “Do not be deceived by momentary stability or rebounds without volume.”
Mixed On-Chain Signals
The indicator convergence described above is happening when Bitcoin is trading in a narrow range, with the ongoing conflict in the Middle East causing it some volatility. The asset briefly reached $74,000 last week, but on March 8, it fell below $66,000 per CoinGecko data before bouncing back to its current level above $68,000.
Meanwhile, U.S. spot Bitcoin ETFs saw about $568 million in new money come in last week, making it the second week in a row that there have been positive flows after months of steady withdrawals.
However, daily data showed some choppiness, with strong inflows early in the week giving way to nearly $350 million in outflows last Friday, according to SoSoValue. The pattern suggests that some investors are still being careful, even though new money is coming into the market.
Binance Free $600 (CryptoPotato Exclusive): Use this link to register a new account and receive $600 exclusive welcome offer on Binance (full details).
LIMITED OFFER for CryptoPotato readers at Bybit: Use this link to register and open a $500 FREE position on any coin!


Strategy disclosed a major Bitcoin purchase in a March 9 filing, adding 17,994 BTC to its balance sheet last week.
Summary
- Strategy purchased 17,994 BTC for $1.28 billion, paying about $70,946 per coin.
- The company’s total bitcoin holdings now stand at 738,731 BTC.
- The purchase was funded mainly through $900 million in common stock sales and $377 million in preferred stock issuance.
The company’s latest filing revealed that the Bitcoin (BTC) was acquired between March 2 and March 8 for about $1.28 billion, with an average purchase price of $70,946 per coin.
Following the purchase, Strategy’s total holdings reached 738,731 BTC, accumulated for roughly $56.04 billion at an average cost of $75,862 per bitcoin.
Stock sales used to fund the purchase
The acquisition was largely financed through equity sales. Strategy sold 6.3 million shares of Class A common stock, generating about $900 million in net proceeds.
The company also issued 3.7 million shares of its Stretch preferred stock (STRC), raising an additional $377 million. Together, the transactions brought in roughly $1.3 billion, which was used to fund the latest bitcoin purchase.
Strategy still has significant room to raise additional capital through its at-the-market programs. The company reported that $6.7 billion remains available for future sales of MSTR shares, along with $20.3 billion tied to its Strike preferred stock (STRK) and $3.2 billion linked to the Stretch preferred series.
Shares of MSTR were slightly higher in pre-market trading following the disclosure.
Long-term Bitcoin strategy continues
Strategy has steadily accumulated Bitcoin since 2020 under the leadership of executive chairman Michael Saylor, who has repeatedly said the company intends to keep buying the asset as part of its long-term treasury strategy.
The firm also updated its Omnibus Sales Agreement with a group of underwriters that includes TD Securities, Barclays Capital, and Morgan Stanley.
The revision allows Strategy to appoint a second sales agent for certain securities during pre-market and after-hours sessions. According to the filing, the change gives the company greater flexibility when executing large transactions outside regular trading hours.
Strategy remains the largest corporate holder of Bitcoin. The company has continued to increase its holdings through a mix of cash reserves, debt offerings, and equity sales.
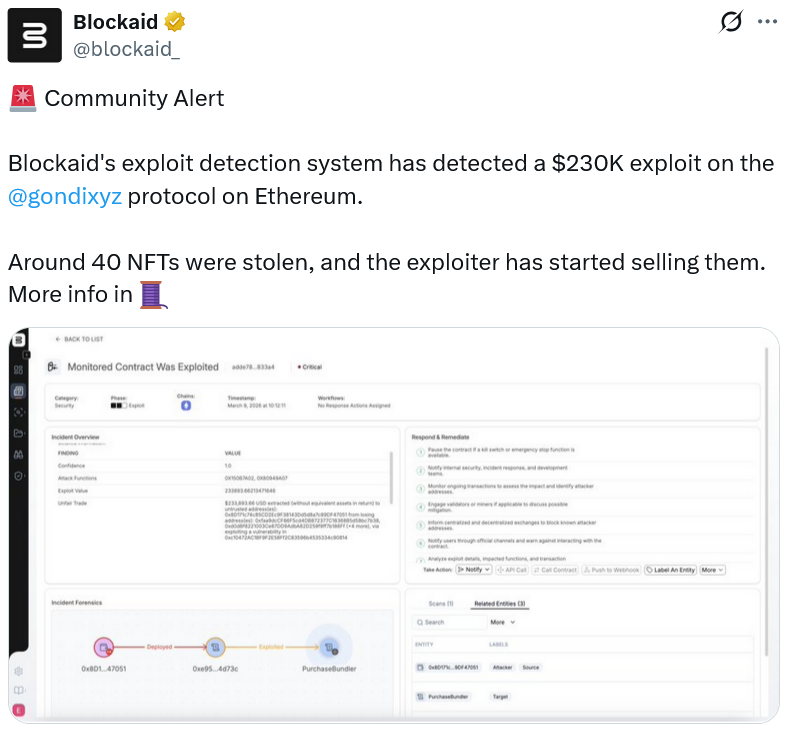
Nonfungible token platform Gondi said it has disabled the faulty smart contract that allowed a hacker to steal $230,000 worth of NFTs from the protocol, adding it is now in the process of compensating affected customers.
Gondi said in an X post on Monday that the hacker exploited the “Sell & Repay” contract, which lets borrowers sell escrowed NFTs and automatically repay loans on the platform.
Gondi noted that an updated version of that contract was deployed on Feb. 20 but didn’t confirm how the hacker managed to exploit it. Gondi said no other part of the platform was affected by the exploit.
Data from Ethereum block explorer Etherscan shows 78 NFTs were stolen on Monday at about 8:12 am UTC. Blockchain security platform Blockaid estimated the damage to be $230,000.

In an update, Gondi said its “focus has shifted entirely to making affected users whole” and that Blockaid and an independent auditor have since reviewed the platform, concluding it to be safe to use.
That includes repaying, renegotiating, refinancing loans and starting new loans in addition to buying, selling, trading and listing NFTs on the platform.
Gondi said it has not yet deployed a fix to the Sell & Repay contract, which has now been disabled.
Crypto Samaritans help Gondi recover NFTs
While Blockaid said the hacker had started selling some of the stolen NFTs, members of the NFT community managed to recover and return Doodle, Aluminum Gazer, Lil Pudgy and Servant of the Muse NFTs, Gondi noted.
“We are in active conversations on additional items and expect more to follow, including Taxmen.”
Crypto researcher “Tinoch” noted on X that one Gondi user, with wallet address “0x8d1…47051,” lost around $108,000 worth of NFTs, accounting for nearly half of the protocol theft.
Related: Magic Eden winds down EVM, Bitcoin NFT markets to focus on gambling
Gondi said it has already bought “comparable items” from the same NFT collections and transferred them to affected owners, and will continue to do so for any remaining cases.
“While not the exact same piece, we believe this is a fair and meaningful resolution and are coordinating directly with each owner.”
Magazine: What’s a ‘Network State’ and are there real-life examples? Big Questions
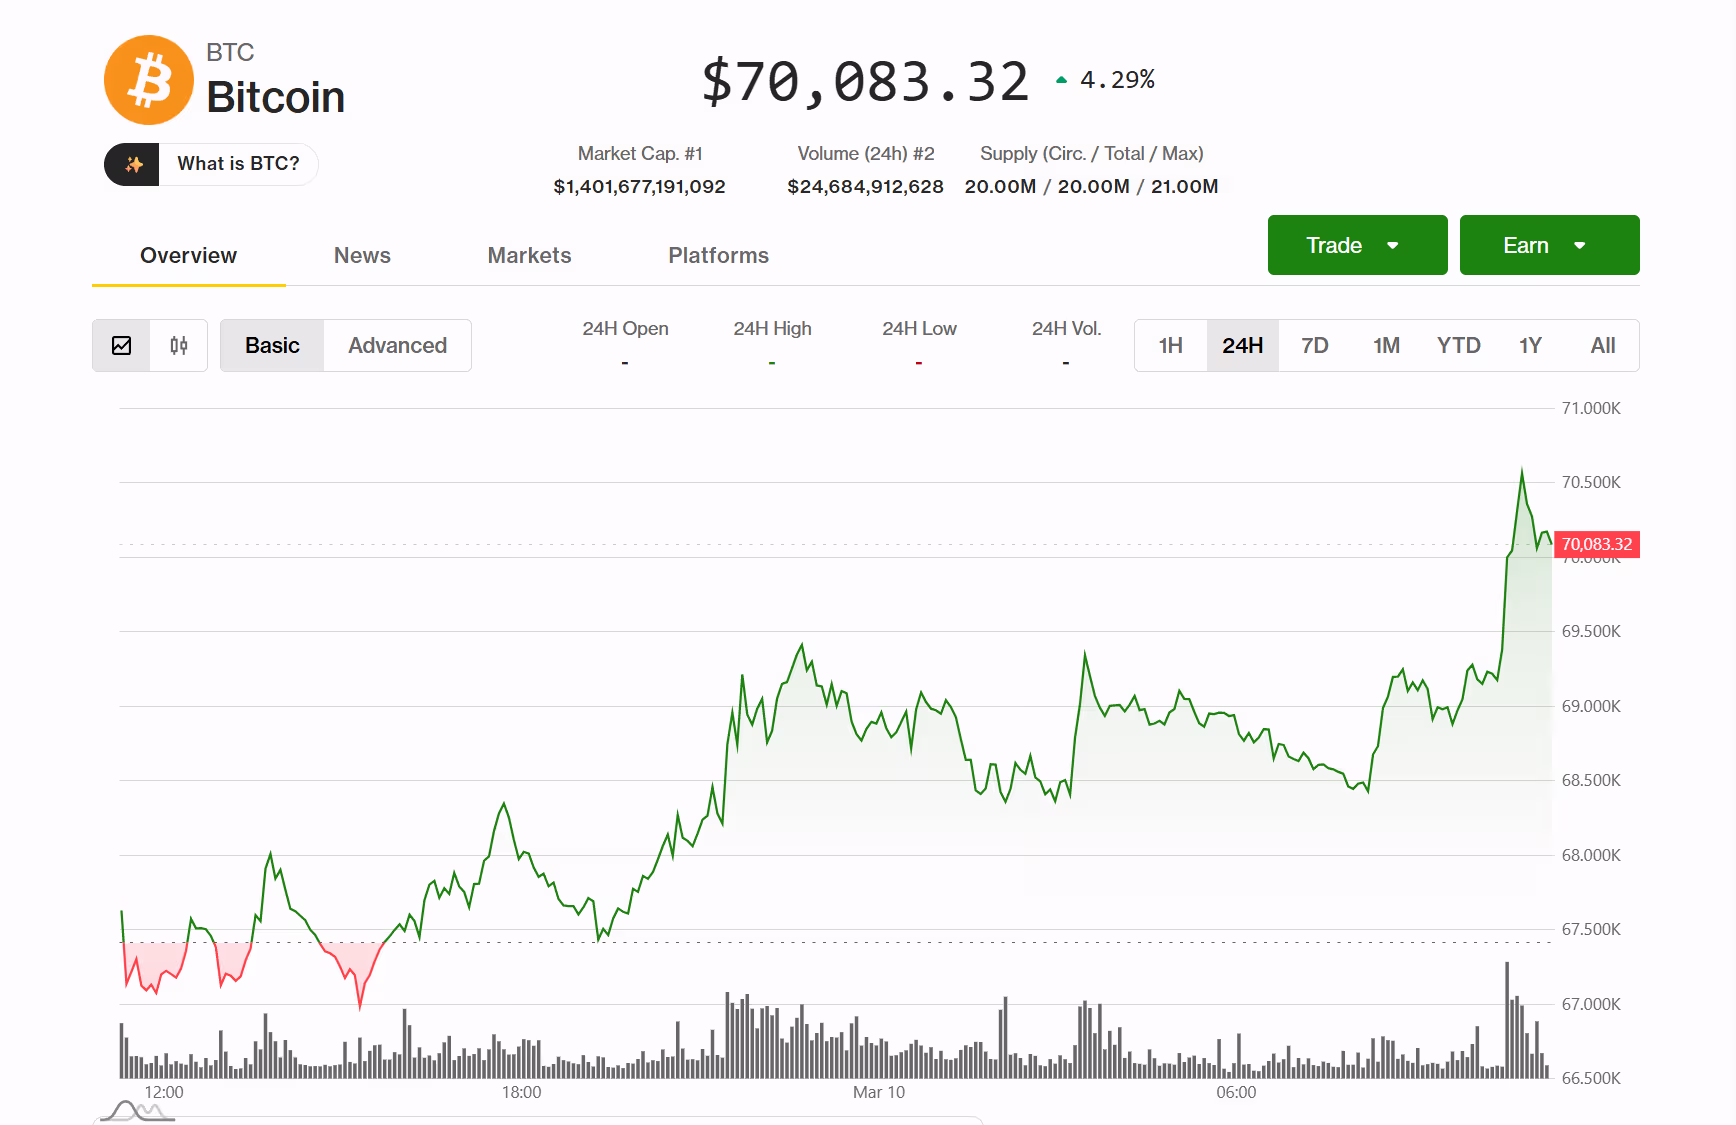
Bitcoin pushed back above $70,000 Tuesday morning East Asia time, completing a rapid recovery from a weekend selloff that briefly dragged the largest digital asset down to around $65,000.
The move higher came as volatility in energy markets eased after crude oil surged amid fears of disruptions in the Strait of Hormuz. Bitcoin dipped alongside risk assets during the initial shock but quickly stabilized in the mid $60,000 range — given Wall Street’s insulation from the energy crisis — before climbing again as markets digested the geopolitical headlines.

Market maker Enflux said the cryptocurrency showed notable resilience despite the scale of the energy shock.
“Bitcoin dipped below 66k during the initial risk-off wave yet quickly stabilized back in the 66k to 68k range,” the firm said in a note to CoinDesk. “In relative terms, it held up better than equities and even some traditional hedges.”
Institutional demand has also remained supportive.
U.S. spot bitcoin ETFs drew about $568 million in net inflows last week, following $787 million the week prior, according to data from SoSoValue, pushing cumulative net inflows across the products above $55 billion.
Early data from SoSoValue shows that Monday’s U.S. inflows were about $57 million, though not all issuers had reported at the time of publication.
Onchain and derivatives indicators suggest the market is stabilizing after the recent volatility, though conviction has yet to fully return.
“Overall, conditions are stabilizing, with momentum, ETF demand, and profitability metrics improving modestly,” analysts at Glassnode wrote in a recent report. “However, capital flows remain soft, speculative participation is limited, and broader conviction has yet to fully return.”
Prediction markets also flipped more bullish as bitcoin rebounded.
On Polymarket, the odds that BTC will reach $75,000 in March jumped to about 56% on Monday from roughly 34% a day earlier, highlighting how quickly trader expectations shifted as the cryptocurrency reclaimed the $70,000 level.

Marcus Rashford mistake leaves Man United paying the price as Gary Lineker speaks out

SACCO MONEY

Martin Lewis: Is it better to leave the heating on all day?


-

 Politics7 days ago
Alan Cumming Brands Baftas Ceremony A ‘Triggering S**tshow’
-
Business4 days ago
Form 8K Entergy Mississippi LLC For: 6 March
-

 Fashion3 days ago
Weekend Open Thread: Ann Taylor
-

 News Videos17 hours ago
10th Algebra | Financial Planning | Question Bank Solution | Board Exam 2026
-

 Crypto World13 hours ago
Paradigm, a16z, Winklevoss Capital, Balaji Srinivasan among investors in ZODL
-

 Tech5 days ago
Bitwarden adds support for passkey login on Windows 11
-
 Sports4 days ago
499 runs and 34 sixes later, India beat England to enter T20 World Cup final | Cricket News
-

 Sports2 days ago
Three share 2-shot lead entering final round in Hong Kong
-

 Sports2 days ago
Braveheart Lakshya downs Lai in epic battle to enter All England Open final | Other Sports News
-

 Business6 days ago
Guthrie Disappearance Enters Fifth Week as Family Visits Memorial
-

 Politics4 days ago
Top Mamdani aide takes progressive project to the UK
-

 NewsBeat4 days ago
Piccadilly Circus just unveiled ‘London’s newest tourist attraction’ and it only costs 80p to enter
-

 Business1 day ago
Search for Nancy Guthrie Enters 37th Day as FBI Probes Wi-Fi Jammer Theory
-

 Entertainment3 days ago
Hailey Bieber Poses For Sexy Selfies In New Luscious Lip Thirst Traps
-
 NewsBeat4 hours ago
Pagazzi Lighting enters administration as 70 jobs lost and 11 stores close across Scotland
-
 Sports7 days ago
Jack Grealish posts new injury update as Man City star enters crucial period
-

 Tech14 hours ago
Despite challenges, Ireland sixth in EU for board gender diversity
-

 Crypto World5 days ago
New Crypto Mutuum Finance (MUTM) Reports V1 Protocol Progress as Roadmap Enters Phase 3
-

 Tech5 days ago
ACIP To Discuss COVID ‘Vaccine Injuries’ Next Month, Despite That Not Being In Its Purview
-
Entertainment5 days ago
Harry Styles Has ‘Struggled’ to Discuss Liam Payne’s Death