

Crypto World
Will Chainlink price reclaim $10 amid volatility squeeze?
Chainlink price is tightening near $9 as volatility drops, with traders watching whether bulls can push LINK above the key $10 resistance level.
Summary
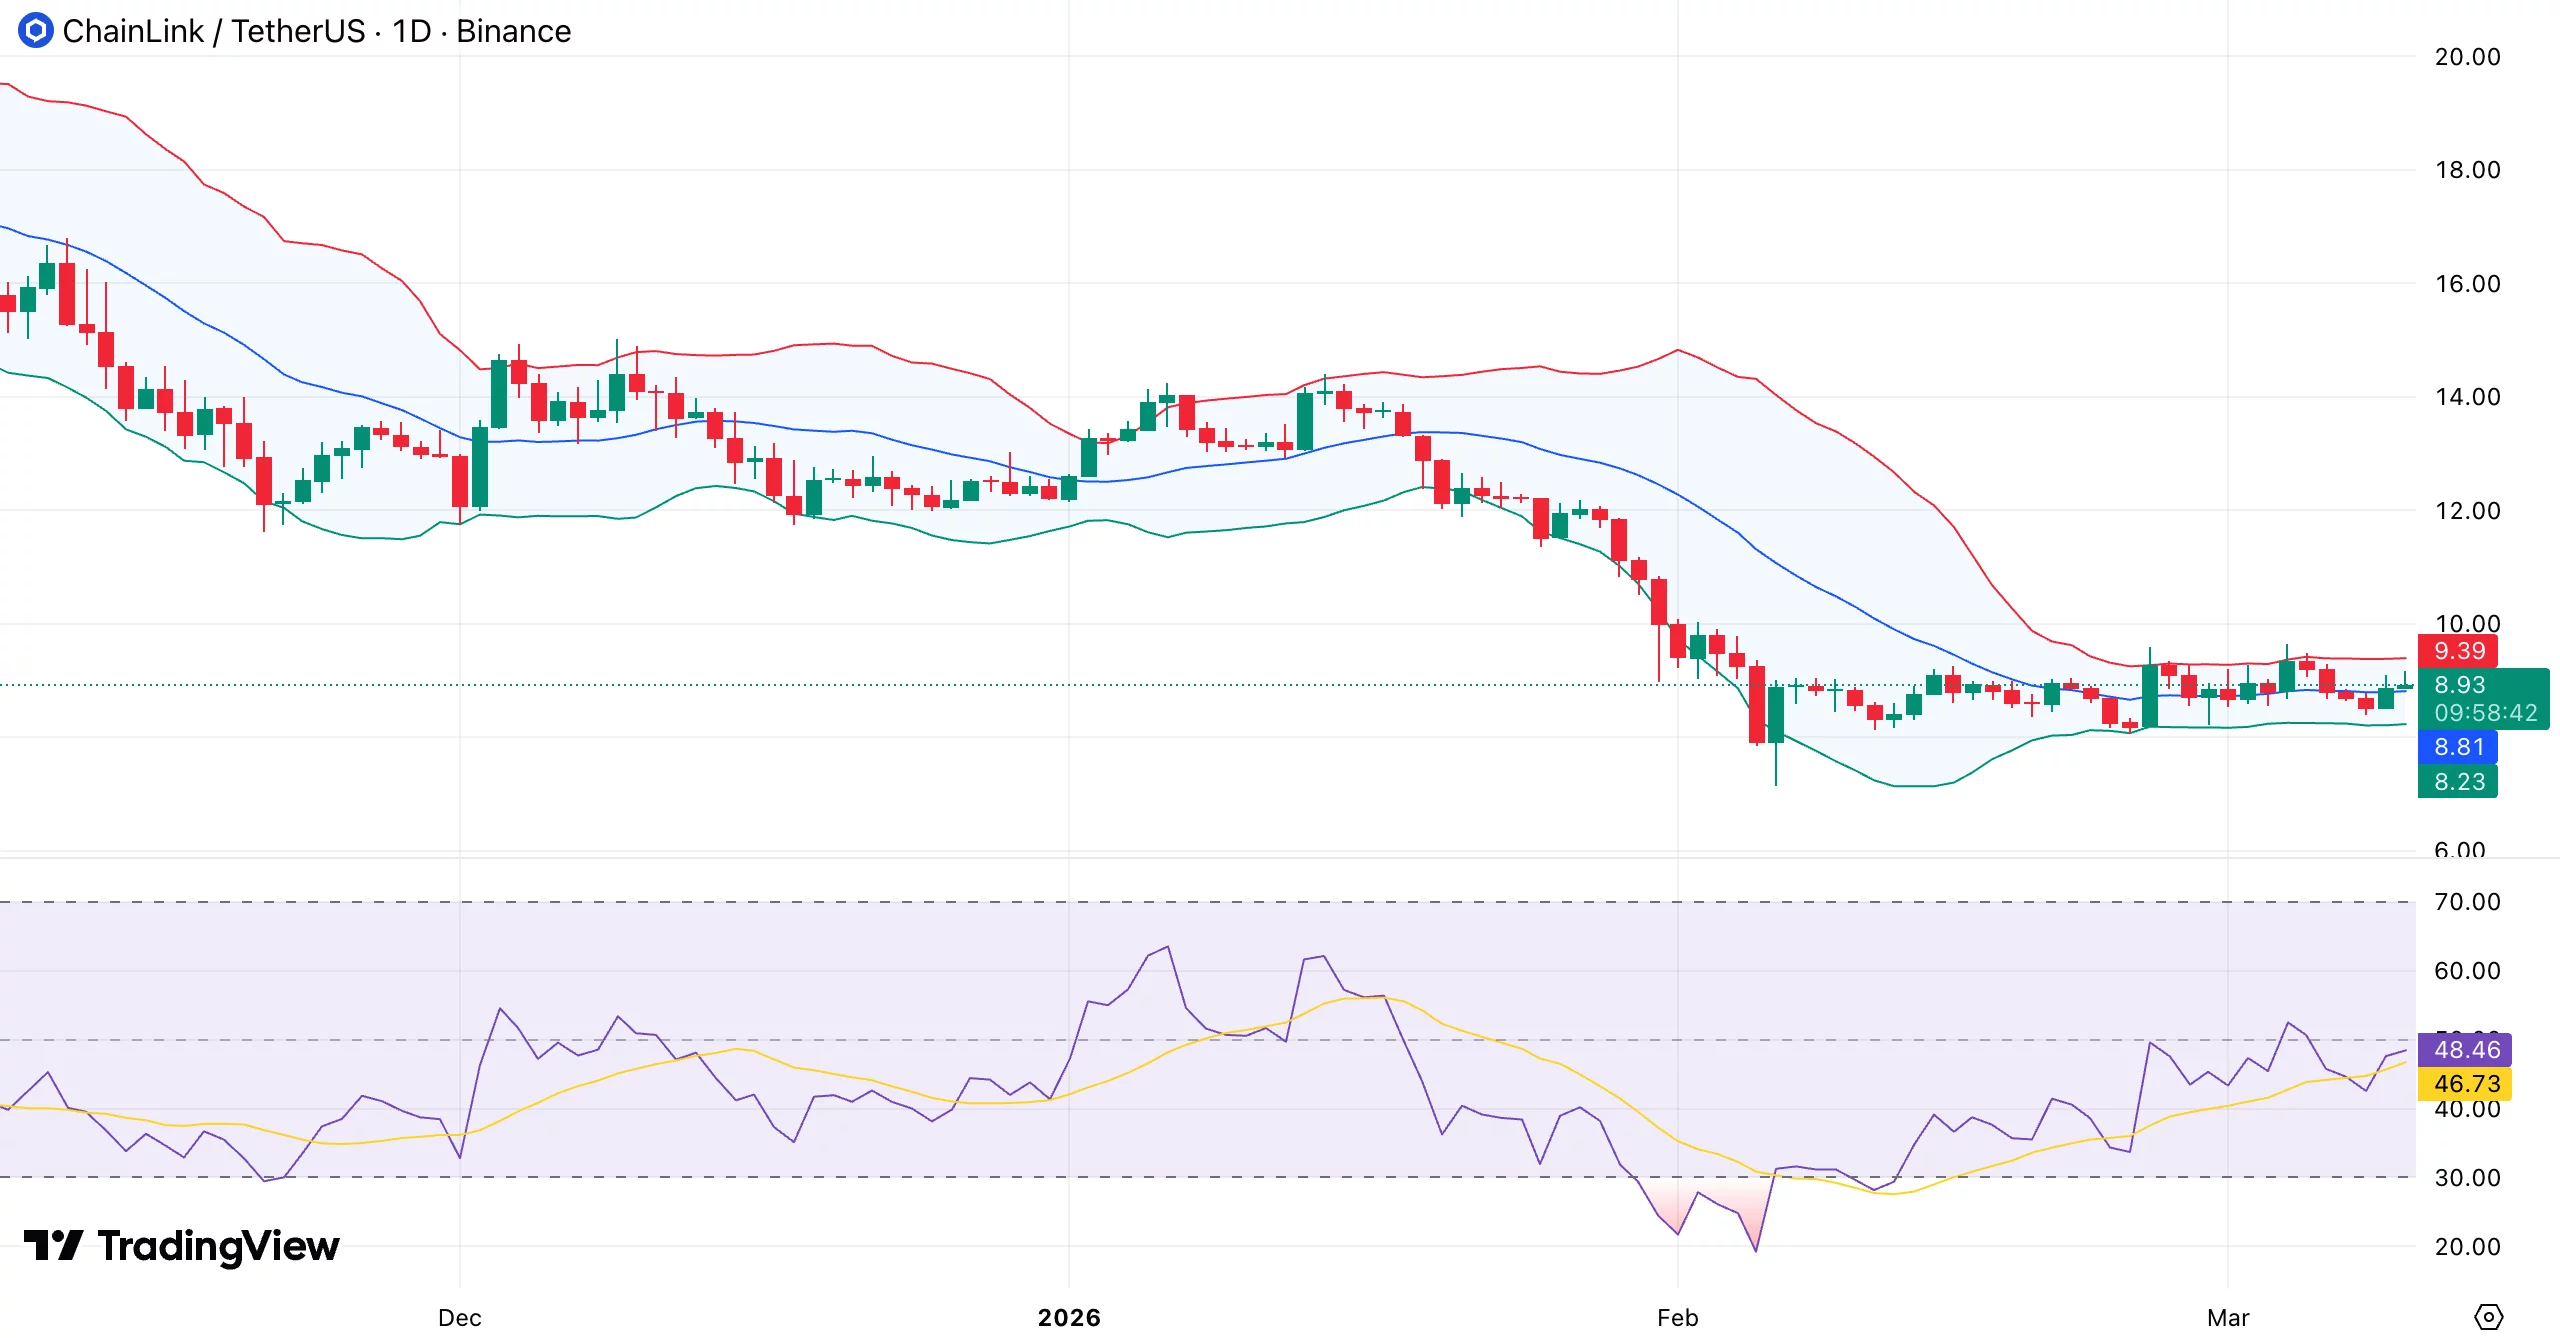
- Chainlink is trading at $8.94, moving within a tight weekly range between $8.52 and $9.55.
- Derivatives data shows futures volume falling while open interest holds steady, suggesting traders are keeping positions open during the consolidation.
- Technical indicators point to a volatility squeeze, with the $10 level acting as the key breakout zone.
At press time, Chainlink (LINK) was priced at $8.94, up 1.2% in the past 24 hours. Over the past week, the token moved between $8.52 and $9.55 as price action settled after the steep drop earlier this year.
Chainlink is still down about 42% over the past year, though the latest rebound has helped narrow the monthly decline to around 0.8%.
Trading activity eased during the recent sideways move. Daily volume came in at $494 million, a 7% drop from the previous session. Lower volume often appears when the market pauses and traders wait for the next clear move.
CoinGlass data shows only small changes in derivatives markets. Futures volume slipped, while open interest edged up 0.07% to $369.57 million. When price moves sideways and open interest barely changes, it usually means many traders are holding their positions instead of opening new ones.
Network growth continues in 2026
In early 2026, Chainlink has strengthened its place in the blockchain infrastructure market. A March 2 partnership set up a $5 billion cbBTC bridge to the Monad network, connecting the two systems. Another deal with Abu Dhabi’s ADI Foundation will explore tokenization projects in the Middle East.
Chainlink’s Cross-Chain Interoperability Protocol already links more than 75 blockchains, and more connections are being added to move data and assets between them.
Projects such as Injective EVM, Monad, and Perennial have adopted the system, while 11 additional chains, including ADI Chain, Arc, and Base, were recently added.
Traditional finance firms are also experimenting with Chainlink’s infrastructure. Institutions including SWIFT, UBS, and the Bank of England have worked with the network on tokenization pilots tied to the Canton Network, which targets as much as $8 trillion in real-world assets.
Chainlink currently controls about 64% of the oracle market, with over $41 billion in total value secured. The network has secured more than $100 billion in assets and processed roughly $27.3 trillion in total value executed by late 2025.
Institutional interest has increased as well. Even during more periods of outflows in the cryptocurrency market, Grayscale’s LINK ETF, launched in December 2025, reported consistent weekly inflows.
Chainlink has earned SOC 2 and ISO 27001 certifications, which are often required by institutional partners. To make the token more useful, the network is running a $644 million buyback program and working with S&P Global to evaluate stablecoins on-chain.
Chainlink price technical analysis
Chainlink is entering a period of low volatility, known as a volatility squeeze, when price movement tightens before a bigger move. The Bollinger Bands are narrowing, showing that volatility is decreasing.
LINK is trading near the middle band, indicating short-term momentum is neutral.

Traders are focusing on $10, which has acted as resistance in recent attempts to move higher. A daily close above $10 could signal a breakout, potentially turning this level into support and opening the way toward $11 to $12.
On the downside, $8.8 to $9.0 is the main support zone. If the price falls below $8.8, the $8.2 to $8.0 range may be tested.
Momentum indicators suggest the market is stabilizing. The relative strength index is around 45–50, meaning selling pressure has eased, but buyers have not yet gained control.
If LINK moves above $10, targets could include $10.8, $11.5, and $12. If it fails to break $10, the token may remain in its current range.


The Ethereum Foundation is testing a method for running validators that could make it significantly easier for institutions holding large amounts of ether to set up staking infrastructure, widening the pool of participants and creating a more decentralized network.
In a post on X, blockchain co-founder Vitalik Buterin said the foundation is using a simplified version of distributed validator technology, or “DVT-lite,” to stake 72,000 ETH. The experiment aims to make running validators across multiple machines less complicated.
Buterin said the goal is to reduce the process to something close to a one-click setup, where operators choose which computers will run validator nodes, launch the software and enter the same key on each machine. The system would then automatically connect the nodes and begin staking.
“My hope for this project is that we can make it maximally easy and one-click to do distributed staking for institutions,” Buterin wrote.
Running Ethereum validators today typically means operating a single node that holds the key used to sign blocks and participate in the network. If that machine fails or goes offline, the validator can stop working and may be penalized.
Distributed validator technology (DVT) changes that by allowing multiple independent machines to collectively act as a single validator. Instead of relying on one key and one computer, several nodes work together and only a handful of them sign for the validator to function. That means the validator can keep operating even if some machines go down.
But existing DVT systems can be complicated to deploy because operators must coordinate networking, keys and communication between nodes. Buterin has previously argued that complexity is one reason large staking providers have come to dominate the ecosystem.
The “DVT-lite” setup aims to automate much of that process, making it easier for institutions to run distributed validators with minimal infrastructure expertise.
Buterin said he plans to use the system himself and hopes large ETH holders will adopt similar setups, helping spread control of Ethereum’s staking infrastructure across more operators rather than concentrating it among a handful of professional providers.
“The idea that ‘running infrastructure’ is this scary, complicated thing where each person participating must be a ‘professional’ is awful and anti-decentralization, and we must attack it directly,” he wrote.
Read more: Vitalik Buterin proposes simpler ‘distributed validator’ staking for Ethereum
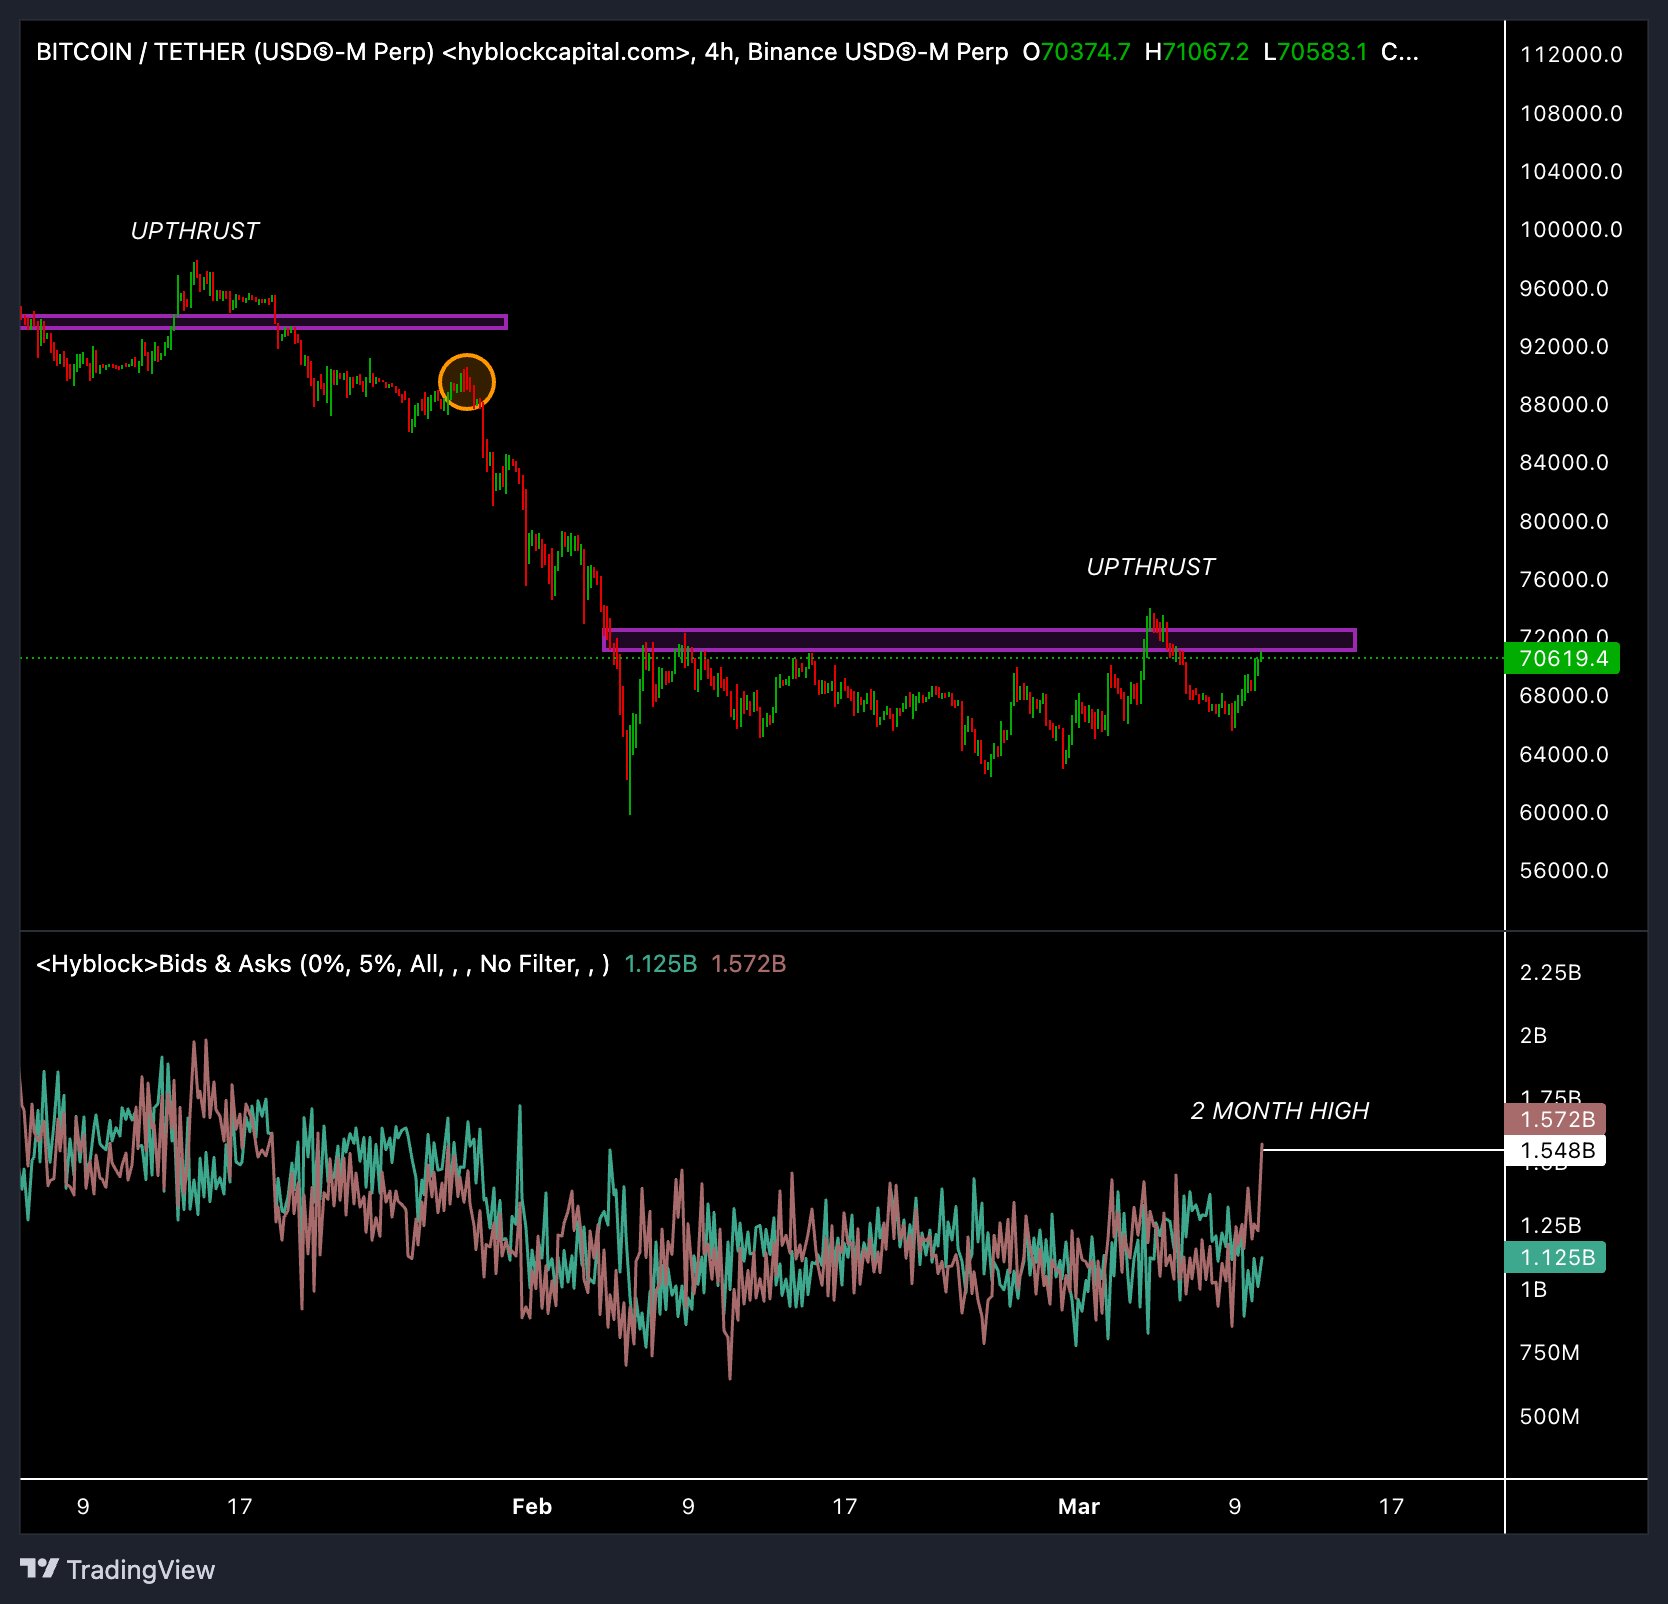
Bitcoin (BTC) appears to have reclaimed $70,000 as support, although the market remains cautious as technical charts indicate a setup resembling the bull trap that occurred in January 2026.
Bitcoin’s sell-side liquidity has expanded sharply during the latest range retest. According to crypto trader Ardi, Bitcoin ask orders reached a two-month high. The trader said,
“Asks on Bitcoin just hit a 2-month high. $1.57B in sell-side liquidity stacked above price vs $1.125B in bids below.”

Within a 5% band around the spot price, the sell orders exceed demand by roughly 40%, creating a heavier supply layer above the market price. At the same time, the bids form a thinner support cushion below BTC price.
Ardi noted the last comparable setup occurred in January after Bitcoin briefly broke above $98,000. A similar sequence followed Bitcoin’s recent move above $72,000 before the price slipped back toward the middle of its range. Elevated ask liquidity during a retest often signals that traders are using rebounds to take profit.
Another positioning metric also turned in the same direction. The 30-day moving average of Bitcoin’s net taker volume remained positive at $83 million in March, indicating increased buying activity through market orders.

Related: Bitcoin price analysis warns of potential dip after $72K liquidity sweep
Will BTC’s underwater supply cap its rebound?
Bitcoin short-term holders’ (STHs) cost-basis data shows the average holder entered the market at significantly higher prices. The STH realized price, which tracks the average acquisition price of coins held for under six months, sits near $88,900.
According to Bitcoin researcher Axel Adler Jr., the largest supply cluster lies between $86,000 and $99,000, where many coins were accumulated between November 2025 and February 2026. This range forms the main breakeven area for a large share of the short-term market, making it a key market inflection zone.
On the positive side, realized profit and loss data shows selling pressure has begun to reduce. Crypto analyst Darkfost noted about $611 million in realized losses against $346 million in profit last week, bringing net weekly profit-and-loss to -$264 million.
That figure is far lower than the $2 billion weekly loss recorded during the February drop below $60,000.

Compared with January’s retest, Bitcoin price currently sits much further below the main short-term cost-basis cluster. That distance limits the amount of breakeven selling that typically appears during smaller rallies.
As a result, many short-term holders may prefer to wait for higher prices, potentially closer to $86,000, rather than selling at a loss after holding through a month-long consolidation.
A move back above the $70,000 to $72,000 range eases part of the near-term selling pressure, but a more meaningful shift may require Bitcoin to reclaim the $86,000 to $89,000 range, where most of the short-term holders reach breakeven.
Related: Strategy records biggest STRC issuance day with estimated 1,420 BTC buy
This article does not contain investment advice or recommendations. Every investment and trading move involves risk, and readers should conduct their own research when making a decision. While we strive to provide accurate and timely information, Cointelegraph does not guarantee the accuracy, completeness, or reliability of any information in this article. This article may contain forward-looking statements that are subject to risks and uncertainties. Cointelegraph will not be liable for any loss or damage arising from your reliance on this information.
Crypto World
Circle (CRCL) may rally another 60% driven by stablecoin adoption, AI agentic finance: Bernstein


Shares of Circle (CRCL), the crypto firm behind the USDC (USDC) stablecoin, could add to their recent remarkable surge, according to analysts at brokerage Bernstein.
The team, led by Gautam Chhugani, rate the stock at outperform with a $190 price target, suggesting about 60% upside from current $120 level. And that’s after the stock rallied more than 100% in the past few weeks following an earnings beat, which likely triggered a short squeeze.
Bernstein’s thesis centers on stablecoin adoption increasingly diverging from the broader crypto market.
Circle’s USDC supply briefly fell after the October liquidity shock in crypto markets but has since rebounded to just shy of its record $78 billion, even as bitcoin and the broader crypto markets remain well below its highs. The total market for U.S. dollar-backed stablecoins also remained steady at around $270 billion despite the crypto bear market, the report noted.
Transaction activity is accelerating as well, the report noted. Adjusted stablecoin volumes grew more than 90% year-over-year, while transaction velocity — a measure of how frequently tokens change hands — has increased, suggesting stablecoins are increasingly used beyond crypto trading.
Payments adoption is a key driver behind that, Bernstein said, as stablecoins are increasingly getting embedded with traditional card networks, enabling everyday transactions. Visa (V), for example, now supports more than 130 such stablecoin-linked cards across 50 countries, processing roughly $4.6 billion in annualized settlement volume, the report noted.
Circle is also expanding its Circle Payments Network, which allows institutions to send USDC cross-border and convert it into local currencies through banking partners. The network now includes about 55 institutions, with annualized volumes reaching $5.7 billion earlier this year, the report said.
Looking ahead, Bernstein also highlighted a potential new growth theme: AI-driven “agentic finance.” As autonomous software agents increasingly transact online, stablecoins could become a natural payment rail for micropayments between machines, such as for API calls or automated services.
To support that vision, Circle is building a high-throughput, payments-focused blockchain called Arc, designed for fast, low-cost transactions.
Read more: Why Circle and Stripe (And Many Others) Are Launching Their Own Blockchains
Crypto World
Polymarket and Palantir team up to protect the integrity of sports betting as prediction platforms face a make-or-break moment


Prediction market platform Polymarket has teamed up with Palantir and TWG AI to build a monitoring system designed to detect suspicious trading and manipulation in sports prediction markets, a move that reflects growing pressure on the fast-growing sector to establish credibility.
The new system will use Palantir’s data infrastructure and TWG AI’s analytics to monitor trading activity across Polymarket markets. The companies say the platform will detect unusual trading patterns, screen participants and generate compliance reports that could be shared with regulators or sports leagues.
Polymarket founder and CEO Shayne Coplan said the goal is to bring “world-class analytics and monitoring to sports markets” while helping leagues and teams maintain confidence in the integrity of games.
The effort reflects a broader challenge facing prediction markets as they move from niche crypto experiments to platforms that increasingly influence public discussion about elections, economics and sports.
Prediction markets allow users to trade contracts tied to the outcome of real-world events. Because participants put money behind their views, proponents argue the markets can aggregate information efficiently and produce accurate forecasts.
But that same structure creates risks.
Prediction markets have faced criticism in recent years over the possibility that traders with inside knowledge could profit from events before the public becomes aware of them. Markets have emerged around sensitive topics such as policy decisions, military actions, labor strikes and political pardons, raising questions about whether participants might be trading on privileged information.
Carlos Pereira, a general partner at BITKRAFT Ventures, which manages more than $1 billion across investments in gaming, AI and digital assets, said those concerns could become a serious obstacle for the industry if they are not addressed.
“There has been what seems to be insider trading,” he said. “When you have a market that is new and by consequence a little bit fragile, making the news in negative ways can be dangerous.”
The monitoring system Polymarket is building resembles the kind of surveillance infrastructure used by traditional financial exchanges. According to the company, it will track trading before and after orders are placed, flag coordinated activity and identify traders who may be prohibited from participating.
For prediction market operators, the stakes are partly regulatory. Formal insider trading rules for these markets remain unclear in many jurisdictions, particularly in the U.S., where regulators are still debating how to classify them.
Efforts to strengthen monitoring could help the industry demonstrate that it can police itself.
Absent those safeguards, Pereira said regulators may feel pressure to intervene more aggressively.
“If markets don’t show they are trying to manage insider trading,” he said, “the odds of regulation becoming harsher and tapering growth would be much higher.”


Calling the U.S. the “crypto capital of the world,” Commodity Futures Trading Commission (CFTC) Chairman Mike Selig updated his agency’s ongoing plans to provide long-awaited regulatory clarity for decentralized finance (DeFi) developers, crypto derivatives and prediction markets.
Speaking this week at the FIA Global Cleared Markets Conference in Boca Raton, Florida, Selig said the U.S. is reclaiming leadership in digital assets through closer coordination between regulators. He said he and the Securities and Exchange Commission (SEC) Chairman Paul Atkins have put an “end to the days of CFTC-SEC infighting by partnering on the Project Crypto initiative.”
During his speech, Selig reiterated the CFTC will issue guidance to clarify how prediction markets, known as event contracts in regulation, can list and trade products under U.S. law and will launch a rulemaking process seeking public input on how the fast-growing sector should be overseen. Prediction markets are no longer a niche and have become a fast-growing ecosystem of trading platforms that allow users to trade contracts tied to elections, economic outcomes and real-world events.
Selig said that because “market participants deserve clarity” the agency intends to assert a more active role in regulating these markets and defending its authority over them amid ongoing legal challenges from several U.S. states. He repeated his sentiment from last month that the CFTC must be seen as the regulator for these markets, and he “will continue to assess litigation strategies to make sure the agency’s voice is heard.”
DeFi developers and crypto derivatives
The CFTC, he said, also plans to address one of the crypto industry’s most contentious regulatory questions: “For too long, there has been an open question as to whether software providers trigger the CFTC’s registration requirements,” Selig said. “We intend to address this question head-on.”
The agency is also analyzing how U.S. law should treat several crypto trading structures that have historically operated in regulatory gray areas, including leveraged crypto spot trading and standards for margined spot trading on exchanges. Previous Acting Chairman Caroline Pham got started last year on erasing old guidance on “actual delivery” standards from President Donald Trump’s first term so the regulator could write something friendlier to the industry spot-market practices.
The agency has also been addressing the classification of crypto perpetual derivatives, a dominant product in global crypto markets.
Read More: CFTC chief Selig to clear path for U.S. perpetual futures in coming weeks
The CFTC chairman also pointed to the rise of artificial intelligence (AI) and automated trading systems across digital markets and the need for regulatory frameworks that support innovation in these technologies.
Selig’s comments echo recent statements by NEAR co-founder Illia Polosukhin, who said AI agents will soon be the primary blockchain users, and Coinbase CEO Brian Armstrong, who wrote on X that “very soon there are going to be more AI agents than humans making transactions.”


A U.S. federal prosecutor has requested to retry the co-founder of the privacy-focused crypto protocol months after he received a mixed verdict.
A United States federal prosecutor has requested to retry Roman Storm, the co-founder of decentralized cryptocurrency mixer protocol Tornado Cash, according to court documents submitted on March 9.
In a letter to U.S. district judge of the District Court for the Southern District of New York, Katherine Polk Failla, U.S. Attorney Jay Clayton said the government wants to retry Storm on two charges.
Back during his highly publicized trial this summer, Storm received a guilty verdict on the lesser of the three charges brought against him — operating an unlicensed money-transmitting business. But the jury was unable to come to a verdict on the other two, namely violating U.S. sanctions and engaging in money laundering.
The U.S. Attorney said in the retrial request that he expects the trial on the two remaining counts to take three weeks, and asks that it begin in October of this year.
Storm took to X today in response to the retrial request, writing:
“A jury of 12 Americans heard 4 weeks of evidence and deadlocked: no verdict on money laundering, and no verdict on sanctions violations. The government’s response? Try again to make writing code a crime.”
Storm also noted in his X post that if found guilty on the two counts, he could face up to 40 years in prison. He also referenced recent regulatory shifts in the U.S. that have come out in defense of decentralized protocol developers.
Specifically, he noted, a new report from the U.S. Department of the Treasury to Congress this week states, “Lawful users of digital assets may leverage mixers to enable financial privacy when transacting through public blockchains.”
Also noted by Storm in today’s X post, last March, the U.S. Treasury removed Tornado Cash from its list of sanctioned entities, as The Defiant reported at the time. The protocol had been banned in the U.S. since 2022.
The US v Roman Storm
Tornado Cash is a non-custodial protocol that lets users anonymize their transactions on multiple Ethereum Virtual Machine-compatible blockchains. The platform and Storm personally have received overwhelming support from the crypto industry for their focus on privacy throughout a multi-year legal battle with the U.S. government.
Storm was first indicted by the U.S. government in August 2023. The U.S. Department of Justice alleged that Storm and his fellow co-founder Roman Semenov were aware of the platform’s usage by criminal organizations for laundering illicit funds, and claimed that the two are responsible for more than $1 billion in laundered crypto.
Prosecutors also alleged that the two developers in some cases helped launder funds, “including by laundering hundreds of millions of dollars on behalf of a state-sponsored North Korean cybercrime group sanctioned by the U.S. government,” referring to the notorious Lazarus Group.
Semenov has yet to face trial for the alleged charges, and remains on the FBI’s wanted list since 2023, when the indictment came out and a federal warrant for his arrest was issued.
In a motion to dismiss filed by Storm’s lawyers in 2024, the developer pleaded not guilty, and argued that he “is a developer, and his only agreement, together with the members of his U.S.-based company, was to build software solutions to provide financial privacy to legitimate cryptocurrency users.”
As the Defiant previously reported, the outcome of Storm’s legal battle could significantly influence the future of DeFi, especially in the U.S., and set a precedent for how responsible DeFi developers are for how users interact with protocols.
Last February, the third founding developer of Tornado Cash, Alexey Pertsev was released from prison to house arrest in the Netherlands, where is serving an over five year sentence for money laundering related to Tornado Cash. He was arrest in 2022 and found guilty in 2024. After his most recent attempt to appeal the decision in June, Pertsev was allowed to remove his ankle monitor, though his movement remains resitricted to The Netherlans and he is unable to work, per an X post from the dev in October.
In November of last year, the two co-founders of another crypto mixer protocol, Samourai Wallet, were found guilty in a U.S. federal court of “a conspiracy to operate a money transmitting business in which they knowingly transmitted criminal proceeds.”
Samourai Wallet’s Keonne Rodriguez and William Lonergan Hill were sentenced to five and four years in prison, respectively.
This article was generated with the assistance of AI workflows.


The report notes that AI, digital identity systems, blockchain analytics, and APIs can be harnessed to fight financial crime.
The U.S. Department of the Treasury has submitted a report to Congress examining how emerging technologies can be used to detect and prevent illicit financial activity involving digital assets. The report was required under the Guiding and Establishing National Innovation for U.S. Stablecoins (GENIUS) Act, signed into law in July 2025.
The report notes that victims reported over $9 billion in digital asset-related fraud losses to the FBI in 2024, with investment scams accounting for $5.8 billion, a 47 percent increase over the prior year. North Korean cybercriminals stole at least $2.8 billion in digital assets between January 2024 and September 2025, including $1.5 billion from Bybit in February 2025. Meanwhile, ransomware payments, predominantly made in digital assets, totaled approximately $734 million in 2024.
The report also examines the use of cryptocurrency mixers and similar obfuscation tools, finding that roughly $1.6 billion in deposits to major cross-chain bridges between 2020 and 2025 originated from mixing services.
To address these risks, Treasury identified four key technologies for broader adoption by financial institutions: artificial intelligence for transaction monitoring and fraud detection; digital identity tools to reduce onboarding fraud; blockchain analytics to trace suspicious activity; and application programming interfaces (APIs) to improve interoperability across compliance systems.
On decentralized finance (DeFi), the report recommends that Congress clarify which DeFi participants should be subject to anti-money laundering obligations.
Treasury acknowledged barriers to adoption, including high costs for smaller institutions and regulatory uncertainty, and committed to issuing new guidance, partnering with NIST on technical standards, and pursuing legislative options, including potentially allowing institutions to temporarily freeze digital assets suspected of involvement in illegal activity.
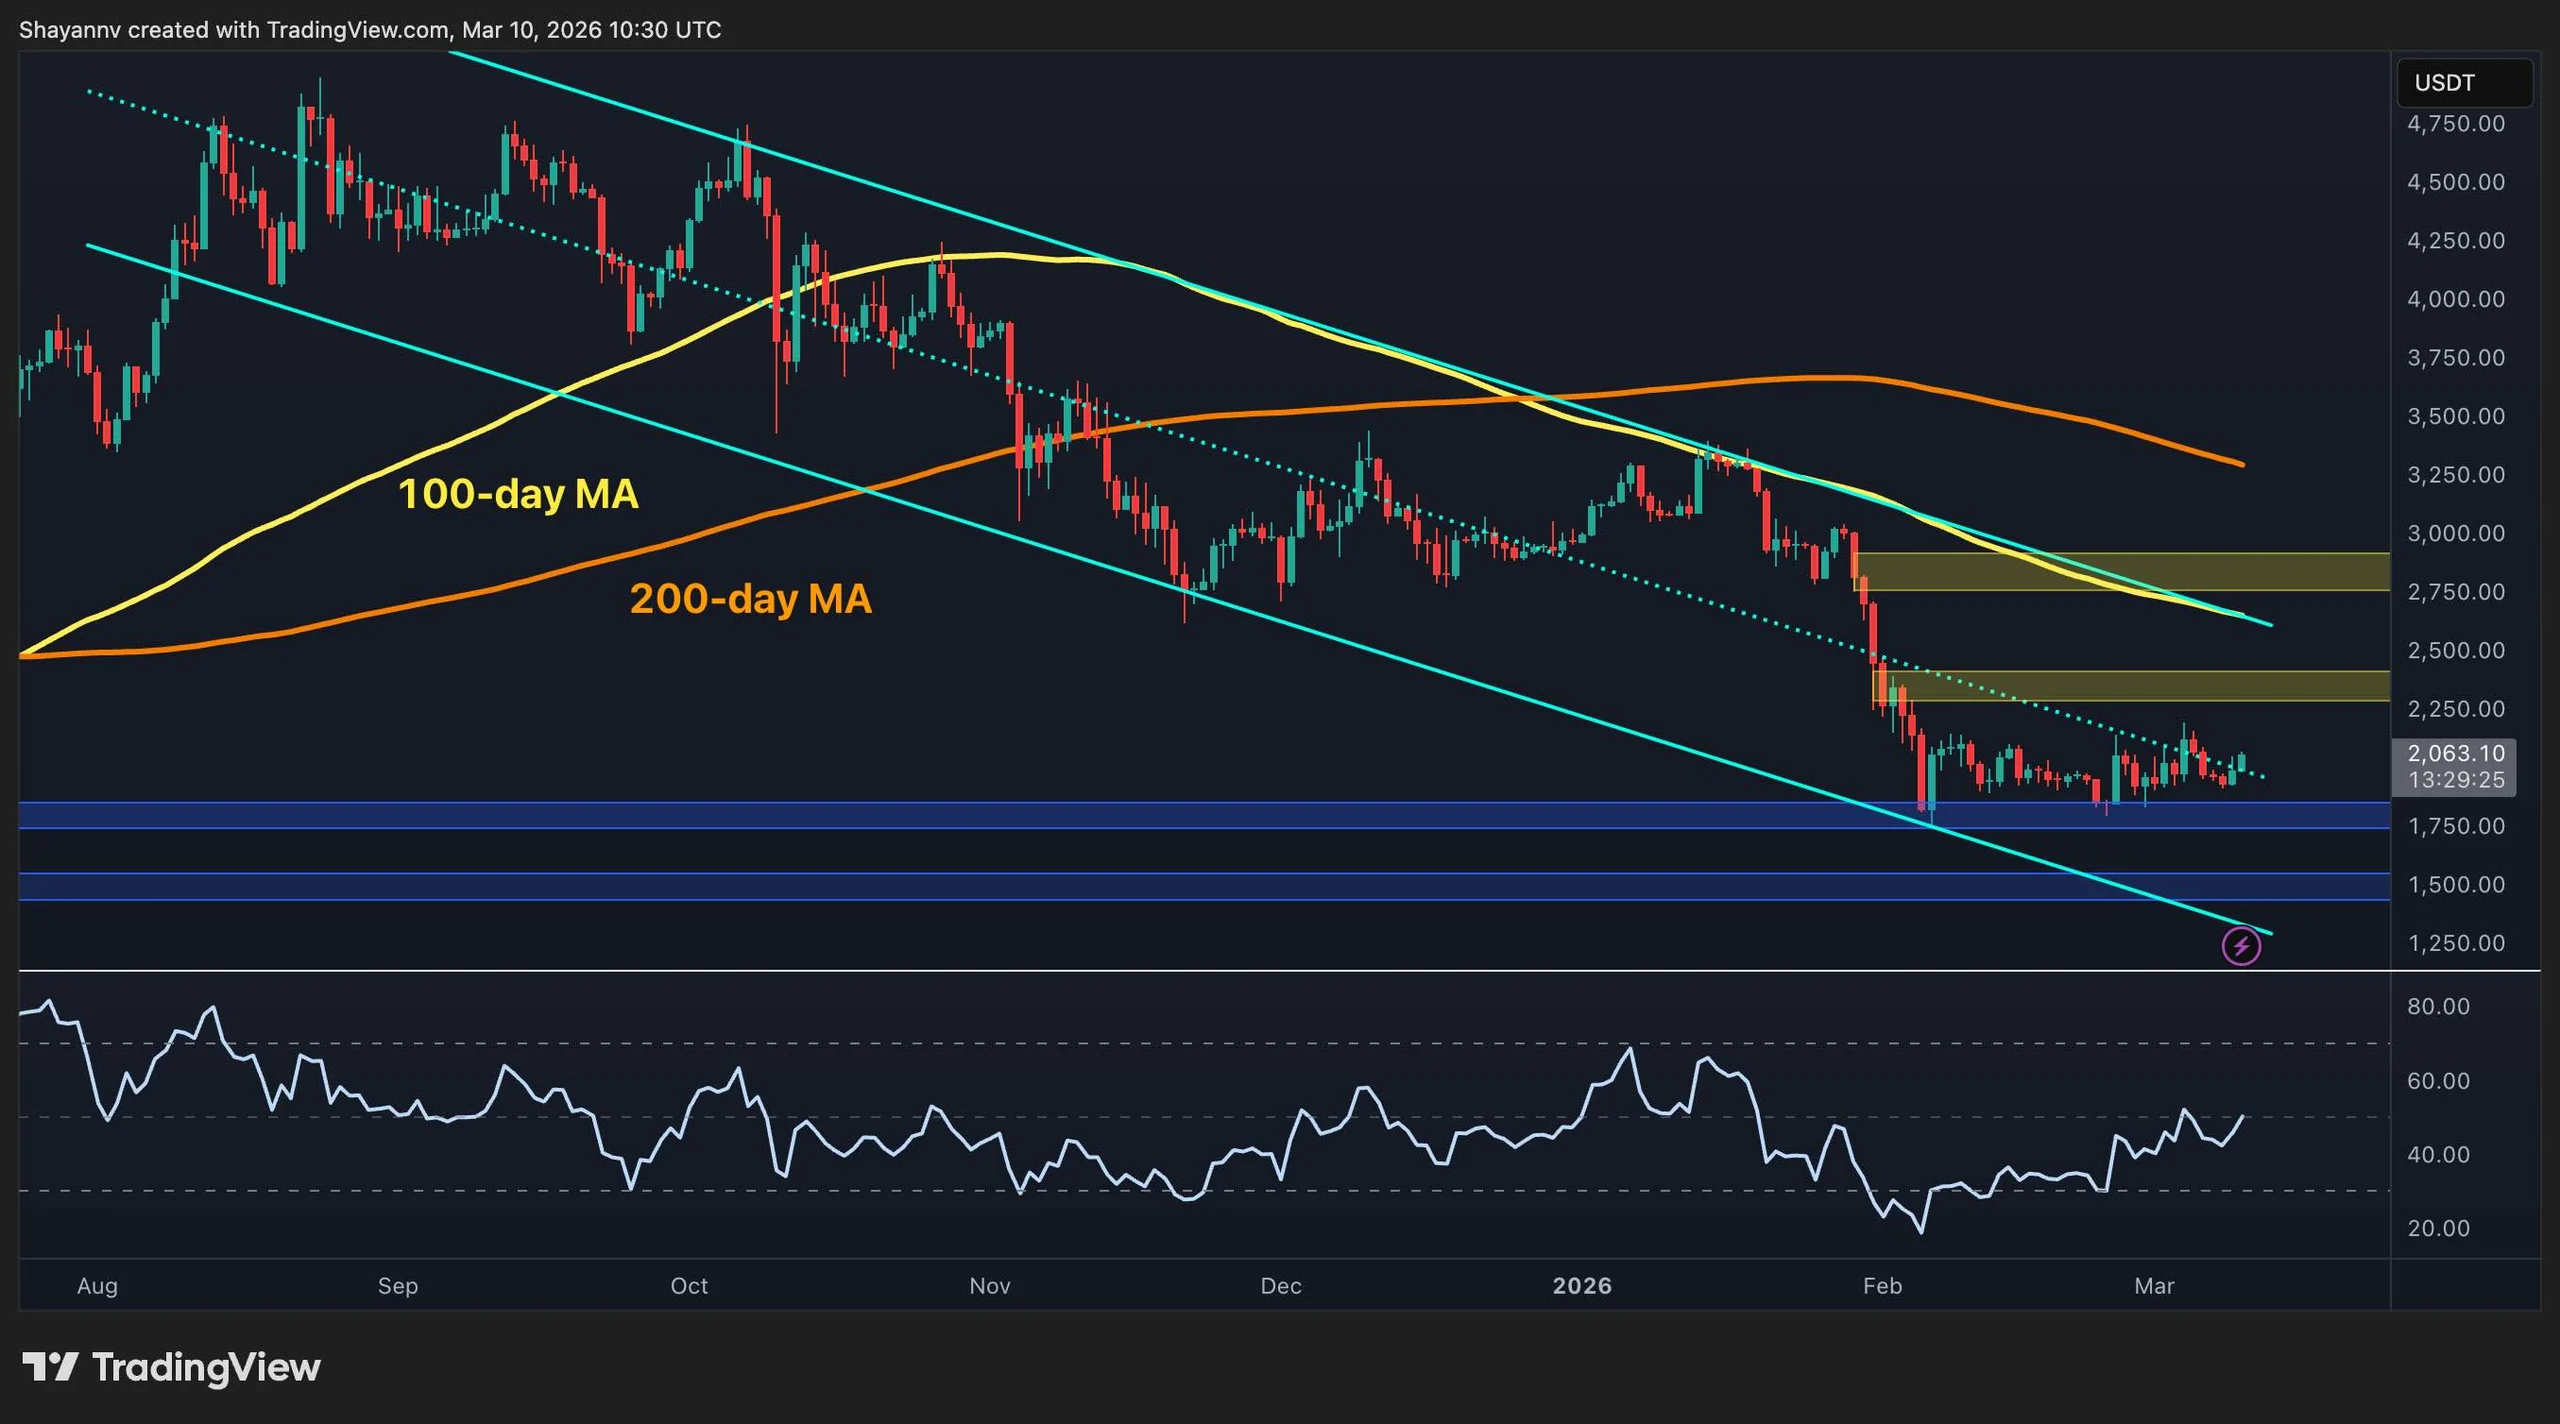
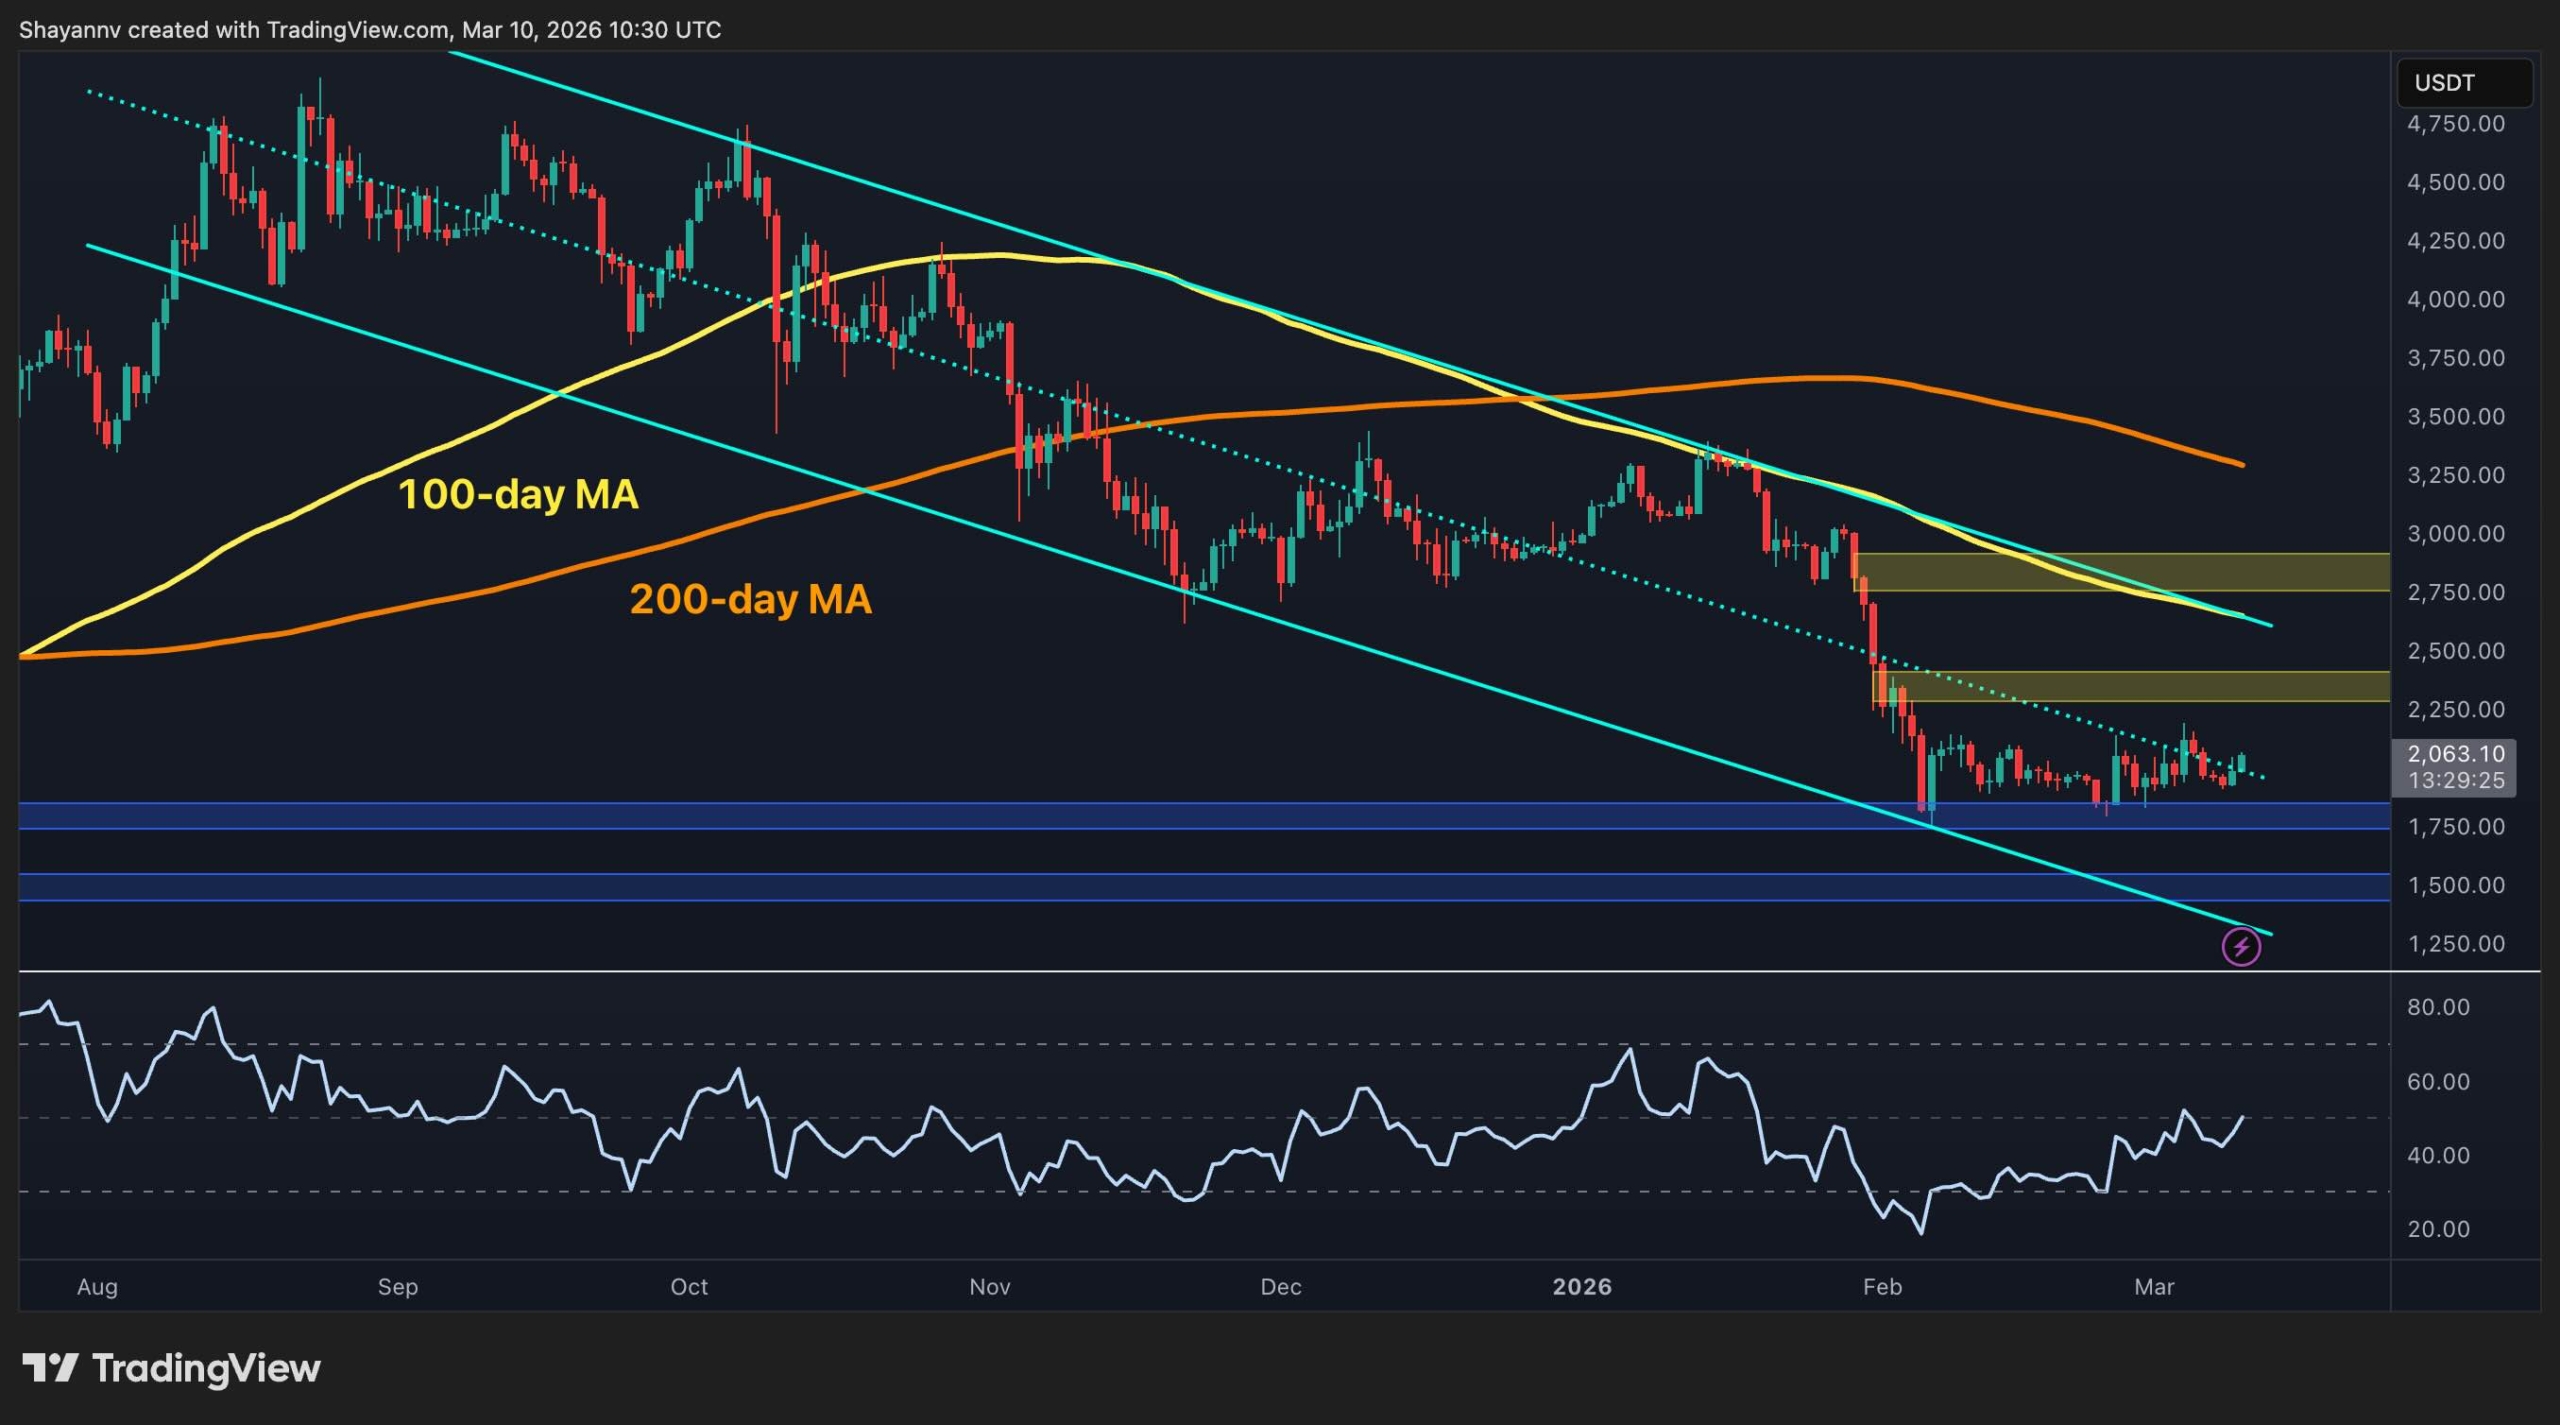
Ethereum is still trading within a broader bearish structure, but the recent price action shows signs of short-term stabilization above a key support zone. After the sharp selloff seen in early February, ETH has managed to base around the $1,800 area, and buyers are hoping for another push higher, although the market still needs a stronger breakout to confirm a more meaningful recovery.
Ethereum Price Analysis: The Daily Chart
On the daily chart, ETH remains below the 100-day and 200-day moving averages, which keeps the higher timeframe trend tilted to the downside. The asset is also still trading inside a descending channel, while the $2,400 and $2,800 zones continue to act as the main resistance barriers on any larger rebound.
At the same time, the market has been holding above the blue demand region around $1,800 to $1,700, which is currently the most important support range. As long as ETH stays above this area, the structure can remain constructive in the short term, but a daily reclaim of the $2,400 region is still needed to suggest that the broader bearish pressure is starting to weaken.
ETH/USDT 4-Hour Chart
On the 4-hour chart, ETH is gradually moving higher from the late February lows and is now pressing toward the $2,150 resistance level once again. The formation of a rising short-term trendline from the recent swing lows also points to improving momentum, while the RSI has pushed back above the midline and supports the case for a stronger recovery attempt.
Still, the price has not broken out yet, and the $2,150 level remains the key trigger in the near term. A clean move above it could open the way toward the $2,400 supply zone, while another rejection would likely keep ETH stuck inside its current range and send it back toward the $1,800 support levels.

On-Chain Analysis
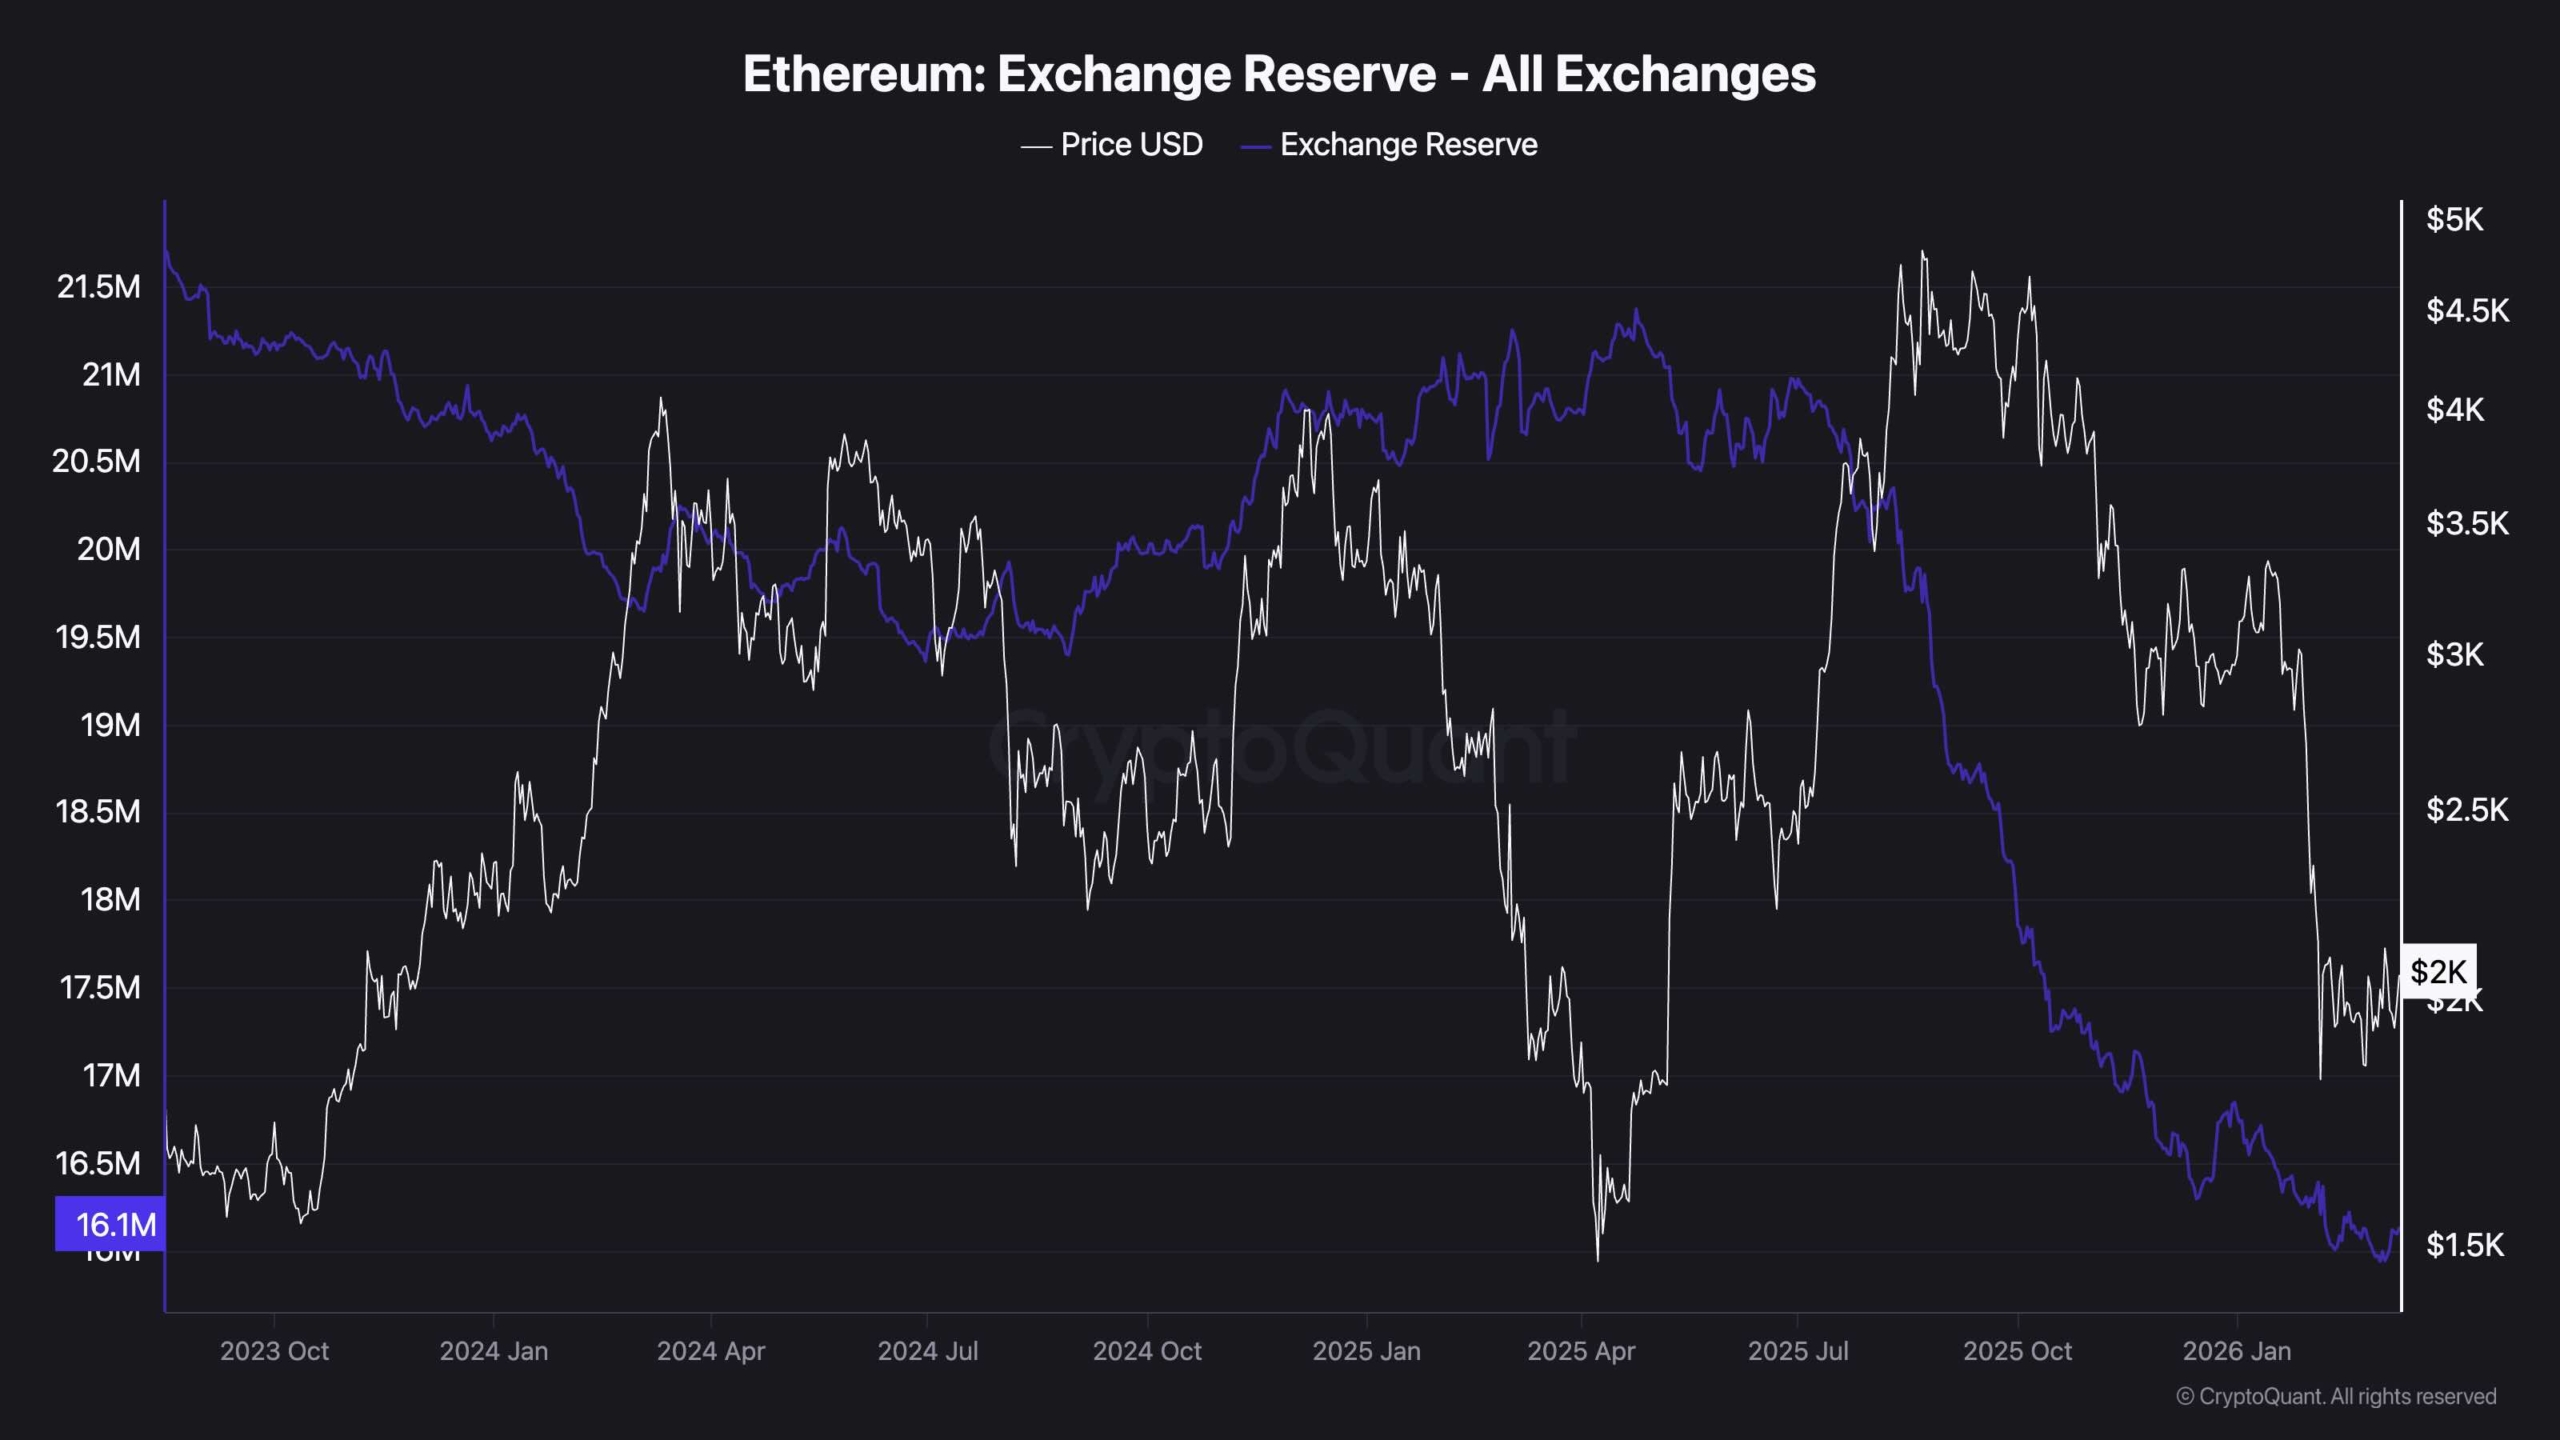
From an on-chain perspective, Ethereum’s exchange reserve continues to trend lower and has now dropped to around 16.1 million ETH, which is a notable long-term bullish signal. The persistent decline suggests that more coins are being moved away from exchanges, typically reflecting lower immediate sell pressure and a stronger preference for holding rather than distributing.
That said, the exchange reserve trend is a supportive background factor rather than a direct timing signal. In the short term, ETH still needs price confirmation through a breakout above nearby resistance, but the continued drawdown in exchange balances does strengthen the idea that downside pressure may be more limited than before if demand starts to improve.
Binance Free $600 (CryptoPotato Exclusive): Use this link to register a new account and receive $600 exclusive welcome offer on Binance (full details).
LIMITED OFFER for CryptoPotato readers at Bybit: Use this link to register and open a $500 FREE position on any coin!
Disclaimer: Information found on CryptoPotato is those of writers quoted. It does not represent the opinions of CryptoPotato on whether to buy, sell, or hold any investments. You are advised to conduct your own research before making any investment decisions. Use provided information at your own risk. See Disclaimer for more information.
Societe Generale-FORGE, the crypto arm of French banking company Societe Generale, has deployed its euro-denominated stablecoin on the Stellar blockchain, completing a multichain expansion first announced in 2025.
The stablecoin, known as EUR CoinVertible (EURCV), is designed to comply with the European Union’s Markets in Crypto-Assets (MiCA) framework and represents a tokenized euro issued by the company for use in digital asset markets.
According to the company, the Stellar deployment is intended to broaden the stablecoin’s use across blockchain-based financial applications and tokenized asset services.
SG-FORGE said Stellar offers high transaction throughput, low network fees and built-in support for tokenized assets. The network also includes a decentralized exchange that allows users to trade digital assets directly onchain.
Societe Generale-FORGE first launched the EUR CoinVertible (EURCV) stablecoin on Ethereum in April 2023. The stablecoin is fully backed by reserves consisting of bank deposits and high-quality liquid assets on a one-to-one basis, and has a current market cap of around $452 million, according to DefiLlama data.
The development comes weeks after SG-FORGE deployed EUR CoinVertible on the XRP Ledger, then marking the token’s third blockchain network after Ethereum (ETH) and Solana (SOL).
In January, the stablecoin was used by global banking network SWIFT in a pilot that demonstrated the exchange and settlement of tokenized bonds using both fiat and digital currencies.
Related: Stablecoin payments startup Kast raises $80M at $600M valuation: Report
European stablecoin push
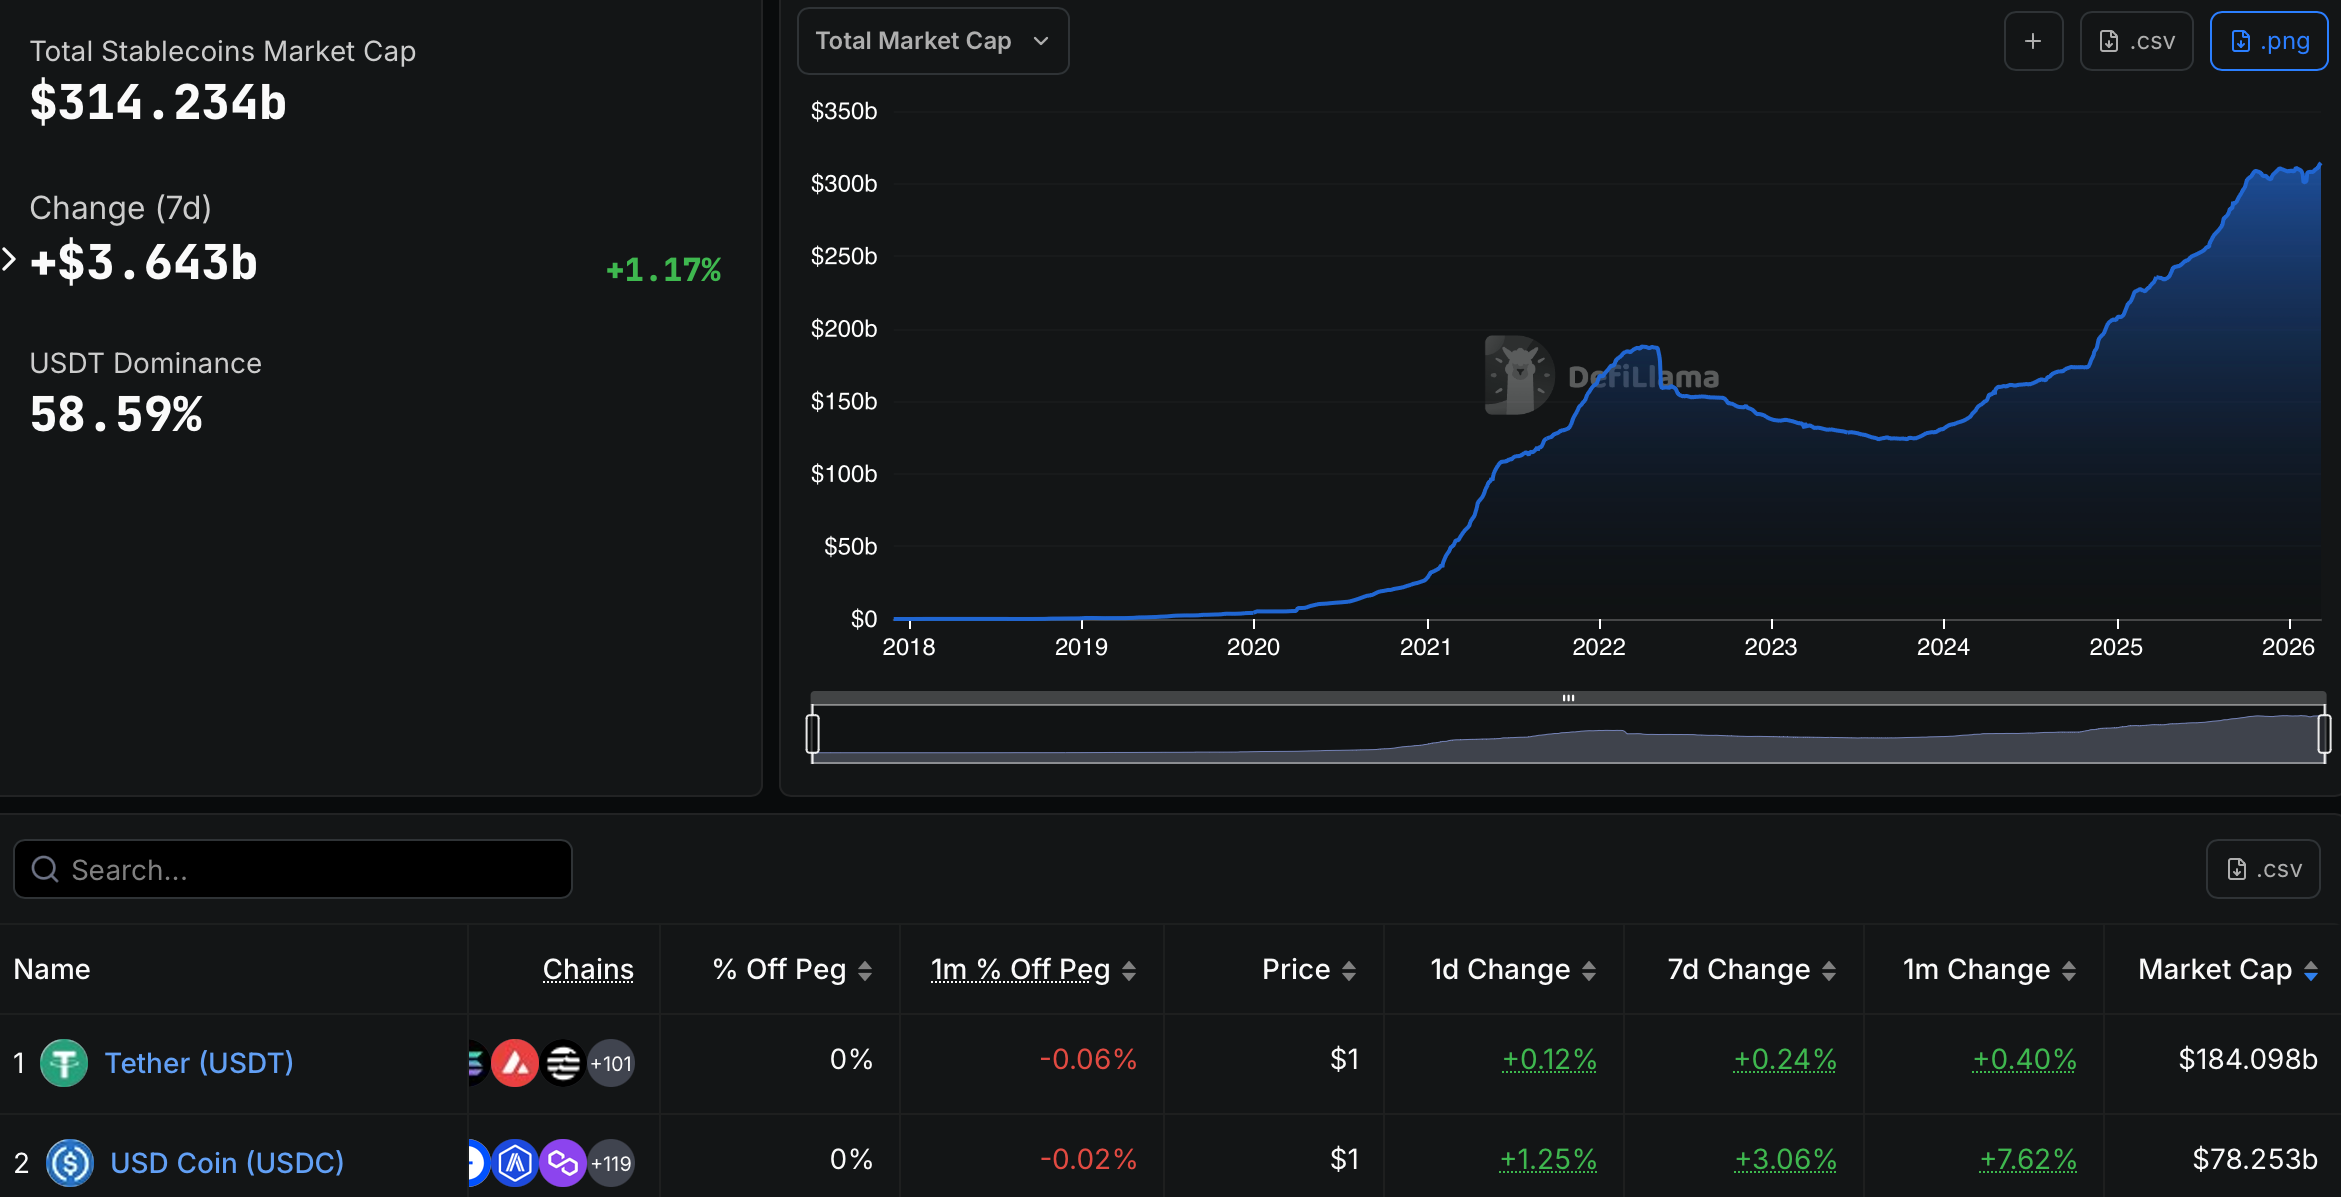
Despite growing interest in euro-denominated tokens, the stablecoin market remains dominated by US dollar-backed assets. Tether’s USDT (USDT) holds a market capitalization of about $185 billion, representing nearly 60% of the sector, while Circle’s USDC (USDC) accounts for roughly $78 billion.
Adoption of digital dollars accelerated in the US after the GENIUS Act passed in July 2025, providing regulatory clarity for stablecoin issuers. Total market capitalization has climbed from around $260 billion on July 20 to more than $314 billion today, per DefiLlama data.
Meanwhile, Europe has taken a more restrictive regulatory approach. The European Union’s MiCA framework introduced new rules for stablecoin issuers in June 2024, requiring companies operating in the European Economic Area to obtain an e-money license in at least one EU member state.

The regulation prompted several exchanges, including Coinbase, OKX, Bitstamp, Uphold and Binance, to remove or restrict support for stablecoins that had not secured authorization under the framework. Tether also decided it would discontinue its euro-pegged stablecoin EURT.
In November, European Central Bank officials warned that the growth of US dollar–backed stablecoins could weaken Europe’s monetary sovereignty by increasing reliance on dollar-denominated digital assets.
Magazine: The debate over Bitcoin’s four-year cycle is over: Benjamin Cowen
XRP remains under pressure on both the USDT and BTC pairs, with the broader trend still leaning bearish despite some short-term stabilization. Buyers are defending key support zones for now, but the asset still trades below major resistance levels and has yet to show a convincing trend reversal.
Ripple Price Analysis: The USDT Pair
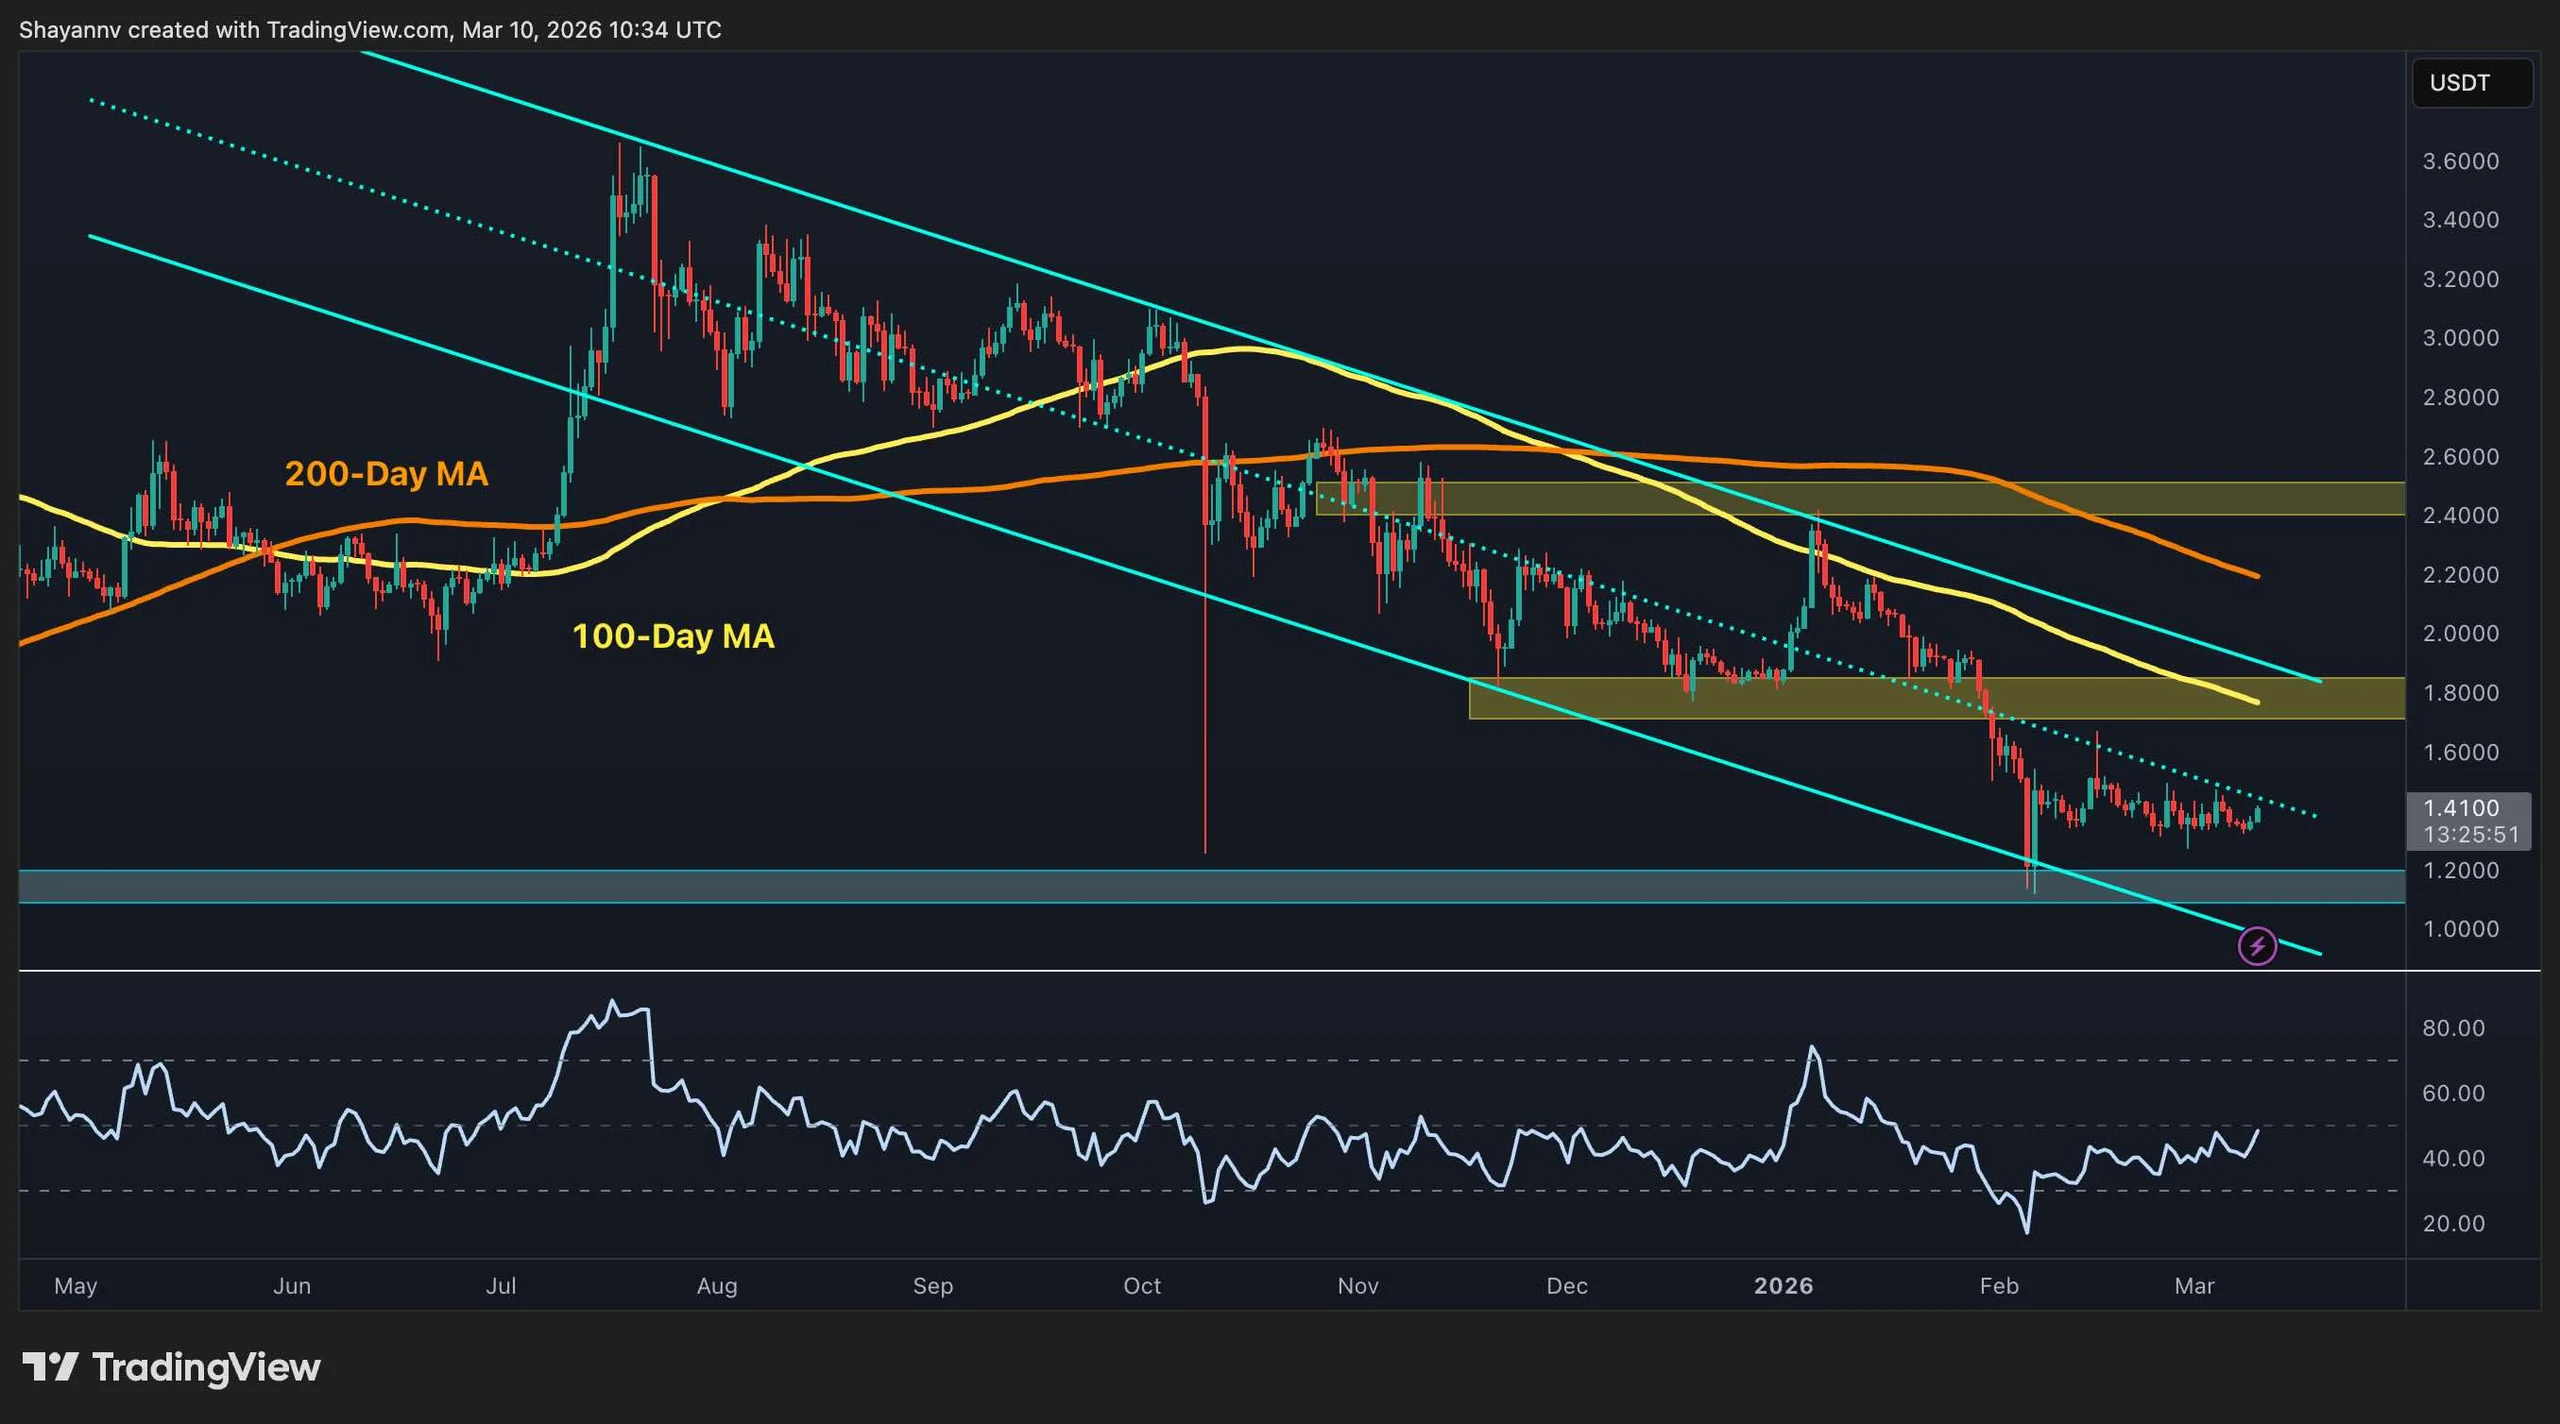
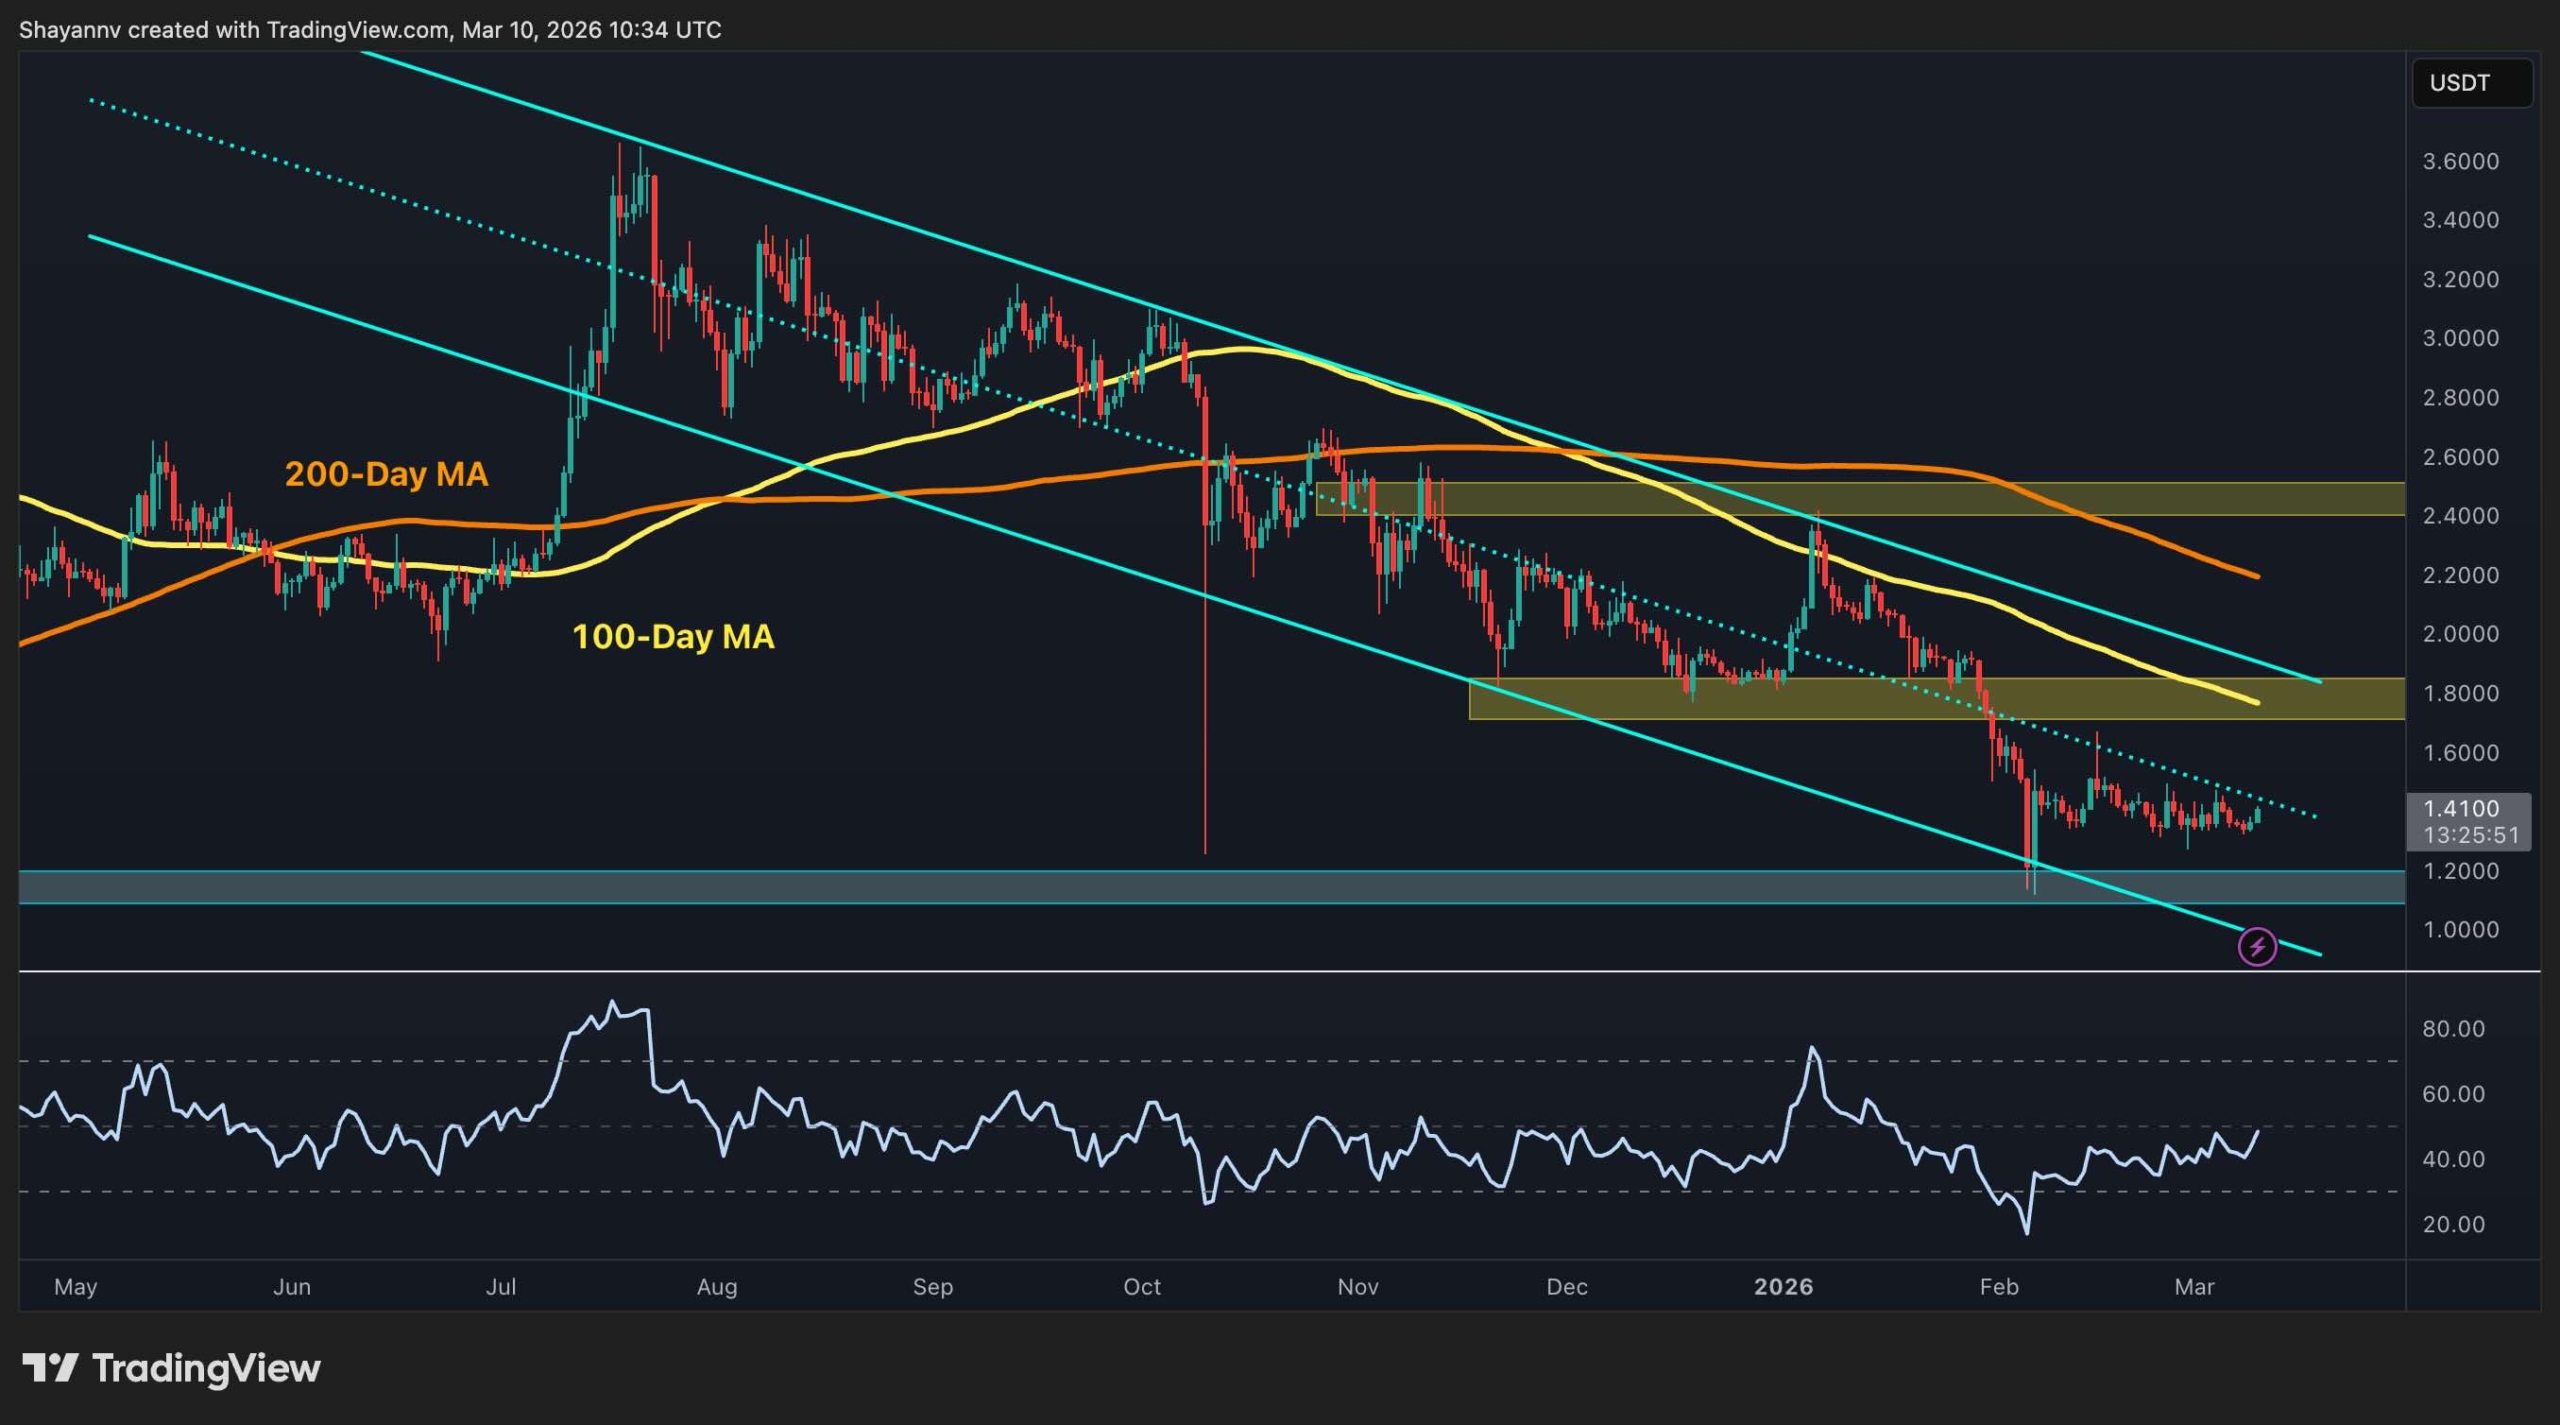
On the XRP/USDT chart, the asset is still moving inside a broad descending channel, which keeps the daily structure bearish. XRP is trading around $1.41 and remains below both the 100-day and 200-day moving averages, while the dotted trendline and the $1.80 zone continue to cap rebounds.
The main support remains the $1.20 area, which aligns with the lower boundary of the channel and has held recent downside attempts. If buyers manage to reclaim the $1.80 level and the 100-day moving average nearby, the next major resistance sits near $2.40 to $2.50, but until then, the market structure still favors sellers. The RSI has also recovered slightly, though momentum is still not strong enough to suggest a sustained bullish reversal.
The BTC Pair
Against Bitcoin, XRP also remains weak and continues to trade below both the 100-day and 200-day moving averages. The pair is currently sitting around 1,990 sats, right at the important horizontal support zone near 2,000 sats, while the 2,400 to 2,450 sats region remains the key resistance area overhead.
As long as XRP stays below that resistance cluster, the BTC pair remains structurally bearish. A breakdown below 2,000 sats could send the pair toward the lower support around 1,500 sats, while a recovery above 2,400 sats would be needed to improve the outlook and open the path toward 2,700 to 2,800 sats. For now, the trend still points to relative weakness versus Bitcoin.

Binance Free $600 (CryptoPotato Exclusive): Use this link to register a new account and receive $600 exclusive welcome offer on Binance (full details).
LIMITED OFFER for CryptoPotato readers at Bybit: Use this link to register and open a $500 FREE position on any coin!
Disclaimer: Information found on CryptoPotato is those of writers quoted. It does not represent the opinions of CryptoPotato on whether to buy, sell, or hold any investments. You are advised to conduct your own research before making any investment decisions. Use provided information at your own risk. See Disclaimer for more information.

THIS IS THE NEXT BITCOIN BREAKOUT…
‘We’re trying to be positive – but it is horrific, and shouldn’t have happened’

Oil and gas price shock from Iran war could impact grocery costs


-
Business4 days ago
Form 8K Entergy Mississippi LLC For: 6 March
-

 Fashion4 days ago
Weekend Open Thread: Ann Taylor
-

 News Videos1 day ago
10th Algebra | Financial Planning | Question Bank Solution | Board Exam 2026
-

 Crypto World1 day ago
Paradigm, a16z, Winklevoss Capital, Balaji Srinivasan among investors in ZODL
-

 Tech6 days ago
Bitwarden adds support for passkey login on Windows 11
-
 Sports5 days ago
499 runs and 34 sixes later, India beat England to enter T20 World Cup final | Cricket News
-

 Sports3 days ago
Three share 2-shot lead entering final round in Hong Kong
-

 Sports3 days ago
Braveheart Lakshya downs Lai in epic battle to enter All England Open final | Other Sports News
-

 Business7 days ago
Guthrie Disappearance Enters Fifth Week as Family Visits Memorial
-

 Politics4 days ago
Top Mamdani aide takes progressive project to the UK
-

 Business3 hours ago
ExxonMobil seeks to move corporate registration from New Jersey to Texas
-

 NewsBeat5 days ago
Piccadilly Circus just unveiled ‘London’s newest tourist attraction’ and it only costs 80p to enter
-

 Business2 days ago
Search for Nancy Guthrie Enters 37th Day as FBI Probes Wi-Fi Jammer Theory
-

 Entertainment4 days ago
Hailey Bieber Poses For Sexy Selfies In New Luscious Lip Thirst Traps
-
 NewsBeat18 hours ago
Pagazzi Lighting enters administration as 70 jobs lost and 11 stores close across Scotland
-

 Tech1 day ago
Despite challenges, Ireland sixth in EU for board gender diversity
-

 Crypto World6 days ago
New Crypto Mutuum Finance (MUTM) Reports V1 Protocol Progress as Roadmap Enters Phase 3
-

 Tech5 days ago
ACIP To Discuss COVID ‘Vaccine Injuries’ Next Month, Despite That Not Being In Its Purview
-
Entertainment6 days ago
Harry Styles Has ‘Struggled’ to Discuss Liam Payne’s Death
-

 Business23 hours ago
Search Enters 39th Day with FBI Tip Line Developments and No Major Breakthroughs