
Business
Ford recalls over 83,000 vehicles in two separate safety actions

Check out what’s clicking on FoxBusiness.com.
Ford is recalling more than 83,000 vehicles in two separate actions due to issues that could increase the risk of a crash, federal regulators said.
The first recall affects 35,772 model year 2025-2026 Explorer SUVs and the dynamic bending light feature, according to the notice filed with the National Highway Traffic Safety Administration.
The affected vehicles have an incorrect headlamp control module software calibration that results in the right headlight turning in the opposite direction of a vehicle turn.

A model year 2025 Ford Bronco Sport. (Ford Motor Co.)
FORD RECALLS 1.74 MILLION VEHICLES DUE TO REARVIEW CAMERA BLACKOUTS, ISSUES
“When turning the steering wheel on a left curve, the driver’s side (LHS) bending light correctly follows the turn, while the passenger side (RHS) light bends away from the curve,” the recall report said. “Conversely, when turning on a right curve, the left-hand light follows the steering wheel and bends to the right, while the right-hand light bends inward towards the left.”
The report said a headlight that turns incorrectly could result in increased glare to other drivers and increase the risk of a crash.
FORD IN DEEP WATER AFTER SWEEPING RECALLS HIT EVERY MODEL SINCE 2020 – WITH ONE EXCEPTION
Ford said it is not aware of any accidents or injuries related to the issue.
Updates to fix the headlight control module software will be available over the air or through dealerships at no charge. Owner notification letters are expected to be mailed March 23.
In a separate action, Ford is recalling 47,804 vehicles due to issues with the engine gas recirculation (EGR) valve that could lead to a loss of motive power, most likely at low speeds, which Ford said increases the risk of a crash.

Ford issued two separate recalls for certain model year 2025-2026 Explorers and certain 2025 Ranger, Mustang, Maverick, Explorer, Escape, Bronco, Bronco Sport, Lincoln Nautilus and Corsair vehicles. (Jeff Kowalsky/Bloomberg via Getty Images )
FORD BUILDS ONE-OF-A-KIND EXPLORER FOR POPE LEO XIV
The recall affects certain model year 2025 Ranger, Mustang, Maverick, Explorer, Escape, Bronco, Bronco Sport, Lincoln Nautilus and Corsair vehicles with 1.5-liter, 2.0-liter or 2.3-liter engines.
Ford said it is not aware of any accidents, injuries or fires related to the condition.
CLICK HERE TO GET FOX BUSINESS ON THE GO
The automaker said a fix is still under development. Owners will be notified by mail once a remedy is available and will need to take their vehicles to a Ford or Lincoln dealer for a free repair.

With Easter Sunday falling on April 5, 2026, families across the United States are preparing for a weekend blending religious reflection, egg hunts and cozy movie nights. Whether seeking profound biblical dramas or lighthearted spring tales featuring bunnies and chocolate, this year’s recommendations mix timeless classics with newer faith-inspired releases available on streaming platforms and in select theaters.

Here is a curated list of 10 movies perfect for Easter viewing, drawn from popular recommendations by outlets like Parade, Time Out, Pure Flix and faith-focused sites. The selections balance solemn Holy Week contemplation with family-friendly fun.
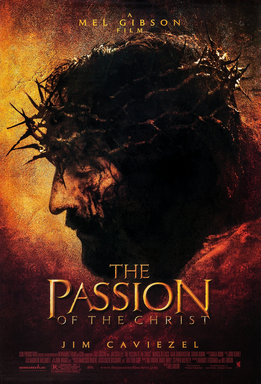
- The Passion of the Christ (2004) Mel Gibson’s intense portrayal of Jesus’ final 12 hours remains a powerful Easter staple. Jim Caviezel’s performance as Christ captures the physical and spiritual agony of the crucifixion, followed by a stirring resurrection sequence. Many churches and families revisit it during Holy Week for its raw depiction of sacrifice and redemption. Available on major streaming services, it carries an R rating for graphic violence but is widely discussed in Christian circles as a modern cinematic milestone.
- The Prince of Egypt (1998) DreamWorks’ animated retelling of the Exodus story offers stunning visuals and memorable songs, including “When You Believe.” It follows Moses from prince to deliverer, culminating in themes of liberation and faith that resonate with Easter’s message of hope. Suitable for all ages, the film appeals to children while delivering deeper theological layers for adults. It’s frequently praised as one of the best family faith films and streams widely.
- It’s the Easter Beagle, Charlie Brown (1974) This Peanuts special captures the simple joys and minor disappointments of Easter preparations, with Linus awaiting the Easter Beagle. Nostalgic and gentle, it provides a wholesome counterpoint to heavier biblical films. Perfect for younger viewers, the 25-minute classic airs on broadcast networks or streams on services like Apple TV+ during the holiday.
- Ben-Hur (1959) Charlton Heston’s epic tale of revenge, forgiveness and redemption includes the famous chariot race and a powerful encounter with Jesus. The film’s Christian themes of grace align closely with Easter’s resurrection narrative. Winner of 11 Academy Awards, this Technicolor masterpiece remains a grand viewing experience for families comfortable with its three-and-a-half-hour runtime.
- Risen (2016) Joseph Fiennes stars as a Roman soldier tasked with investigating Jesus’ empty tomb in this faith-based drama. The film explores doubt turning to belief amid the political tensions of first-century Jerusalem. Critics note its thoughtful approach to the resurrection story without excessive sentimentality, making it suitable for older teens and adults seeking a fresh perspective.
- Peter Rabbit (2018) James Corden voices the mischievous bunny in this live-action/CGI adaptation of Beatrix Potter’s tales. Filled with garden chases, slapstick humor and heartwarming moments, it embodies Easter’s playful side with rabbits and springtime settings. The sequel and related Potter stories also make strong companions for family movie marathons. Rated PG, it’s ideal for children of all ages.
- Jesus of Nazareth (1977) This acclaimed miniseries, often watched in parts during Holy Week, stars Robert Powell as Jesus. Directed by Franco Zeffirelli, it meticulously depicts Christ’s life, teachings, death and resurrection with reverence and historical detail. Many viewers consider it one of the most faithful screen adaptations, available on DVD or streaming platforms for extended family viewing.
- Hop (2011) Russell Brand voices the Easter Bunny’s reluctant son in this colorful comedy blending animation and live action. It follows a young rabbit who dreams of becoming a drummer instead of delivering eggs. Light, fun and filled with holiday spirit, the film offers laughs for kids while adults appreciate the clever Easter Bunny lore. It’s a go-to for families wanting something upbeat.
- The Greatest Story Ever Told (1965) Max von Sydow portrays Jesus in this sweeping biblical epic directed by George Stevens. Covering the life of Christ from birth through the resurrection, the star-studded cast and majestic cinematography make it a classic for reflection. Though lengthy, its reverent tone suits quiet Easter afternoon screenings.
- A Great Awakening (2026) This timely faith-based release, opening in limited theaters around April 3, 2026, dramatizes the spiritual revival led by George Whitefield in colonial America. Produced by Sight & Sound Films, it highlights prayer, repentance and national transformation — themes echoing Easter’s message of renewal. Early buzz positions it as an inspiring addition for those seeking contemporary Christian storytelling tied to historical faith roots.
Beyond these picks, families may explore related titles like Paul, Apostle of Christ (2018) for its focus on early church resilience, or animated options such as The King of Kings (2025 re-release or related versions)for younger audiences. Streaming services including Pure Flix, Netflix and Disney+ offer dedicated faith or family sections with Easter collections.
The holiday timing coincides with spring break in many regions, boosting demand for both solemn and celebratory content. Industry observers note a steady interest in faith-based films, with platforms curating playlists around resurrection themes.
For younger children, shorter specials or bunny-centric stories provide accessible entry points, while adults often pair biblical epics with discussions on scripture. Experts recommend balancing heavy dramas with lighter fare to suit mixed-age groups.
Newer 2026 releases like faith-inspired projects add fresh options, though many families stick to proven classics for their emotional and spiritual resonance. Availability varies by platform; checking local listings or subscription services is advised, especially for theater showings of newer titles.
Easter movie traditions often extend beyond April 5, with viewers continuing through the Easter season. Whether reflecting on sacrifice through intense portrayals or celebrating new life with animated adventures, these films offer something for diverse tastes.
Churches and community groups frequently host screenings or virtual watch parties, enhancing the communal aspect of the holiday. Parents appreciate options that reinforce values of forgiveness, hope and renewal central to Christian observance.
As streaming evolves, older films gain new life through remastered editions or 4K upgrades, while original content on faith platforms expands choices. This year’s lineup reflects ongoing demand for stories blending entertainment with inspiration.
Movie guides from Common Sense Media and Plugged In help families navigate ratings and themes, ensuring age-appropriate selections. For those preferring secular spring vibes, titles involving chocolate factories or garden escapades complement the more religious entries.
Ultimately, Easter viewing serves as a bridge between solemn remembrance and joyful celebration. With options spanning decades of cinema, households can tailor their weekend to create lasting memories amid baskets, brunches and budding spring flowers.

As families gather for Easter weekend with Sunday falling on April 5, 2026, many are turning to Netflix for a mix of reflective faith-based stories, uplifting family adventures and lighthearted springtime entertainment after egg hunts, church services and holiday meals.

Netflix’s current lineup includes several titles that align well with the themes of renewal, redemption and hope central to the holiday, alongside kid-friendly animated features perfect for winding down. While the platform does not release many new biblical epics specifically for Easter, returning favorites and faith-inspired dramas provide meaningful viewing options.
Here are 10 recommended movies available on Netflix this Easter weekend, blending solemn reflection with wholesome fun, based on current availability and recent roundups from Parade, Netflix Tudum and other entertainment guides.
- A Week Away (2021) This Netflix original musical follows a troubled teen who finds transformation and community at a Christian summer camp. Featuring modern takes on classic worship songs and a cast including Bailee Madison and Kevin Quinn, it offers upbeat messages of second chances and faith — ideal for teens and families seeking something inspirational yet entertaining. The film’s positive portrayal of youth ministry makes it a recurring Easter recommendation for younger viewers.
- The Forge (2024) Directed by Alex Kendrick, this faith-based drama centers on a young man discovering purpose, responsibility and spiritual growth through mentorship. Viewers praise its straightforward Christian message about surrendering to God’s plan, making it suitable for family discussions on personal renewal during the Easter season. It joins other Kendrick brothers’ films in emphasizing transformation and community.
- Ruth & Boaz (recent addition) A modern retelling of the biblical Book of Ruth, this film explores themes of loyalty, redemption and unexpected blessings in a new land. Its focus on faithfulness and divine provision resonates with Easter’s themes of hope and new beginnings, offering a sophisticated yet accessible spiritual story for adults and older teens.
- The Star (2017) This animated feature retells the Nativity story from the perspective of animals, including a donkey and other creatures on a journey to Bethlehem. With voice talent like Oprah Winfrey and Tyler Perry, it’s a gentle, humorous option for young children that ties into the broader Christmas-to-Easter narrative of Christ’s life while keeping things light and family-friendly.
- Penguin Bloom (2020) Based on a true story, this drama follows a mother recovering from a life-altering injury who finds healing through caring for an injured magpie. Starring Naomi Watts, it touches on resilience, family bonds and finding hope in unexpected places — subtle themes of renewal that complement Easter viewing without being overtly religious.
- A Shaun the Sheep Movie: Farmageddon (2019) Aardman’s stop-motion claymation delivers silly fun as Shaun and his flock encounter an alien visitor. The wordless humor, clever visuals and farmyard setting make it a perfect no-stress pick for younger kids during a busy holiday weekend. It’s part of Netflix’s strong animated offerings for families.
- Testament: The Story of Moses (docudrama series, watch select episodes) Netflix’s biblical retelling examines the life of Moses with dramatic reenactments and expert insights. Episodes covering liberation and faith provide thoughtful context for Holy Week reflection, suitable for families comfortable with more serious historical-spiritual content.
- Come Sunday (2018) Chiwetel Ejiofor stars as real-life pastor Carlton Pearson, whose crisis of faith challenges his congregation and family. The film thoughtfully explores doubt, grace and evolving beliefs, sparking meaningful conversations for adult viewers during Easter.
- Peter Rabbit (2018) James Corden voices the mischievous bunny in this live-action/CGI adaptation of Beatrix Potter’s tales. Garden chases, slapstick and heartwarming moments capture Easter’s playful rabbit tradition, making it a go-to for children while adults enjoy the clever humor and springtime vibes.
- Blue Miracle (2021) This based-on-true-events story follows orphans and their mentor entering a fishing tournament to save their orphanage. Themes of perseverance, community and unexpected provision align with messages of hope and divine help, offering an inspiring underdog tale for the whole family.
Additional faith-friendly options on Netflix include “The Two Popes” for thoughtful religious dialogue, “Mysteries of the Faith” documentary series exploring relics and traditions, and “Mary Mother of Jesus” retellings that connect to the Easter story through the lens of Christ’s mother. Netflix Tudum recently highlighted 16 faith-filled titles for the holiday, emphasizing stories of belief and redemption.
For families with younger children, Parade’s 2026 guide to Easter movies on Netflix also points to gentle animated picks and real-life inspiration stories like “The Boy Who Harnessed the Wind,” which highlights ingenuity and faith amid hardship.
The Easter weekend timing coincides with spring break for many schools, increasing streaming demand for both reflective and entertaining content. Industry observers note that while big-budget Passion plays or resurrection-focused films often appear on other platforms or in theaters, Netflix excels at accessible, character-driven stories that encourage discussion without requiring intense emotional investment.
Parents should review ratings and content warnings: faith-based titles like “The Forge” are generally family-appropriate, while others may include mild thematic elements. Common Sense Media and Plugged In provide helpful guides for age suitability and discussion points.
New April 2026 arrivals such as “Atonement,” “Bohemian Rhapsody” and family comedies offer secular alternatives for varied tastes, but the platform’s spiritual category remains a strong draw during religious holidays. Availability can vary by region, so users are encouraged to search Netflix’s “Spiritual Movies” or “Faith & Spirituality” sections for the latest.
Churches and small groups sometimes organize virtual watch parties or follow-up discussions around these films, turning movie night into an extension of Easter worship. Whether focusing on sacrifice and resurrection through biblical lenses or simply enjoying bunny-themed antics, Netflix provides flexible options for creating holiday memories.
As streaming habits evolve, platforms like Netflix continue curating seasonal playlists, though many families blend platform content with personal DVD or theater choices for a full weekend marathon.
Experts recommend balancing heavier dramas with lighter fare to suit mixed-age audiences and moods. For those preferring secular spring energy, titles with animals, renewal or adventure complement the more faith-centered selections.
Ultimately, these movies offer a way to pause amid holiday busyness — reflecting on themes of hope, forgiveness and new life that define Easter for millions. With options spanning animation, drama and musicals, households can tailor their viewing to strengthen bonds and spark conversations.
This developing holiday streaming landscape reflects broader trends in faith-based entertainment, where accessible stories meet families where they are. Check Netflix directly for exact availability this weekend, as licensing can shift.
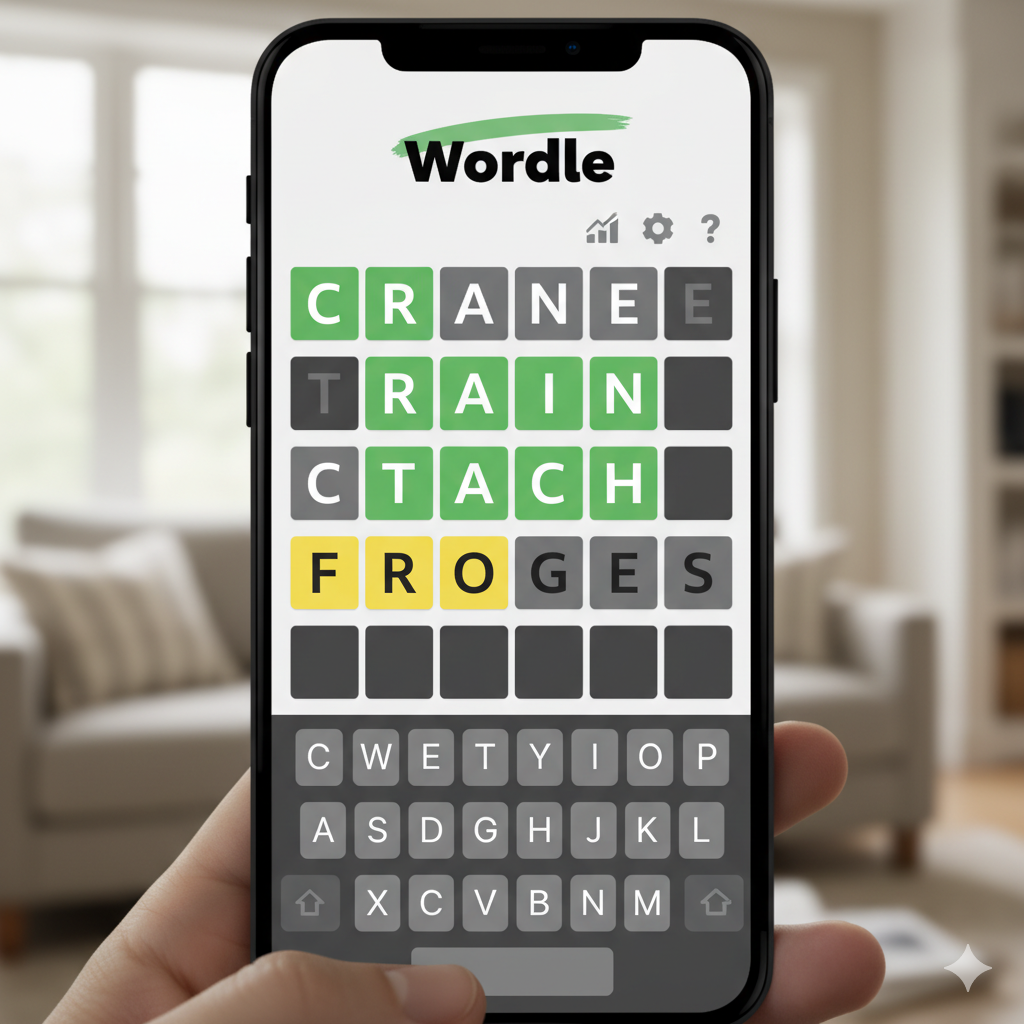
Wordle players logging in Saturday, April 4, 2026, faced puzzle No. 1750, a deceptively straightforward five-letter word that left some solvers scratching their heads despite its common usage in everyday language.
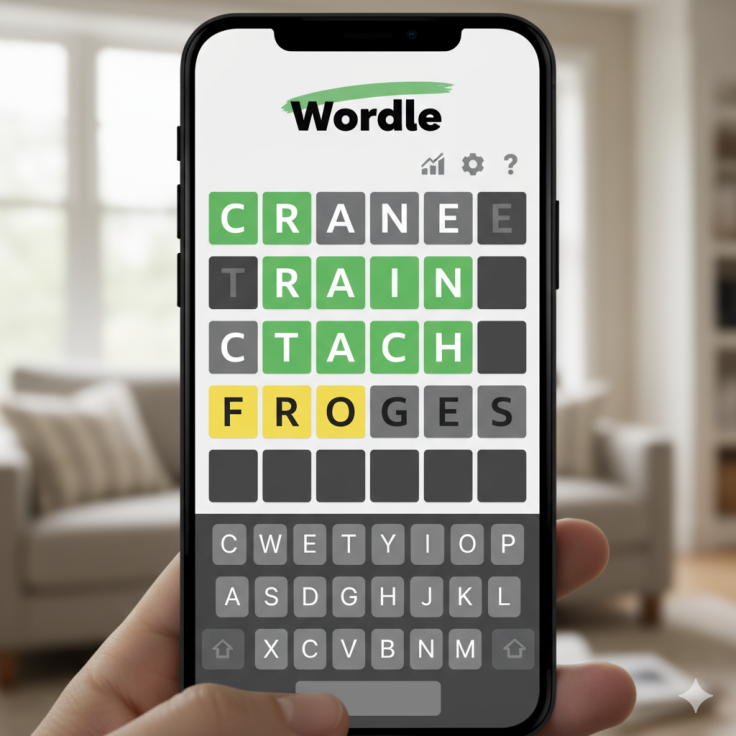
The New York Times-owned daily word game, created by Josh Wardle, continues its streak as one of the internet’s most popular brain teasers more than four years after its viral explosion. For today’s puzzle, the answer is SANDY, an adjective describing something covered with, full of or resembling sand.
According to The New York Times’ official Wordle review, today’s word means “composed of, full of or covered with sand.” Webster’s New World College Dictionary defines it similarly, noting its application to terrain, soil or even a light yellowish-brown color.
Spoiler-Free Hints for Wordle #1750
Players who prefer to solve independently can use these progressively revealing clues compiled from multiple gaming sites:
- The word contains exactly one vowel.
- There are no repeated letters.
- It is an adjective.
- Common synonyms include “dusty,” “gritty” or “tan.”
- It often describes beach or desert terrain with a loose, grainy texture.
- One popular culture association is the name of SpongeBob SquarePants’ best friend.
Additional strategic hints shared by solvers include starting with words that test common vowels and consonants. Many recommended opening guesses such as “SLATE,” “CRANE” or “AUDIO” to quickly eliminate or confirm key letters.
For those needing more targeted help, the fourth letter is “D” and the fifth letter is “Y,” according to detailed hint pages. The word starts with “S” and has a straightforward structure without tricky double letters or uncommon combinations.
The Official Answer and Analysis
Today’s Wordle answer is SANDY.
The solution proved accessible for many, with The New York Times noting that testers averaged around four to five guesses. Its simplicity — common letters in familiar positions — made it easier than some recent puzzles, though the beachy theme caught a few players off guard on a spring weekend.
SANDY fits neatly into Wordle’s mix of everyday vocabulary. It can refer literally to sand-covered shores, metaphorically to unstable ground (“sandy soil”) or even colloquially to hair or complexion colors. In pop culture, it evokes everything from the musical “Grease” character to the cheerful starfish in Nickelodeon’s long-running animated series.
Strategies That Worked for Puzzle #1750
Experienced Wordle enthusiasts shared successful opening sequences on social media and forums. Common paths included:
- Starting with “STARE” or “SLATE” to test S, A, R/E and T — quickly revealing the S and A.
- Following with “CANDY” or “HANDY,” which often locked in the “ANDY” ending pattern.
- Using “SHADY” as a strong third guess for many, confirming the D and narrowing the final letter.
Hard-mode players, who must use confirmed letters in subsequent guesses, reported slightly more challenge but still solved it efficiently. One viral thread described the sequence: “SLATE → SNACK → SHADY → SANDY” in four guesses.
The absence of repeated letters and the single vowel (A) helped solvers eliminate wrong paths quickly. Words with double letters like “SASSY” or “SANDD” were ruled out early.
Wordle’s Enduring Popularity in 2026
More than four years after The New York Times acquired the game in 2022, Wordle maintains a dedicated daily audience. The simple green-yellow-gray tile system, six-guess limit and shareable results grid continue to foster community and friendly competition.
On April 4, 2026, players posted streaks, near-misses and victory dances across X, Reddit and Facebook. Some noted the Easter weekend timing made the beach-themed word feel seasonally appropriate, even if many were focused on family gatherings rather than coastal vacations.
Recent puzzles leading up to No. 1750 included:
- April 3 (#1749): SINGE
- April 2 (#1748): SOBER
- April 1 (#1747): FIZZY
The progression from more abstract or action-oriented words to the concrete “SANDY” offered a gentle reset for some solvers.
Tips for Improving Your Wordle Game
Whether you’re a newcomer or chasing a 200-day streak, experts recommend these strategies:
- Start strong: Choose opening words with multiple vowels and common consonants (A, E, R, S, T, L, N).
- Think in patterns: After the first guess, prioritize words that test new information rather than repeating eliminated letters.
- Consider frequency: Common English letter distributions (E most frequent, then T, A, O, I, N, S) guide efficient elimination.
- Use the grid: Yellow letters must move positions; green letters stay fixed.
- Avoid proper nouns and obscure terms: Wordle draws from a curated list of common five-letter words.
For families playing together this Easter weekend, Wordle serves as an easy group activity. Children and adults alike can participate, with younger players learning vocabulary while elders share solving logic.
Community Reactions and Score Distribution
Early data from The New York Times suggested a higher-than-average success rate for puzzle #1750, with many players posting 3/6 or 4/6 results. Comments on the official review page ranged from “too easy” to “perfect beach word for spring.”
Some solvers admitted overthinking it, guessing “SHADY,” “SANDY” alternatives like “SILTY” or “GRAVEL” before landing on the correct term. Others celebrated quick solves, with one user joking that “SANDY” felt like a reward after tougher recent puzzles.
Looking Ahead to Wordle #1751
With Easter Sunday on April 5, 2026, tomorrow’s puzzle (#1751) is expected to maintain the game’s balance of accessibility and challenge. Players are advised to check official sources or trusted hint sites for fresh clues rather than relying on spoilers.
The New York Times continues to offer the core game free with limited daily plays, while Wordle Unlimited and other fan variants provide endless practice. Official statistics show millions of daily attempts worldwide, cementing Wordle’s status as a cultural touchstone.
For those who missed today’s solution or want to review past puzzles, archives are available through The New York Times and fan sites. Remember: tomorrow brings a fresh grid and new opportunity to test your vocabulary and deduction skills.
Whether you solved SANDY in three guesses or needed all six, the real win remains the daily mental exercise and the shared experience with millions of fellow players. Happy Easter to those celebrating, and good luck with future Wordles.

The New York Times Connections puzzle for Saturday, April 4, 2026 — No. 1,028 — challenged players with 16 words that invited creative associations ranging from idioms to geography and summer activities.

The daily word-grouping game, launched in 2023, requires solvers to sort 16 words into four groups of four based on shared themes. Categories range in difficulty from yellow (easiest) to purple (hardest). Testers rated today’s puzzle a relatively gentle 2 out of 5 in difficulty, according to the official companion article.
The 16 words presented were: Dogs, Let, Lie, Sleeping, Cover, Mask, Screen, Shield, Bluff, Cape, Point, Spit, Band, Base, Boot, Summer.
Here are the complete solutions, with spoiler warnings for those still solving.
Yellow (Easiest): “Let Sleeping Dogs Lie” Dogs, Let, Lie, Sleeping
This category draws directly from the well-known idiom advising people to avoid stirring up old troubles or controversies. The phrase suggests leaving a situation undisturbed, much like not waking a resting dog. Solvers who spotted the partial idiom early often breezed through this group.
Green: Obscure Cover, Mask, Screen, Shield
These words all relate to hiding, protecting or placing something in front of another object or concept. A “cover” story conceals truth, a “mask” hides identity, a “screen” can block view or information, and a “shield” protects from harm or scrutiny. The category rewards recognition of verbs or nouns used metaphorically for concealment.
Blue: Coastal Landforms Bluff, Cape, Point, Spit
Geography enthusiasts likely excelled here. These terms describe specific features along coastlines or bodies of water. A “bluff” is a steep cliff or bank, a “cape” is a headland jutting into the sea, a “point” is a narrow extension of land, and a “spit” is a narrow sandbar formed by water currents. The group highlights precise terminology from physical geography.
Purple (Hardest): _____ Camp Band, Base, Boot, Summer
This trickiest category involves words that commonly precede or pair with “camp” to form compound terms or familiar phrases. “Band camp” refers to music-focused youth programs, “base camp” is a mountaineering or expedition staging area, “boot camp” denotes rigorous military-style training, and “summer camp” evokes classic childhood experiences with cabins and activities. The purple difficulty stems from the need to think beyond literal meanings to common collocations.
Solving Strategies and Tips
Many players approached the grid by first scanning for obvious idioms or strong thematic clusters. Spotting “Sleeping,” “Dogs,” “Let” and “Lie” often unlocked the yellow category quickly, providing momentum.
For the green group, considering synonyms for “hide” or “protect” helped connect the dots. The blue coastal terms stood out to those with travel or nature knowledge, though “spit” as a landform occasionally tripped up solvers unfamiliar with the term.
The purple category proved most elusive for some, requiring a lateral leap to “camp” as a connector. Hints from sites like TheGamer suggested thinking about activities or places associated with tents and structured programs, particularly those popular with youngsters.
Experienced solvers recommend starting with potential idioms or multi-meaning words. Grouping by part of speech or looking for words that fit common prefixes/suffixes can also accelerate progress. On hard mode or when stuck, eliminating one strong category often reveals connections in the remaining words.
Community Reactions and Performance
Early feedback on social platforms and the NYT companion comments described the puzzle as fair and enjoyable, with many achieving perfect or near-perfect solves. The low difficulty rating contributed to higher success rates compared to more punishing recent editions.
Some players noted the satisfying “aha” moment when connecting the coastal landforms or realizing the “camp” pairings. Others admitted overthinking the purple category, initially linking words to music or military themes without landing on the shared “camp” element.
The puzzle’s timing on a spring Saturday — coinciding with Easter weekend observances for many — added a light, seasonal feel, though no direct holiday references appeared in the grid.
Connections’ Growing Popularity
Since its debut, Connections has become a staple alongside Wordle and the Mini Crossword in The New York Times Games portfolio. Millions play daily, sharing color-coded grids on social media and competing for streaks. The game’s appeal lies in its blend of vocabulary, lateral thinking and cultural knowledge without requiring specialized expertise.
For April 4, 2026, the mix of an idiom, verbs of concealment, geographic features and compound phrases offered balanced challenge. Players who missed categories could still complete the puzzle with lives remaining, as the NYT system allows four mistakes before ending the attempt.
Tips for Future Puzzles
- Look for words with multiple common usages.
- Consider idioms, song titles, brand names or pop culture references.
- Group by theme rather than obvious synonyms.
- Use the color progression: solve easier groups first to reduce options.
- If stuck, pause and return with fresh eyes — Connections rewards patience.
The New York Times provides an official companion article with incremental hints, revealing one word per category for those needing a nudge without full spoilers. Community sites and bots offer additional analysis of puzzle difficulty based on aggregate solve data.
Looking ahead, Sunday’s puzzle (No. 1,029) will present a fresh grid for Easter Sunday players seeking a mental break between family activities.
Whether you nailed all four categories in order or needed several attempts, today’s Connections reinforced why the game resonates: it turns ordinary words into surprising connections and delivers that rewarding click when groups align.
For those who enjoy tracking performance, the NYT Games app and website save daily results and statistics. Sharing solves with friends or family can turn the solitary puzzle into a group activity, especially during holiday weekends.
The April 4 edition stands as an accessible entry in the Connections catalog, welcoming both newcomers and veterans with clever but not cruel wordplay.

The age at which people can start receiving the state pension is going up in stages over the next two years.

Drugs Made In America Acquisition II Corp. enters $300,000 convertible note agreement

Form 13D/A Stardust Power Inc. For: 3 April
Business
First Resource Bancorp, Inc. (FRSB) Presents at Banking Virtual Investor Conference – Slideshow

First Resource Bancorp, Inc. (FRSB) Presents at Banking Virtual Investor Conference – Slideshow


Lucid misses first-quarter vehicle delivery estimates on supplier disruptions
Form 13D/A WILLIS LEASE FINANCE CORP For: 3 April
The world’s supply of helium is being threatened by the Iran war

Faith, Family and Spring Favorites

Top 7 ways to earn ETH and build passive income


-

 NewsBeat1 day ago
Steven Gerrard disagrees with Gary Neville over ‘shock’ Chelsea and Arsenal claim | Football
-

 Business24 hours ago
No Jackpot Winner and $194 Million Prize Rolls Over
-
Entertainment4 days ago
Fans slam 'heartbreaking' Barbie Dream Fest convention debacle with 'cardboard cutout' experience
-

 Crypto World2 days ago
Gold Price Prediction: Worst Month in 17 Years fo Save Haven Rock
-

 Fashion5 hours ago
Weekend Open Thread: Spanx – Corporette.com
-

 Tech5 days ago
The Pixel 10a doesn’t have a camera bump, and it’s great
-
 Entertainment6 days ago
Lana Del Rey Celebrates Her Husband’s 51st Birthday In New Post
-
Crypto World3 days ago
Dems press CFTC, ethics board on prediction-market insider trades
-

 Tech5 days ago
Avatar Legends: The Fighting Game comes out in July and it looks pretty slick
-

 Sports3 days ago
Tallest college basketball player ever, standing at 7-foot-9, entering transfer portal
-

 Tech4 days ago
EE TV is using AI to help you find something to watch
-

 Fashion6 days ago
Amazon Sundays: Soft Spring Layers
-

 Business2 days ago
Login and Checkout Issues Spark Merchant Frustration
-

 Fashion7 days ago
When Evening Dressing Gets Colorful for Spring
-

 Tech5 days ago
Elon Musk’s last co-founder reportedly leaves xAI
-

 Tech4 days ago
How to back up your iPhone & iPad to your Mac before something goes wrong
-

 Tech4 days ago
Apple will hide your email address from apps and websites, but not cops
-

 Politics4 days ago
Should Trump Be Scared Strait?
-

 Crypto World4 days ago
U.S. rule change may open trillions in 401(k) funds to crypto
-

 Tech4 days ago
Flipsnack and the shift toward motion-first business content with living visuals
You must be logged in to post a comment Login