

Crypto World
Next week could spice things up for BTC as seven central banks face an inflation test


Next week could prove pivotal for markets, including bitcoin, as seven major central banks, including the powerful Federal Reserve, announce rate decisions amid war-driven oil price gains that threaten to reignite inflation in the global economy.
The week’s packed economic calendar includes the Reserve Bank of Australia (RBA) rate decision on March 17, followed by the Bank of Canada (BOC) and the Fed on March 18, and wraps up with the Bank of Japan (BOJ), Swiss National Bank (SNB), and European Central Bank (ECB) on March 19.
Until recently, markets expected most major central banks, led by the Fed, to steadily cut interest rates (or avoid tightening) this year. The rapid emergence of artificial intelligence as a disinflationary force — with the potential to disrupt the labor market — had reinforced this bias for lower borrowing costs. That outlook supported risk assets, including Bitcoin.
However, the war that began on Feb. 28 with coordinated U.S. and Israeli strikes on Iran, which has since involved widespread retaliatory attacks and disrupted energy shipments through the Middle East, has thrown a wrench into that outlook.
Rising oil prices have reignited concerns over inflation, forcing traders to reassess interest rate expectations. Some fear that central banks would respond to the evolving inflationary macroeconomic situation with higher borrowing costs.
As such, hawkish hints next week could trigger downside volatility across risk assets, including Bitcoin. This scenario looks plausible, as policymakers — remembering their 2021–22 misstep when they called inflation transitory and were proven wrong — may be extra quick to curb rising price pressures this time.
If they remain neutral or data-dependent in a wait-and-watch mode or downplay inflation fears, then risk assets could surge. This possibility cannot be ruled out either.
“Like all supply shocks, the first Fed response to an oil price spike is to watch and assess the damage,” Economist and Fed Watcher Ethan Harris said in a LinkedIn post.
“There are two reasons for this hesitation. First, oil shocks simultaneously lower growth and raise inflation. Before moving, the Fed wants to figure out which is the bigger problem. Second, most such shocks are transitory. The Fed does not want change rates, only to reverse the move weeks later,” he explained.
Historically, only the Fed — and possibly the BOJ — have exerted meaningful influence over Bitcoin prices. With oil prices already straining all corners of the Japanese society, next Friday’s BOJ decision could prove particularly pivotal for both domestic markets and bitcoin.


Bitcoin traded at $69,500 mid-morning in Europe after giving up Tuesday’s gains following a rejection at $71,750.
The largest cryptocurrency dropped 0.55% since midnight UTC, a loss dwarfed by several altcoins, with zcash (ZEC) and aave falling by 4.5% and 2.1%, respectively.
Gold and the dollar are little changed, while U.S. stock index futures added 0.15%.
The price action is still being dictated by the U.S.-Israel war with Iran, which continues to rage even after conflicting comments from U.S. President Donald Trump on Tuesday.
Oil remained volatile as a result, falling to as low as $81 per barrel on Tuesday before bouncing back to $89 during the European session on Wednesday.
Derivatives positioning
- Bitcoin’s failure to build momentum above $70,000 has proved costly for bulls holding leveraged long bets. In the past 24 hours, over $220 million worth of crypto futures bets have been liquidated, with longs accounting for most of the tally.
- Open interest (OI) in dollar-denominated bitcoin futures on major exchanges has declined to 226,000 BTC from 233,000 BTC. This indicates that the overnight price drop hasn’t really seen traders short the falling market. The same dynamic is seen in solana (SOL) and ether (ETH) futures.
- Activity in XRP futures continues to grow, with open interest rising to 1.74 billion tokens, the highest since Feb. 23.
- Broadly speaking, OI has decreased in most alternative tokens over the past 24 hours, a sign of renewed capital outflows.
- TRX, CC and XMR stand out with a bullish combination of positive annualized funding rates and cumulative volume delta (CVD), pointing to active buying in the futures market. Most other coins have flat to negative funding rates and CVDs.
- Bitcoin’s 30-day implied volatility index, BVIV, fell for a third straight day, but its major averages — the 50-, 100- and 200-day measures — are now stacked one above the other. That’s a bullish signal, meaning volatility could pick up.
- The same is true for the ether volatility index. Moreover, Wall Street’s VIX index is up 4% at 26%, pointing to elevated volatility in stocks that could spill over into cryptocurrencies.
- On the CME, open interest in BTC futures has dropped to $7.39 billion, the lowest since September 2024, alongside an equally sharp drop in ETH futures. Clearly, institutional appetite for the two tokens remains weak.
- On Deribit, BTC and ETH protective puts continue to trade pricier than calls, although demand for downside protection has weakened notably since early last month. On decentralized exchange Derive, traders are increasingly betting on a rally above $80,000, alongside put selling on Deribit, Derive told CoinDesk.
Token talk
- AI token internet computer (ICP) led a mixed altcoin sector on Wednesday, rising by more than 8% after it was listed on Korean exchange Upbit. Daily trading volume jumped from $65 million to $267 million after the listing as retail investors poured in.
- Continuing the AI theme, jumped, notching a 6% gain over the past 24 hours.
- AI’s positive performance can be attributed in part to a rare blog post from Nvidia CEO Jensen Huang, who claimed that AI is an industrial buildout comparable to electrification.
- The rest of the altcoin market receded on Wednesday, with decentralized finance (DeFi) tokens curve (CRV) and jupiter (JUP) losing 6.5% apiece in the past 24 hours.
- Crypto sentiment is slowly improving as the Fear and Greed index is at 25/100, moving into “fear” territory after more than a month stuck in the “extreme fear” zone.
- The uptick comes as a result of the crypto market’s relative strength since the start of the war in Iran, with bitcoin and the broader market outperforming precious metals and U.S. equities since March 1.

Ethereum USD perpetual futures funding rates dipped into negative territory on Tuesday, signaling a decisive shift in dominance to bearish traders. This metric confirms that active short sellers are currently paying longs to keep positions open.
The slide into negative funding coincides with renewed institutional skepticism, evidenced by -$210M in net outflows from Ethereum ETFs between March 5 and 10 and growing global macroeconomic tensions.
ETH is currently struggling to hold the psychological $2,000 level, weighed down by a near -60% price correction over the last six months as it slid 1.9% overnight following a positive start to the week.
Traders view negative funding as a capitulation signal. Historically, prolonged negative rates have often preceded a squeeze, but the current macro setup suggests that legitimate spot selling pressure is driving the current price action.
What Negative Funding Rates Actually Signal for ETH
The flip to negative funding is more than just a momentary dip; it highlights a structural weakness in the market structure. When funding is negative, shorts pay longs, meaning the market is heavily skewed toward betting on lower prices.
CoinGlass data shows that while the aggregate funding rate is negative, the options market paints a slightly more nuanced picture.
The options risk gauge remains near the neutral -6% to +6% range, yet put options are trading at a 7% premium relative to calls.
This suggests that while futures traders are aggressively shorting, smart money is hedging against further downside rather than betting on a catastrophic collapse.
Additionally, as on-chain derivatives activity migrates to other networks such as Hyperliquid, demand for mainnet Ethereum protocols has softened, leaving price action dependent on speculative flows rather than utility.
DISCOVER: Next Crypto to Explode in 2026
The Levels That Change Everything for Ethereum USD
Technical structures define the next major move. Ether is currently testing a precarious zone. Bulls are attempting to defend the $2,000 support, but repeated tests suggest weakening buyer resolve.
If bears force a daily close below $1,980, the next major liquidity pocket sits at $1,840. A breakdown of that level leaves little structural support until $1,760, a zone that could trigger a cascade of long liquidations.
Conversely, for the bearish thesis to be invalidated, ETH needs to reclaim $2,120 on a high-volume breakout. A sustained move above this level would squeeze the aggressive late shorts currently paying funding.
This could potentially spark a rapid surge toward $2,300. However, until the $2,120 resistance is cleared, the path of least resistance remains lower.
What Traders Are Watching Next

The immediate trigger for a reversal lies in institutional flows. The -$210M ETF exit needs to stabilize; continued outflows will likely force the price through support regardless of derivatives positioning.
Traders are also monitoring the yield spread. With native ETH staking offering 2.8% versus stablecoin yields closer to 3.75% on platforms like Aave, capital efficiency currently favors stablecoins.
Unlike the broader market optimism, the data suggests ETH needs a specific catalyst, either a spike in spot buying or a capitulation wick to flush the remaining leverage, to reset the trend.
EXPLORE: Best Crypto Presales to Buy in 2026
The post Ethereum USD Funding Rate Turns Negative as Bears Regain Control appeared first on Cryptonews.


Nasdaq-listed Solmate Infrastructure has announced plans to build a Solana infrastructure hub in the United Arab Emirates alongside a corporate restructuring and capital overhaul.
Summary
- Nasdaq-listed Solmate Infrastructure plans to build a Solana infrastructure hub in Abu Dhabi as part of a broader restructuring to focus on digital asset infrastructure.
- The company will change its legal name from Brera Holdings PLC to Solmate Infrastructure PLC while retaining the Nasdaq ticker SLMT.
According to a March 10 press release, the company will reposition itself as an institutional-grade provider of Solana infrastructure in Abu Dhabi following a board-approved proposal to realign the company’s legal structure and corporate identity with its blockchain-focused strategy.
Currently operating under the legal entity Brera Holdings PLC, the company will change its legal entity name to Solmate Infrastructure PLC as part of this transition. However, its Nasdaq ticker SLMT will remain the same.
“This transformation is the culmination of Brera’s strategic shift toward infrastructure opportunities we see in Abu Dhabi. By focusing our capital and corporate identity on Solana, we are positioning ourselves to be a central player in the region’s rapidly expanding digital economy,” Solmate CEO Marco Santori said in a statement.
As previously reported by crypto.news, the company first transitioned its strategy last September when it added a Solana-focused digital asset treasury and infrastructure business alongside its soccer ownership operations following a $300 million private investment backed by ARK Invest, RockawayX, and the Solana Foundation.
At the time, the company’s leadership said the move reflected a long-term conviction in the Solana ecosystem and outlined plans to accumulate SOL while building validator infrastructure and staking operations in Abu Dhabi.
In the latest announcement, the company said it will streamline its non-core assets by winding down two underperforming soccer teams while only retaining its flagship Italian club Juve Stabia. It will use the “liberated capital to accelerate its UAE based Solana infrastructure expansion.”
The company has also proposed a 10-for-1 reverse stock split, which is “subject to shareholder approval.” The stock split would consolidate every 10 Class A and Class B shares into one share and increase the nominal value from $0.05 to $0.50 without issuing fractional shares.
This will allow the company to position its shares within a more conventional trading range preferred by institutional investors, it said.


Bitcoin exchange supply has fallen to a record low, highlighting tightening supply even as high-profile investors move large sums of the asset onto trading platforms. On-chain analytics firm Arkham Intelligence reported that the Winklevoss twins transferred roughly $130 million in…

As the S&P 500 chart (US SPX 500 mini on FXOpen) shows, the index is trading near the 6,800 level this morning. However, the balance between supply and demand could change significantly after the release of the Consumer Price Index (CPI) report scheduled for 15:30 GMT+3.
Against the backdrop of military developments in the Middle East and sharp movements in oil prices (as we previously noted, the WTI market remains volatile), today’s data will be an important factor for traders assessing the future policy path of the Federal Reserve. According to Forex Factory, analysts expect headline inflation to remain at 2.4%.

Technical Analysis of the S&P 500 Chart
The chart shows that the 7,000-point psychological level acted as an important threshold at the beginning of 2026 — the price attempted to move above it but failed. It is worth recalling that we highlighted early bearish signals in the article “S&P 500 Hits a Record – But Is Everything Really So Positive?” as early as 13 January.
Since then, bearish pressure has led to:
→ the formation of the descending trend line R;
→ the trading channel (originating in late 2025) being extended downward twofold in early March.
In the context of recent S&P 500 price action, it is important to note that:
→ the lower boundary of the expanded channel has acted as support;
→ the median line is currently showing signs of resistance.
Also note the increasing importance of the 6,700 area:
→ a bearish gap formed there at the beginning of this week;
→ however, the price later moved sharply above this gap, meaning it could potentially act as support in the future.
In the near term, it is reasonable to expect that the release of the data may trigger a spike in S&P 500 volatility. It is possible that the price will test either the red trend line R or the highlighted support area.
Trade global index CFDs with zero commission and tight spreads (additional fees may apply). Open your FXOpen account now or learn more about trading index CFDs with FXOpen.
This article represents the opinion of the Companies operating under the FXOpen brand only. It is not to be construed as an offer, solicitation, or recommendation with respect to products and services provided by the Companies operating under the FXOpen brand, nor is it to be considered financial advice.

Decentralized finance (DeFi) has revolutionized the way users interact with financial services, removing intermediaries and enabling permissionless access to lending, trading, and asset management. Yet, as the ecosystem has grown, so have the risks: market volatility, liquidity crises, and exploits can cause sudden, severe disruptions. Enter Self-Healing Protocols, a class of smart contracts designed to anticipate, react, and adapt to adverse conditions automatically.
What Are Self-Healing Protocols?
A self-healing protocol is a smart contract system engineered to respond dynamically to stress events. Rather than relying solely on governance intervention or manual adjustments, these protocols can automatically:
-
Adjust incentives: For example, increasing yield rewards to encourage liquidity provision when a pool is undercapitalized.
-
Rebalance pools: Automatically shift liquidity between pools or adjust token weights to maintain stability and minimize slippage.
-
Redistribute risk: Move exposure away from highly leveraged positions or risky assets to protect the system during market crashes.
These mechanisms essentially allow a protocol to “heal itself” in response to abnormal conditions, reducing systemic risk and enhancing user confidence.
How They Work
Self-healing protocols leverage a combination of on-chain oracles, algorithmic rules, and dynamic parameters. Key components include:
-
Real-Time Data Monitoring: Oracles feed the protocol with market prices, liquidity metrics, and on-chain activity.
-
Automated Trigger Mechanisms: Smart contracts detect stress conditions—like a sudden liquidity drop or extreme volatility—and trigger corrective actions.
-
Dynamic Incentive Adjustments: Rewards and penalties are algorithmically recalibrated to encourage stabilizing behavior among participants.
-
Risk Redistribution Algorithms: Funds can be automatically reallocated across pools, vaults, or derivatives to minimize the impact of defaults or liquidations.
Some protocols also integrate simulation engines that run stress-test scenarios on-chain to anticipate potential crises before they escalate.
Benefits of Self-Healing Protocols
-
Reduced Governance Lag: Human intervention is often slow and reactionary. Self-healing protocols act instantly.
-
Resilience Against Market Shocks: Liquidity imbalances and sudden withdrawals are mitigated before they snowball.
-
Improved User Trust: Knowing that a protocol can adapt autonomously increases confidence among liquidity providers and traders.
-
Enhanced Composability: Other DeFi products can safely integrate with self-healing protocols without inheriting all the risk.
Challenges and Considerations
Despite their promise, self-healing protocols are not without challenges:
-
Complexity and Audit Risk: More logic means more potential for bugs. Thorough audits are critical.
-
Oracle Dependence: Reliance on external data sources can introduce new points of failure.
-
Economic Exploits: Sophisticated actors may attempt to game dynamic incentive mechanisms.
-
Transparency vs. Flexibility: Too much automatic adjustment can be hard for users to understand, possibly reducing adoption.
Looking Ahead
Self-healing protocols represent a frontier where algorithmic finance meets resilience engineering. Projects exploring this concept could redefine how DeFi handles risk, moving the ecosystem closer to fully autonomous, self-stabilizing financial networks.
As DeFi matures, these protocols may become a standard layer of protection, much like insurance or circuit breakers in traditional finance—but fully automated and embedded in code.
REQUEST AN ARTICLE
XRP price has been forming a major bullish reversal pattern over the past three weeks. If confirmed, it could lead to a sharp rebound in the token’s price.
Summary
- XRP price fell 4% on Wednesday as markets braced for the release of U.S. CPI data.
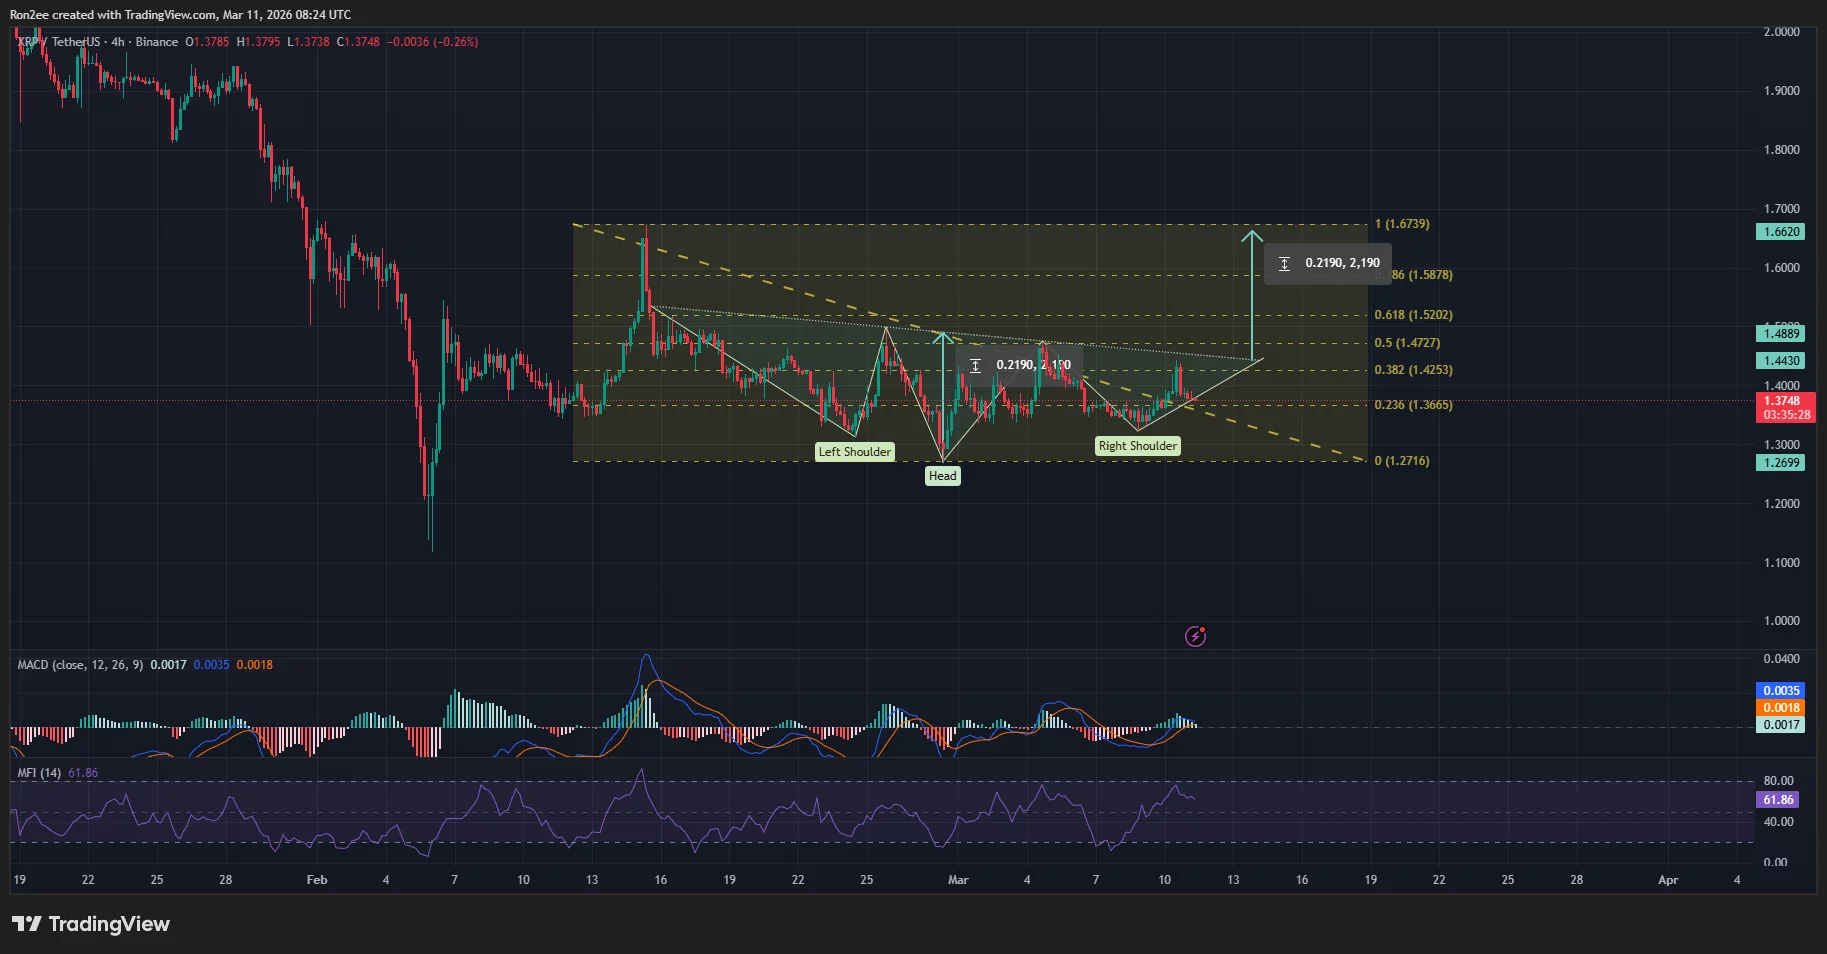
- XRP is close to confirming an inverse head and shoulders pattern on the 4-hour chart.
According to data from crypto.news, XRP (XRP) price fell 4% to $1.38 last check on Wednesday, March 11. The fifth-largest crypto asset, with a market cap of $84.5 billion, has dropped nearly 16% from its February high and over 40% from its highest point this year.
XRP price fell as investors remained cautious ahead of the release of U.S. CPI data, set to be released later today. A hotter-than-expected print could force the Fed to maintain its restrictive policy stance, while a cooler reading could alleviate pressure and potentially trigger a pivot, boosting investor demand for risk assets.
While investors remain in the wait-and-watch mode over signs of persistent inflation, a look at XRP charts provides an interesting technical outlook.
On the 4-hour XRP/USDT chart, XRP price action has been shaping an inverse head and shoulders pattern over the past three weeks.

The pattern is formed when an asset creates three distinct troughs called shoulders with a deeper middle trough that forms the head of the pattern. Once confirmed, it has typically been followed by sustained rallies over subsequent sessions.
For now, the next key resistance level lies at $1.42, which aligns with the 38.2% Fibonacci retracement level.
A decisive breakout from it could confirm the pattern. Once confirmed, XRP price could springboard to $1.67, a target calculated by adding the height of the inverse head and shoulders pattern formed to the point at which it would break above the neckline of the pattern.
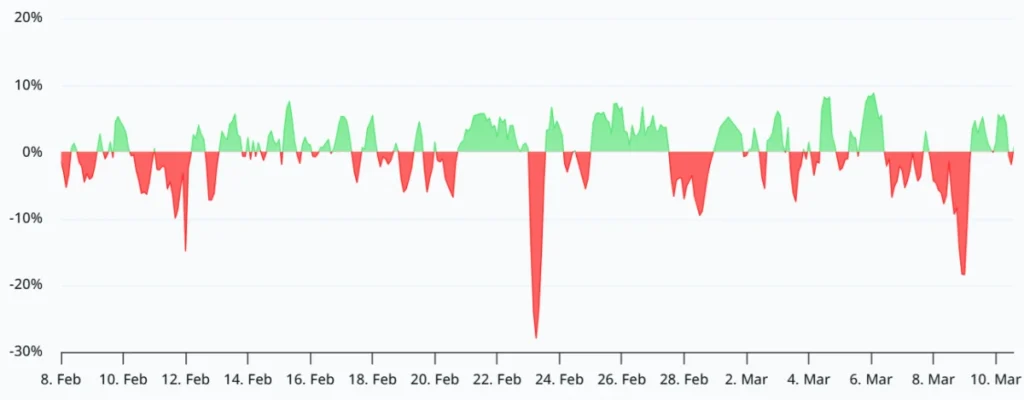
Momentum indicators suggested that bulls were at an advantage at press time. The MACD lines, which measure the strength of price trends, were pointing upwards while the Money Flow Index showed a reading of 62, signaling healthy buying pressure.
One major catalyst that could serve as a tailwind for XRP price is demand across the derivatives market. Notably, XRP’s weighted funding rate has turned negative. When funding rates turn negative, it signals that the market has become heavily one-sided, with short sellers effectively paying long holders to maintain their bearish bets.
If XRP price experiences a potential short squeeze, it could be the primary engine that drives the price through the $1.42 neckline to confirm the inverse head and shoulders pattern.
Disclosure: This article does not represent investment advice. The content and materials featured on this page are for educational purposes only.

Ethereum price continues to move sideways even as its on-chain activity surges, highlighting a growing divergence between network fundamentals and short-term market performance.
Summary
- Data from CryptoQuant shows Ethereum’s active addresses reaching near-record levels, signaling growing participation across DeFi, stablecoins and smart-contract interactions.
- Rising on-chain usage suggests strengthening fundamentals for Ethereum despite mixed price performance in recent weeks.
- ETH is trading around $2,020, with $2,207 (50-day SMA) acting as the next resistance while $1,950–$2,000 remains a crucial support zone for traders.
According to analysis from CryptoQuant, the number of active Ethereum (ETH) addresses has climbed to some of the highest levels in the network’s history, signaling increased participation across the ecosystem.
The rise in active addresses suggests expanding usage in key sectors such as decentralized finance (DeFi), stablecoins and automated smart-contract activity. These segments often generate frequent on-chain transactions, which can push address activity higher even during periods when prices remain relatively subdued.

The data indicates that network adoption continues to grow despite mixed market sentiment, a divergence that analysts often view as a constructive long-term signal.
Rising activity can reflect increasing demand for block space and applications built on Ethereum, potentially strengthening the blockchain’s fundamental outlook over time.
However, the price of Ethereum has yet to fully reflect the growing on-chain momentum.
Ethereum price analysis
Ethereum is currently trading around $2,020, according to the attached price chart.

The asset remains below the 50-day simple moving average near $2,207, which now serves as the primary resistance level. A decisive move above this level could signal a shift in short-term momentum and open the door for a retest of the $2,200–$2,300 zone.
On the downside, Ethereum appears to have established near-term support around $1,950–$2,000, a range where buyers have repeatedly stepped in following the sharp selloff seen in early February.
Momentum indicators suggest the market is still in a consolidation phase. The Bull Bear Power (BBP) indicator on the chart has recently turned slightly positive after an extended period of negative readings, hinting that bearish pressure may be gradually weakening.
If Ethereum manages to hold above the $2,000 psychological level, traders may begin watching for a potential attempt to reclaim the 50-day moving average.
Conversely, a breakdown below support could expose the market to another test of $1,900.
Taken together, the current setup highlights a notable contrast: Ethereum’s network activity is strengthening rapidly, while its price continues to consolidate, leaving traders closely watching whether growing adoption will eventually translate into upward price momentum.

Whether Antalpha plans a full exit or simply a partial realization remains to be seen, but the latest transfer suggests the firm is beginning to actively manage its highly profitable gold position.
Is gold’s top in? Well, Antalpha – a leading fintech company, which made a massive bet on the asset, seems to lean in this direction.
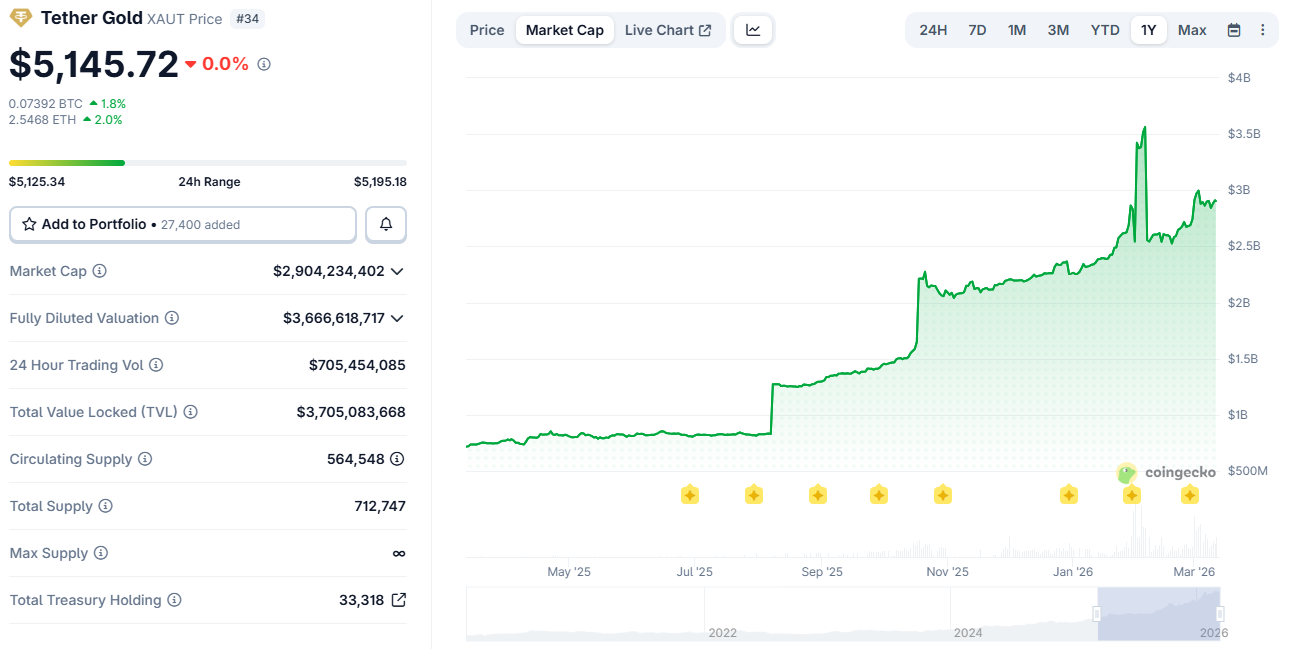
The company appears to be locking in profits after its bet on tokenized gold – more specifically, Tether Gold (XAUt). The firm purchased a whopping $241 million worth of XAUt, representing an astonishing 1.8 tonnes of physical gold, at an average price of $3,693 per ounce.
With gold prices skyrocketing over the past months, the position is now sitting on over $100 million in unrealized profit.
On-chain activity documented by Arkham suggests that the company may be starting to move part of that position. Just recently, $15 million worth of XAUt was transferred from associated wallets to crypto custody platform Cobo, which raises questions if they are preparing to offload.
Massive Bet on Tokenized Gold
To those unaware, Tether Gold (XAUt) is a blockchain-based token that’s backed by physical gold. The latter is stored in a Swiss vault, and each token represents one troy ounce of gold.
As CryptoPotato reported earlier this month, tokenized gold is one of the hottest market segments and one that institutions have been getting increasingly involved in.
For reference, XAUt’s total market capitalization increased from around $800 million in August 2025 to almost $3 billion today.
You may also like:
Antalpha’s $241 million purchase stands out as one of the largest recent allocations in the asset class. It’s worth noting that at the time of their buy, gold prices were already trending higher amid central bank demand, macro uncertainty, and continued investor interest in hedge assets. The rally has since turned the position into an incredibly profitable trade.
But is Antalpha Taking Profits?
The $15 million transfer to Cobo could be a signal that the company will be realizing profits, but it does not necessarily confirm an immediate sale.
Custody platforms are commonly used to rebalance portfolios, execute OTC trades, or collateralize positions.
Still, the move comes at a time when gold prices are near to historically high prices, which makes it a very logical moment for large holders to start securing profits.
Binance Free $600 (CryptoPotato Exclusive): Use this link to register a new account and receive $600 exclusive welcome offer on Binance (full details).
LIMITED OFFER for CryptoPotato readers at Bybit: Use this link to register and open a $500 FREE position on any coin!

TLDR
- Shares of Centene plummeted 14% Tuesday, claiming the title of S&P 500’s biggest loser for the session
- Membership in ACA programs projected to decline to 3.5 million members by Q1 conclusion, a steep fall from December’s 5.5 million
- Management stood by its 2026 adjusted EPS forecast of above $3
- Mizuho Securities downgraded its price objective from $47 down to $41 while keeping a Neutral stance
- Medicare Advantage operations continue to operate at a loss and won’t reach profitability until after 2026
Investors in Centene have experienced a turbulent 2026, and Tuesday’s trading session only amplified the pain. The managed care provider’s shares tumbled 14% following remarks made by CEO Sarah London during her presentation at the Barclays Global Healthcare Conference, where her disclosure about plunging enrollment figures sent shockwaves through the market.
During her presentation, London informed conference participants that all three primary business segments at Centene continue to perform in line with 2026 projections. She confirmed the company’s adjusted earnings forecast of more than $3 per share — a figure that aligns precisely with the $3 consensus among analysts tracked by FactSet.
However, the market response was far from positive. With the guidance failing to deliver any upward revision, market participants focused their attention on the troubling membership trends.
The health insurer now projects ACA marketplace enrollment will sink to 3.5 million by the conclusion of the first quarter, representing a dramatic decrease from the 5.5 million members it had in December. As of the most recent February data, enrollment stood at 3.6 million participants.
London revealed that company leadership had predicted the overall marketplace would contract “somewhere between the high teens and the mid-thirties” on a percentage basis. She noted Centene anticipated finishing “at the higher end of that and possibly higher than the top end of that.”
She explained that some of the membership decline stems from strategic pricing adjustments implemented at year’s start, where the company chose to emphasize profitability enhancement rather than expanding its member base.
Medicare Advantage Still a Drag
The Medicare Advantage segment at Centene remains a significant headwind for overall performance. Profitability in this division was negative throughout 2025 and is projected to stay marginally unprofitable during 2026, with management targeting break-even status by 2027.
Adding to market uncertainty is the pending final rate announcement from the Centers for Medicare and Medicaid Services, scheduled for release by April 6 at the latest. The Trump administration’s earlier proposal to maintain essentially flat Medicare reimbursement rates for 2027 triggered widespread selling in Centene shares and throughout the managed care sector.
London disclosed that Centene had filed formal commentary with CMS regarding the Advance Rate Notice and voiced optimism that the final rate schedule would more appropriately account for current medical cost inflation trends affecting the entire industry.
Analyst Reaction
Mizuho responded swiftly following the conference presentation. The investment firm reduced its price objective on Centene shares to $41 from the previous $47 while maintaining its Neutral rating.
Mizuho pointed to worries surrounding health insurance marketplace attrition and specialty pharmaceutical cost pressures. The firm indicated it would employ a more cautious valuation approach until greater visibility emerges regarding the ultimate severity of the enrollment deterioration.
Truist Securities adopted a more constructive perspective, preserving its Buy recommendation with a $49 price objective, highlighting margin expansion potential and confidence from executive leadership. Cantor Fitzgerald maintained its Neutral position with a $41 target, characterizing the 2026 operating landscape as difficult.
For perspective, Centene shares have declined 9.7% during 2026, compared to a modest 0.7% pullback for the broader S&P 500 index.
Despite the selloff, the stock has actually outperformed several competitors. Molina Healthcare has retreated 17% year-to-date, Elevance Health is off 18%, and UnitedHealth Group has lost 14%.
Centene’s fourth quarter 2025 results revealed an adjusted diluted loss per share of $1.19, which marginally surpassed expectations for a $1.22 loss. Total revenue reached $49.73 billion, exceeding the anticipated $48.39 billion.
InvestingPro estimates Centene’s fair value at $62.11, with Wall Street analysts forecasting full-year 2026 EPS of $3.05.


Bitcoin retreats from $71,700, ICP jumps on Upbit listing: Crypto Markets Today

Zendaya’s Jewellery At Paris Fashion Week Sparks Wedding Buzz

Kargese and Danny Mullins upstage Kopek Des Bordes & Lulamba


-
Business5 days ago
Form 8K Entergy Mississippi LLC For: 6 March
-

 Tech6 days ago
Bitwarden adds support for passkey login on Windows 11
-

 News Videos2 days ago
10th Algebra | Financial Planning | Question Bank Solution | Board Exam 2026
-

 Fashion5 days ago
Weekend Open Thread: Ann Taylor
-

 Crypto World2 days ago
Paradigm, a16z, Winklevoss Capital, Balaji Srinivasan among investors in ZODL
-
 Tech3 hours ago
A 1,300-Pound NASA Spacecraft To Re-Enter Earth’s Atmosphere
-
 Sports6 days ago
499 runs and 34 sixes later, India beat England to enter T20 World Cup final | Cricket News
-

 Sports4 days ago
Three share 2-shot lead entering final round in Hong Kong
-

 Sports3 days ago
Braveheart Lakshya downs Lai in epic battle to enter All England Open final | Other Sports News
-

 Politics5 days ago
Top Mamdani aide takes progressive project to the UK
-

 Business18 hours ago
ExxonMobil seeks to move corporate registration from New Jersey to Texas
-

 NewsBeat6 days ago
Piccadilly Circus just unveiled ‘London’s newest tourist attraction’ and it only costs 80p to enter
-

 Entertainment4 days ago
Hailey Bieber Poses For Sexy Selfies In New Luscious Lip Thirst Traps
-

 Business3 days ago
Search for Nancy Guthrie Enters 37th Day as FBI Probes Wi-Fi Jammer Theory
-
 NewsBeat1 day ago
Pagazzi Lighting enters administration as 70 jobs lost and 11 stores close across Scotland
-

 Business3 hours ago
Search Enters Sixth Week With New Leads in Tucson Abduction Case
-

 Tech2 days ago
Despite challenges, Ireland sixth in EU for board gender diversity
-
Entertainment6 days ago
Harry Styles Has ‘Struggled’ to Discuss Liam Payne’s Death
-

 Crypto World6 days ago
New Crypto Mutuum Finance (MUTM) Reports V1 Protocol Progress as Roadmap Enters Phase 3
-

 Tech6 days ago
ACIP To Discuss COVID ‘Vaccine Injuries’ Next Month, Despite That Not Being In Its Purview