

Crypto World
How bombing Iran shifted oil and bitcoin prices

Since the world learned of massive US military deployments toward Iran on February 18, crude oil has rallied 36%, far surpassing bitcoin’s (BTC) 2.8%.
War-related headlines have definitely affected BTC which, with its 24-hour spot trading venues, has served as a trillion-dollar proxy for risk-on assets.
By charting the price of oil relative to BTC from the de facto start of the war, some of the conflict’s most critical moments become clear.
As a reference price for their pre-wartime starting points, at 12:15am New York time on February 18, BTC traded at $67,833. Oil, specifically contracts for difference (CFDs) on WTI crude, were trading at $62.39 per barrel.
At that time, open-source intelligence accounts began documenting “the largest US Air Force combat buildup in Europe and the Middle East since the Gulf War,” listing dozens of tankers, F-22s, and F-16s repositioning toward the Persian Gulf and Iran.
Chart 1: Price reaction to historic US naval movements toward Iran
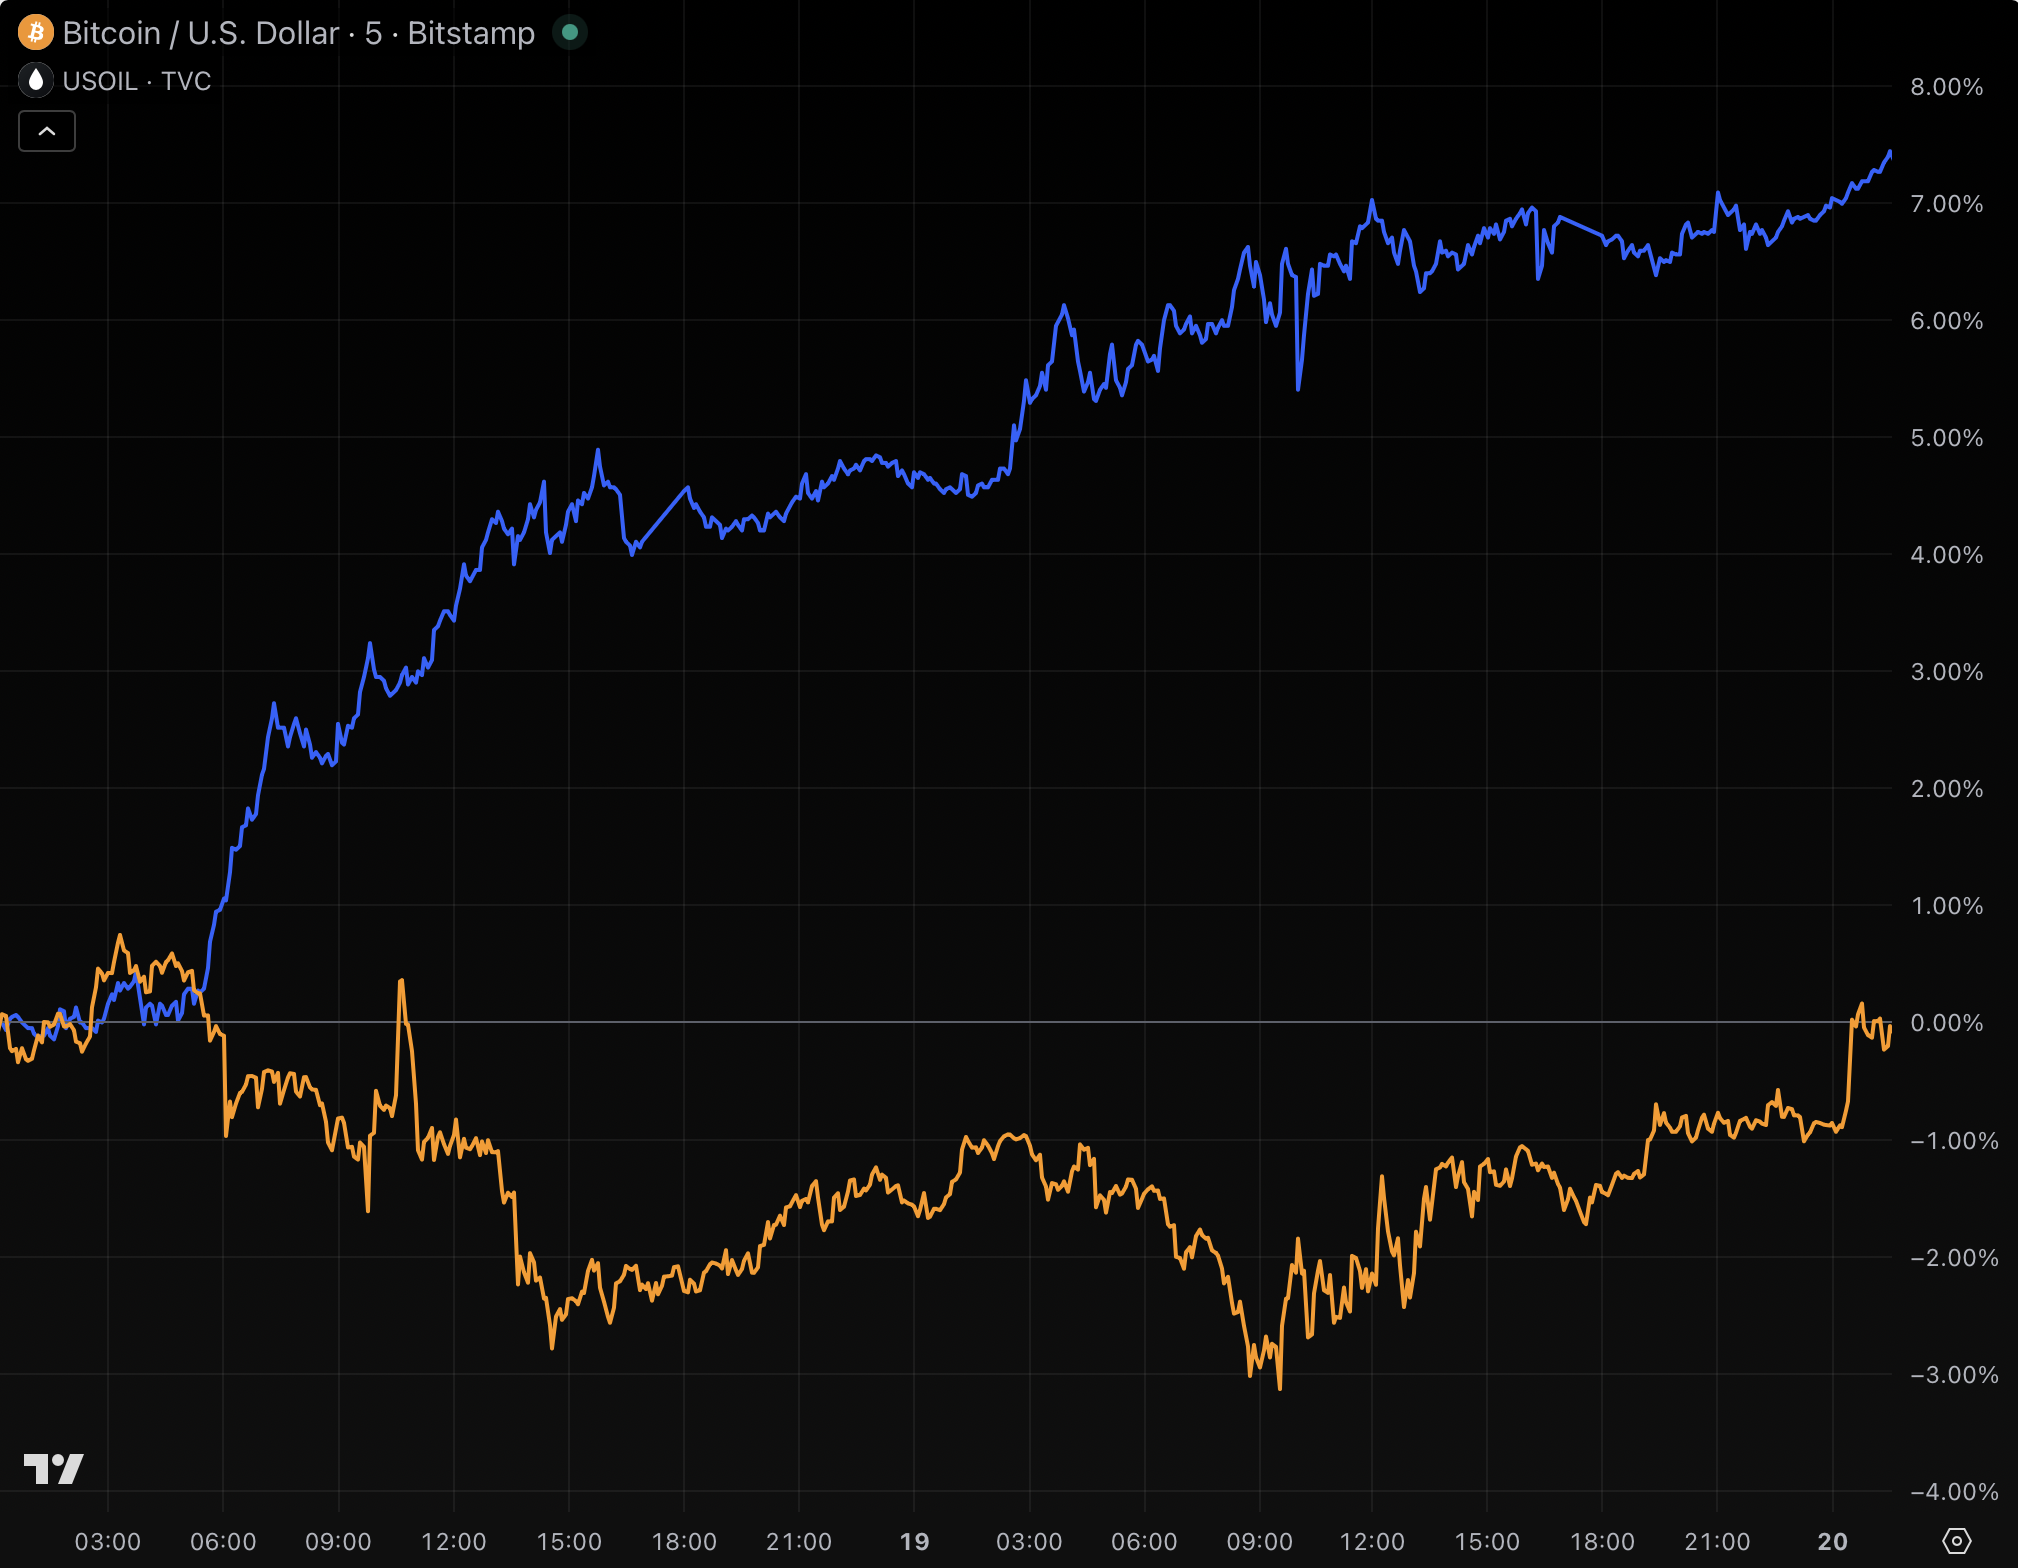
The onset of war became obvious, and oil prices responded to the likelihood of supply restrictions. CFDs for the world’s most-traded and arguably most important commodity rallied without interruption for hours, and by two days later, oil had jumped 7% to $66.76 per barrel.
BTC, meanwhile, barely budged to $67,376, a near-flat 48-hour performance from its $67,833 start.
The divergence in those first 48 hours set the template for what followed.
Oil immediately priced in an imminent kinetic war. BTC did not.
The sophistication of oil traders relative to BTC traders was obvious during those first two days.
Slowly, as anyone should expect from the class of risk-on investments as threats become too obvious to ignore, BTC slid deeper into the red after the initial military buildup reports, hitting a low of $62,525 a week later on February 24, a 7.8% decline from its 12:15am start on February 18.
Oil, in contrast, had already begun a steady climb as more confirmation of military intent trickled into the mainstream news cycle. War was inevitable, and oil traders knew it.
Chart 2: Price reaction to official announcement of war
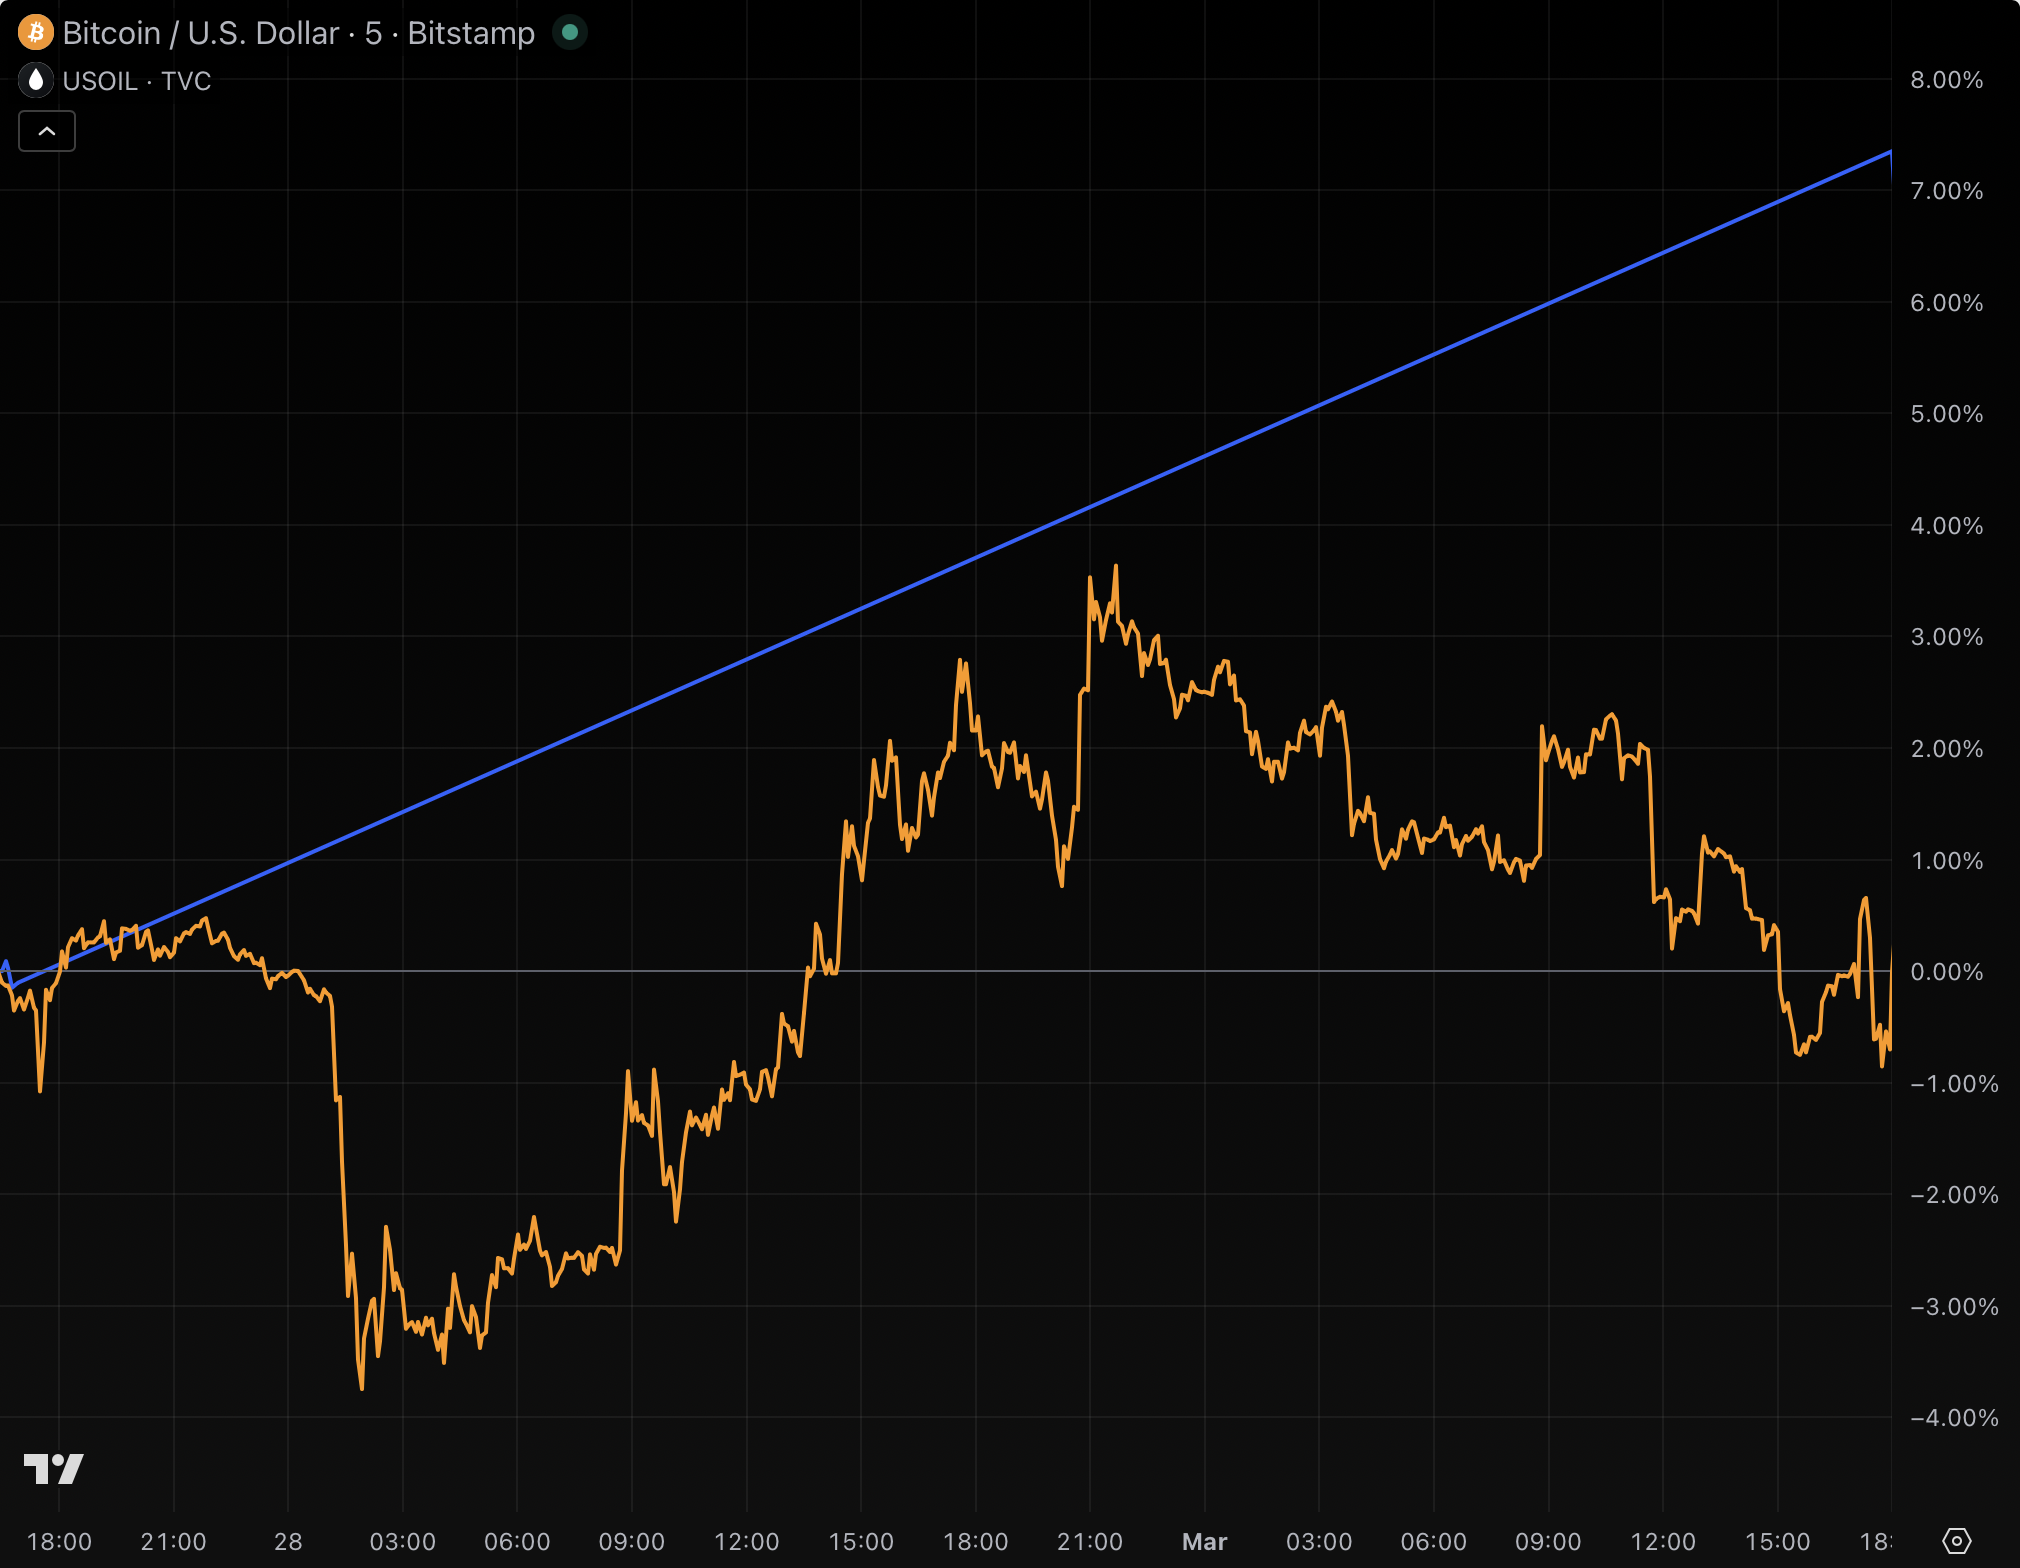
Finally, at 1:15am New York time on February 28, US and Israeli airstrikes on Iran formally commenced under the banner of “Operation Epic Fury.” Donald Trump announced the operation via Truth Social.
At this time, BTC was trading at $65,492. However, because the announcement fell on a weekend, oil CFDs weren’t open for trading, so there’s no way to know exactly how high oil would have traded.
Unfortunately, the most recent simultaneous price for both assets was February 27 at 5pm New York time: BTC at $65,524 and oil at $67.28 per barrel.
BTC panicked on the initial, formal announcement from Trump. Within 30 minutes, it dropped 3.8% to $63,037. It then recovered.
By Sunday, March 1 at 6pm New York time, when oil CFDs resumed trading, crude had gapped up 11.5% to $75 per barrel.
BTC, at $65,245, remained essentially flat since Trump’s formal announcement.
Oil was already repricing supply disruptions through the Strait of Hormuz, where Iran’s Islamic Revolutionary Guard Corps was threatening to block tanker traffic. BTC wasn’t. It had already sold off slightly from its pre-war, $67,833 start.
Oil surges 91% to $119 per barrel, while BTC recovers its mild loss
The war escalated quickly, sending the price of oil skyrocketing, but risk-on assets soon recovered entirely.
Iran tried to close the Strait of Hormuz, briefly disrupting roughly 20% of global oil supply. Tanker traffic through the chokepoint dropped 81%. Airports and US bases throughout the Middle East took on drone and missile damage.
Oil producers declared force majeure on contracts. Drone strikes hit Saudi Arabia’s largest refinery and Qatari export facilities. Gulf oil production collectively fell by 6.7 million barrels per day by March 10.
Incredibly, oil prices wicked up to $119.48 per barrel at 10:32pm New York time on March 8, a 91.5% surge from its February 18 baseline. BTC peaked much earlier, at $74,075 on March 4 at 2:15pm New York time, for a comparatively modest 9.2% gain.
By 10:40pm New York time on March 10, oil had pulled back 29% from its peak to $84.86 per barrel, partly on comments from Trump suggesting the conflict would resolve “very soon.”
BTC sat at $69,725.
Read more: Bitcoin up, Dubai real estate down since Iran war began
Chart 3: From start to finish, two wildly different returns
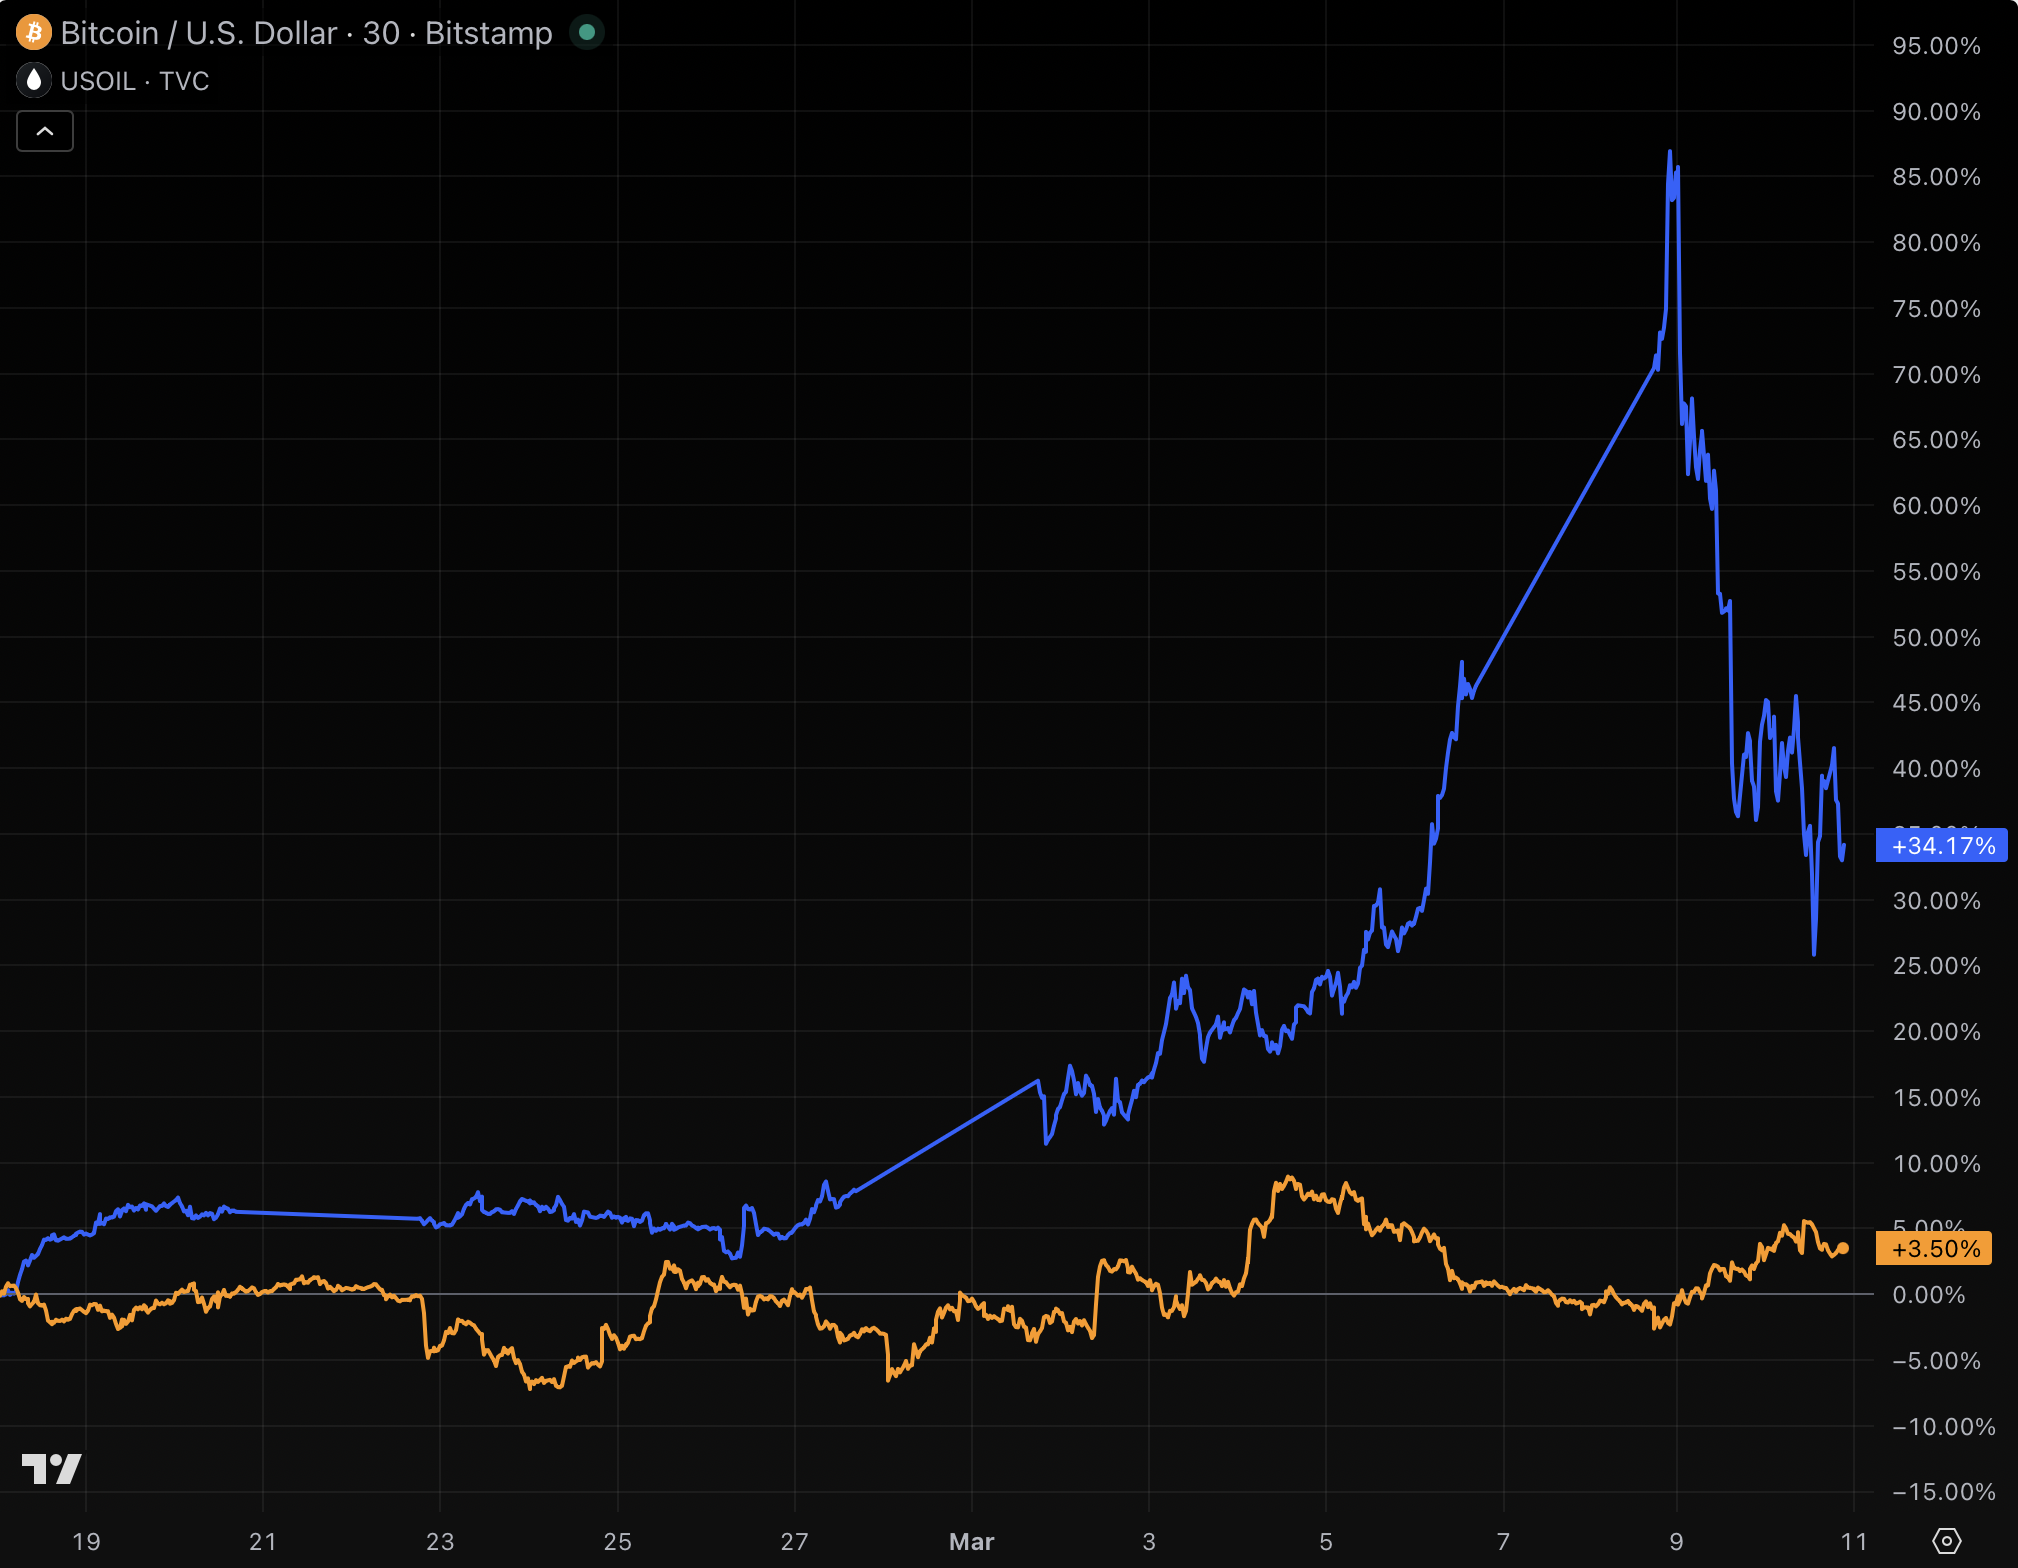
In the roughly three weeks since the start of the war, oil has gained approximately 35% while BTC as a risk-on asset has gained approximately 3%. The above chart illustrates that time period.
Oil’s entire trading range over that time period was $62.39 to $119.48 per barrel. BTC’s range, despite its far smaller size, was a far more conservative $62,525 to $74,075.
One asset reacted to a worldwide a supply shock. The other absorbed headline volatility and largely shrugged it off.
As usual, there are many ways to trade headlines. At least across the opening weeks of this war, oil scarcity has been the bullish trade. BTC was the hold.
Got a tip? Send us an email securely via Protos Leaks. For more informed news, follow us on X, Bluesky, and Google News, or subscribe to our YouTube channel.

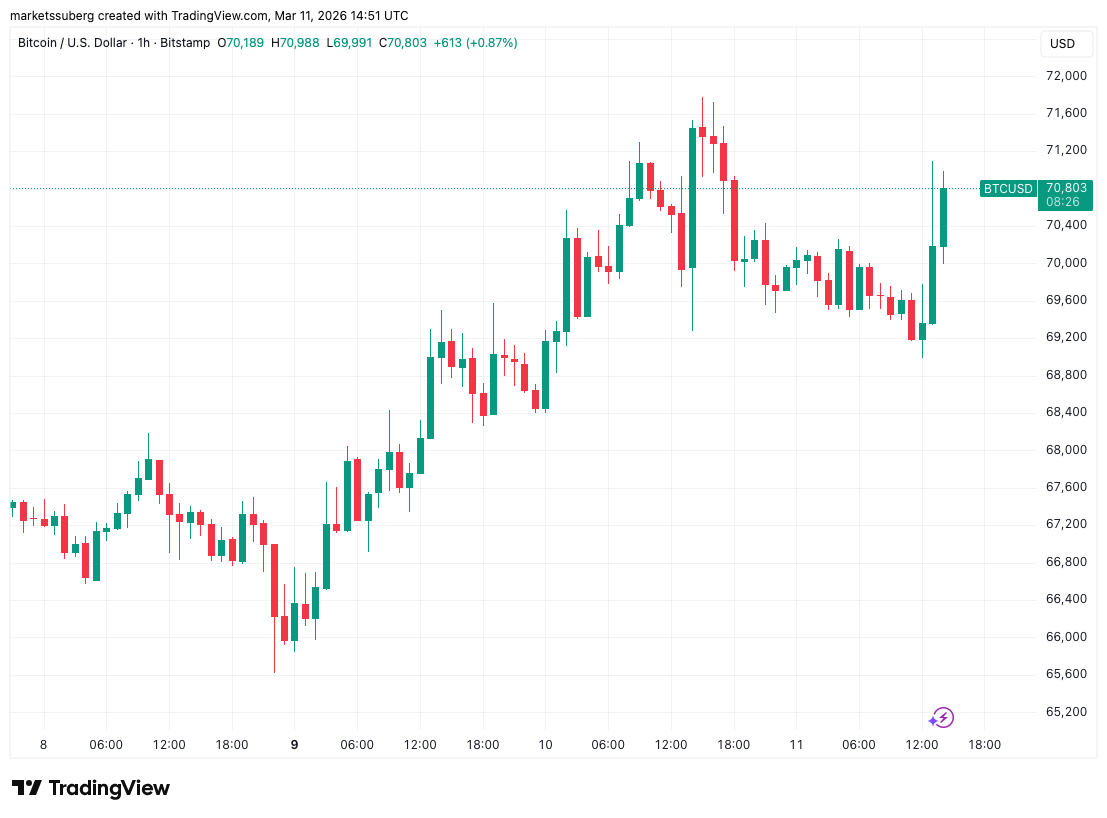
Bitcoin (BTC) broke back above $70,000 around Wednesday’s Wall Street open as US inflation data soothed anxious markets.
Key points:
-
Bitcoin bounces around a narrow range as US inflation data offers a modest tailwind.
-
Oil prices stay lower as an emergency release of 400 million barrels is confirmed.
-
BTC price expectations focus on future liquidations in the mid-$60,000 zone.
Bitcoin edges higher as CPI matches expectations
Data from TradingView showed BTC price action eking out modest gains, while failing to match local highs from the day prior.

The February print of the US Consumer Price Index (CPI) was in line with expectations at 2.4% year-on-year, per data from the Bureau of Labor Statistics (BLS).
“Over the last 12 months, the all items index increased 2.4 percent before seasonal adjustment,” it confirmed in an official statement.

This was a relief for risk assets already on edge over geopolitical instability and its potential impact on inflation. The Middle East conflict and global oil supply squeeze, however, were likely only to be truly reflected in March’s inflation data.
“The market will now await March’s data,” trading resource The Kobeissi Letter thus wrote in a response on X.
Other recent inflation gauges missed anticipated levels both to the upside and downside, making for a shaky overall picture of inflationary forces even before events in Iran.
Oil, a key risk factor for CPI going forward, stayed below the $90 mark on the day as the International Energy Agency (IEA) approved the emergency release of 400 million barrels — the largest such release ever recorded.

Trader eyes BTC price “breakout upwards” in March
With price still rangebound, Bitcoin market participants chose not to bet big up or down.
Related: Bitcoin faces ‘highly volatile’ setup as bulls eye return to $80K by month-end
“Very simple; buy the lower bounds, sell the higher bounds,” trader, analyst, and entrepreneur Michaël van de Poppe told X followers.
“I still think we’ll see that breakout upwards in this month to test higher grounds, but if not, I’m a buyer on lower levels.”

Trader Lennaert Snyder eyed downside liquidity for a potential local low, suggesting that this could come at around $65,000.
$BTC is compressing pre-CPI.
Bitcoin swept ~$71,563 liquidity and rejected like I mentioned yesterday.
I’m already in some shorts, and I’m willing to add if we get a MSB by losing the ~$69,268 low.
My short target will be the liquidity at ~$65,957. Letting 10% open for a… pic.twitter.com/DN3rb9lTha
— Lennaert Snyder (@LennaertSnyder) March 11, 2026
Data from monitoring resource CoinGlass put 24-hour crypto market liquidations at $240 million, with short positions accounting for a larger slice of the total.

This article does not contain investment advice or recommendations. Every investment and trading move involves risk, and readers should conduct their own research when making a decision. While we strive to provide accurate and timely information, Cointelegraph does not guarantee the accuracy, completeness, or reliability of any information in this article. This article may contain forward-looking statements that are subject to risks and uncertainties. Cointelegraph will not be liable for any loss or damage arising from your reliance on this information.

Editor’s note: As TransFi marks a major milestone in cross-border payments, the company reports more than $1 billion in processed volume and a broadened network reaching 70+ countries and 250+ payment methods. This expansion highlights growing demand from businesses for faster, more reliable money movement, especially in Asia, Latin America, and the Middle East, where payroll, remittances, vendor payouts, and treasury moves are increasingly based on modern infrastructure rather than legacy rails. The press release underscores how real-world use cases are driving the shift toward streamlined, global finance that works for high-growth markets.
Key points
- TransFi surpasses $1B in processed volume on its platform.
- Expanded cross-border reach to 70+ countries with 250+ payment methods.
- Focus on real-world use cases: payroll, remittances, vendor and trade payouts, and e-commerce checkouts.
- Plans to reach $5B processed volume in the next 12 months based on current pipeline.
Why this matters
This milestone signals a shift toward faster, more predictable cross-border payments in emerging markets, where legacy rails are costly and fragmented. TransFi’s broader coverage and local-language support aim to unlock opportunities for businesses expanding across Asia, Latin America, and the Middle East, enabling payroll processing, remittances, vendor payouts, and treasury movements with greater speed, transparency, and control that improves cash flow planning in high-growth markets.
What to watch next
- TransFi is set to achieve $5 billion processed transaction volume in the next 12 months.
- Expansion to more countries and additional payment methods continue to broaden use cases.
- Raj Kamal, CEO and Founder, is available for an interview to discuss the announcement and broader trends.
Disclosure: The content below is a press release provided by the company/PR representative. It is published for informational purposes.
TransFi Hits $1B in Processed Volume, Expands to 70+ Countries
Dubai, UAE, 10 March 2026–TransFi, a global payments infrastructure and orchestration company focused on emerging markets, today announced that it has surpassed $1 billion in processed volume on its platform, marking a significant milestone in the company’s growth.
The company also said it is set to achieve $5 billion processed transaction volume in the next 12 months, based on the current pipeline and expected business conversions, reflecting growing demand from businesses seeking faster, more reliable, and more accessible cross-border payment infrastructure.
TransFi now supports payments across 70+ countries and 250+ payment methods, enabling cross-border transfers on stablecoin rails with a particular focus on key emerging markets across Asia, Latin America, and the Middle East.
The platform supports a range of real-world business use cases, including payroll processing, remittances, vendor and trade payouts, and checkout for e-commerce platforms. TransFi’s infrastructure is designed to help businesses move money across borders with greater speed, predictability, and transparency, while reducing friction in markets where legacy payment rails can be costly, fragmented, or unreliable.
“Cross-border payments remain too slow, too opaque, and too difficult to navigate in many of the markets where businesses need reliable infrastructure the most,” said Raj Kamal, Founder and CEO of TransFi. “Crossing the $1 billion mark is an important milestone for us, but more importantly, it reflects a wider shift in how businesses are approaching global money movement. Companies increasingly want payment infrastructure that is fast, predictable, easy to use, and built for the realities of emerging markets.”
TransFi’s value proposition is centered on helping businesses accesspredictable and fast payments, transparent services, simple onboarding, broad local payment method coverage, and 24×7 customer support in local languages. By combining global reach with localized payment access, the company aims to make cross-border transactions more inclusive and operationally practical for businesses serving high-growth markets.
As businesses expand across borders and expectations for always-on payments continue to rise, TransFi is focused on building infrastructure that supports global commerce with stronger coverage, greater reliability, and a better user experience for both enterprises and end customers.
About TransFi
TransFi is a global payments infrastructure and orchestration company providing secure, reliable, and compliant cross-border payments for businesses and individuals, with a focus on emerging markets.
Operating across 100+ countries, 250+ payment methods, and 40+ currencies, TransFi enables real-time global payments with seamless onboarding, reduced friction, and competitive pricing.
Website: www.transfi.com
Media Contact
Crypto World
ECB unveils tokenized finance roadmap as Europe pushes to reduce reliance on foreign infrastructure


The European Central Bank on Wednesday unveiled the timeline for the eurozone’s initiative to shape the development of a tokenized wholesale financial ecosystem based around the single currency and ensure the euro’s continued relevance as an international currency.
The strategy comprises Pontes, a distributed ledger technology (DLT) layer for transactions seen debuting in the third quarter, and Appia, which will “focus on working with the market to develop an entirely innovative and integrated financial market ecosystem embracing tokenisation and DLT,” the bank said in a post on its website.
Appia is the heart of the strategy and is planned to run through 2028, when the Eurosystem — the monetary authority comprising the ECB and euro-using nations’ central banks — plans to publish a blueprint outlining its vision for a tokenized financial ecosystem. It is designed to explore the long-term architecture of a tokenized financial system, including infrastructure, governance and standards.
“The initiative seeks to foster a more integrated, competitive and innovative European payments and securities environment, strengthening Europe’s strategic autonomy and resilience, and ensuring the euro’s continued relevance as an international currency,” the statement said.
European policymakers have increasingly framed financial infrastructure as a geopolitical issue, warning that reliance on non-European payment networks and dollar-centric financial systems exposes the bloc to external pressure. An analysis for the European Parliament last year found Europe’s dependence on foreign payment networks represented a “structural vulnerability” for its financial sovereignty and could become a source of geopolitical leverage.
The project is also part of the Eurosystem’s broader push to adapt financial infrastructure to the rise of distributed ledger technology, or blockchains, which allows financial assets such as bonds, funds and securities to be represented as digital tokens on shared networks.
“Appia is about building a road from today’s financial system to tomorrow’s tokenized markets, firmly grounded in central bank money,” ECB Executive Board member Piero Cipollone said in a statement.


Wells Fargo (WFC), one of the largest U.S. banks overseeing $1.7 trillion in assets, has filed a trademark application for a new digital asset-focused platform branded as WFUSD, signaling that the bank is pushing deeper into crypto and blockchain.
According to a Tuesday filing for the United States Patent and Trademark Office (USPTO), WFUSD would offer services such as “cryptocurrency payments processing,” “execute trades of digital assets” and “services featuring software for tokenization of assets,” among others.
The move mirrors global bank JPMorgan’s similar, digital asset-related trademark filing last year for “JPMD.” That foreshadowed the launch a permissioned USD deposit token under the same name on Base, the layer-2 network built on Ethereum.
In Wells Fargo’s case, the “WFUSD” trademark may hint for the offering being a tokenized deposit or stablecoin.
The bank did not re
The bank’s filing come as traditional financial institutions and global banks increasingly embrace digital assets, exploring tokenized assets and stablecoins. Last May, the Wall Street Journal reported that several U.S. banks including Wells Fargo, JPMorgan Chase (JPM), Bank of America (BAC) and Citigroup (C) held early-stage discussions to jointly launch a stablecoin.
Notably, Wells Fargo unveiled plans in 2019 to pilot an internal settlement service called Wells Fargo Digital Cash, running on the bank’s own distributed ledger technology (DLT) platform.

Editor’s note: S&P Global today releases Bitcoin volatility and market dynamics findings, highlighting Bitcoin’s shift from a niche asset to a market-connected instrument. The full report, Bitcoin Volatility Trends: A Deep Dive into Market Dynamics and Risk, examines price patterns, volatility, and the interplay with traditional markets, while noting that tokenized assets and new products introduce additional risks beyond the asset itself. As Cristina Polizu, Managing Director of S&P Global Ratings, emphasizes, volatility has trended down in the long term, yet remains linked to broader market conditions and carries custodial, smart contract, and operational risks.
Key points
- Volatility Trends: Bitcoin’s price swings are on a long-term downward trend as institutional adoption grows, with increased liquidity from futures and ETFs.
- Bitcoin Hedge Insights: Bitcoin functions more effectively as a hedge against long-term currency debasement than as a hedge against short-term inflation.
- Structural Market Risks: Bitcoin’s trading structure, featuring leveraged perpetual futures markets and automated liquidations, amplifies price volatility compared to other financial assets.
- New Product Risks: Innovations like tokenized bitcoin, ETFs, and Digital Asset Treasury companies introduce extra risks beyond the asset, including counterparty, custodial, smart contract, and operational risks.
Why this matters
This research suggests Bitcoin’s volatility is trending lower over time while its market connections deepen, linking its performance to broader financial conditions. The addition of new products and tokenized offerings can add complexity and risk, influencing how investors assess exposure to digital assets and their role in diversified portfolios.
What to watch next
- Monitor institutional adoption and liquidity trends as futures and ETFs expand.
- Watch developments in tokenized bitcoin and other new-product offerings for risk implications.
- Observe Bitcoin’s price behavior and its relationship to traditional markets as the asset evolves.
Disclosure: The content below is a press release provided by the company/PR representative. It is published for informational purposes.
S&P Global Finds Bitcoin’s Evolving Role in Markets
— Bitcoin now accounts for more than half of cryptocurrency markets’ nearly $2.33 trillion capitalization*
— Bitcoin’s price has dropped by nearly half since October 2025
— Price volatility for bitcoin is on a long-term downward trend – though it remains higher than that of traditional assets
NEW YORK (March 5, 2026) – S&P Global today published new research (see report link) examining how bitcoin has evolved from a niche asset to one with meaningful linkages to traditional financial markets.
‘Bitcoin Volatility Trends: A Deep Dive into Market Dynamics and Risk,’ provides a detailed analysis of bitcoin’s market behavior, price patterns, and market trends.
Key findings from the research reveal:
-
- Volatility Trends: Bitcoin’s price swings are on a long-term downward trend as institutional adoption grows, though they remain larger than those of traditional assets. A growing market for bitcoin futures and exchange-traded funds (ETFs) increased bitcoin adoption, which in turn increased liquidity.
- Bitcoin Hedge Insights: The analysis indicates bitcoin functions more effectively as a hedge against long-term currency debasement than as a hedge against short-term inflation.
- Structural Market Risks: Bitcoin’s trading structure, featuring leveraged perpetual futures markets and automated liquidations, amplifies price volatility compared to other financial assets.
- New Product Risks: Innovations like tokenized bitcoin, ETFs, and Digital Asset Treasury companies introduce extra risks beyond the asset, including counterparty, custodial, smart contract, and operational risks.
Cristina Polizu, Managing Director, S&P Global Ratings, said: “Our research indicates that bitcoin’s volatility has trended down over the long term, and that its behavior is increasingly linked to broader market conditions. At the same time, the added complexity of new bitcoin-related products can introduce risks beyond the asset itself, including custodial, smart contract, and operational risks.”
Bitcoin Volatility Trends: A Deep Dive into Market Dynamics and Risk,’ is part of the Look Forward research series, special reports that offer a deep dive into the most important themes, trends, and topics that are transforming the global economy.
S&P Global: Building on Growth in Digital Assets
S&P Global has continued driving growth in Digital Assets markets, underpinned by its leading analyst-driven research and opinions:
Media Contacts
Isabel Allanwood
S&P Global
Russell Gerry
S&P Global Ratings
About S&P Global
S&P Global (NYSE: SPGI) enables businesses, governments, and individuals with trusted data, expertise and technology to make decisions with conviction. We are Advancing Essential Intelligence through world-leading benchmarks, data, and insights that customers need in order to plan confidently, act decisively, and thrive economically in a rapidly changing global landscape.
From helping our customers assess new investments across the capital and commodities markets to guiding them through the energy expansion, acceleration of artificial intelligence, and evolution of public and private markets, we enable the world’s leading organizations to unlock opportunities, solve challenges, and plan for tomorrow – today. Learn more at www.spglobal.com.

Circle (CRCL) shares just delivered one of Wall Street’s sharpest equity runs of 2026. The stock closed Tuesday at $118.09, up 5.6% on the session, pushing the company’s market cap to roughly $27.81 billion.
Shares in Circle gained 42% year to date and more than doubled since bottoming near $50 in early February, outrunning an S&P 500 that’s down 1.12% and a Nasdaq 100 that’s down approximately 1% over the same stretch.
Bernstein analysts are staying bullish. The firm reiterated its “Outperform” rating on CRCL and maintained a $190 price target, implying 60% upside from current levels.
The thesis centers on accelerating stablecoin adoption and the regulatory clarity that’s making institutional deployment of digital dollars increasingly viable.
The numbers behind the call are hard to ignore. USDC’s market cap grew 73% to $75.12 billion in 2025, gaining ground on Tether as the dominant dollar-pegged token. Circle reported full-year 2025 revenue of $2.7 billion, up 64% year over year, with Q4 swinging to profitability on BlackRock-managed reserve yields.
The company beat Q4 earnings per share (EPS) estimates of $0.35 by delivering $0.43, triggering a 35% single-day surge on February 25 that marked the start of the current run.
Bernstein’s bullish thesis leans heavily on the GENIUS Act, passed in 2025, which established a federal regulatory framework for stablecoins, setting standards for reserve backing, disclosures, and oversight.
That kind of clarity is what converts institutional interest into institutional allocation. Wall Street’s appetite for regulated crypto exposure has been building steadily, and Circle’s equity is increasingly functioning as a proxy for that demand.
The Levels That Change Everything for Circle (CRCL) Shares
Right now, $120 is the level everyone is watching. CRCL closed just below that mark Tuesday, and clearing it with volume would push the stock into territory last seen during its post-IPO decline from the 2025 highs above $260.
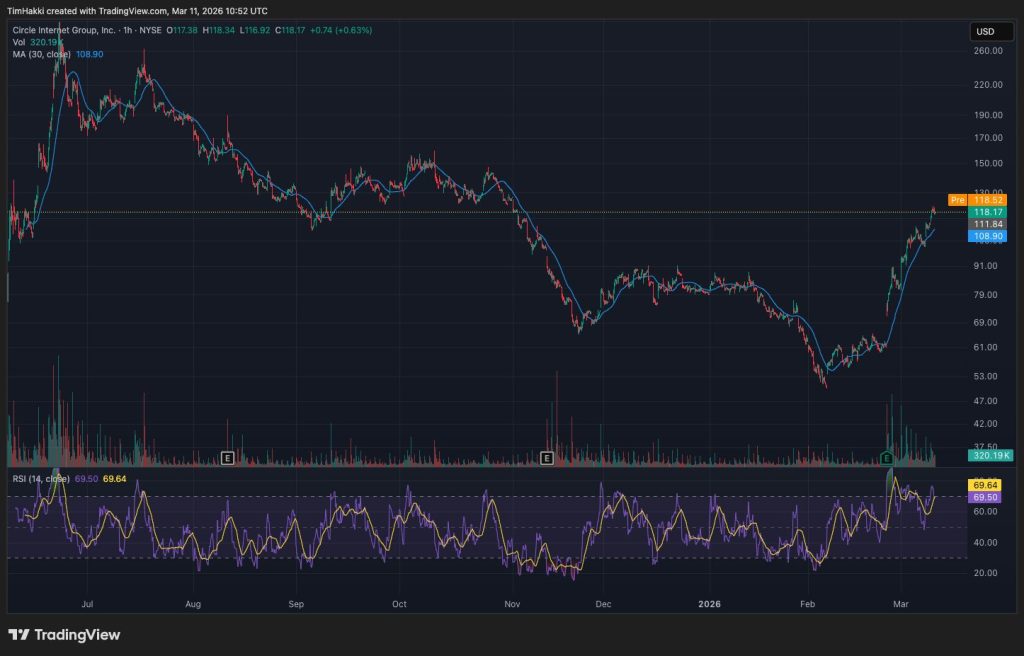
Generally, on the downside, $100 is the floor that matters. It’s a round-number psychological level and sits just below the 100-day moving average zone. If selling pressure returns and CRCL loses $100, the structure weakens quickly, and the February lows near $50 become a real reference point again.
The stock’s RSI had been near oversold territory in early February before the earnings-driven reversal, so a sustained move below $100 would reset sentiment sharply.
The Circle Payment Network is facilitating $3.4 billion in annual transactions, and the company has secured conditional OCC approval for a regulated banking charter.
Those initiatives reduce the revenue concentration risk that spooked investors during 2025’s rate-squeeze period.
Additionally, institutional flows into regulated crypto products have been accelerating broadly, and Circle’s banking ambitions position it to capture more of that pipeline.
What Traders Are Watching Next for CRCL
The immediate catalyst is whether Circle can post back-to-back profitable quarters. One profitable quarter stopped the bleeding; two consecutive quarters would confirm the business model is structurally sound, not just a one-time reserve yield pop.
If USDC continues gaining market share against Tether and interest rates stay supportive of reserve income, Bernstein’s $190 target starts looking less like a stretch and more like a base case.
But if rates compress reserve yields again or USDC growth stalls, the premium priced into CRCL at current levels evaporates fast.
The definitive signal bulls are waiting for is a sustained close above $130 on above-average volume. Until then, the stock is in a confirmed uptrend, but one that still needs to prove it can hold new highs.
Discover: The best crypto to diversify your portfolio with
The post Circle Shares Surge as Bernstein Sees Stablecoin Adoption Upside appeared first on Cryptonews.
Crypto World
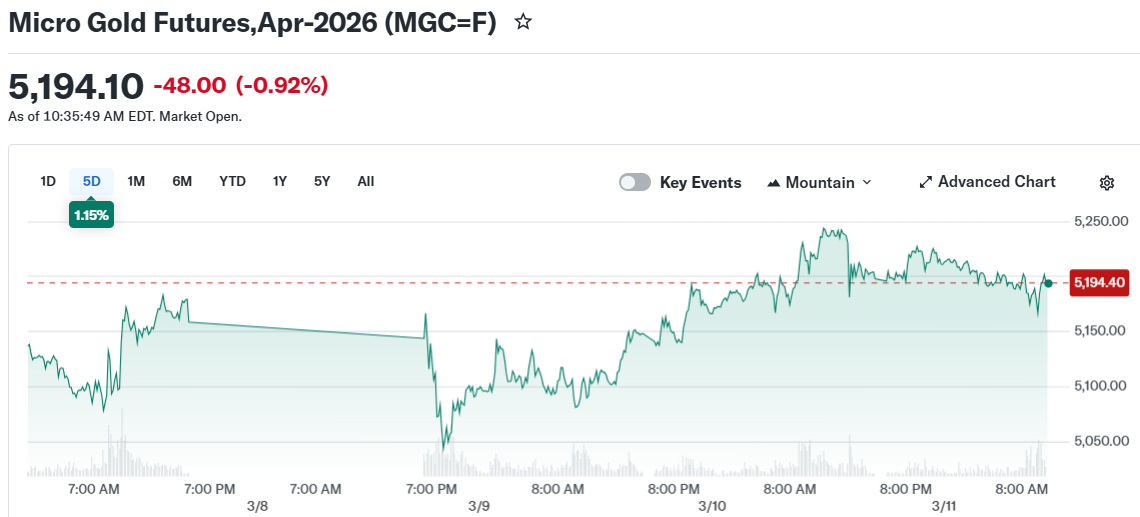
Gold Price Analysis: How Iran Conflict and Surging Oil Keep Precious Metal Above $5,000
Key Highlights
- Precious metal slipped 0.1% to approximately $5,187 per ounce Wednesday, maintaining levels well above $5,000
- Escalating oil costs, fueled by Middle East conflict involving the U.S. and Israel, are stoking inflation concerns
- Critical Strait of Hormuz passage has been essentially closed, putting approximately 20% of worldwide oil and gas shipments at risk
- February’s U.S. Consumer Price Index registered 2.4% annually, meeting expectations but covering pre-conflict period
- Financial markets anticipate Federal Reserve will maintain current rates at upcoming March 18 policy meeting
The precious metal market remained relatively stable Wednesday as competing pressures balanced each other out. Spot gold declined a modest 0.1% to approximately $5,187 per ounce, while futures contracts for April delivery fell 0.9% to roughly $5,194.

The yellow metal has experienced significant swings since reaching a near-peak of approximately $5,600 per ounce in the final weeks of January. Despite the subsequent retreat, prices have consistently remained above the $5,000 threshold.
The military confrontation involving the United States, Israel, and Iran reached its twelfth consecutive day Wednesday, with aerial bombardments persisting among all parties involved. President Trump indicated Monday evening that hostilities were nearing conclusion, though actual combat operations demonstrated little evidence of de-escalation.
The ongoing military engagement has virtually closed the Strait of Hormuz, a critical maritime corridor responsible for transporting approximately one-fifth of global petroleum and liquefied natural gas supplies.
Oil prices gained ground Wednesday as traders expressed skepticism about whether the International Energy Agency’s unprecedented reserve release initiative could adequately compensate for potential Middle Eastern supply shortfalls.
Escalating energy costs are elevating inflation projections. This development weighs on gold because it diminishes the probability of Federal Reserve interest rate reductions. Since the precious metal generates no yield, it becomes less appealing when borrowing costs remain elevated or increase.
An appreciating U.S. dollar combined with climbing Treasury yields are applying additional downward force on gold values. A robust dollar increases the cost of gold for international purchasers.
Consumer Price Data Meets Projections
The Labor Department disclosed Wednesday that American consumer prices advanced 2.4% during the twelve-month period ending February, aligning with both the previous month’s figure and expert predictions.
On a monthly basis, prices climbed 0.3%, accelerating from January’s 0.2% gain. Both energy and food expenses registered increases. The core Consumer Price Index, which excludes volatile food and energy components, posted a 2.5% year-over-year reading, matching January’s level.
Nevertheless, the February data predominantly reflects conditions before the Iran confrontation commenced in late February. Market observers anticipate March statistics will reveal a more pronounced inflationary uptick.
Upcoming Fed Meeting and PCE Release
Market participants are currently focused on two crucial forthcoming data releases. The Personal Consumption Expenditures index for January arrives Friday, with forecasters projecting a 3.1% annual rate.
The PCE serves as the Federal Reserve’s primary inflation gauge and has registered higher readings than CPI throughout recent months.
The Federal Reserve’s two-day policy gathering wraps up March 18. Market consensus strongly anticipates officials will keep interest rates unchanged.
Swissquote analyst Carlo Alberto De Casa observed that market participants seem to be expanding their positions in gold as a protective asset amid the continuing Middle East crisis.
Spot gold was quoted at $5,187 per ounce during Wednesday’s European trading session.

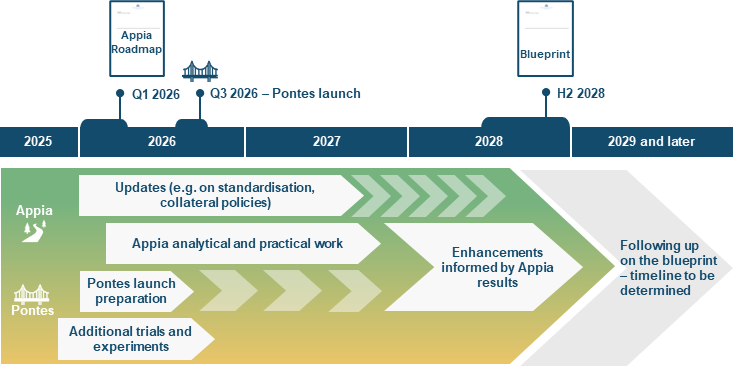
The European Central Bank (ECB) on Wednesday published its Appia roadmap, setting out a long-term plan for building tokenized wholesale financial markets in Europe anchored in central bank money.
The roadmap is built around two linked initiatives. Pontes is the Eurosystem’s distributed ledger technology settlement solution, while Appia is the broader strategic framework for developing a future tokenized financial ecosystem. The ECB said Pontes is scheduled to launch in the third quarter of 2026.
“With Appia, we are building a road from today’s financial system to tomorrow’s tokenized markets, firmly grounded in central bank money,” ECB executive board member Piero Cipollone said.
Pontes is the Eurosystem’s DLT solution, while Appia is a strategic roadmap
Pontes, a key component of the Appia roadmap, introduces the Eurosystem’s distributed ledger technology (DLT) solution, designed to enable central bank money settlement for market transactions through interoperable networks.
The Eurosystem is the monetary authority of the euro area, comprising the ECB and the national central banks of the EU member states that have adopted the euro.
By the end of the third quarter of 2026, Pontes aims to bridge market DLT infrastructures with the Eurosystem’s “TARGET” Services, which stands for Trans-European Automated Real-time Gross settlement Express Transfer system.

TARGET Services are a set of Eurosystem-operated payment and settlement systems that support euro-denominated transactions across Europe. They include three main types: TARGET2 for large-value payments, T2S for securities settlement and TIPS for instant payments.
ECB invites public and private sector stakeholder feedback
Alongside the launch, the ECB opened a public consultation and invited both public- and private-sector participants to comment on the roadmap and express interest in contributing to its implementation.
The consultation is divided into two parts: Part one collects feedback on specific chapters of the roadmap, which may be published with the respondent’s name, while part two allows stakeholders to submit proposals to actively contribute to Appia’s building blocks, with responses treated confidentially.
Related: Tokenized stocks surpass $1B as Ondo, xStocks dominate sector
Responses will help shape the long-term blueprint for Europe’s tokenized financial ecosystem. All feedback must be submitted via the online survey by April 22.
The Appia rollout also comes as the ECB continues work on the digital euro. Earlier this month, the central bank said it planned to begin selecting payment service providers in 2026 ahead of a 12-month pilot scheduled to start in the second half of 2027.
Magazine: Clarity Act risks repeat of Europe’s mistakes, crypto lawyer warns
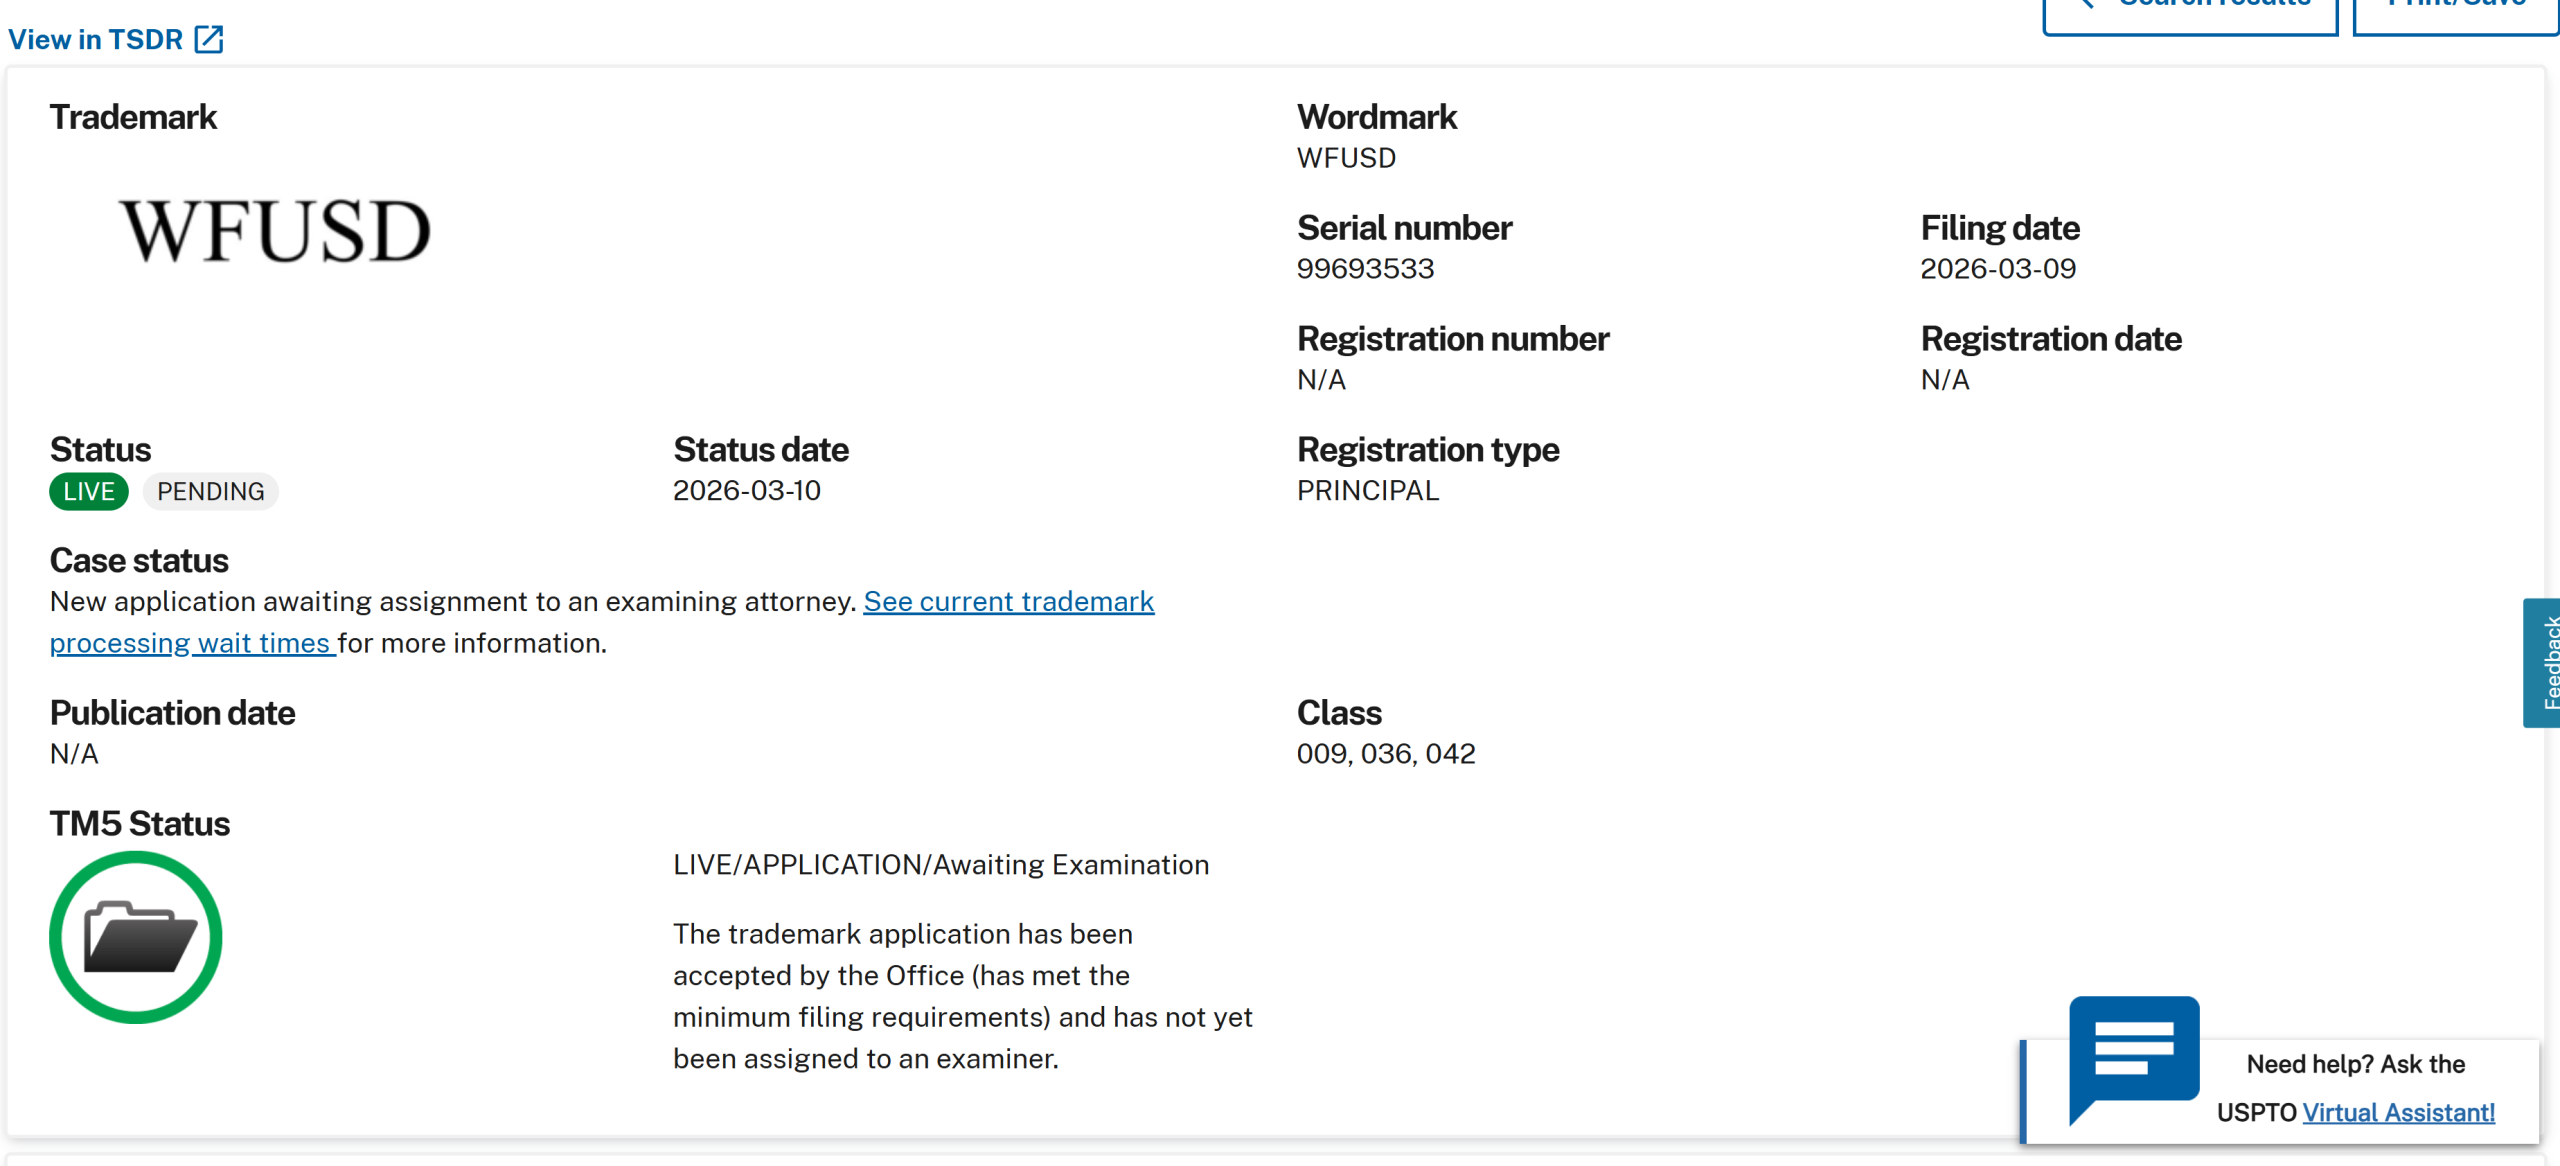
US banking giant Wells Fargo has filed a trademark application covering a wide range of cryptocurrency trading, payments and blockchain software services.
A filing submitted to the US Patent and Trademark Office (USPTO) on Tuesday seeks protection for the name “WFUSD.” The application is currently awaiting assignment to an examining attorney, according to official trademark records.
The filing outlines a broad list of potential products and services linked to digital assets, including “cryptocurrency trading services; cryptocurrency exchange services; cryptocurrency payment processing; financial brokerage services for cryptocurrency trading; electronic transfer of virtual currencies.”
The trademark also covers software tools designed for blockchain ecosystems. The application lists downloadable software for staking digital assets, accessing non-fungible tokens (NFTs), managing crypto wallets and executing digital asset trades.
Related: Western Union’s ‘WUUSD’ trademark hints at crypto offerings
Wells Fargo filing includes staking and tokenization
Other services mentioned in the filing include cryptocurrency payment processing, electronic transfers of virtual currencies and financial data feeds providing price information to blockchain-based smart contracts.
In addition to trading infrastructure, Wells Fargo’s trademark application references software-as-a-service platforms for tokenizing assets, verifying blockchain transactions and enabling cryptocurrency staking operations. The filing also includes authentication services and blockchain-based data transmission tools used in decentralized applications.

While trademark filings do not guarantee a product launch, companies often use them to secure branding for potential future offerings.
Wells Fargo is a prominent American multinational financial services company and one of the “Big Four” US banks.
Related: South Korean bank stocks surge on stablecoin trademark filings
Banks ramp up stablecoin push
The new trademark filing comes after several major US banks, including JPMorgan, Bank of America, Citigroup and Wells Fargo itself, reportedly discussed a joint stablecoin project in 2025.
Earlier this year, Fidelity Digital Assets also launched the Fidelity Digital Dollar (FIDD), a 1:1 US dollar-pegged, fully collateralized stablecoin on the Ethereum blockchain.
Magazine: Bitcoin may take 7 years to upgrade to post-quantum — BIP-360 co-author

Cybersecurity company SlowMist has introduced a five-layer security framework for AI and Web3 agents, pitching it as a way to reduce the growing risks that come with autonomous systems handling onchain actions and digital assets.
In a Wednesday blog post, the company said the framework centers on a user’s AI agents and combines governance controls through its AI Development Security Solution, or ADSS, with execution-layer tools including OpenClaw, MistEye Skill, MistTrack Skill and MistAgent. The company said the system is designed to create a closed-loop process of checks before execution, constraints during execution and review afterward.
SlowMist’s so-called “digital fortress” aims to defend against risks including prompt injection, supply chain poisoning attacks, data leaks and asset loss due to unauthorized operations or AI agent behavior exploits. It also seeks to reduce risks without sacrificing AI efficiency.

Autonomos AI agents introduce new attack surface in business operations
The push comes as more crypto firms experiment with autonomous tools for trading and execution, introducing “new attack surfaces,” such as supply chain poisoning, which has become a new entry point for hackers embedding secret backdoors into devices, according to SlowMist.
The framework’s governance layer, ADSS, aims to establish auditable security standards for organizations to prevent these risks. It includes AI agent permission constraints, real-time threat checks for external interactions and strengthened onchain risk detection.

ADDS’ core value lies in improving “scattered security actions” into a systematic operation that is “executable, auditable, and sustainable,” SlowMist said.
Related: OpenAI eyes trillion-dollar IPO amid global AI arms race: Report
Autonomous crypto trading bots on the rise
Crypto companies are launching more autonomous crypto trading bots. On Jan. 21, crypto intelligence platform Nansen launched autonomous crypto trading tools that enabled users to execute trades through AI agents and natural language prompts, with cross-chain execution on the Base and Solana blockchains.
Other companies that launched no-code AI trading agents include Coinbase, Bitget, Walbi and Gate.io. These solutions seek to lower barriers to entry for retail investors through automated strategies and conversational interfaces.
Magazine: Everybody hates GPT-5, AI shows social media can’t be fixed

Jack Letts and other foreign nationals reportedly renditioned to face death penalty

Bitcoin Sees Modest Relief as US CPI Inflation Avoids Surprises

XRP & Bitcoin Ready For A 2017-Style Pump?


-
Business5 days ago
Form 8K Entergy Mississippi LLC For: 6 March
-

 Tech6 days ago
Bitwarden adds support for passkey login on Windows 11
-

 News Videos2 days ago
10th Algebra | Financial Planning | Question Bank Solution | Board Exam 2026
-

 Fashion5 days ago
Weekend Open Thread: Ann Taylor
-

 Crypto World2 days ago
Paradigm, a16z, Winklevoss Capital, Balaji Srinivasan among investors in ZODL
-
 Tech8 hours ago
A 1,300-Pound NASA Spacecraft To Re-Enter Earth’s Atmosphere
-
 Sports6 days ago
499 runs and 34 sixes later, India beat England to enter T20 World Cup final | Cricket News
-

 Politics5 days ago
Top Mamdani aide takes progressive project to the UK
-

 Sports4 days ago
Three share 2-shot lead entering final round in Hong Kong
-

 Sports3 days ago
Braveheart Lakshya downs Lai in epic battle to enter All England Open final | Other Sports News
-

 Business23 hours ago
ExxonMobil seeks to move corporate registration from New Jersey to Texas
-

 Entertainment5 days ago
Hailey Bieber Poses For Sexy Selfies In New Luscious Lip Thirst Traps
-

 NewsBeat6 days ago
Piccadilly Circus just unveiled ‘London’s newest tourist attraction’ and it only costs 80p to enter
-

 Business3 days ago
Search for Nancy Guthrie Enters 37th Day as FBI Probes Wi-Fi Jammer Theory
-

 Business8 hours ago
Search Enters Sixth Week With New Leads in Tucson Abduction Case
-
 NewsBeat2 days ago
Pagazzi Lighting enters administration as 70 jobs lost and 11 stores close across Scotland
-

 Tech2 days ago
Despite challenges, Ireland sixth in EU for board gender diversity
-
Entertainment7 days ago
Harry Styles Has ‘Struggled’ to Discuss Liam Payne’s Death
-

 Crypto World7 days ago
New Crypto Mutuum Finance (MUTM) Reports V1 Protocol Progress as Roadmap Enters Phase 3
-

 Tech6 days ago
ACIP To Discuss COVID ‘Vaccine Injuries’ Next Month, Despite That Not Being In Its Purview