

Crypto World
Ripple (XRP) Price Predictions for This Week
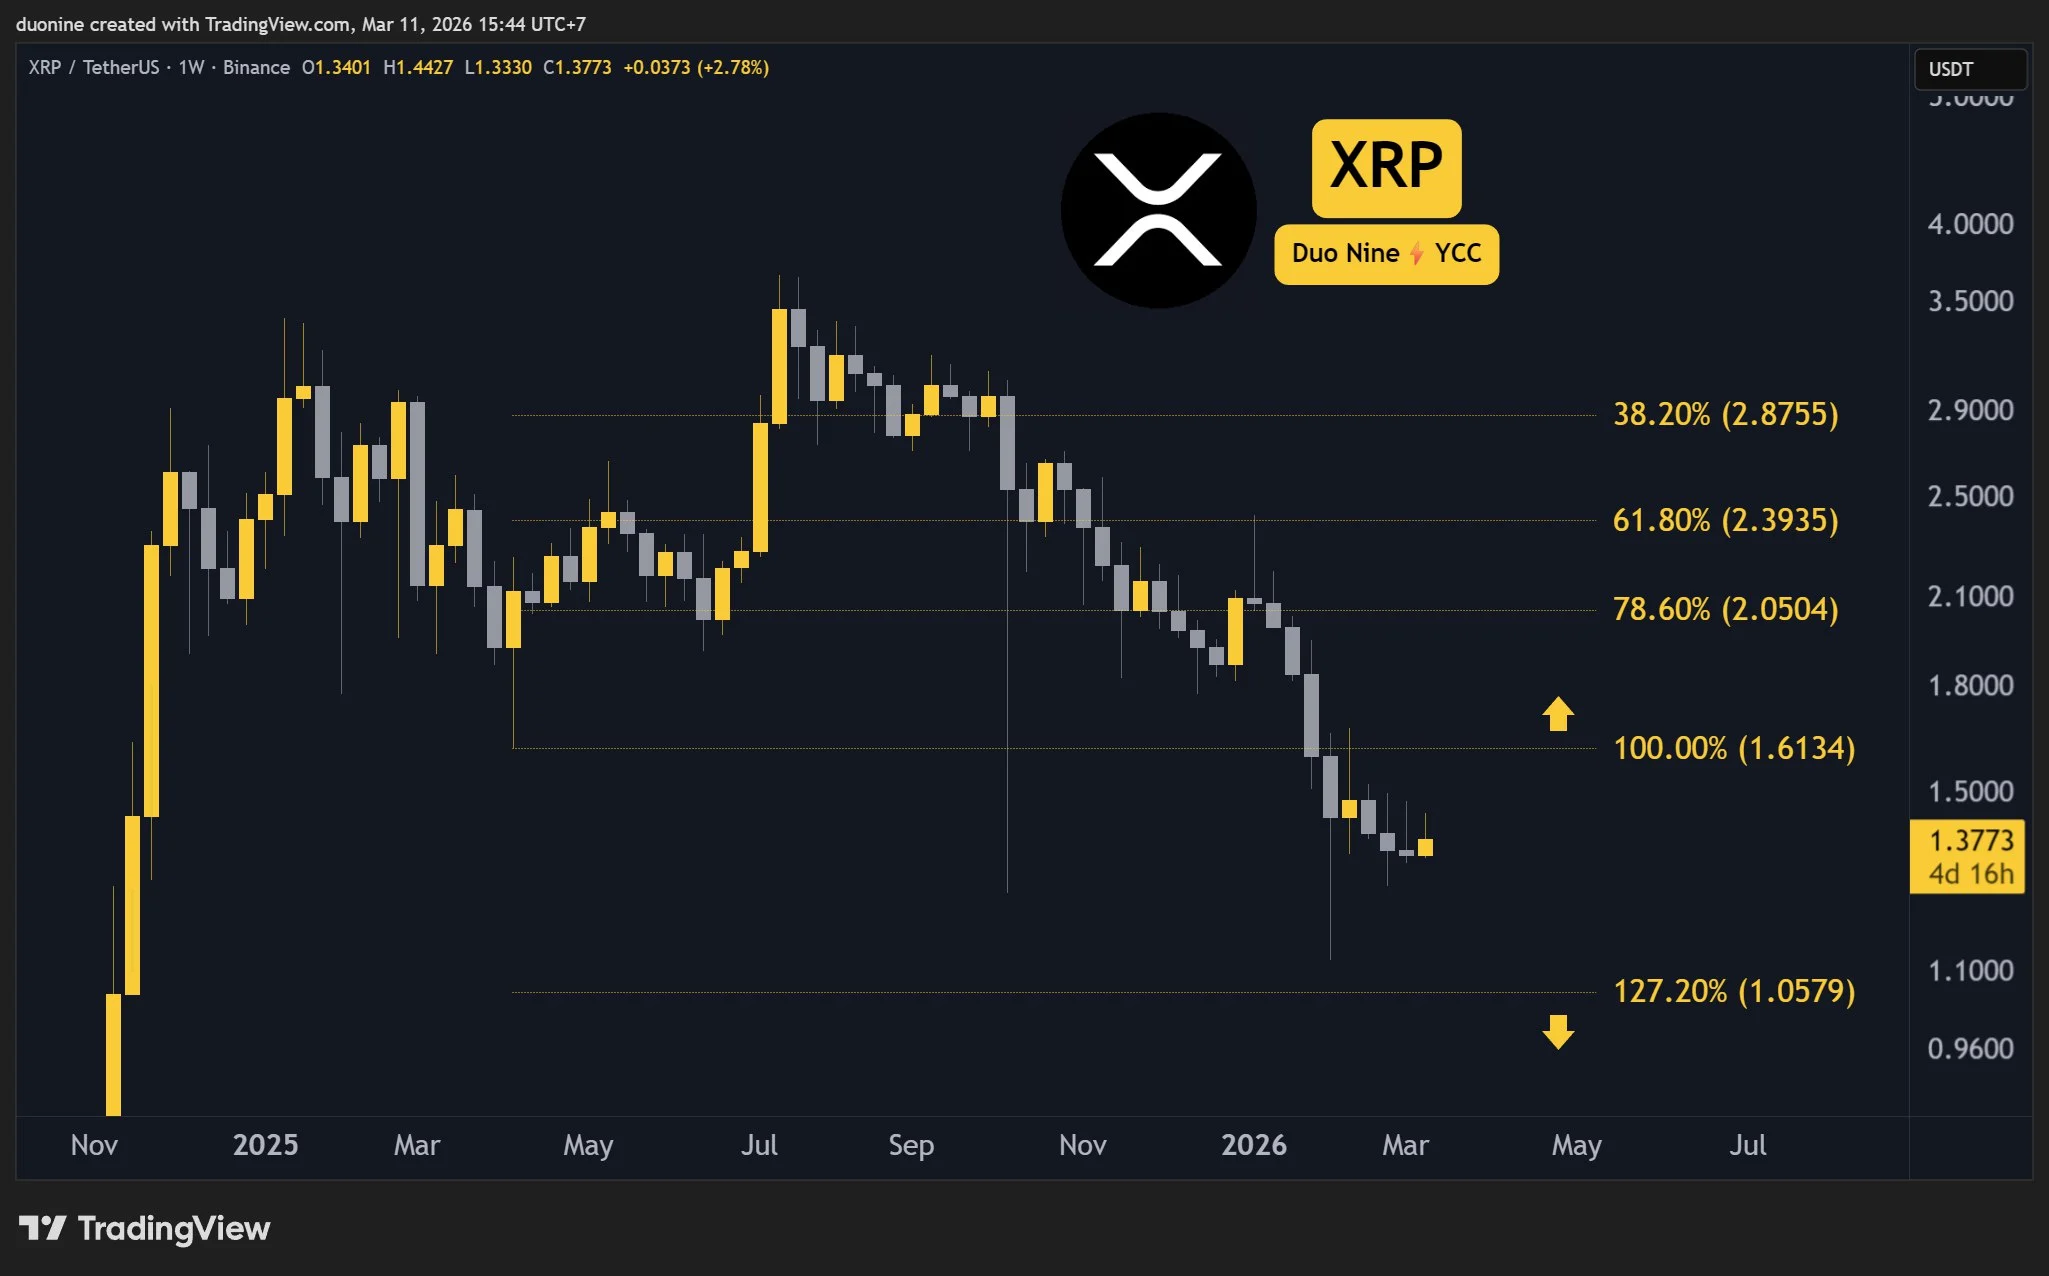
XRP appears to be consolidating before its next major move.
Ripple (XRP) Price Predictions: Analysis
Key support levels: $1
Key resistance levels: $1.4
XRP is Consolidating Around $1.4
Over the past few weeks, XPR has been moving flat around $1.4, currently acting as key resistance. This price consolidation around this level can be interpreted as bullish since sellers were unable to secure a lower low.
This price action is encouraging buyers to return, and the current weekly candle is green. If it closes the week like this, then the resistance will likely break and turn into a key support.

Downtrend Over?
With sellers unable to push the price lower, XRP has been moving sideways. This is a key signal that the market structure may be about to change. This makes a reversal possible in the future.
While buyers still appear shy here, they are slowly gaining momentum. This will likely be amplified as soon as the $1.4 resistance falls. Should they fail, then XRP has solid support at $1.2 and $1.

MACD Bullish Cross
The 3-day MACD crossed bullish, which is a major signal that momentum is turning bullish. If this is sustained in the coming week, then higher price levels appear inevitable.
A clean break above $1.4 will also open the way for XRP to test the $1.6 and $1.8 resistance levels next. Bears will be in serious trouble at that point because it opens the way for this cryptocurrency to retest $2.

Binance Free $600 (CryptoPotato Exclusive): Use this link to register a new account and receive $600 exclusive welcome offer on Binance (full details).
LIMITED OFFER for CryptoPotato readers at Bybit: Use this link to register and open a $500 FREE position on any coin!
Disclaimer: Information found on CryptoPotato is those of writers quoted. It does not represent the opinions of CryptoPotato on whether to buy, sell, or hold any investments. You are advised to conduct your own research before making any investment decisions. Use provided information at your own risk. See Disclaimer for more information.


Bitcoin price has jumped by 16% from its lowest point this year, and is hovering at the crucial resistance at $70,000. This recovery may continue in the near term amid robust ETF inflows and falling core inflation.
Summary
- Bitcoin price remained above the key resistance level at $70k.
- Data shows that the US core inflation eased to 0.2% in February.
- Spot Bitcoin ETF inflows are nearing $1 billion this month.
Bitcoin (BTC) was trading at $70,000 today, March 11, up from the lowest point this year. Its daily volume soared to $47 billion, while the market capitalization moved to $1.3 trillion.
US core inflation cooled, while Bitcoin ETF inflows rose
Bitcoin price may benefit from the ongoing demand from American investors. After shedding over $6 billion in assets in the last four months, data shows that spot Bitcoin ETFs are adding millions in assets this month.
They added $250 million in assets on Tuesday after adding $167 million a day earlier. As a result, they have now added $986 million this month, erasing the $206 million losses made in February.
The ongoing ETF inflows are happening even as the Iran war and instability in the Middle East continues. As such, there are signs that some investors are embracing Bitcoin as a safe-haven asset as geopolitical risks rise.
Meanwhile, data released on Wednesday showed that the US core inflation slowed in February from a month earlier. The figure, which excludes the volatile food and energy prices, rose 0.2% from 0.3% in the previous month.
The headline and core CPI held steady at 2.4% and 2.5% on an annualized basis. These numbers mean that inflationary concerns were ending before the Iran war started earlier this month.
Inflation will likely bounce back in the near term now that crude oil prices have rebounded. Brent jumped to $90, while the West Texas Intermediate (WTI) jumped to $86.
On the positive side for Bitcoin, there is a possibility that this conflict will end soon, driving energy prices and inflation lower.
Bitcoin price may jump to $80k if it flips key resistance
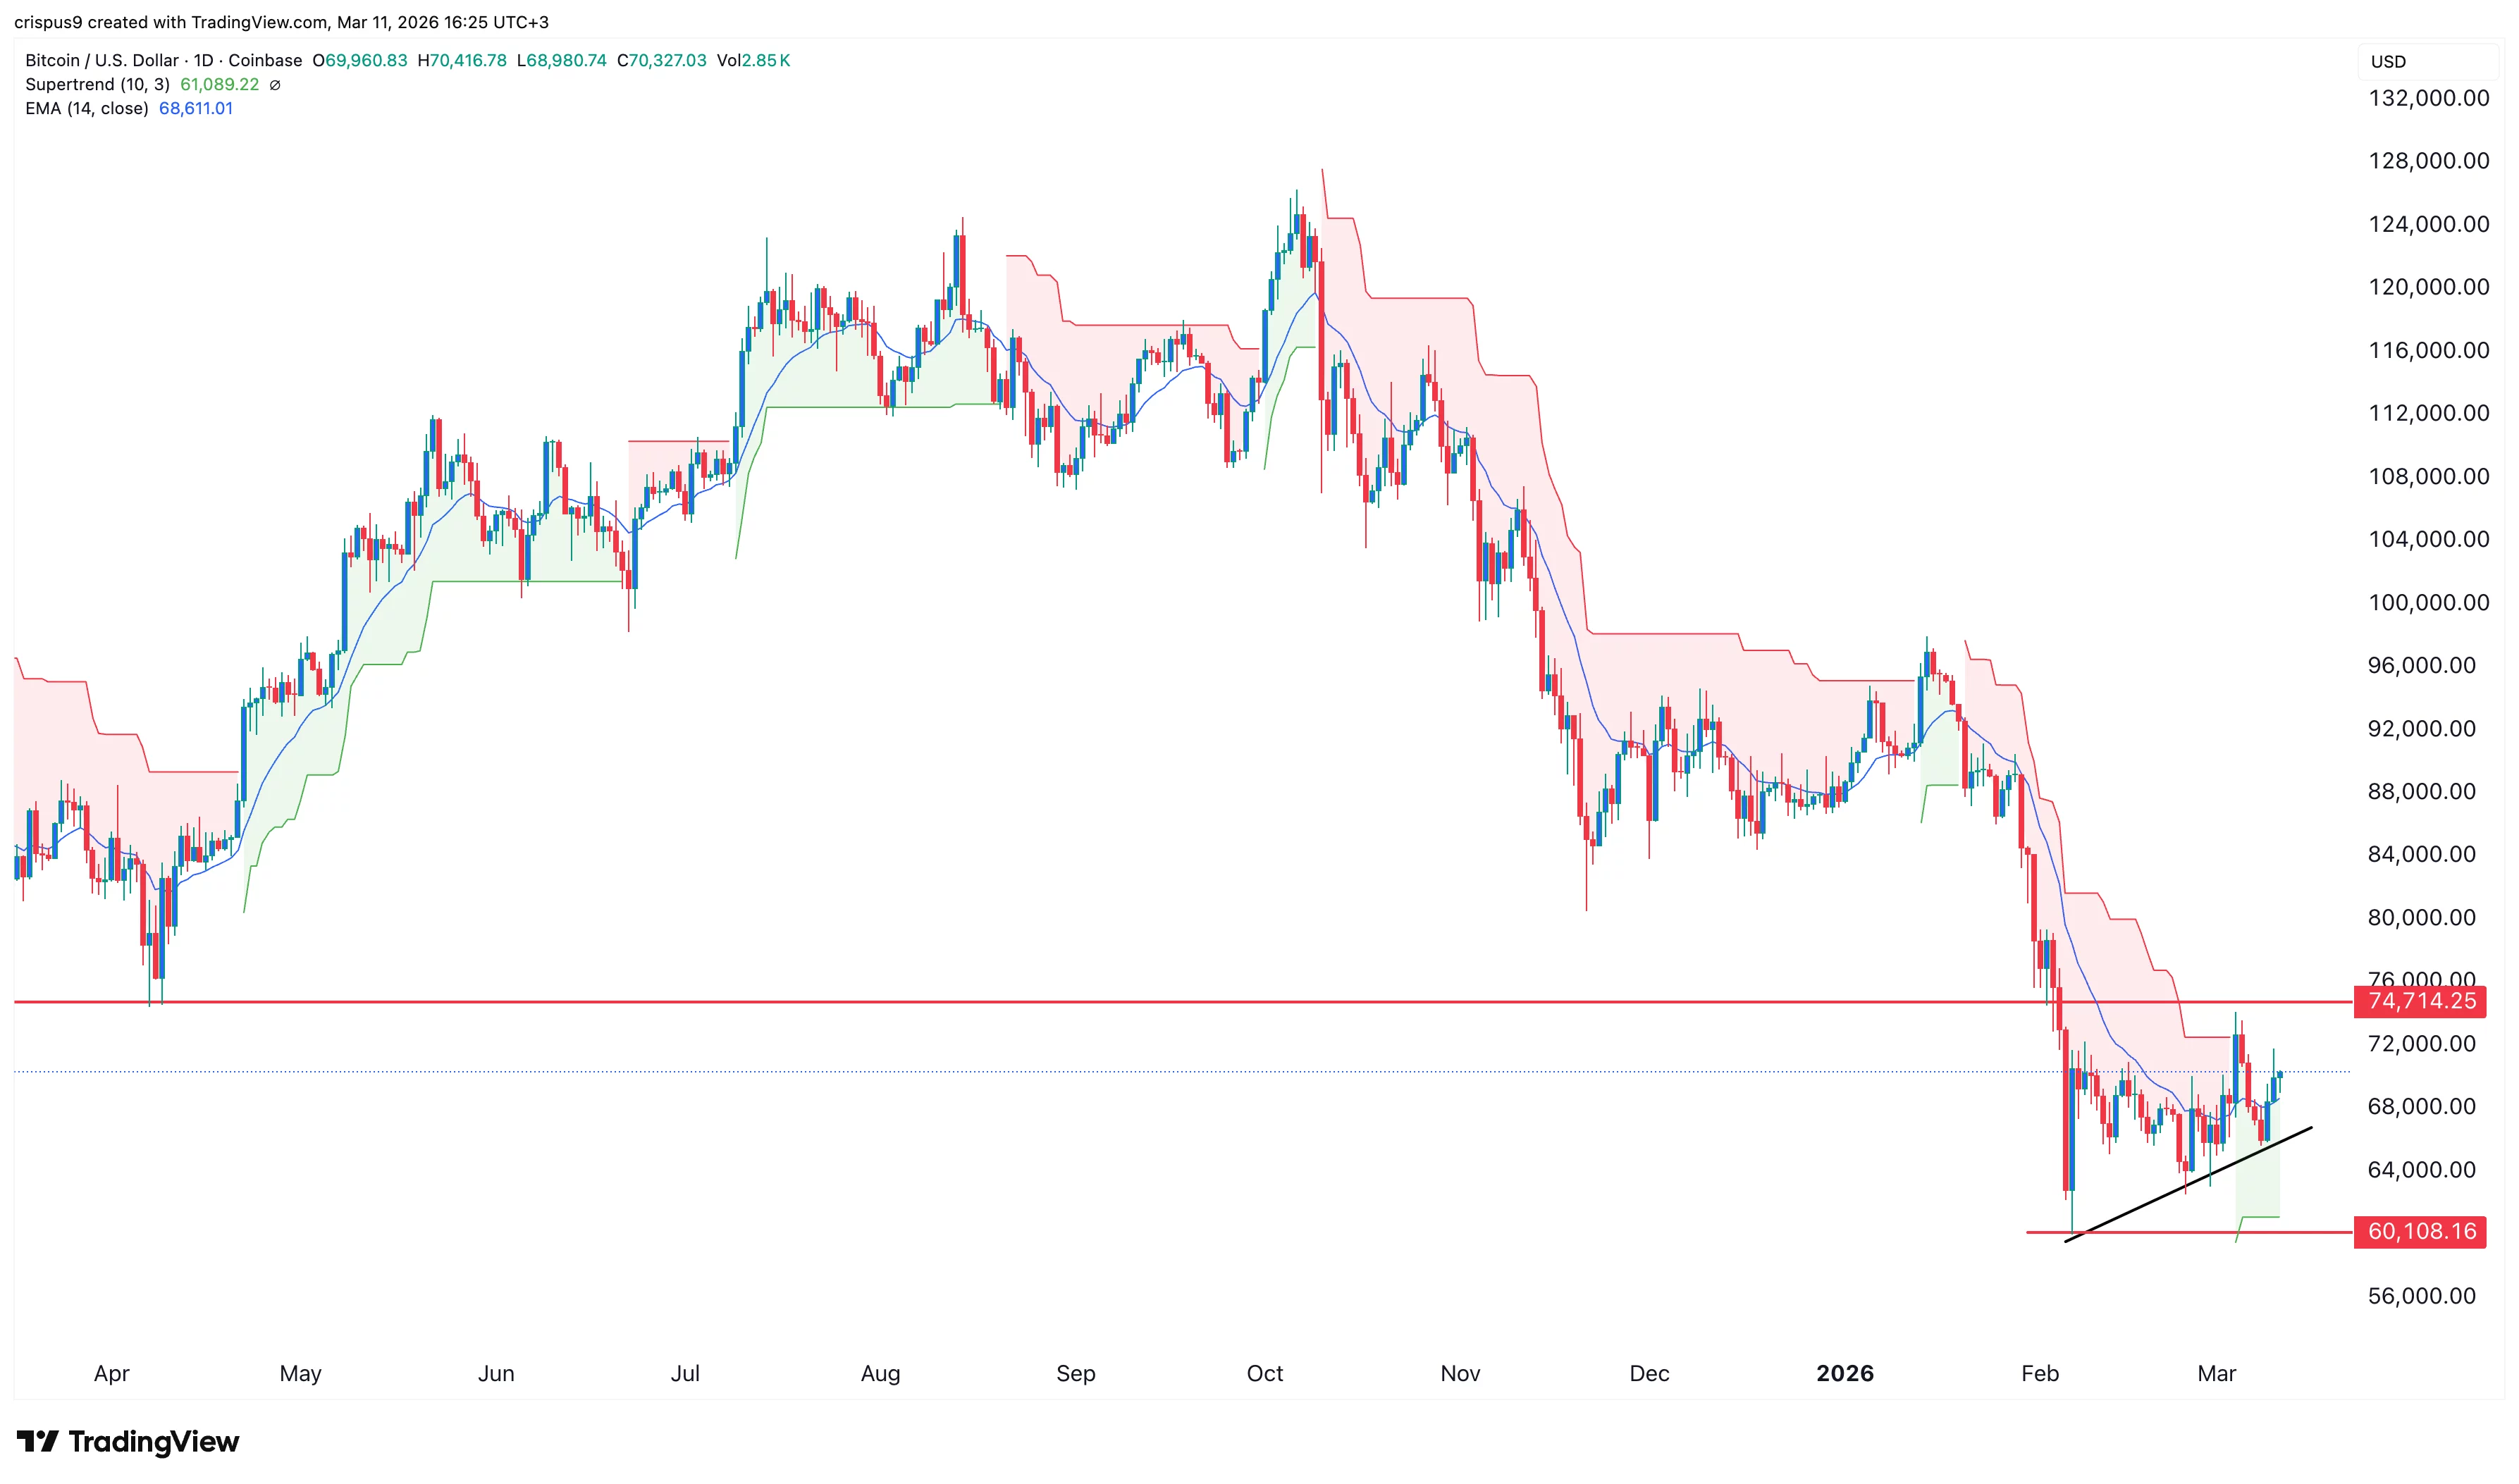
Technicals suggest that Bitcoin may be ripe for a strong comeback if it flips the key resistance level at $74,715, its lowest point in April last year.
It has already moved above the Supertrend indicator for the first time since January this year. Also, it has remained above the ascending trendline that connects the lowest swings since February.
BTC price has moved above the 14-day moving average. Therefore, the coin may keep rising in the coming weeks, potentially to the psychological level at $80,000.

Aave price is trading near $111 as traders react to a $27 million liquidation error that briefly shook confidence in the lending protocol.
Summary
- Aave price dropped after a $27M liquidation caused by a CAPO oracle error.
- 34 accounts using wstETH were liquidated, but the protocol stayed solvent and users will be reimbursed.
- AAVE trades in a descending channel with support at $110–$115, resistance at $125–$130, and weak momentum.
Aave (AAVE) slipped on Wednesday as traders reacted to a recent liquidation incident on the protocol. At press time, AAVE was trading at $111.45, down 2.2% over the past 24 hours.
During the past week, the token moved between $105.31 and $118.70. The price has attempted to recover from the February lows, but it has repeatedly stalled. The market has not yet returned to the levels observed prior to the earlier decline, and momentum is still weak.
Trading activity has cooled slightly. Daily trading volume reached about $29 million, which is 11% lower than the previous day. CoinGlass data also shows softer activity in derivatives markets. Futures volume fell 14% to $300 million, while open interest dropped 4.97% to $190 million.
When both volume and open interest fall at the same time, it usually means traders are stepping back and closing positions.
Liquidation glitch sparks concerns among traders
The decline in sentiment follows an unusual liquidation event on March 10 that affected several users of the Aave lending platform.
The incident was not caused by a hack or a sudden market crash. Instead, it stemmed from a configuration problem in CAPO, Aave’s internal risk management oracle used to monitor collateral prices.
The issue affected positions that used wstETH, the wrapped staked ether token issued by Lido, as collateral. A mismatch between an exchange-rate snapshot and its timestamp caused the system to read the wstETH-to-ETH price incorrectly.
Because of the error, the oracle undervalued the asset by roughly 2.85%. Several accounts suddenly appeared under-collateralized even though their positions were healthy on-chain.
As a result, around 34 user accounts were liquidated, and approximately 10,938 wstETH, worth about $27 million, was sold through automated liquidation processes. Liquidation bots earned close to 499 ETH through bonuses and fees.
After the issue was identified, Chaos Labs, which helps monitor risk parameters on Aave, worked with the protocol team to correct the configuration. The protocol itself remained solvent and did not accumulate bad debt.
Aave said affected users would be compensated using recovered funds and DAO resources. The Aave DAO and Lido both signaled support for reimbursing impacted accounts.
Although the problem was quickly fixed, the event reminded traders that technical errors can still trigger liquidations in DeFi systems.
Technical analysis: Aave price stuck inside descending channel
On the chart, Aave is trading inside a descending channel, a pattern that appears when prices register lower highs and lows. The upper trendline of the channel continues to act as resistance, while the lower boundary has provided support during recent dips.
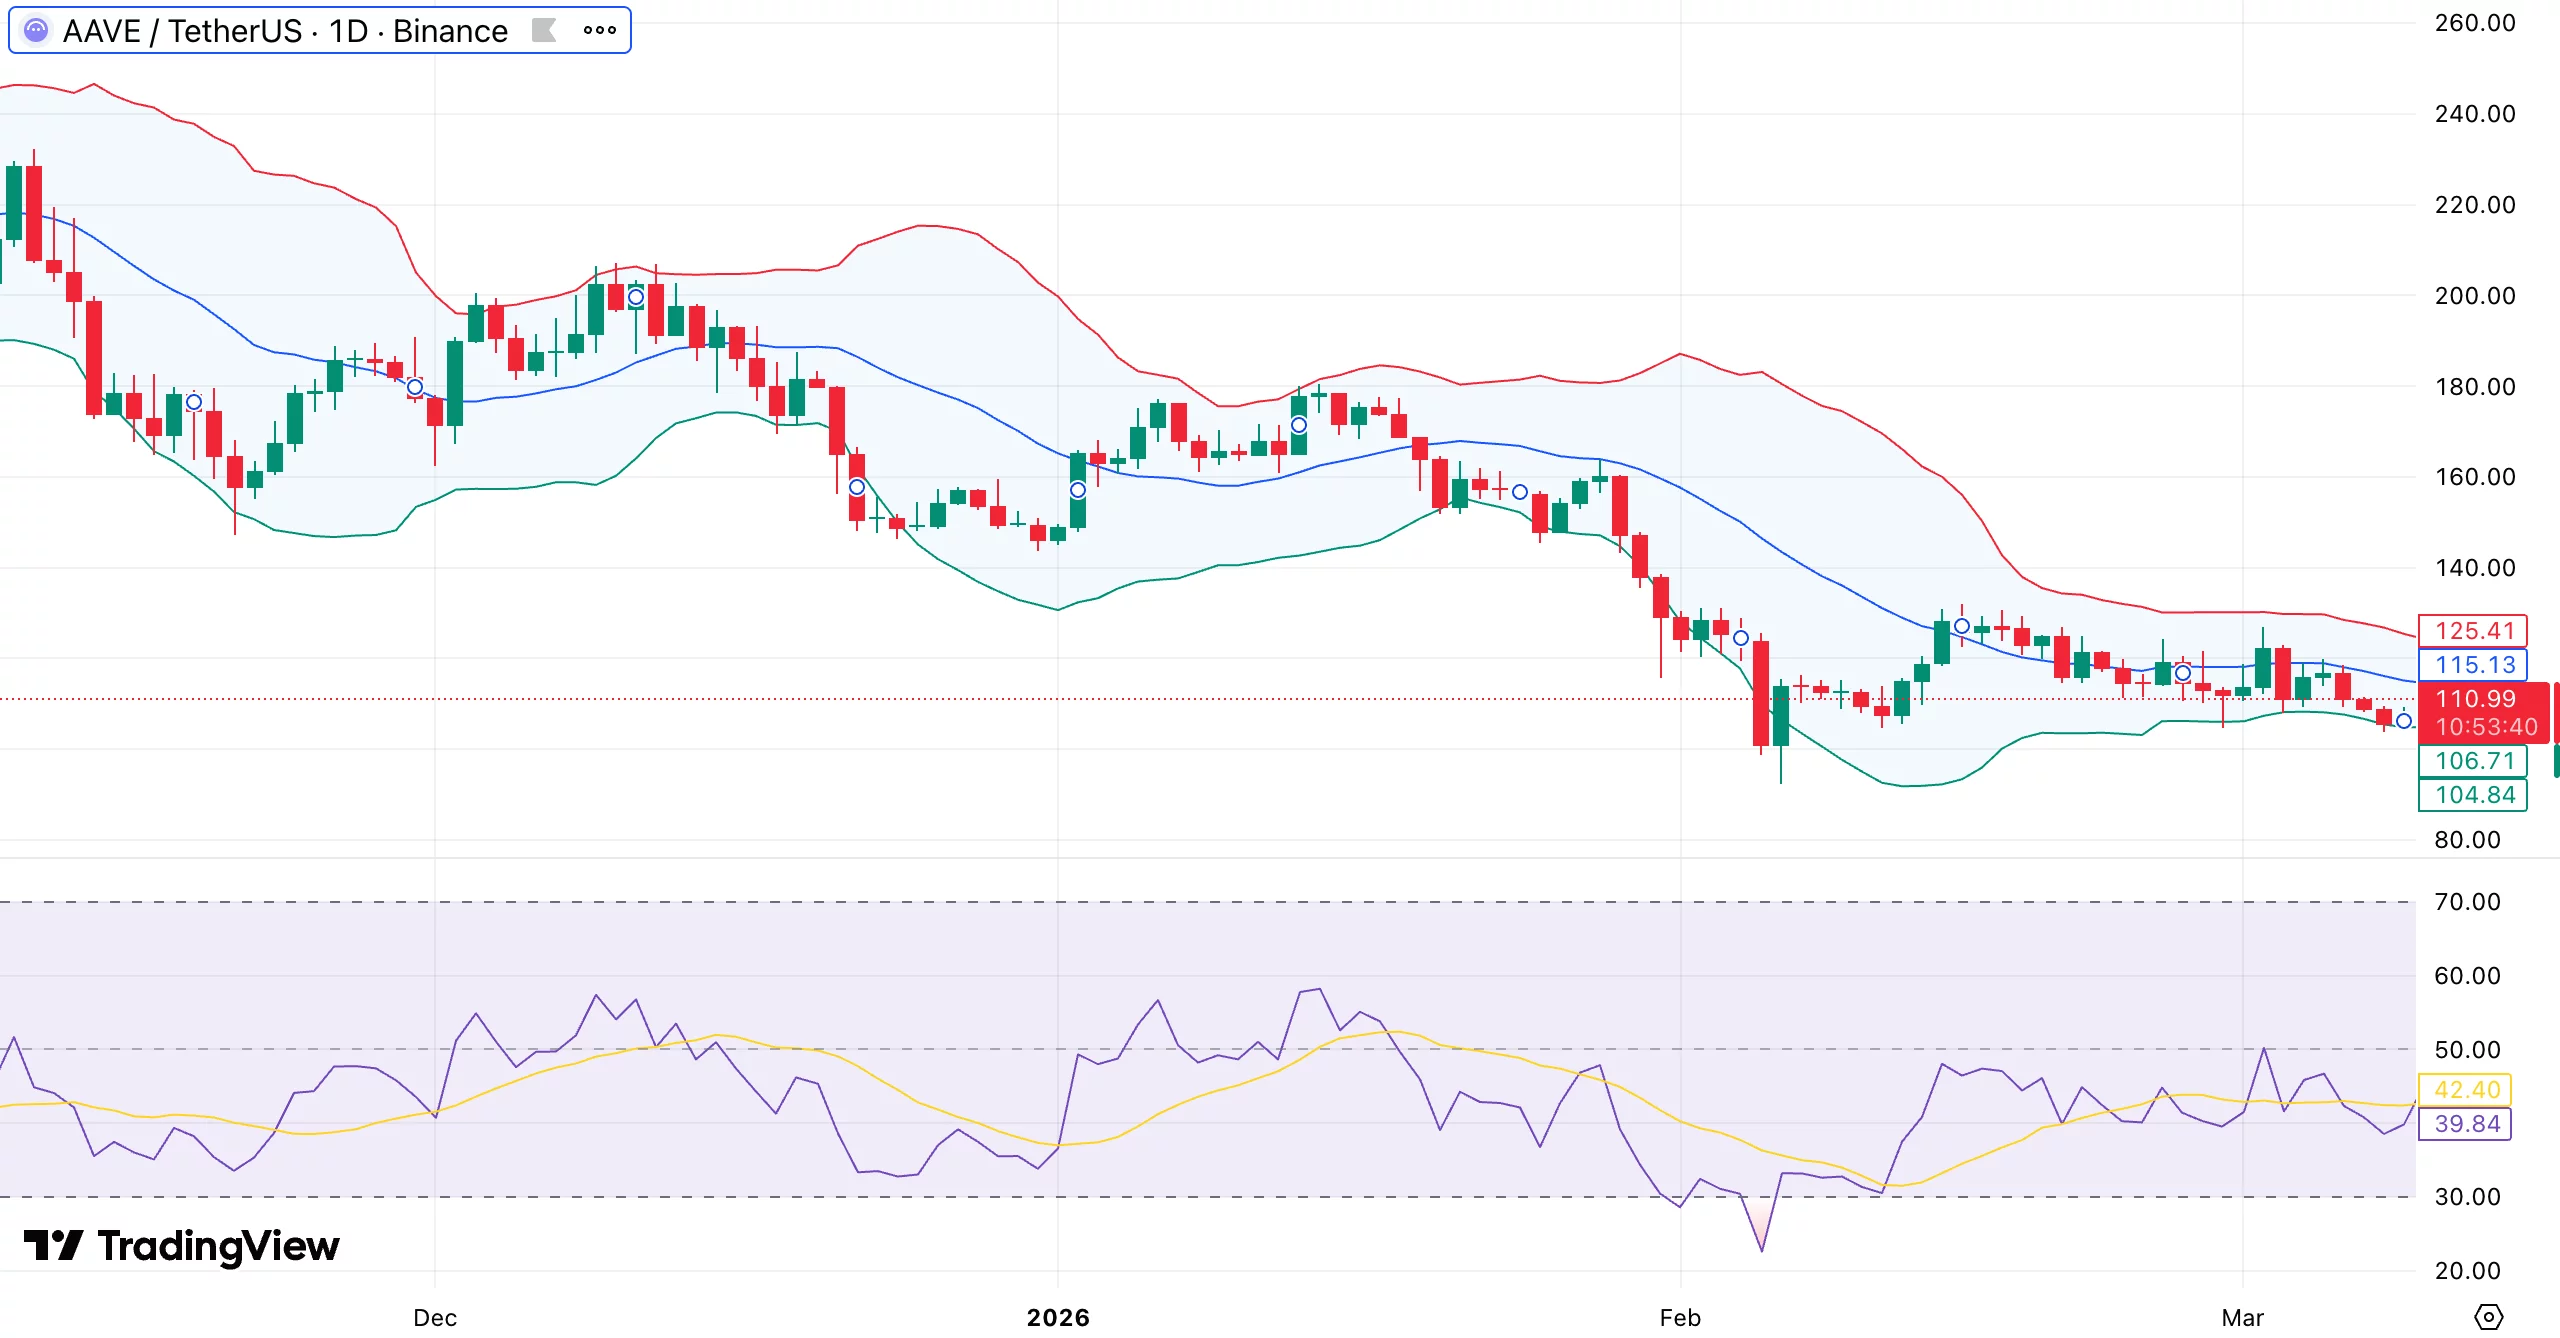
This structure often shows a bearish bias until a breakout occurs. The token is also trading below its short-term moving averages, such as the 50-day and 20-day averages, which act as overhead resistance.
Sellers will probably maintain control of the trend until the price rises above these levels. Volatility has been relatively muted. Bollinger Bands are slightly narrowing, which can happen when the market pauses before the next larger move.
Momentum indicators also lean negative. Buying strength is still restricted, as indicated by the relative strength index, which is below the 50 mark. However, the indicator is not yet in oversold territory, allowing for additional declines.
Within the channel, $110 to $115 is currently serving as a short-term support zone. If the price breaks below that range, it may move into the next demand zone.
On the upside, resistance sits around $125 to $130, where the upper channel trendline and short-term moving averages meet. A clear move above that range would be needed to shift momentum back in favor of buyers.
Bitcoin (BTC) failed to break the $72,000 resistance on Tuesday, as onchain data suggested that BTC was entering the most “challenging” phase of the cycle.
Key takeaways:
-
Bitcoin price stays range-bound following another rejection at $72,000.
-
Rising supply in loss suggests the most “psychologically challenging” phase of the bear market is here.
-
Bitcoin must break resistance at $72,000 for a chance to end the downtrend.
Bitcoin faces the most frustrating phase of the cycle
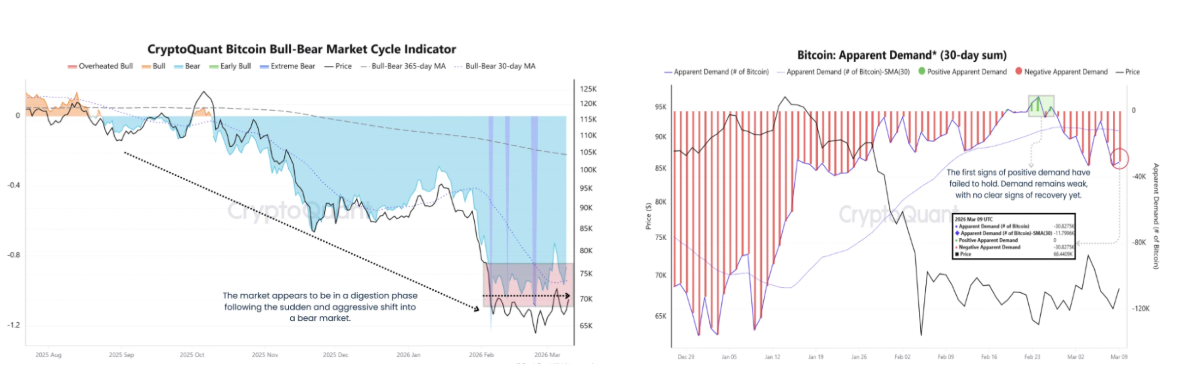
Bitcoin is entering a period of “elevated uncertainty” where market participants display more hesitation than conviction, according to CryptoQuant analyst MorenoDV_.
“A combination of 3 key onchain metrics suggests that the market may be navigating one of the most psychologically challenging phases of the cycle,” MorenoDV_ said.
Related: Arthur Hayes says he’s waiting to buy Bitcoin until Fed eases policy
These include the Bitcoin bull-bear market cycle indicator, a metric that tracks phases of investor sentiment in the BTC market, which shows a bear market consolidation phase following the aggressive drawdown from cycle highs.
This is “a period that historically tends to frustrate both bulls and bears,” the analyst said.

The apparent demand further reinforces this picture. The chart above reveals that the spike in Bitcoin’s apparent demand in mid-February was short-lived, “with demand quickly slipping back into negative territory,” MorenoDV_ said.
The lack of sustained buying pressure indicates that market participants remain cautious and unwilling to aggressively accumulate at current levels.
Moreover, the Long-Term Holder SOPR is now below the key threshold of 1, a sign that even long-term investors are realizing losses.
“Historically, this phase tends to emerge in the later stages of bear markets, when prolonged uncertainty begins to erode even the strongest conviction. ”

Meanwhile, Bitcoin supply in loss is rising again, currently approaching the 40–45% range, up from 22% in mid-January.
Historically, such levels appeared during deep corrective phases, as seen in 2015, 2019, and 2022, reflecting growing market stress and capitulation among sellers.
The chart below shows that macro market bottoms are historically formed when supply in loss rises above 50%.
“Supply in loss is increasing again, indicating rising market stress,” CryptoQuant analyst Woominkyu said, adding:
“If historical patterns repeat, the current level may represent the early phase of a bear market rather than the final bottom.”

As Cointelegraph reported, analysts forecast Bitcoin extending its bear market into late 2026, with some predictions as low as $30,000.
Bitcoin’s key resistance remains $72,000
Bitcoin has made several unsuccessful attempts to rise above $72,000, a level that has suppressed the price since early March.
“Another rejection at the range high for the time being,” said analyst Daan Crypto Trades in an X post on Tuesday, referring to Bitcoin’s pause below $72,000 on Tuesday, adding:
“Still in the range and markets are in general very indecisive.”
An accompanying chart showed $72,000 was the key level to watch on BTC’s four-hour chart. Breaching this level could attract new buyers if the price breaks out of its range.

Fellow analyst BenCrypz said a clean breakout above $72,000 “could trigger stronger bullish momentum and open the path toward higher levels.”
“However, if this resistance holds again, BTC could rotate back toward the $69K mid-range or even revisit the $66K support zone.”

This article does not contain investment advice or recommendations. Every investment and trading move involves risk, and readers should conduct their own research when making a decision. While we strive to provide accurate and timely information, Cointelegraph does not guarantee the accuracy, completeness, or reliability of any information in this article. This article may contain forward-looking statements that are subject to risks and uncertainties. Cointelegraph will not be liable for any loss or damage arising from your reliance on this information.

TLDR:
- The 20 millionth Bitcoin was mined; only one million remain to enter circulation over 100+ years.
- Bitcoin’s halving mechanism gradually slows new coin creation, ensuring predictable scarcity.
- Mining secures the network, while future transaction fees will sustain miner incentives.
- Bitcoin’s decentralized, inflation-resistant design continues to attract global investors.
Bitcoin’s 20 million mined marks a historic milestone as the network reaches over 20 million coins. Only one million remain to be mined, reinforcing Bitcoin’s scarcity, decentralized structure, and long-term inflation-proof economic design in global finance.
Mining Milestone Highlights Scarcity
Bitcoin reached a new stage as the 20 millionth coin was mined, leaving only one million coins yet to enter circulation.
Brian Armstrong, CEO of Coinbase, highlighted the milestone on X, noting the remaining coins will take over 100 years to mine.
Mining remains the core process of Bitcoin’s issuance. Miners validate transactions and secure the network while receiving newly minted coins as rewards.
When Bitcoin launched in 2009, the block reward was 50 BTC. The halving mechanism reduces rewards approximately every four years.
The latest reduction brought the block reward to 3.125 BTC, significantly slowing the creation of new coins. This ensures Bitcoin approaches its 21 million cap gradually, maintaining predictable scarcity.
Mining also supports network security. Over time, transaction fees are expected to replace block rewards as the primary incentive for miners.
This allows the network to remain decentralized and functional even after all coins are mined.
Decentralized, Inflation-Resistant Money
Bitcoin’s fixed supply positions it as an inflation-resistant asset. Unlike fiat currencies, which can be printed at will, Bitcoin’s 21 million maximum ensures it remains scarce and predictable over time.
Global interest continues to grow. Institutions, corporations, and individual investors are increasingly recognizing Bitcoin as a decentralized, inflation-proof store of value.
The milestone reinforces its long-term economic design and transparency. The remaining one million coins will enter circulation slowly due to halving.
This controlled release preserves scarcity, while mining efficiency, hardware, and renewable energy use shape the network’s evolution. Brian Armstrong emphasizes Bitcoin’s role as global money, offering a decentralized alternative to traditional finance.
Bitcoin 20 Million Mined represents more than just a number; it reflects the asset’s scarcity, long-term value proposition, and unique design as decentralized, inflation-resistant money.


US-based prime brokers, financial institutions that provide services to hedge funds, are reportedly working to give their clients access to Kalshi’s event bets, with prediction markets booming over the past year.
According to a report from Bloomberg on Wednesday, executives from both Clear Street and Marex Group Plc confirmed that their firms expect to open up access to Kalshi’s prediction markets in the near future.
Clear Street, which is valued at over $12 billion, is expected to be the first of the two to make the jump, with CEO Ed Tilly stating that the firm expects its first Kalshi trade to clear in late March. Marex, valued at around $2.6 billion, plans to follow suit in the next few months.
Thomas Texier, Marex’s global clearing head, said they are seeing strong demand from large financial institutions that are looking for ways to tap into prediction markets.
“Over the last few weeks, we’ve seen very large hedge funds coming to us and saying, ‘Can you give us access to these markets?’” Texier said, adding that the firm is also interested in using prediction markets to hedge its own positions.
Kalshi CEO sees accelerating institutional adoption
In a post on LinkedIn on Wednesday, Kalshi CEO Tarek Mansour said institutional adoption will greatly accelerate in 2026 due to prediction markets’ utility in providing data on future events and investment hedging.
“This is no longer an early-adopter space – it is becoming a core pillar of the financial ecosystem, with billions flowing through weekly,” he said, adding:
“Institutions are increasingly using these markets to generate returns, hedge real-world risk, and understand what’s most likely to happen next. CNBC, CNN, Bloomberg, and Fox now regularly cite Kalshi markets alongside traditional market tickers.”
Clear Street’s CEO emphasized, however, that the firm is treading with caution amid a regulatory gray area for the prediction market space, alongside a host of lawsuits filed by state regulators across the US.
Related: Kalshi, Polymarket eye $20B valuations in potential fundraising: WSJ
The primary issues currently hanging over the industry are related to sports markets and whether or not they fall under the legal category of sports betting, and the potential for insider trading given the wide-reaching nature of markets offered on prediction market platforms.
Earlier this week, executives from major exchanges such as Nasdaq and CME called for regulatory clarity on prediction markets to support adoption in the US.
“Markets thrive when we have consistent regulation, and it allows investors, first of all, to be protected,” Nasdaq CEO Adena Friedman said at the FIA Global Cleared Markets Conference on Tuesday.
“We are going to the SEC, because the options markets are governed by the SEC, and we want to make sure that within the confines of the rule base that we operate in, we can create a construct that will work for investors,” she added.
The Commodities Futures Trading Commission is claiming to have primary oversight on the sector, while the Securities and Exchange Commission said it will also have a role to play.
Magazine: All 21 million Bitcoin is at risk from quantum computers
TLDR:
- Volkswagen to cut 50,000 jobs in Germany by 2030 following sharp profit decline.
- Chinese EV makers reduce Volkswagen’s market share in its most profitable region.
- Rising German energy and labor costs intensify pressure on Volkswagen operations.
- U.S. import tariffs add nearly €3bn in costs, impacting high-value German exports.
Volkswagen’s job cuts plan targets 50,000 positions in Germany by 2030 following a 44% drop in profits. The company faces intense competition from Chinese EV makers, rising energy costs, and U.S. import tariffs while transitioning toward electric vehicles.
Profit Decline and Cost Pressures
Volkswagen reported a net profit fall from €12.4 billion to €6.9 billion last year, representing a 44% decline. This marks the lowest post-tax profit since 2016, reflecting ongoing global market pressures.
The cuts will span the entire group, including Audi and Porsche, as the company focuses on efficiency. Chief executive Oliver Blume emphasized that operating conditions are now fundamentally different from previous years.
Finance chief Arno Antlitz stressed that the current profit margin is insufficient in the long term. Volkswagen aims to reduce costs rigorously while investing in software and electric vehicle technologies.
The company has already agreed with unions to cut over 35,000 jobs in a socially responsible manner. Executives estimate the restructuring will save €15 billion by 2030.
The remaining reductions are part of a broader strategy to maintain competitiveness amid declining profit margins and changing production dynamics.
Competition from China and EV Transition
China has historically been Volkswagen’s most profitable market. Domestic EV manufacturers like BYD now dominate with faster product cycles, competitive pricing, and strong technological integration.
Sales volumes for Volkswagen in China have declined as a result. Chinese EV makers are also entering European markets, increasing pressure on Volkswagen’s traditional base.
Electric vehicles require fewer components than combustion engine models, which reduces assembly complexity and the workforce needed.
Volkswagen’s focus on electrification has increased restructuring costs. Investments in battery production, software, and new EV models are substantial, making cost control essential.
These factors, combined with global market shifts, make workforce reductions unavoidable. Rising energy prices in Germany and high labor costs add further challenges.
Tariffs on U.S. imports also reduce competitiveness for German-produced vehicles. Volkswagen now faces the dual task of cutting costs while accelerating its transition to electric mobility to remain viable.
TLDR:
- Apparent demand remains negative, showing new supply exceeds market absorption for Bitcoin.
- CryptoQuant cycle indicators fall into deep bear territory despite price holding $65K–$75K.
- Long-Term Holder SOPR below 1 signals stress among historically strong investors.
- Sideways price action with fading rallies reflects a prolonged patience phase in the cycle.
Bitcoin mid-cycle consolidation is evident as on-chain metrics show weakening demand and investor fatigue. Apparent demand is negative, cycle indicators remain bearish, and long-term holder SOPR has slipped below 1, reflecting stress among historically resilient holders and sideways market behavior.
Apparent Demand Reflects Market Stagnation
Bitcoin mid-cycle consolidation is apparent through the behavior of apparent demand, an on-chain metric measuring how new supply is absorbed. It compares newly mined coins to changes in long-inactive supply entering circulation.
Positive readings indicate absorption, while negative readings suggest supply exceeds demand. Recent data shows mostly negative demand, with brief green spikes in late February failing to sustain.
This indicates that buyers are not consistently strong enough to maintain upward momentum. Such behavior is typical of mid-cycle consolidation, where early investors distribute holdings while new participants hesitate to buy at elevated prices.
Price action remains choppy, fluctuating between short rallies and pullbacks. Traders experience psychological strain as optimism during brief rallies is often followed by disappointment.
Markets show resilience despite negative demand, maintaining the $65K–$75K range, yet lacking sufficient capital inflow to trigger sustained upward trends.
Historical cycles indicate that these periods often precede renewed accumulation. The negative demand environment slowly tests investor patience, producing sideways movement rather than sharp corrections.
False breakouts and fading rallies become common during this stage, emphasizing the patience required to navigate consolidation.
Long-Term Holder SOPR Signals Growing Stress
Long-Term Holder SOPR measures whether holders sell at a profit or a loss, providing insight into market psychology. Recent readings show the 30-day EMA slipping below 1.0, signaling that even resilient holders are realizing losses.
This occurs during a mid-cycle compression phase where price stagnates and short-lived rallies fail to attract aggressive accumulation. The combination of negative apparent demand and SOPR below 1 reinforces market stagnation.
Price oscillates around the mid-$60K range, producing repeated false breakouts. Traders face uncertainty while long-term holders’ conviction is tested.
Coins gradually move from weaker hands to stronger holders, quietly setting the foundation for eventual accumulation once demand and confidence return.
This convergence of on-chain signals confirms Bitcoin is navigating a psychologically challenging mid-cycle consolidation, with patience as the primary tool for market participants.


Osmosis has proposed converting OSMO to ATOM and tightening Cosmos Hub integration, testing whether chain mergers can boost liquidity, governance, and valuations.
Summary
- Osmosis plan offers OSMO–ATOM conversion at a fixed rate over six months, with unclaimed ATOM returning to the Hub community pool.
- Proposal would bind Osmosis liquidity, security, and governance more tightly to Cosmos Hub, positioning ATOM as the primary base asset.
- The move sharpens Cosmos’ consolidation vs app‑chain sovereignty debate, putting OSMO and ATOM holders in control via governance votes.
Interoperable DEX Osmosis has put forward a sweeping proposal to convert OSMO into ATOM and migrate its core protocol more tightly into the Cosmos Hub, in one of the most aggressive consolidation moves yet seen in the Cosmos ecosystem. The plan would effectively bind Osmosis’s liquidity, security, and governance more directly to the Hub, while offering OSMO holders a time‑limited path into ATOM exposure.
Under the proposal, all circulating OSMO – excluding undeployed community pool tokens – could be converted to ATOM over a six‑month window at a fixed rate of 1.998 OSMO for 0.0355 ATOM. Holders who do not claim within that period would see the corresponding ATOM returned to the Cosmos Hub community pool, concentrating unclaimed value under Hub governance. The structure is explicitly designed to avoid permanent dangling liabilities, while forcing a clear decision from tokenholders on whether they want to align with the Hub or exit.
Strategically, the proposal aims to turn Osmosis from a largely independent app‑chain into a native liquidity engine for Cosmos Hub, potentially simplifying the stack for users and institutional players who view Cosmos as fragmented. By consolidating liquidity and security at the Hub layer, proponents argue that Cosmos can present a cleaner narrative to external capital: one core base asset (ATOM), one primary liquidity venue (Osmosis on Hub), and unified governance. For Osmosis, the move could widen its addressable user base if ATOM’s brand and distribution outweigh the loss of a standalone token.
The trade‑offs are significant. OSMO holders face dilution of protocol‑specific upside in exchange for broader ATOM exposure and tighter alignment with the Hub’s long‑term roadmap. Cosmos Hub, on the other hand, would be implicitly underwriting Osmosis’s future, importing not only its liquidity and fees but also its technical and governance risk. Success would push Cosmos further toward a “hub and spokes” model with ATOM at the center; failure would strengthen the case for app‑chain sovereignty over consolidation.
If passed, the proposal would mark a clear escalation in the ongoing debate over how Cosmos should compete with more monolithic ecosystems like Ethereum and Solana. It would also provide a live test of whether token conversions and protocol mergers can unlock higher valuations and deeper liquidity, or whether they simply shuffle risk and governance complexity from one balance sheet to another. For now, all eyes will be on how both OSMO and ATOM holders respond at the ballot box.

US-based prime brokers are quietly positioning themselves to give hedge funds and large institutions direct access to Kalshi’s prediction markets, a move that signals growing institutional interest in event-based betting markets. A Bloomberg report from March 11, 2026, indicates that Clear Street and Marex Group Plc are both lining up access for their clients in the near term. Clear Street, valued at over $12 billion, is expected to clear Kalshi trades as early as late March, while Marex, with a current valuation around $2.6 billion, plans a staged rollout over the coming months. The development underscores a broader shift as predictively driven markets gain traction among mainstream financial players, even amid regulatory ambiguity surrounding their legality and oversight.
Key takeaways
- Prime brokers plan to enable client access to Kalshi’s prediction markets within weeks, signaling rapid institutional onboarding.
- Kalshi’s leadership frames 2026 as a tipping point for institutional adoption, highlighting the market’s utility as data on future events and hedging tools.
- Hedge funds and other large institutions have begun approaching Kalshi contractors for direct market access, indicating a demand-driven expansion.
- Regulatory uncertainty remains a central hurdle, with debates over whether prediction markets fall under sports-betting rules and concerns about insider trading.
- Industry leaders, including Nasdaq and CME, are calling for clearer rules to support broader US adoption of prediction markets, signaling potential regulatory alignment or pathways forward.
Sentiment: Neutral
Market context: The push by prime brokers sits at the intersection of expanding interest in reputation-based forecasting markets and ongoing regulatory scrutiny. As major exchanges press for clarity, policymakers in the U.S. are weighing how prediction markets should be treated in relation to traditional securities and gaming rules, shaping the pace at which institutions can experiment with these platforms.
Why it matters
The entry of prime brokers into Kalshi’s ecosystem represents more than a new distribution channel. It signals a potential inflection point for prediction markets, where institutions view event outcomes as a tool for hedging risk, benchmarking forecasts, and generating returns. Kalshi’s CEO, in a LinkedIn post, has argued that institutional adoption will accelerate in 2026 as the market’s utility becomes clearer—citing the ability of these markets to provide data on future events and a framework for hedging real-world positions. This perspective aligns with broader industry narratives that such markets can function as a complementary data layer for traditional asset classes and macro strategies.
The practical appeal for institutions is twofold: first, the ability to hedge corporate or portfolio risk using event-based contracts; second, an opportunity to participate in markets that CNBC, CNN, Bloomberg, and Fox increasingly reference alongside conventional tickers. Yet, this enthusiasm exists within a regulatory gray zone, particularly around whether certain prediction market offerings resemble sports betting and how insider information may flow through these platforms. The tension between potential financial utility and compliance risk is a central theme shaping how quickly banks and brokers move from exploration to formalized access.
Industry participants have underscored that regulatory clarity is prerequisites for scalable adoption. Executives from Nasdaq and CME recently urged regulators to establish a clearer framework for prediction markets in the United States, arguing that consistent rules protect investors and foster market integrity. The CFTC has signaled its role in overseeing such markets, while the SEC has indicated it will also be involved in defining the boundaries for these instruments. The convergence of these regulatory positions will heavily influence whether institutional traction continues or stalls as cases and compliance questions proliferate across state and federal levels.
What to watch next
- Kalshi trade launches at Clear Street are expected in late March, with additional brokers like Marex rolling out in the ensuing months.
- Regulatory clarity on the classification of prediction markets—whether they fall under sports-betting or another regulatory category—will shape product design and participant eligibility.
- Key lawsuits and ongoing regulatory actions in the U.S. will test the resilience of prediction markets amid a landscape of diversified enforcement.
- Public statements from major exchanges and regulatory bodies, including updates from the CFTC and SEC, will indicate the pace of broader adoption and potential compliance requirements.
- Institutional hedging strategies using Kalshi and similar platforms may become more visible as fund managers assess risk-off and risk-on environments amid macro volatility.
Sources & verification
- Bloomberg report dated March 11, 2026, detailing prime brokers’ race to give Wall Street access to Kalshi’s prediction markets.
- LinkedIn post by Kalshi CEO Tarek Mansour discussing expected acceleration of institutional adoption in 2026 and the market’s broader utility.
- Reuters coverage of Nasdaq and CME executives calling for clearer rules to support prediction-market adoption in the U.S.
- Statements from the Nasdaq and CME discussions about regulatory alignment, and the CFTC/SEC roles in overseeing the sector.
- Related reporting mentioning Kalshi and Polymarket valuations and potential fundraising coverage in mainstream outlets.
Institutional access to Kalshi’s prediction markets gains momentum
Institutional appetite for prediction markets is expanding as prime brokers gear up to broaden access to Kalshi’s event-led contracts. The Bloomberg report paints a picture of late-March milestones for Clear Street, which is expected to clear the first Kalshi trade soon, and Marex, poised to follow in the coming months. The strategic move signals that major financial intermediaries view prediction markets not as speculative oddities but as components of a diversified risk management toolkit. In this view, there is a push to translate the insights from prediction markets into tradable risk-management signals for complex, multi-asset portfolios.
Kalshi’s leadership has framed 2026 as a turning point, arguing that the utility of prediction markets extends beyond speculation into practical data sources for forecasting and hedging. The company’s CEO, in a LinkedIn post, emphasized that institutional adoption will accelerate as more large players recognize the markets’ potential to quantify futures scenarios and hedge exposures. As he noted, the space is no longer an early-adopter niche but a core pillar of the financial ecosystem, with billions flowing weekly through these markets. This perspective is echoed by mainstream media outlets—CNBC, CNN, Bloomberg, and Fox—who regularly cite Kalshi alongside traditional market indicators, underscoring a shift in perception from novelty to necessity.
Nevertheless, the path forward is not without friction. Clear Street and Marex acknowledge a regulatory gray area surrounding prediction markets, alongside active litigation across the United States related to sports betting and other matters. Industry participants stress the importance of robust governance and clear rules to ensure investor protection and market integrity as adoption scales. The broader regulatory dialogue—pursued by exchanges and oversight bodies alike—aims to delineate permissible activities, address insider-trading concerns, and establish a stable framework within which institutions can transact with confidence.
In parallel, major exchanges have publicly called for regulatory clarity to facilitate US adoption. Nasdaq’s chief executive executive highlighted the need to bring options markets under a familiar rule framework, suggesting that a well-defined construct could enable investors to participate in a predictable regulatory environment. The SEC and CFTC have signaled their respective roles in overseeing emerging prediction-market activity, a development that could unlock more comprehensive product design while ensuring critical guardrails remain intact. The dynamic underscores a broader industry trend: practical finance increasingly sits at the intersection of regulatory alignment and innovative market structures, where data-driven decision-making and risk mitigation converge.
What it means for the market
For traders and investors, the potential mainstreaming of Kalshi and prediction markets offers an additional source of informational signals—complementing traditional data feeds with market-based expectations about future events. It may also prompt portfolio managers to incorporate event-based hedges into strategic plans, especially for scenarios with high impact on sectors or individual holdings. The regulatory dialogue surrounding these markets will be pivotal; a clear, harmonized framework could spur broader participation, elevate liquidity, and reduce friction for institutions seeking to deploy these instruments as part of diversified risk management strategies.

Stephen Gregory, a former compliance executive at CEX.IO and Gemini, has taken over as CEO of Binance.US, a crypto exchange that was once a target of a long-running SEC lawsuit.
Binance.US, the US affiliate of crypto exchange Binance, has named compliance lawyer Stephen Gregory as CEO as the company looks to re-expand in the country.
The company said on Wednesday that Gregory took over from former CEO Norman Reed on March 9, who will now serve in an advisory role.
Gregory is the former CEO of crypto exchange Currency.com and previously served as compliance chief and counsel at CEX.IO and as a compliance officer for Gemini.
“I am honored to lead the Binance.US team as we write the next chapter for the best platform for U.S. crypto investors,” Gregory said. “The Binance.US brand is extremely powerful, with a founder, Changpeng Zhao (CZ), who has continuously advocated to make the US the crypto capital of the world.”

Binance.US once sat in legal hot water for years after it was sued by the Securities and Exchange Commission in 2023, alleging it failed to register as an exchange, among other charges.
However, the SEC dismissed its case against the company with prejudice in May, adding to one of many crypto enforcement actions the agency has recanted under US President Donald Trump’s administration.
Binance.US hints at expanded offerings
It was also just over a year ago that Binance.US reinstated US dollar deposits and withdrawals after operating as a crypto-only exchange following the SEC lawsuit.
Related: Binance sues Wall Street Journal amid report of DOJ Iran probe
The past year has also seen the company launch products to expand its rewards and staking offering, as well as a referral program.
Binance.US said in its latest announcement that it plans to continue expanding its crypto staking product and will introduce services around decentralized finance and tokenized assets.
It follows other crypto exchanges that have begun to offer products outside of solely trading, offering digital assets tied to stocks and enticing customers with various ways to earn yield.
Magazine: When privacy and AML laws conflict — Crypto projects’ impossible choice

Will Bitcoin price surge to $80k as US core inflation falls, ETF inflows jump?

Reports: Titans acquire DL Solomon Thomas from Cowboys

Barnard Castle woman to stand trial accused of stalking


-
Business6 days ago
Form 8K Entergy Mississippi LLC For: 6 March
-

 Tech7 days ago
Bitwarden adds support for passkey login on Windows 11
-

 News Videos3 days ago
10th Algebra | Financial Planning | Question Bank Solution | Board Exam 2026
-

 Fashion5 days ago
Weekend Open Thread: Ann Taylor
-

 Crypto World3 days ago
Paradigm, a16z, Winklevoss Capital, Balaji Srinivasan among investors in ZODL
-
 Tech20 hours ago
A 1,300-Pound NASA Spacecraft To Re-Enter Earth’s Atmosphere
-
 Sports6 days ago
499 runs and 34 sixes later, India beat England to enter T20 World Cup final | Cricket News
-

 Politics6 days ago
Top Mamdani aide takes progressive project to the UK
-

 Business1 day ago
ExxonMobil seeks to move corporate registration from New Jersey to Texas
-

 Sports4 days ago
Three share 2-shot lead entering final round in Hong Kong
-

 Sports4 days ago
Braveheart Lakshya downs Lai in epic battle to enter All England Open final | Other Sports News
-

 NewsBeat9 hours ago
Residents reaction as Shildon murder probe enters second day
-

 NewsBeat6 days ago
Piccadilly Circus just unveiled ‘London’s newest tourist attraction’ and it only costs 80p to enter
-

 Entertainment5 days ago
Hailey Bieber Poses For Sexy Selfies In New Luscious Lip Thirst Traps
-

 Business3 days ago
Search for Nancy Guthrie Enters 37th Day as FBI Probes Wi-Fi Jammer Theory
-

 Business20 hours ago
Search Enters Sixth Week With New Leads in Tucson Abduction Case
-
 NewsBeat2 days ago
Pagazzi Lighting enters administration as 70 jobs lost and 11 stores close across Scotland
-

 Tech3 days ago
Despite challenges, Ireland sixth in EU for board gender diversity
-

 Tech7 days ago
ACIP To Discuss COVID ‘Vaccine Injuries’ Next Month, Despite That Not Being In Its Purview
-

 Business2 days ago
Search Enters 39th Day with FBI Tip Line Developments and No Major Breakthroughs