

Crypto World
Crypto market at risk as analysts say Fed rate cuts may delay


Goldman Sachs has delayed its prediction for the first Federal Reserve rate cut to September 2026, potentially putting pressure on the crypto market.
Summary
- Goldman Sachs now expects the first Fed rate cut in September 2026, later than its earlier June forecast.
- Inflation forecasts were raised, with headline PCE seen reaching 2.9% by the end of 2026.
- Higher-for-longer rates could pressure the crypto market, as tighter liquidity often weighs on risk assets like Bitcoin.
Goldman Sachs has pushed back its forecast for when the Federal Reserve could begin cutting interest rates, warning that rising inflation risks tied to oil prices and geopolitical tensions may delay monetary easing.
In a note released on March 12, the investment bank said it now expects the first 25-basis-point rate cut in September 2026, followed by another reduction in December. Earlier projections had placed the first cut in June.
The revised outlook comes as financial markets remain uneasy about the economic impact of the ongoing conflict between the U.S. and Iran, which has raised fears of supply disruptions in global oil markets.
Inflation forecasts move higher
Goldman also raised its inflation expectations for 2026. The bank now sees headline PCE inflation reaching 2.9% by the end of the year, an upward revision of 0.8 percentage points. Core PCE inflation is projected to rise to 2.4%, while the forecast for U.S. GDP growth was trimmed to 2.2%.
Higher energy prices are the main driver of the shift. The bank now expects Brent crude to average around $98 per barrel in March and April, roughly 40% above the 2025 average. In a scenario where disruptions in the Strait of Hormuz last for a month, prices could climb above $110 per barrel.
Goldman estimates that a 10% increase in oil prices could push headline inflation up by about 0.2 percentage points.
At the same time, the firm pointed to signs of a gradually softening labor market. If employment conditions weaken more quickly than expected, earlier rate cuts could still happen, analysts said.
Traders currently assign roughly a 41% probability to a September rate cut.
What delayed rate cuts could mean for crypto
Shifts in interest-rate expectations often ripple through the digital asset sector. Cryptocurrencies such as Bitcoin and Ethereum tend to perform best when financial conditions are loosening and liquidity is expanding.
A later start to the easing cycle suggests that borrowing costs could stay higher for longer. That environment typically weighs on risk-sensitive assets, including the broader crypto market.
Stronger inflation expectations can also reduce investor appetite for speculative investments. In past cycles, digital assets have often reacted to macroeconomic news in ways similar to technology stocks.
Goldman has also pointed to geopolitical risks as a growing macro factor. Oil supply shocks, the bank said, could feed inflation and keep monetary policy tighter than markets previously expected.
Macro risks remain in focus
Short-term volatility could remain elevated if inflation readings or energy prices continue to surprise on the upside. Rising oil costs tend to filter through to consumer prices over time, which could complicate the Fed’s policy path.
However, the longer-term outlook is less certain. Goldman’s base case still expects oil prices to ease toward about $71 per barrel by late 2026, which could reduce inflation pressure and re-open the door to faster monetary easing.
For the crypto market, the key variables to watch in the coming months will likely include inflation data, energy prices, and signals from the Federal Reserve about the timing of rate cuts.

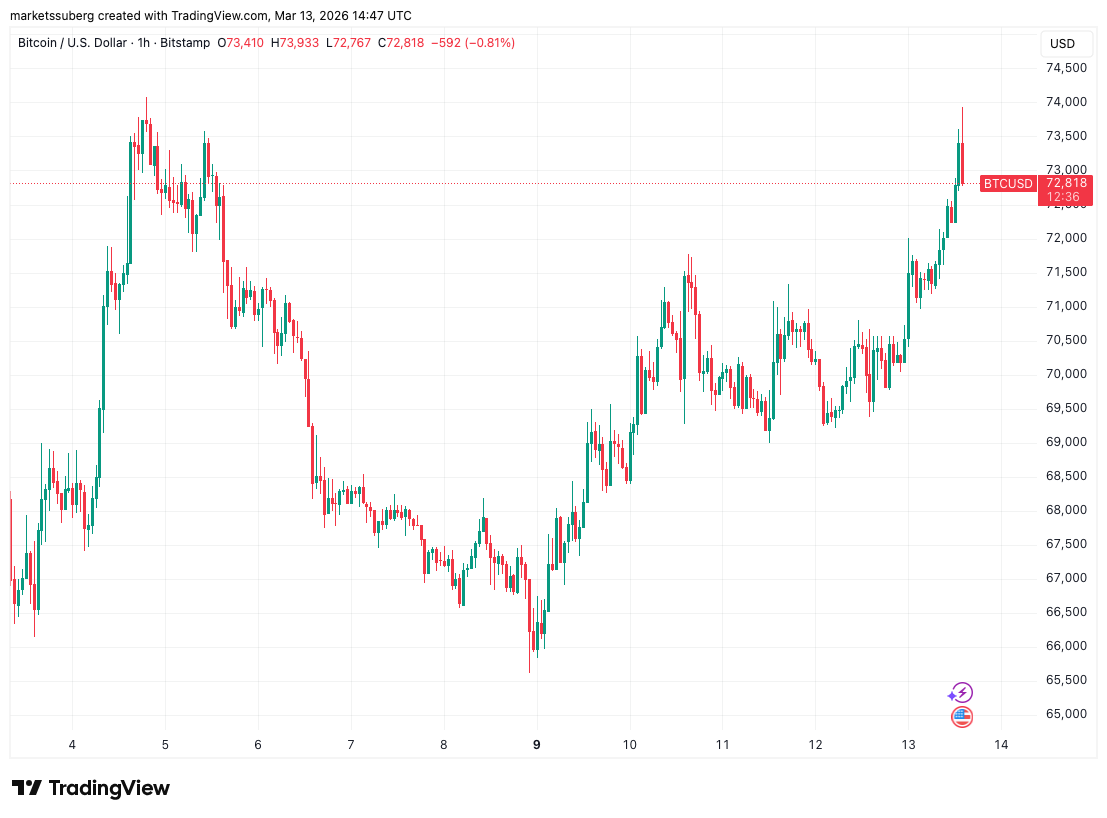
Bitcoin (BTC) aimed for five-week highs at Thursday’s Wall Street open as US inflation trends stayed on track.
Key points:
-
US inflation data keeps crypto and stocks higher as BTC price action tests $74,000 again.
-
Bitcoin traders diverge over the future of the move, with a “bearish retest” risking a new price collapse.
-
BTC/USD finally recrosses its 50-day moving average trend line.
PCE inflation emboldens Bitcoin bulls
Data from TradingView confirmed new local BTC price highs near $74,000 following the January print of the Personal Consumption Expenditures (PCE) Index.

Known as the Federal Reserve’s “preferred” inflation gauge, January PCE matched market expectations, coming in at 0.3% month-on-month and 3.1% year-on-year, per data from the Bureau of Economic Analysis.

While still at its highest levels since late 2023, the result appeared to soothe risk assets, with US stocks up around 0.5% at the time of writing.
In doing so, both risk assets and crypto began to diverge from a positive correlation to oil seen over the week. WTI crude was down 2% on the day at around $95 per barrel.

BTC price forecast: $79,000 or “bearish retest?”
Commenting on Bitcoin, crypto trader Michaël van de Poppe was cautiously upbeat on the outlook.
Related: Bitcoin’s ‘narrative vacuum,’ Ethereum now inevitable: Trade Secrets
“Resistance zone for me is between $76-79K for Bitcoin. I don’t expect a fast breakout in one-go, but I would assume that we’re going to see some extra momentum occur on the altcoin markets in that window,” he wrote in a post on X.
“In the meantime; if Bitcoin gets there, it provides a monthly engulfing candle and therefore, it erases the entire correction of February.”

Others stayed on edge, with trader Daan Crypto Trades warning of a “large drop” if the current trading zone collapsed.
$BTC If this level breaks, it’s time for a large drop. pic.twitter.com/9A6DaICCs3
— Daan Crypto Trades (@DaanCrypto) March 13, 2026
Trader Roman, already bearish, described the ongoing shift higher on BTC/USD as a “bearish retest.”
“RSI bear divs, bear price action (volume down + price up), & complete reset of MACD,” he summarized, referring to the relative strength index (RSI) and moving average convergence/divergence (MACD) price indicators on daily time frames.

In fresh updates on his Telegram channel on the day, meanwhile, independent analyst Filbfilb focused on open interest (OI).
Market observers, he said, should watch for OI to “ditch” — an event that would precede the end of the push higher.

“No sign yet,” he acknowledged, noting that price was now interacting with its 50-day simple moving average (SMA).
As Cointelegraph reported, this was a key overhead resistance zone of interest during previous breakout attempts.

This article does not contain investment advice or recommendations. Every investment and trading move involves risk, and readers should conduct their own research when making a decision. While we strive to provide accurate and timely information, Cointelegraph does not guarantee the accuracy, completeness, or reliability of any information in this article. This article may contain forward-looking statements that are subject to risks and uncertainties. Cointelegraph will not be liable for any loss or damage arising from your reliance on this information.

A crypto-backed development push on the Caribbean island of Nevis is drawing scrutiny as a Belgian-born investor advances a plan to convert roughly 2,400 acres into a tech-friendly, libertarian enclave. Destiny, the project led by Olivier Janssens, has proposed a steady stream of citizen grants alongside a multi-decade infrastructure program, aiming to reshape a portion of Nevis into what its proponents describe as a futures-focused urban community. The initiative comes with a controversial twist: residents could begin receiving monthly stipends of $100 in the near term, a policy that critics say amounts to political influence-peddling and raises anti-corruption concerns as the government weighs the proposal. The latest figures show Destiny intends to pour $50 million into the island’s infrastructure to fund hospitals, health centers, villas and job creation, while distributing a share of profits to citizens and a sovereign wealth fund. The project seeks authorization under St. Kitts and Nevis’ Special Sustainability Zones regime, a framework that parliament passed in 2025 to facilitate such developments.
Key takeaways
- Destiny plans to acquire and restructure about 2,400 acres on Nevis, pairing a major land redevelopment with a $50 million infrastructure program to fund hospitals, health centers and housing.
- Residents would receive $100 per month once the final government agreement is approved, up from the initial 30 East Caribbean dollars (about US$11) announced in November 2025.
- Opponents argue the stipend is an attempt to sway public opinion and government decisions, calling for an investigation under anti-corruption law.
- The project is pursuing permission under the territory’s Special Sustainability Zones regime, approved in 2025 to enable large-scale, sovereign-backed development initiatives.
- Destiny’s model reflects a broader crypto-inflected “city-building” trend discussed by founders seeking new governance experiments, including high-profile figures who advocate land-buying and community creation as a form of “exit” from traditional institutions.
Tickers mentioned:
Sentiment:
Market context: The Nevis proposal arrives amid a wave of crypto-enabled urban ventures that leverage offshore jurisdictions and new regulatory regimes to test governance, funding models and citizen-participation schemes within a evolving regulatory landscape.
Why it matters
The Destiny project sits at the intersection of crypto wealth, political risk and economic development in a small Caribbean jurisdiction. By proposing to buy and restructure a sizable tract of land and commit a substantial infrastructure budget, Destiny taps into a growing appetite among cryptocurrency founders to experiment with new urban forms. The approach blends private capital, tokenless governance concepts and citizen benefits, raising questions about accountability, long-term sustainability, and how such schemes should be regulated in jurisdictions that balance attraction with the need for oversight.
At the heart of the debate is the compensation mechanism promised to residents. Destiny has signaled a monthly stipend of $100 would be paid immediately after final government approval to participate in the venture. That figure marks a substantial increase from its earlier commitment of 30 East Caribbean dollars per month (roughly US$11). Critics argue that this is a form of influence buying, designed to curry favor with local authorities and sway public sentiment. Kelvin Daly, a member of Nevis’ Reformation Party, condemned the move as a coercive pressure tactic, arguing it amounts to private-sector interference in domestic socioeconomic policy. He urged authorities to probe potential breaches of anti-corruption laws in connection with the program.
Destiny’s leadership frames the project as a pathway to broader economic resilience. The plan envisages 10% of profits returned to Nevis’ citizens and another 10% funneled into the territory’s sovereign wealth fund, aligning private development with public benefit. If approved, the initiative would begin channeling tens of millions into the island’s infrastructure, including healthcare facilities and housing, while creating jobs for residents and potentially catalyzing further private sector investment. The framework under which Destiny seeks approval—St. Kitts and Nevis’ Special Sustainability Zones Act—was crafted to authorize and regulate ambitious, cross-border development efforts in a way that is meant to balance innovation with oversight. The 2025 act represents a formal mechanism to enable such projects, providing a legal pathway for foreign-backed ventures that promise social and economic returns to local communities.
The broader crypto city-building trend has drawn attention from prominent figures in the space. Balaji Srinivasan, a former Coinbase executive and early advocate of technologically driven, community-led cities, highlighted the concept at the Network State Conference in Singapore in October 2025. In his remarks, Srinivasan urged crypto and tech enthusiasts to collectively acquire land and assemble tech-forward communities, framing the endeavor as Silicon Valley’s “ultimate exit” from perceived failings in traditional U.S. institutions. He also presented research suggesting there are about 120 “start-up societies” in varying stages of development worldwide, underscoring the scale of this movement beyond a single project. The discourse surrounding these ideas highlights a broader aspiration within parts of the crypto ecosystem to reimagine governance, citizenship, and public services through distributed, decentralized methods.
Destiny’s public-facing materials emphasize a long-term commitment to the Nevis landscape. The project contends that the land purchases and infrastructure investments would not only provide amenities for residents but also help position Nevis as a testing ground for governance models that blend private capital with public benefit. Still, the initiative’s reception on the ground has been mixed, with critics warning that high-profile incentives could distort local decision-making processes and invite scrutiny from anti-corruption watchdogs. The Nevis government’s timeline for final approval remains unclear, and observers will be watching closely for how regulators interpret the Special Sustainability Zones Act in the context of this proposal.
Sources and statements tied to the project point to a nuanced dynamic between ambition and risk. An email report cited by the Financial Times describes the monthly payment structure and its conditional nature on securing a final agreement, while the Special Sustainability Zones Act page on SKNIS outlines the statutory framework that would govern such initiatives. Destiny’s communications and the timing of government decisions will likely shape both investor confidence and local sentiment in the months ahead. The discourse around this project sits at the confluence of venture capital appetite, political accountability, and the evolving regulatory landscape for crypto-enabled urban experiments.
Project Destiny, preview. Source: Destiny.com
Bitcoin (CRYPTO: BTC) has a long-standing place in the lore of Destiny’s founder, with Janssens described as an early investor and a former member of the Bitcoin Foundation board in 2015, during which the group’s status was publicly questioned. This history is cited in discussions about the project’s credibility, as well as the broader narrative of crypto-led city-building that continues to attract both supporters and critics.
What to watch next
- Timeline for final government approval under the Special Sustainability Zones Act, with any public disclosures from SKN authorities.
- Regulatory or anti-corruption inquiries related to the $100 monthly stipend proposal and the broader governance framework.
- Progress on Destiny’s $50 million infrastructure plan, including hospital and housing milestones and job-creation metrics for Nevis residents.
- Reactions from local communities and political parties to the citizen-profit-sharing model and the long-term governance structure of the project.
- Updates from other high-profile crypto-city initiatives, including any new documents or speeches from proponents like Balaji Srinivasan and related ventures.
Sources & verification
- Financial Times reporting on Destiny’s payment proposal and government-facing communications (email seen by FT).
- Special Sustainability Zones Act 2025 documentation from SKNIS outlining the regulatory framework.
- Destiny’s public materials and references to the proposed $50 million infrastructure program and profit-sharing commitments (Destiny.com).
- Balaji Srinivasan’s Network State Conference remarks and the referenced document detailing a 120-start-up-society framework.
- Historical references to the Bitcoin Foundation’s status and Janssens’ involvement in 2015 (as cited by crypto press and analysis).
Destiny’s Nevis plan tests crypto-led city-building and regulatory risk
Olivier Janssens, a crypto veteran whose early Bitcoin investments and past board roles have anchored him in the sector’s lore, is steering a bold experiment on Nevis. The Destiny project envisions acquiring and restructuring approximately 2,400 acres with an eye toward crafting a “tech-friendly libertarian” community that blends innovation with public-services investment. The proposed model relies on a mix of private capital and public benefits—chief among them a 10% profit share for citizens and another 10% for Nevis’ sovereign wealth fund—paired with a robust infrastructure program aimed at improving healthcare facilities, housing, and local employment.
While the economic calculus sounds appealing on its face, the political optics of the plan have triggered friction. A key demand from opponents is greater scrutiny of the incentive structure and the potential for influence on public decision-making. Kelvin Daly, a member of Nevis’ Reformist Party, publicly described the plan as “influence buying” and urged authorities to look into possible breaches of anti-corruption statutes. The social contract being advanced with Destiny would hinge on final government approval—an approval that has yet to be publicly reconciled with the island’s regulatory environment. The dispute underscores a broader tension in crypto-city projects: the desire to accelerate development through outsized private funding versus the need for transparent governance and credible oversight.
Destiny’s formal path forward rests on the Special Sustainability Zones regime, a 2025 statute designed to accommodate ambitious, cross-border schemes that promise measurable community benefits. The legal framework aims to strike a balance between attracting foreign investment and ensuring governance remains accountable to residents. In parallel, Destiny’s critics and supporters alike are watching a broader narrative in which crypto founders advocate for a more decentralized, entrepreneurial approach to city-building as a potential alternative to traditional governance models. The movement is not isolated: Balaji Srinivasan highlighted similar ideas at a major conference in Singapore, circulating a vision of “start-up societies” and land ownership as a lever for sustainable, tech-forward communities. The discussion signals both opportunity and risk as jurisdictions weigh the implications of crypto-enabled development in a world where regulatory expectations are still evolving.
The Financial Times report, SKNIS documentation, and Destiny’s own materials collectively frame a transformation in how offshore territories might partner with private developers to deliver public goods. If the government ultimately approves the plan, Nevis could become a focal point for a new class of experiments at the intersection of crypto finance, governance, and urban planning. The next steps will likely reveal whether such ventures can responsibly balance private ambition with public accountability, and whether residents see meaningful long-term dividends beyond the immediate monthly stipends.

The U.S. Treasury Department imposed sanctions on six individuals and two companies it says helped North Korea convert $800 million in 2024 into crypto to launder the money and fund its weapons of mass destruction (WMD) programs.
The Treasury’s Office of Foreign Assets Control (OFAC) said Thursday that the operation placed IT workers into foreign companies and channeled their earnings back to Pyongyang. The network operated across multiple countries including Vietnam, Laos and Spain, according to the Treasury.
The Democratic People’s Republic of Korea (DPRK) has for years targeted cryptocurrency protocols and networks to steal and launder funds. Last year, hackers linked to the country stole a record $2 billion of crypto, according to the blockchain analytics firm Chainalysis.
The sanctioned network relied on a mix of crypto infrastructure, including centralized exchanges, hosted wallets, decentralized finance (DeFi) services and cross-chain bridges, to facilitate movement of the funds, Chainalysis said in a post on its website.
OFAC’s designation included 21 crypto wallet addresses across several blockchains including Ethereum, Tron and Bitcoin, reflecting what the Chainalysis researchers described as the DPRK’s increasingly multichain approach to moving and obscuring illicit funds.
“The North Korean regime targets American companies through deceptive schemes carried out by its overseas IT operatives, who weaponize sensitive data and extort businesses for substantial payments,” Secretary of the Treasury Scott Bessent said in the statement.
According to Treasury, DPRK-backed teams used fraudulent documentation, stolen identities, and fabricated personas to gain employment with legitimate companies, including those in the U.S. and allied countries.
The North Korean government then reportedly appropriated most of the wages earned by these overseas IT workers, generating hundreds of millions of dollars for its WMD and ballistic missile programs. Some of the workers were able to introduce malware into company networks to extract proprietary and sensitive information.
Among those sanctioned is Nguyen Quang Viet, CEO of Vietnam-based Quangvietdnbg International Services Co., whom the Treasury said converted roughly $2.5 million into cryptocurrency for North Korean actors between mid-2023 and mid-2025.

Key Takeaways
- Zillow (Z) touched a 52-week low at $41.91, representing a 38% decline year-over-year
- Shares are trading 55% beneath the 52-week peak of $93.88
- JPMorgan argues that concerns over AI threats and legal issues are exaggerated
- Company’s board greenlit a $1.25 billion expansion to its stock repurchase program
- Shares climbed approximately 6% Friday following JPMorgan’s analysis before the March 24 AI event
Zillow’s shares experienced a turbulent week before staging an unexpected Friday recovery.
Following a dip to a 52-week bottom of $41.91 early in the week, Zillow (Z) rallied approximately 6% Friday after receiving supportive commentary from JPMorgan. The investment firm challenged the pessimistic outlook that has weighed on shares.
The real estate platform has shed roughly 38% of its value over the trailing twelve months. In just the last half-year, shares have plunged almost 49%. At its nadir, the stock was changing hands 55% under its 52-week peak of $93.88.
Despite the substantial markdown, the company maintains a market capitalization approaching $10 billion.
JPMorgan contended that prevailing worries surrounding artificial intelligence threats, pending litigation, regulatory headwinds, and modifications to listing protocols are being magnified beyond reason by market participants. The firm believes investors are failing to properly value Zillow’s fundamental business operations and long-range strategic positioning.
The financial institution also highlighted Zillow’s forthcoming AI summit scheduled for March 24 as a possible inflection point. JPMorgan suggested the gathering could showcase how Zillow’s proprietary data assets, integrated operations, and end-to-end platform provide the firm with sustainable competitive advantages.
Technical indicators continue flashing a “sell” signal for the equity, which remains down approximately 40% year-to-date. Daily trading volume averages roughly 4.3 million shares.
Fourth Quarter Results: Modest Performance
Zillow delivered Q4 2025 financial results that presented a split outcome. The company posted revenue of $654 million, exceeding analyst projections of $650.23 million. However, earnings per share registered at $0.39, falling marginally short of the $0.40 consensus estimate.
On the analyst coverage side, Keefe, Bruyette & Woods lowered its price objective from $65 to $60 while maintaining its Market Perform designation. The research group observed that Zillow’s 2026 outlook aligned largely with Street expectations, though profitability headwinds stemming from litigation expenses were identified as a risk factor.
William Blair similarly maintained its Market Perform stance following the buyback disclosure.
Share Repurchase Initiative Bolstered
Zillow’s board of directors authorized a substantial enhancement to its stock repurchase framework. Management added $1.25 billion to the existing authorization, elevating total remaining buyback capacity to approximately $1.3 billion.
InvestingPro analytics identified Zillow as possibly trading below intrinsic value at present price levels. The service additionally observed that the equity has exhibited significant price volatility, aligning with recent trading patterns.
JPMorgan’s assessment and the March 24 AI summit represent the primary near-term catalysts capturing investor attention.


The TRUMP token rallied from an all-time low after news that Donald Trump will host an exclusive investor gala.
President Donald Trump has announced an exclusive gala and conference for the leading Official Trump (TRUMP) meme coin investors to be held at Mar-a-Lago in April 2026.
Reacting to the news, the token surged by more than 50% just moments after it had recorded a new all-time low.
Trump’s Second Gala Event
The TrumpMeme X account described the April 25 gathering at Mar-a-Lago as “the most exclusive crypto and business conference in the world & gala luncheon.” The announcement invited the top 297 holders of the TRUMP meme coin to come and join the U.S. president and 18 other undisclosed personalities at the event.
The website also promotes an “exclusive bonus” offering a VIP reception and talk to 29 qualifying members. According to the post, VIP eligibility is based on participants’ time-weighted TRUMP holdings as recorded on April 10, 2026. Additionally, investors must maintain at least the same balance through April 26 to retain full VIP benefits.
This isn’t the first time Trump has held such an event. Last year, the president hosted a similar gala dinner for the 220 largest investors of the coin. At that conference, attendees holding more than $111 million in TRUMP received priority seating. Overall, the event raised about $148 million, and some seats cost attendees up to $1.5 million.
As a result, critics argued that the president was profiting directly from his office by tying access to him with crypto investments. Some legal experts also described the dinner as “a simple bribe,” implying that the investors were made to pay for influence.
TRUMP Token Rallies by 30%
Prior to the news breaking about the TRUMP gala, the meme coin had been on a downward spiral, going from nearly $5.80 in January to a new all-time low on March 12, when it struck $2.73 per CoinGecko data.
You may also like:
However, it perked up immediately after the announcement, first shooting straight to $4.5, before gradually making its way to the $4 level, where it still was at the time of writing.
The project’s team has been making efforts to try and revive interest in the meme coin through new ecosystem initiatives. Last month, it announced plans for yield and liquidity programs through Kamino vaults, new market makers, and a fund to back ecosystem projects.
However, those efforts had not resulted in increased trading activity, with the price sticking largely to its downward spiral. But now, the new price marks an over 30% improvement in the last 24 hours, with longer timeframes also turning green. Across seven days, TRUMP was up more than 25%, while the increase stood at nearly 15% over two weeks.
On the monthly timeframe, the meme coin has gained over 28%, although it is still down nearly 60% year-on-year and sits approximately 95% from its January 2025 all-time high.
Binance Free $600 (CryptoPotato Exclusive): Use this link to register a new account and receive $600 exclusive welcome offer on Binance (full details).
LIMITED OFFER for CryptoPotato readers at Bybit: Use this link to register and open a $500 FREE position on any coin!

Key Points
- International authorities successfully dismantle SocksEscort network, confiscating 34 domains and 23 servers globally.
- Criminal operation compromised more than 369,000 routers across 163 nations worldwide.
- Law enforcement freezes $3.5 million in cryptocurrency linked to the illicit proxy service.
- AVRecon malware served as the backbone for SocksEscort, facilitating fraud, ransomware distribution, and DDoS campaigns.
- International collaboration demonstrates effective cross-border cooperation in combating sophisticated cybercrime.
A sophisticated international cybercrime operation has been successfully dismantled following coordinated action by Europol and United States law enforcement agencies. The operation targeted SocksEscort, an illicit proxy service that weaponized more than 369,000 compromised devices spanning 163 nations. Authorities confiscated multiple domains and servers while freezing $3.5 million in cryptocurrency assets, effectively terminating this extensive IP cloaking scheme.
The enforcement action resulted in the disconnection of compromised modems, rendering the criminal service inoperable. Affected nations will receive notification regarding infected routers within their jurisdictions to enable follow-up actions. This collaborative takedown represents a milestone achievement in global efforts to combat sophisticated cybercrime infrastructure.
The SocksEscort platform enabled threat actors to conceal their geographical locations while executing fraud schemes, ransomware campaigns, and various digital offenses. Operating as a commercial service, it provided access to over 35,000 proxy connections to paying customers seeking anonymous criminal operations. Law enforcement officials indicate this IP cloaking infrastructure enabled extensive attack campaigns and significant financial crimes.
Worldwide Criminal Infrastructure Exposed
Investigators documented SocksEscort operations spanning 163 countries, with infections affecting residential and small business networking equipment. The malicious infrastructure redirected internet communications through compromised devices, effectively obscuring the true origin points of criminal traffic. Thousands of victims in the United States and United Kingdom were identified, demonstrating the operation’s extensive international footprint.
Threat actors exploited this network to infiltrate banking systems and cryptocurrency platforms, while also submitting fraudulent financial claims. One documented U.S. victim suffered approximately $1 million in cryptocurrency losses attributed to attacks routed through this infrastructure. The criminal enterprise reportedly commenced operations in 2020 and experienced rapid expansion.
By February 2026, SocksEscort maintained access to 8,000 compromised routers, with 2,500 located within U.S. borders. Black Lotus Labs conducted extensive tracking of the botnet, identifying the AVRecon malware as the operational foundation. This IP cloaking infrastructure represented a substantial threat to global digital security.
Coordinated Enforcement Action and Continuing Probes
Europol and the Department of Justice spearheaded a synchronized enforcement operation, confiscating 34 domain names and 23 servers distributed across seven countries. U.S. authorities successfully froze $3.5 million in cryptocurrency directly associated with SocksEscort financial transactions. Compromised devices were systematically disconnected, eliminating the operational IP cloaking infrastructure.
Affected nations are receiving official notifications to facilitate continued investigations and potential prosecution efforts. The operation showcases the power of international coordination in neutralizing sophisticated cybercrime infrastructure. The disruption of this router-based IP cloaking operation will substantially hinder similar criminal activities moving forward.
SocksEscort specifically exploited small-office and home-office networking devices, providing criminals with capabilities to execute precision fraud operations. Law enforcement confirmed the proxy infrastructure facilitated ransomware deployment, distributed denial-of-service attacks, and illegal content distribution. The termination of SocksEscort eliminates one of the most extensive IP cloaking operations documented in recent years.


US equities keep climbing, but JPMorgan data show retail equity buying down about 30%, shifting crypto’s driver mix toward macro funds just as Iran, oil and inflation risks linger.
Summary
- Nasdaq 100 and Russell 2000 are up over 1%, with the Dow also higher, reinforcing a risk‑on equity regime that historically supports BTC and large‑cap crypto.
- JPMorgan says US retail equity buying has slowed roughly 30%, with ETF inflows down about 22%, marking the first persistent fatigue of 2026.
- If retail fatigue deepens into an Iran‑ or inflation‑driven shock, the “buy the dip” cushion under both stocks and crypto could vanish, amplifying liquidation risk.
US equities are grinding higher on the surface, but retail is quietly stepping off the gas — a mix that keeps the risk‑on narrative alive while thinning out the marginal buyer underneath crypto.
U.S. indices extend gains
Major U.S. stock indices opened higher, with the Nasdaq 100 and Russell 2000 each up more than 1%, while the Dow Jones Industrial Average added about 0.7% in early trading. The move extends a broader pattern of dip‑buying and resilience across U.S. equities, even as macro headlines around Iran, oil and inflation continue to inject bouts of volatility. Tech and small caps leading the advance reinforces the idea that investors are still willing to lean into higher‑beta risk, a backdrop that has historically correlated with strong flows into Bitcoin and large‑cap crypto.
What matters here for crypto is not just the level of indices, but the regime: higher equities, narrower credit spreads and contained volatility indexes tend to support appetite for leveraged trades in BTC and ETH. As long as this regime persists, sharp equity pullbacks are more likely to be seen by macro funds as tactical buying opportunities rather than the start of a broader de‑risking, which tempers the odds of a synchronized dump across stocks and digital assets.
JPMorgan flags retail fatigue
Underneath the headline gains, though, JPMorgan data shows U.S. retail investors are starting to ease off. In a note cited by the Wall Street Journal and MarketWatch, the bank reports that retail net buying of U.S. equities has slowed by roughly 30% versus prior weeks, breaking a several‑month pattern of persistent dip‑buying. Weekly flows into equity ETFs have dropped by about 22% over the period, with investors cutting both ETF contributions and single‑stock purchases.
JPMorgan’s team describes these trends as signs of “persistent” or “ongoing” fatigue, rather than a single‑day wobble, with Monday marking the largest net‑selling day for individual stocks in about a month. That shift matters because the same cohort that has aggressively bought U.S. tech and thematic ETFs has also been a marginal buyer of crypto‑adjacent stocks and, to a lesser extent, spot Bitcoin products.
Implications for crypto positioning
For crypto traders, the combination of strong index prints and softer retail flows means the marginal driver of risk is skewing more institutional and macro rather than retail FOMO. If equities keep drifting higher while retail accelerates its slowdown, Bitcoin and Ethereum may increasingly trade off futures flows, systematic strategies and macro funds’ views on inflation and the Fed, rather than Reddit‑style chase behavior.
The main risk to watch is a scenario where retail fatigue deepens just as a macro shock hits — for example, hotter‑than‑expected inflation or a renewed spike in oil linked to Iran — removing the “buy the dip” bid that has repeatedly stabilized both stocks and crypto over the past quarters. Until then, the tape remains risk‑on, but the composition of buyers is quietly shifting in a way crypto desks cannot ignore.
TLDR
- Yield-bearing stablecoins grew 15 times faster than the broader stablecoin market over six months.
- Circle’s USYC and Paxos’ USDG led gains with market cap increases of 198% and 169%.
- The total value of yield-bearing stablecoins reached $22.7 billion after an 11% monthly rise.
- Maple’s Syrup USDC offered the highest weekly yield at 4.54% APY, according to Messari.
- US lawmakers remain divided as the Senate delays action on the crypto market structure bill.
Yield-bearing stablecoins expanded rapidly over the past six months, according to Messari. The research firm reported that these tokens grew 15 times faster than the broader stablecoin market. However, US lawmakers remain divided over how federal law should treat crypto-linked yield.
Messari published its findings on Thursday and outlined sharp market cap increases across major tokens. The report showed that yield-bearing products attracted rising demand while the overall stablecoin market grew modestly. Meanwhile, lawmakers continue to debate provisions in pending digital asset legislation.
USYC and USDG Lead Growth in Stablecoins Segment
Circle’s USYC recorded a 198% increase in market capitalization over six months. Paxos’ Global Dollar (USDG) posted a 169% rise during the same period. Messari stated that these gains far outpaced the 9% growth in the broader stablecoin market.
The firm said the largest yield-bearing stablecoins now function like money market funds or bank deposits. “The winners don’t do payments,” Messari wrote in the report. It added that leading issuers focus on single-asset exposure rather than payment use cases.
Yield-bearing stablecoins began outpacing overall supply growth in mid-October 2025. The trend pointed to a stronger demand for blockchain-based dollar products offering yield. Stablewatch data showed the sector reached $22.7 billion after an 11% rise in 30 days.
That figure doubled the $11 billion recorded in May 2025. Still, yield-bearing tokens account for 7.4% of the $303 billion stablecoin market. The share stood at 4.5% in May last year.
USDD, USDY, and Top APYs Draw Policy Scrutiny
Tron DAO-linked Decentralized USD (USDD) rose 114% in market value over six months. Ondo Finance’s Ondo US Dollar Yield (USDY) increased 91% during the same timeframe. DefiLlama ranked Sky’s sUSDS, Ethena’s sUSDe, and Maple’s Syrup USDC among the largest by value.
Maple’s Syrup USDC offered a 4.54% annual percentage yield this week. Maple USDT followed with a 4.17% APY, while Sky Lending’s sUSDS posted 3.75%. Ethena’s USDe delivered a 3.49% APY, according to Messari data.
Lawmakers continue to debate how to regulate yield-bearing stablecoins under federal law. Senate Majority Leader John Thune said the chamber will not advance the market structure bill before April. Banking groups argue that yield features could shift deposits away from traditional banks.
The Senate Banking Committee delayed its markup in mid-January as bipartisan talks continued. President Donald Trump criticized the delay and urged faster action on the bill. The House passed the Digital Asset Market Structure Clarity Act on July 17, 2025.
The GENIUS Act became law on July 18, 2025, and it restricts interest on payment stablecoins. However, the law allows third-party platforms to offer reward programs tied to holdings. Debate over yield provisions continues as the Senate reviews the legislation.
Bitcoin is adding to overnight gains in early U.S. trading on Friday, continuing to show strong relative price action after many months of underperformance to assets like stocks and precious metals.
Trading at $73,500, bitcoin is higher by nearly 5% over the past 24 hours, with most of those gains coming after U.S. Treasury Secretary Scott Bessent on Thursday evening said the Trump administration is taking concrete steps to try and cap surging oil prices.
Bitcoin is now higher by about 11% since the Iran war broke out, outperforming broad U.S. stock indices and gold, both of which have lost ground since the bombs began dropping about two weeks ago.
WTI oil on Friday is trading at $94.50 per barrel, down from a high of nearly $98 on Thursday. U.S. stocks are posting gains of about 0.5%.
Oil raises stagflationary risk
The recent spike in oil prices is putting direct pressure on household budgets and, if sustained, could weaken consumer spending and slow economic growth, according to Olu Sonola, head of US economics at Fitch Ratings.
“Yes, the broader economy is still expected to grow at trend, but that forecast increasingly looks fragile as downside risks accumulate. … The Fed can shrug off pockets of weakening growth, but resurgent inflation severely limits its room to maneuver, leaving policy potentially stranded for months,” he wrote in a note.
Relief bounce
After a period of some of the worst sentiment in bitcoin’s history, it’s perhaps not too surprising that there’s been some modest gains of late.
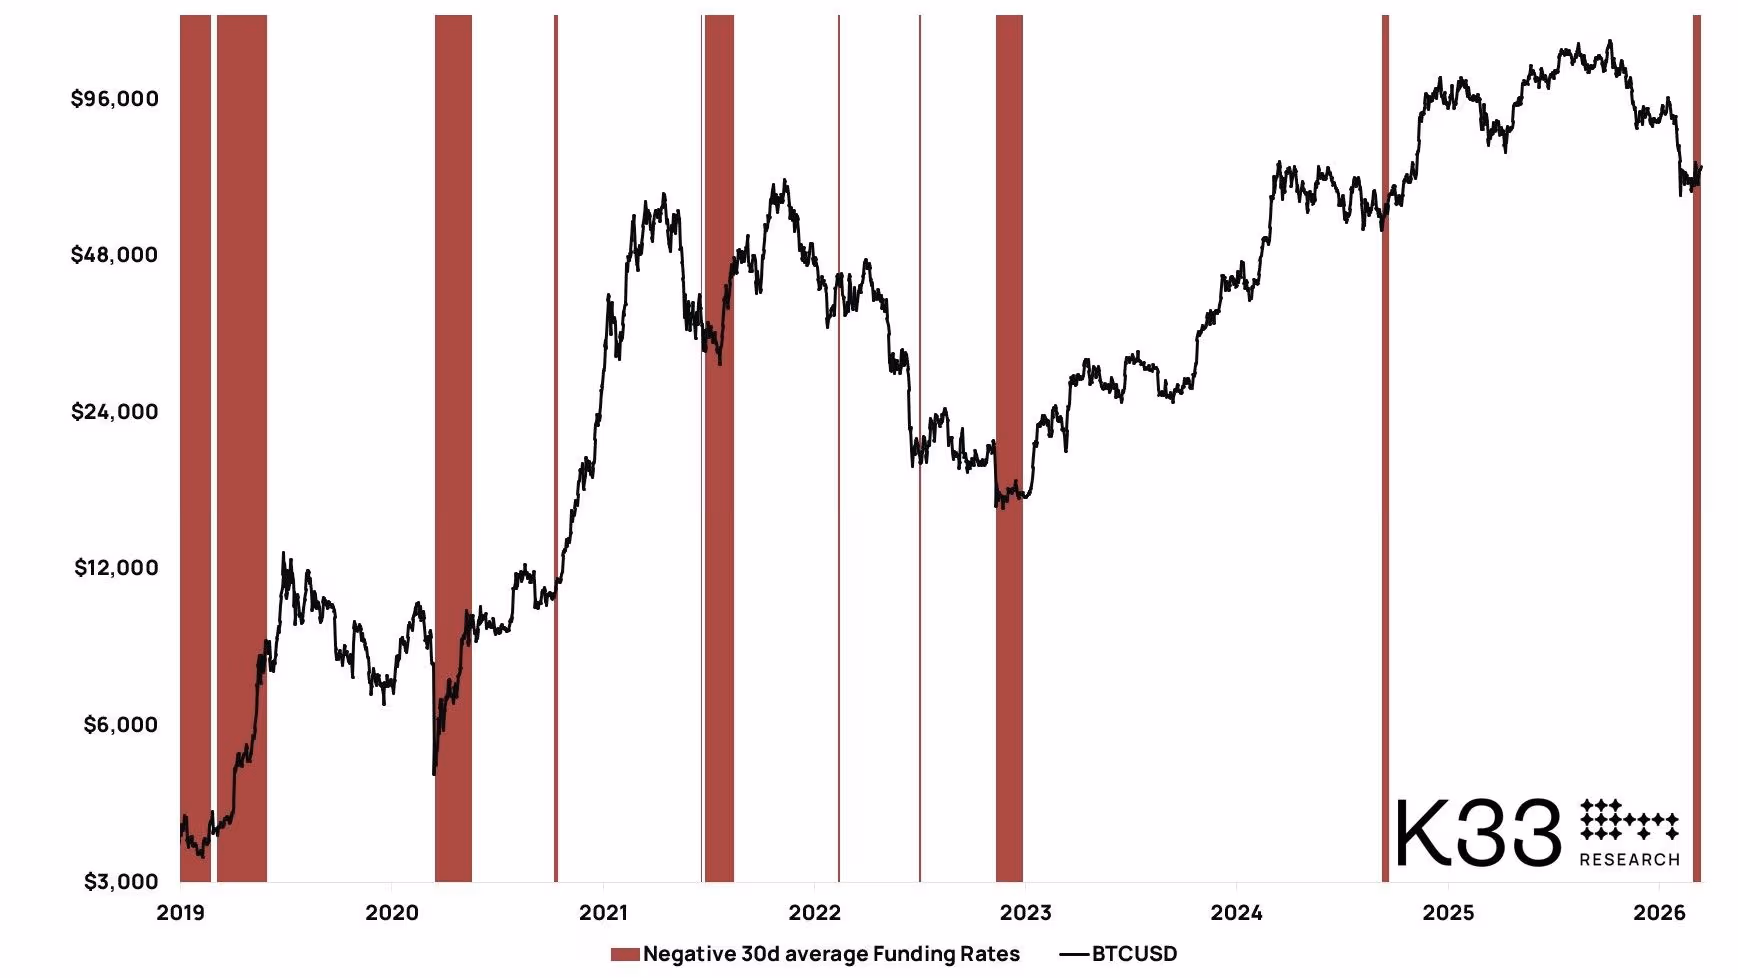
Funding positioning of perpetual futures traders has been negative for the longest period since late 2022, K33 Research analyst Vetle Lunde noted. This means traders who are shorting bitcoin are paying longs to keep their trades open, resulting in a negative funding rate. Late 2022, of course, coincided with the aftermath of the FTX crash when BTC traded around $16,000 versus $69,000 one year earlier.
The 30-day average funding rate has now been negative for 14 consecutive days, the longest since December 2022, Lunde pointed out. These negative streaks coincided with local price bottoms over the past seven years, he added.
In the meantime, bitcoin open interest in perpetual and dated futures has risen 9% over the past 24 hours to around 700,000 BTC, the highest level since Feb. 6. Add it all up, and that creates the conditions for a short squeeze.

Friday gain
The day isn’t over yet, but this would be the first Friday gain since the Middle East conflict began on Feb. 27. That might suggest a less volatile weekend for crypto, which has gotten in the habit of declining on Saturdays and Sundays in recent weeks.
March is also shaping up to be a turning point for bitcoin. The asset is up about 8% so far this month. Again, it’s early, but a March advance would break BTC’s five-month losing streak.
Day-one trading volume for ETHB on Nasdaq reached over $16.5 million.
BlackRock’s iShares Staked Ethereum Trust ETF (ETHB) saw a strong debut on the Nasdaq on Thursday, March 12, drawing $43.48 million in net inflows and recording $16.54 million in trading volume on its first day, according to data from SoSoValue.
The only U.S. spot ETH ETF to outperform ETHB in net inflows on the day was Fidelity’s FETH, which pulled in just over $52 million, and saw $83.91 million in trading volume yesterday.
BlackRock’s spot-only Ethereum ETF, ETHA, saw $18.68 million in net inflows on the same day.
Bloomberg ETF analyst James Seyffart called the debut “very, very solid for a day 1 ETF launch” in an X post on Thursday.
As The Defiant reported yesterday, ETHB is BlackRock’s third crypto ETF and its first to incorporate staking, combining spot ETH exposure with monthly staking income. Coinbase Prime handles ETH custody, per the firm’s press release.
The product carries a 0.25% sponsor fee, waived down to 0.12% for the first year on up to $2.5 billion in assets.
According to the fund’s prospectus as of March 11, filed with the U.S. Securities and Exchange Commission (SEC), BlackRock intends to stake between 70% and 95% of the trust’s ETH holdings “under normal market circumstances.”
BlackRock also said in its prospectus that it will stake ETH either via its ETH custodian, aka Coinbase, with one or more staking services providers, which could be Coinbase affiliates, or “other approved third-party validators.”
As The Defiant previously reported, ETHB is not the first staked ETH product in the U.S., but BlackRock’s market dominance across both Ethereum and Bitcoin ETFs in the U.S. makes ETHB’s entry a significant moment for the staked ETH market.
The launch follows key regulatory milestones that cleared the path for yield-bearing crypto ETFs. An SEC division issued staff guidance last May stating that staking is not a securities transaction — a staff-level position, not a formal rule — and the SEC formally acknowledged BlackRock’s staking filing last July.
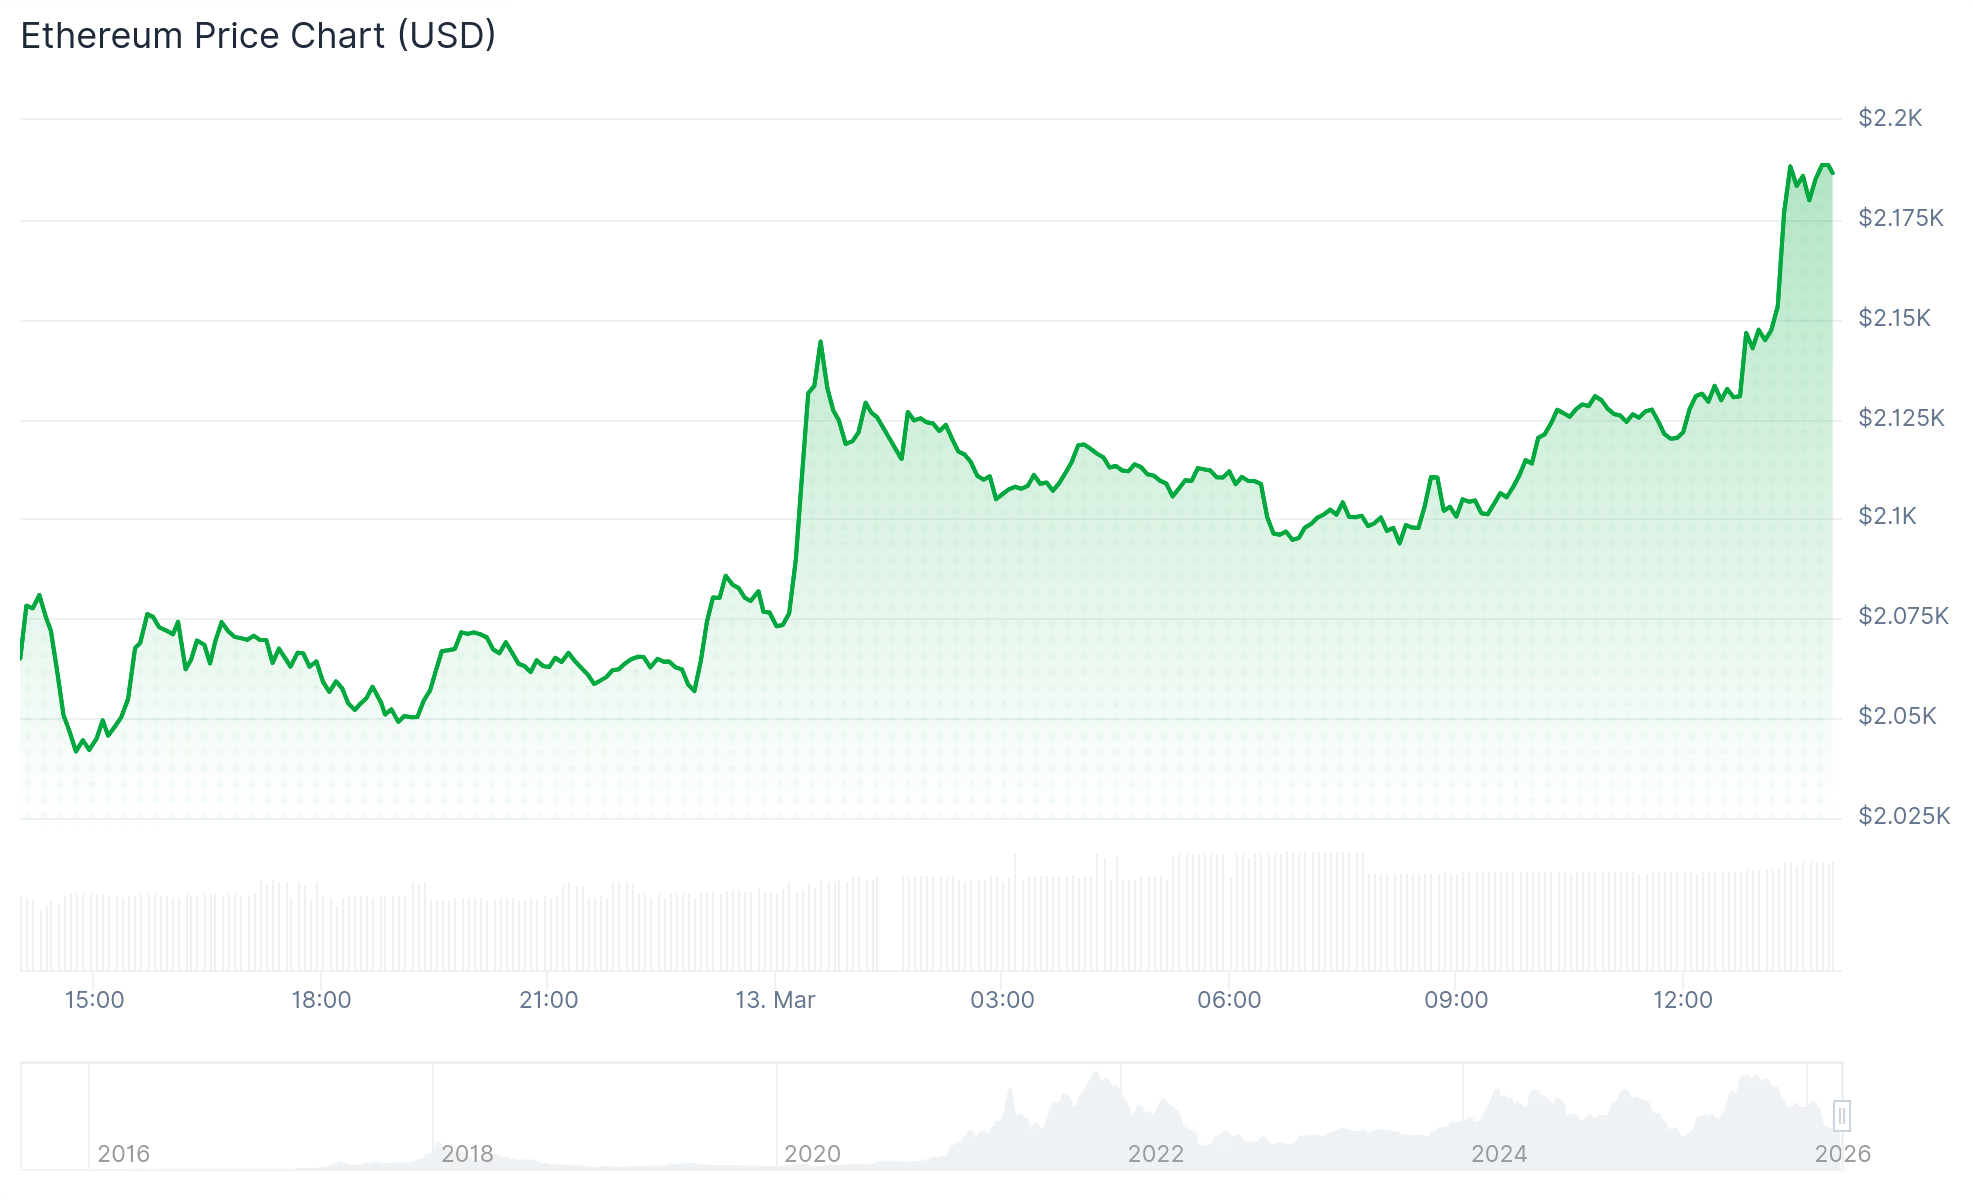
The spot price of ETH rallied about 6% over the past 24 hours, reaching almost $2,200. ETH is now up on the weekly and monthly timeframes, 7% and 12% respectively.

This article was written with the assistance of AI workflows. All our stories are curated, edited and fact-checked by a human.

The First 5 Minutes Of One Piece Season 2 Is Peak Aura Farming

Winners announced in Horwich Town Council by-elections

WBC 2026 South Korea vs Dominican Republic Preview: Who Will Win?

Smart energy pays enters the US market, targeting scalable financial infrastructure

Why Israel is blocking foreign journalists from entering

Bitcoin: We’re Entering The Most Dangerous Phase

Hiling na ipa-subpoena ang financial records at iba pa, patunay na walang sapat na… | 24 Oras

Grand Launch: Medicover Hospitals Financial District | Tallest Hospital of India

Bitcoin Just Flashed a Signal Nobody Is Ready For – Arthur Hayes
-

 News Videos4 days ago
10th Algebra | Financial Planning | Question Bank Solution | Board Exam 2026
-

 Fashion7 days ago
Weekend Open Thread: Ann Taylor
-
 Tech2 days ago
A 1,300-Pound NASA Spacecraft To Re-Enter Earth’s Atmosphere
-

 Crypto World4 days ago
Paradigm, a16z, Winklevoss Capital, Balaji Srinivasan among investors in ZODL
-

 Tech3 days ago
ChatGPT will now generate interactive visuals to help you with math and science concepts
-

 Business3 days ago
ExxonMobil seeks to move corporate registration from New Jersey to Texas
-

 Sports6 days ago
Three share 2-shot lead entering final round in Hong Kong
-

 Sports5 days ago
Braveheart Lakshya downs Lai in epic battle to enter All England Open final | Other Sports News
-

 NewsBeat2 days ago
Residents reaction as Shildon murder probe enters second day
-

 Entertainment7 days ago
Hailey Bieber Poses For Sexy Selfies In New Luscious Lip Thirst Traps
-

 Business5 days ago
Search for Nancy Guthrie Enters 37th Day as FBI Probes Wi-Fi Jammer Theory
-

 Business2 days ago
Search Enters Sixth Week With New Leads in Tucson Abduction Case
-
 NewsBeat4 days ago
Pagazzi Lighting enters administration as 70 jobs lost and 11 stores close across Scotland
-

 Tech4 days ago
Despite challenges, Ireland sixth in EU for board gender diversity
-

 Business4 days ago
Search Enters 39th Day with FBI Tip Line Developments and No Major Breakthroughs
-

 NewsBeat2 days ago
I Entered The Manosphere. Nothing Could Prepare Me For What I Found.
-

 Business7 days ago
Iran war enters second week as Trump demands ’unconditional surrender’
-

 Sports4 days ago
Skateboarding World Championships: Britain’s Sky Brown wins park gold
-

 Crypto World3 days ago
Will Chainlink price reclaim $10 amid volatility squeeze?
-

 Sports5 days ago
Tomorrow’s Top 25 Today: Florida jumps to No. 4; Louisville, Wisconsin enter projected rankings