

Crypto World
ETH, XRP, ADA, BNB, and HYPE
This Friday, we examine Ethereum, Ripple, Cardano, Binance Coin, and Hyperliquid in greater detail.
Ethereum (ETH)
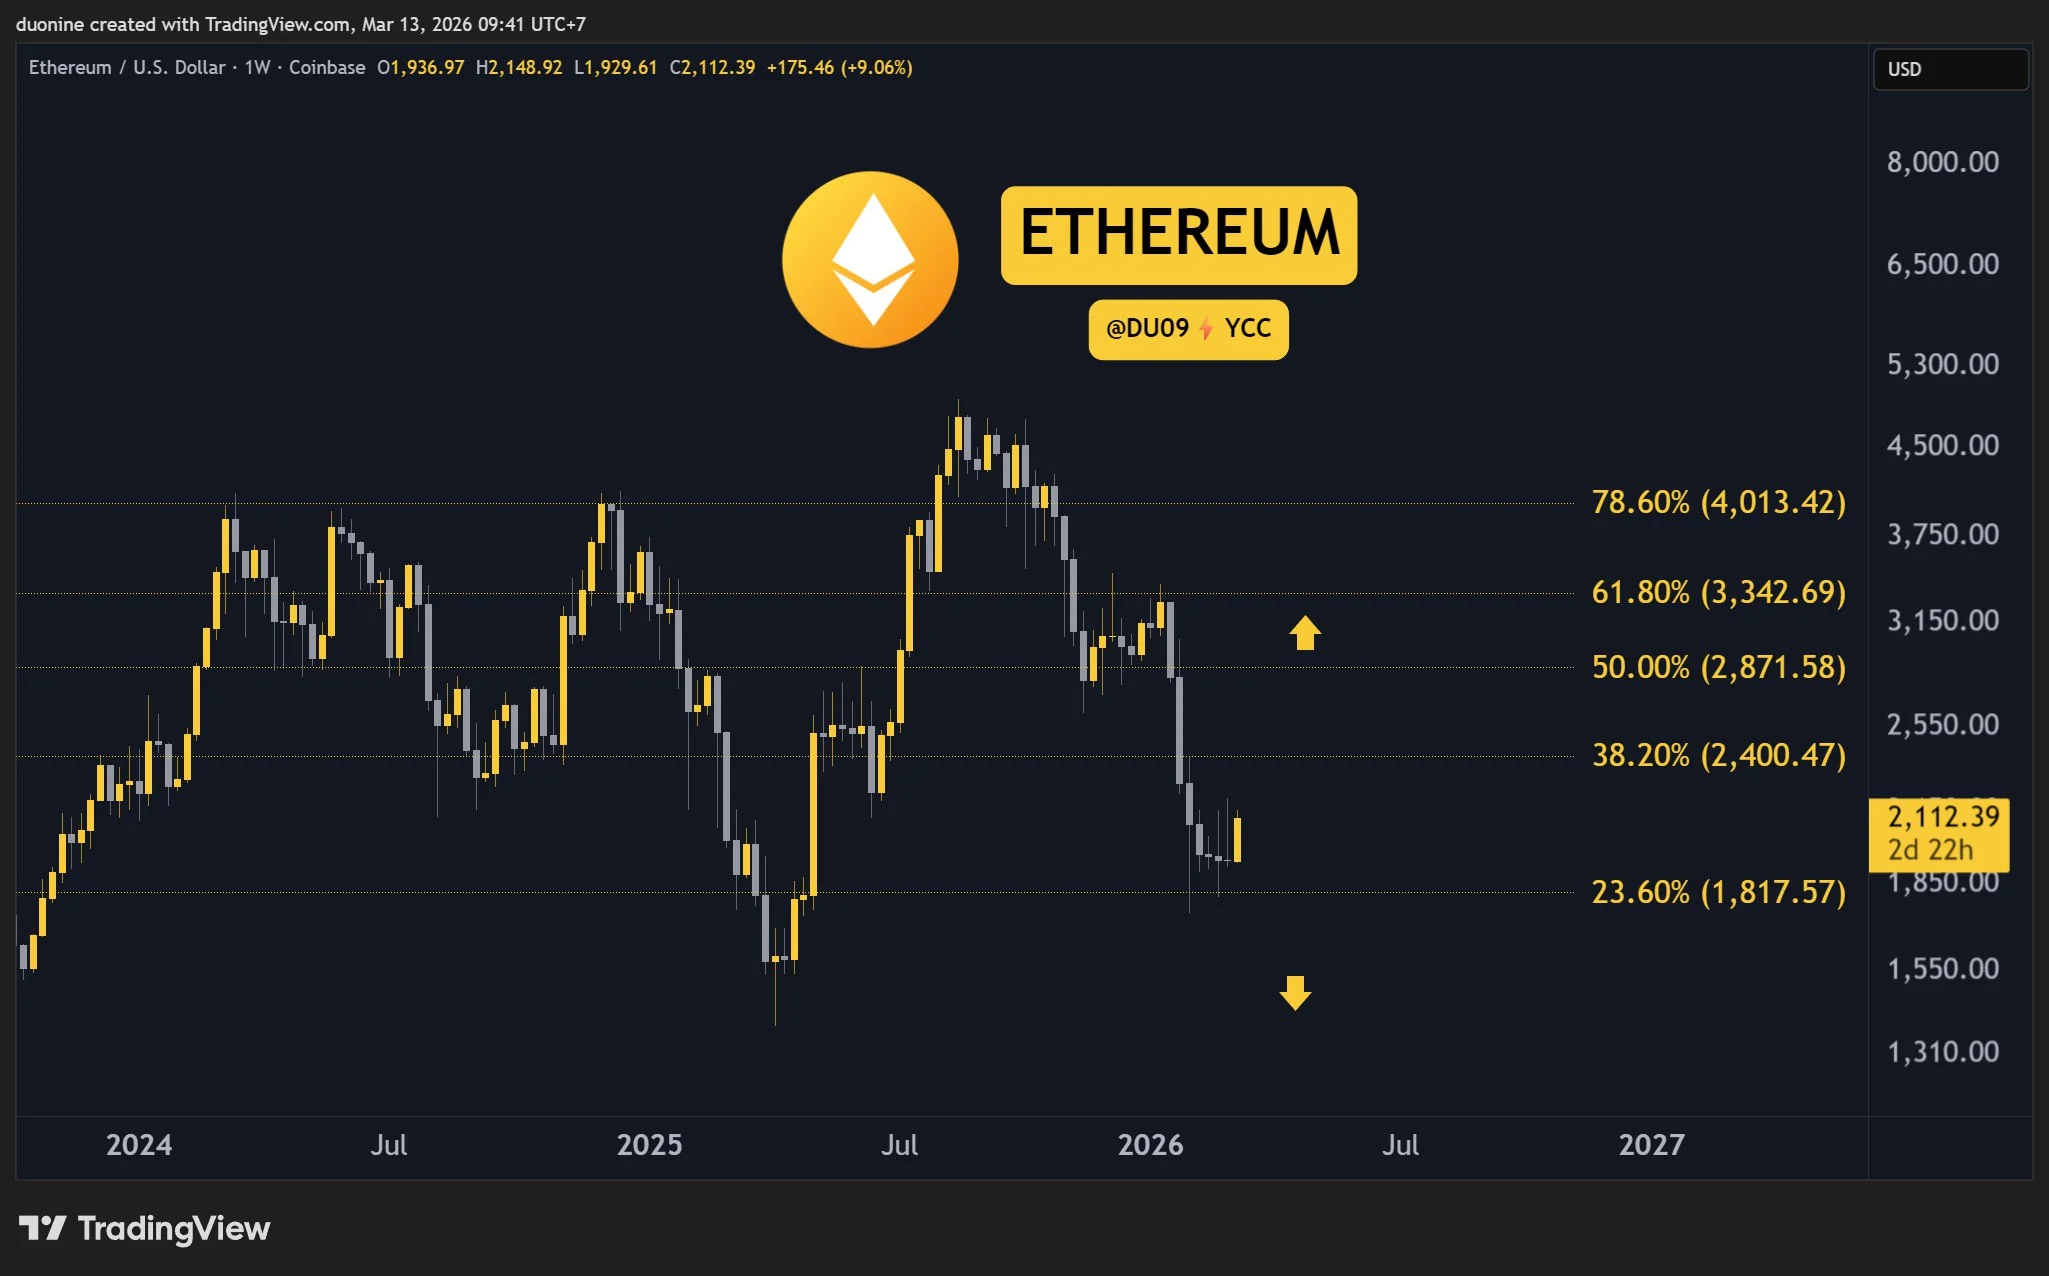
Ethereum continues to hold well above the $2,000 support level and closed the week in the green with a 1% gain. Even if this is small, it shows sellers no longer have control over the price, being unable to push it lower.
The current price action is also giving clear bullish signals, hinting at a major reversal. To confirm it, buyers will need to break through the $2,400 resistance.
Looking ahead, this is the first time in months when Ethereum has a clear shot at moving higher. To sustain a relief rally, the price will have to break $2,400 and then $2,800, which are acting as key resistance levels.

Ripple (XRP)
XRP is flat compared to last week, but it still held well above $1.4. This is somewhat similar to the $2,000 support of Ethereum. As long as $1.4 holds, the bias leans bullish.
The most important resistance on the chart is at $1.6, and if XRP can break above it and turn it into key support, then bulls will have full control over price action, which may allow them to aim for $2 next.
Looking ahead, this cryptocurrency has a good shot at reversing the downtrend here, and that starts with a clean breakout above $1.6. Hopefully, this can take place in the weeks to come.

Cardano (ADA)
Cardano appears ready to turn around, even if the price remains similar to last week. The support at 24 cents held well, and now the resistance at 28 cents is being put under pressure.
Should buyers break above $0.28, ADA has a clear path to $0.40 and beyond. The momentum indicators, such as the MACD, are also turning bullish on the weekly timeframe, encouraging bulls further.
Looking ahead, a sustained relief rally could bring this cryptocurrency back to 50 cents, but for that to happen, the overall market has to turn bullish and remain so for at least a few months.

Binance Coin (BNB)
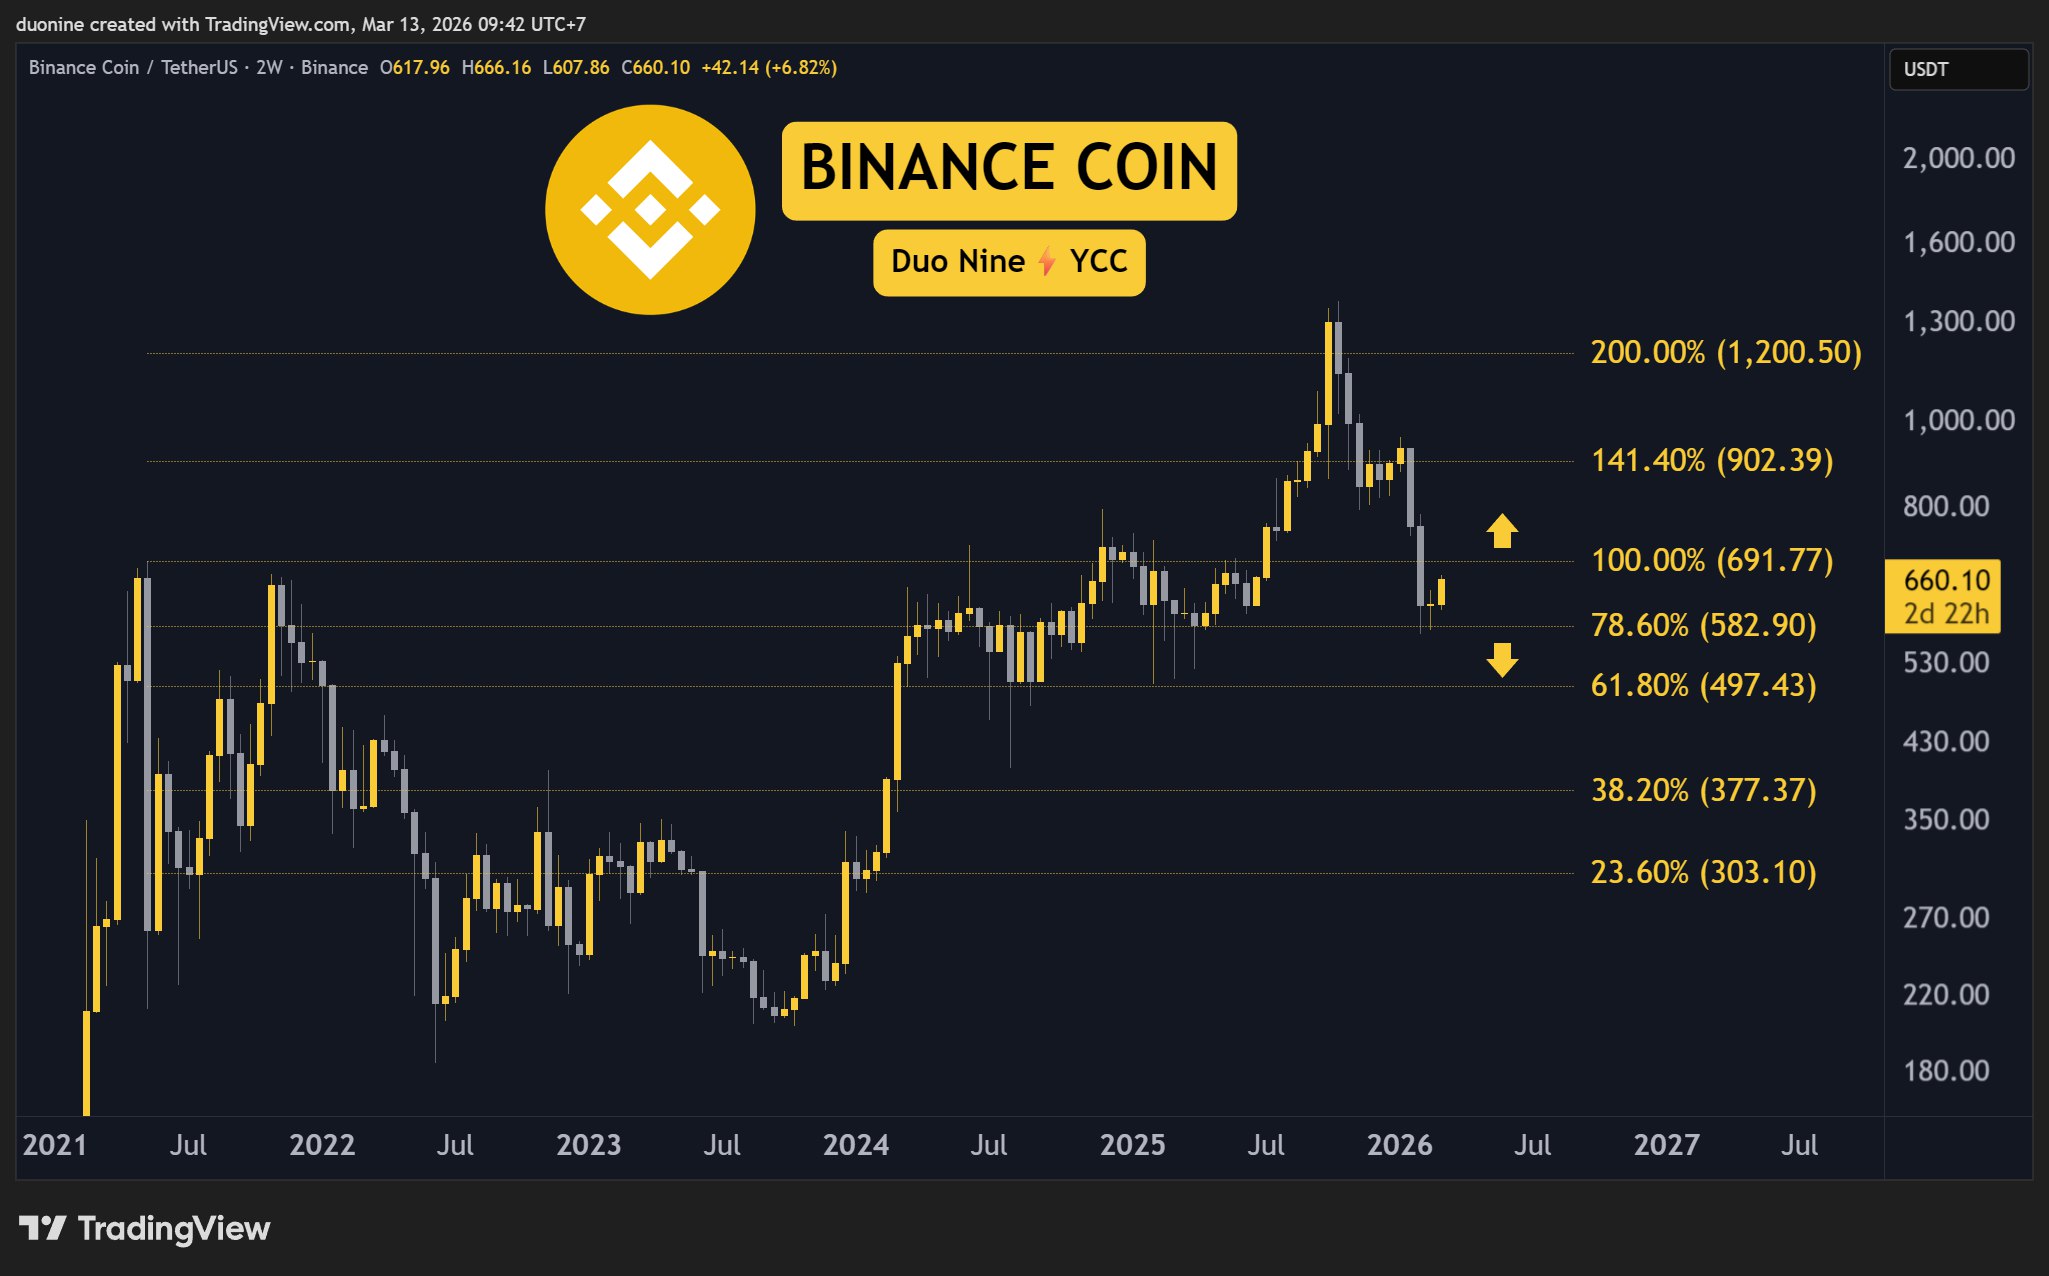
Binance Coin is up 2% this week after finding support at $580. Should this bullish momentum intensify, then a test of the key resistance at $690 appears inevitable in the coming days.
While momentum is positive, the buy volume remains rather low. Any weakness in this rally will likely be easily exposed once the key resistance is tested. Sellers could return there to reverse any recent gains.
Looking ahead, BNB wants to break out of its consolidation above the key support and move higher. To be successful, it will need to break above $690 and defend that level from any sellers.
Hype (HYPE)
HYPE is up by 24% this week, making it the best-performing cryptocurrency on our list and across most of the market. This sustained performance was due to the recent breakout above the $36 resistance.
After the price bottomed around $20 in mid-January, HYPE began a strong rally that is still ongoing with two major impulses up. The first took place in late January and saw the price go above $30, and now the second impulse up in March took the price closer to $40.
Looking ahead, HYPE will face resistance at $40 and $42. If it breaks these levels, its path to $50 will open up. If successful, this would be an impressive achievement in a bear market.

Binance Free $600 (CryptoPotato Exclusive): Use this link to register a new account and receive $600 exclusive welcome offer on Binance (full details).
LIMITED OFFER for CryptoPotato readers at Bybit: Use this link to register and open a $500 FREE position on any coin!
Disclaimer: Information found on CryptoPotato is those of writers quoted. It does not represent the opinions of CryptoPotato on whether to buy, sell, or hold any investments. You are advised to conduct your own research before making any investment decisions. Use provided information at your own risk. See Disclaimer for more information.

Bitcoin (BTC) may approach a market bottom, with a macro model tied to the US and China’s benchmark 10-year bond yields hinting at a potential rally toward $100,000 in the months ahead.
Key takeaways:
-
Bitcoin whales show signs of accumulation that were seen near the 2023 market low.
-
BTC holds key long-term support while “oversold,” increasing the chance of a recovery.
History rhymes? BTC flashes ‘precise’ bullish cross
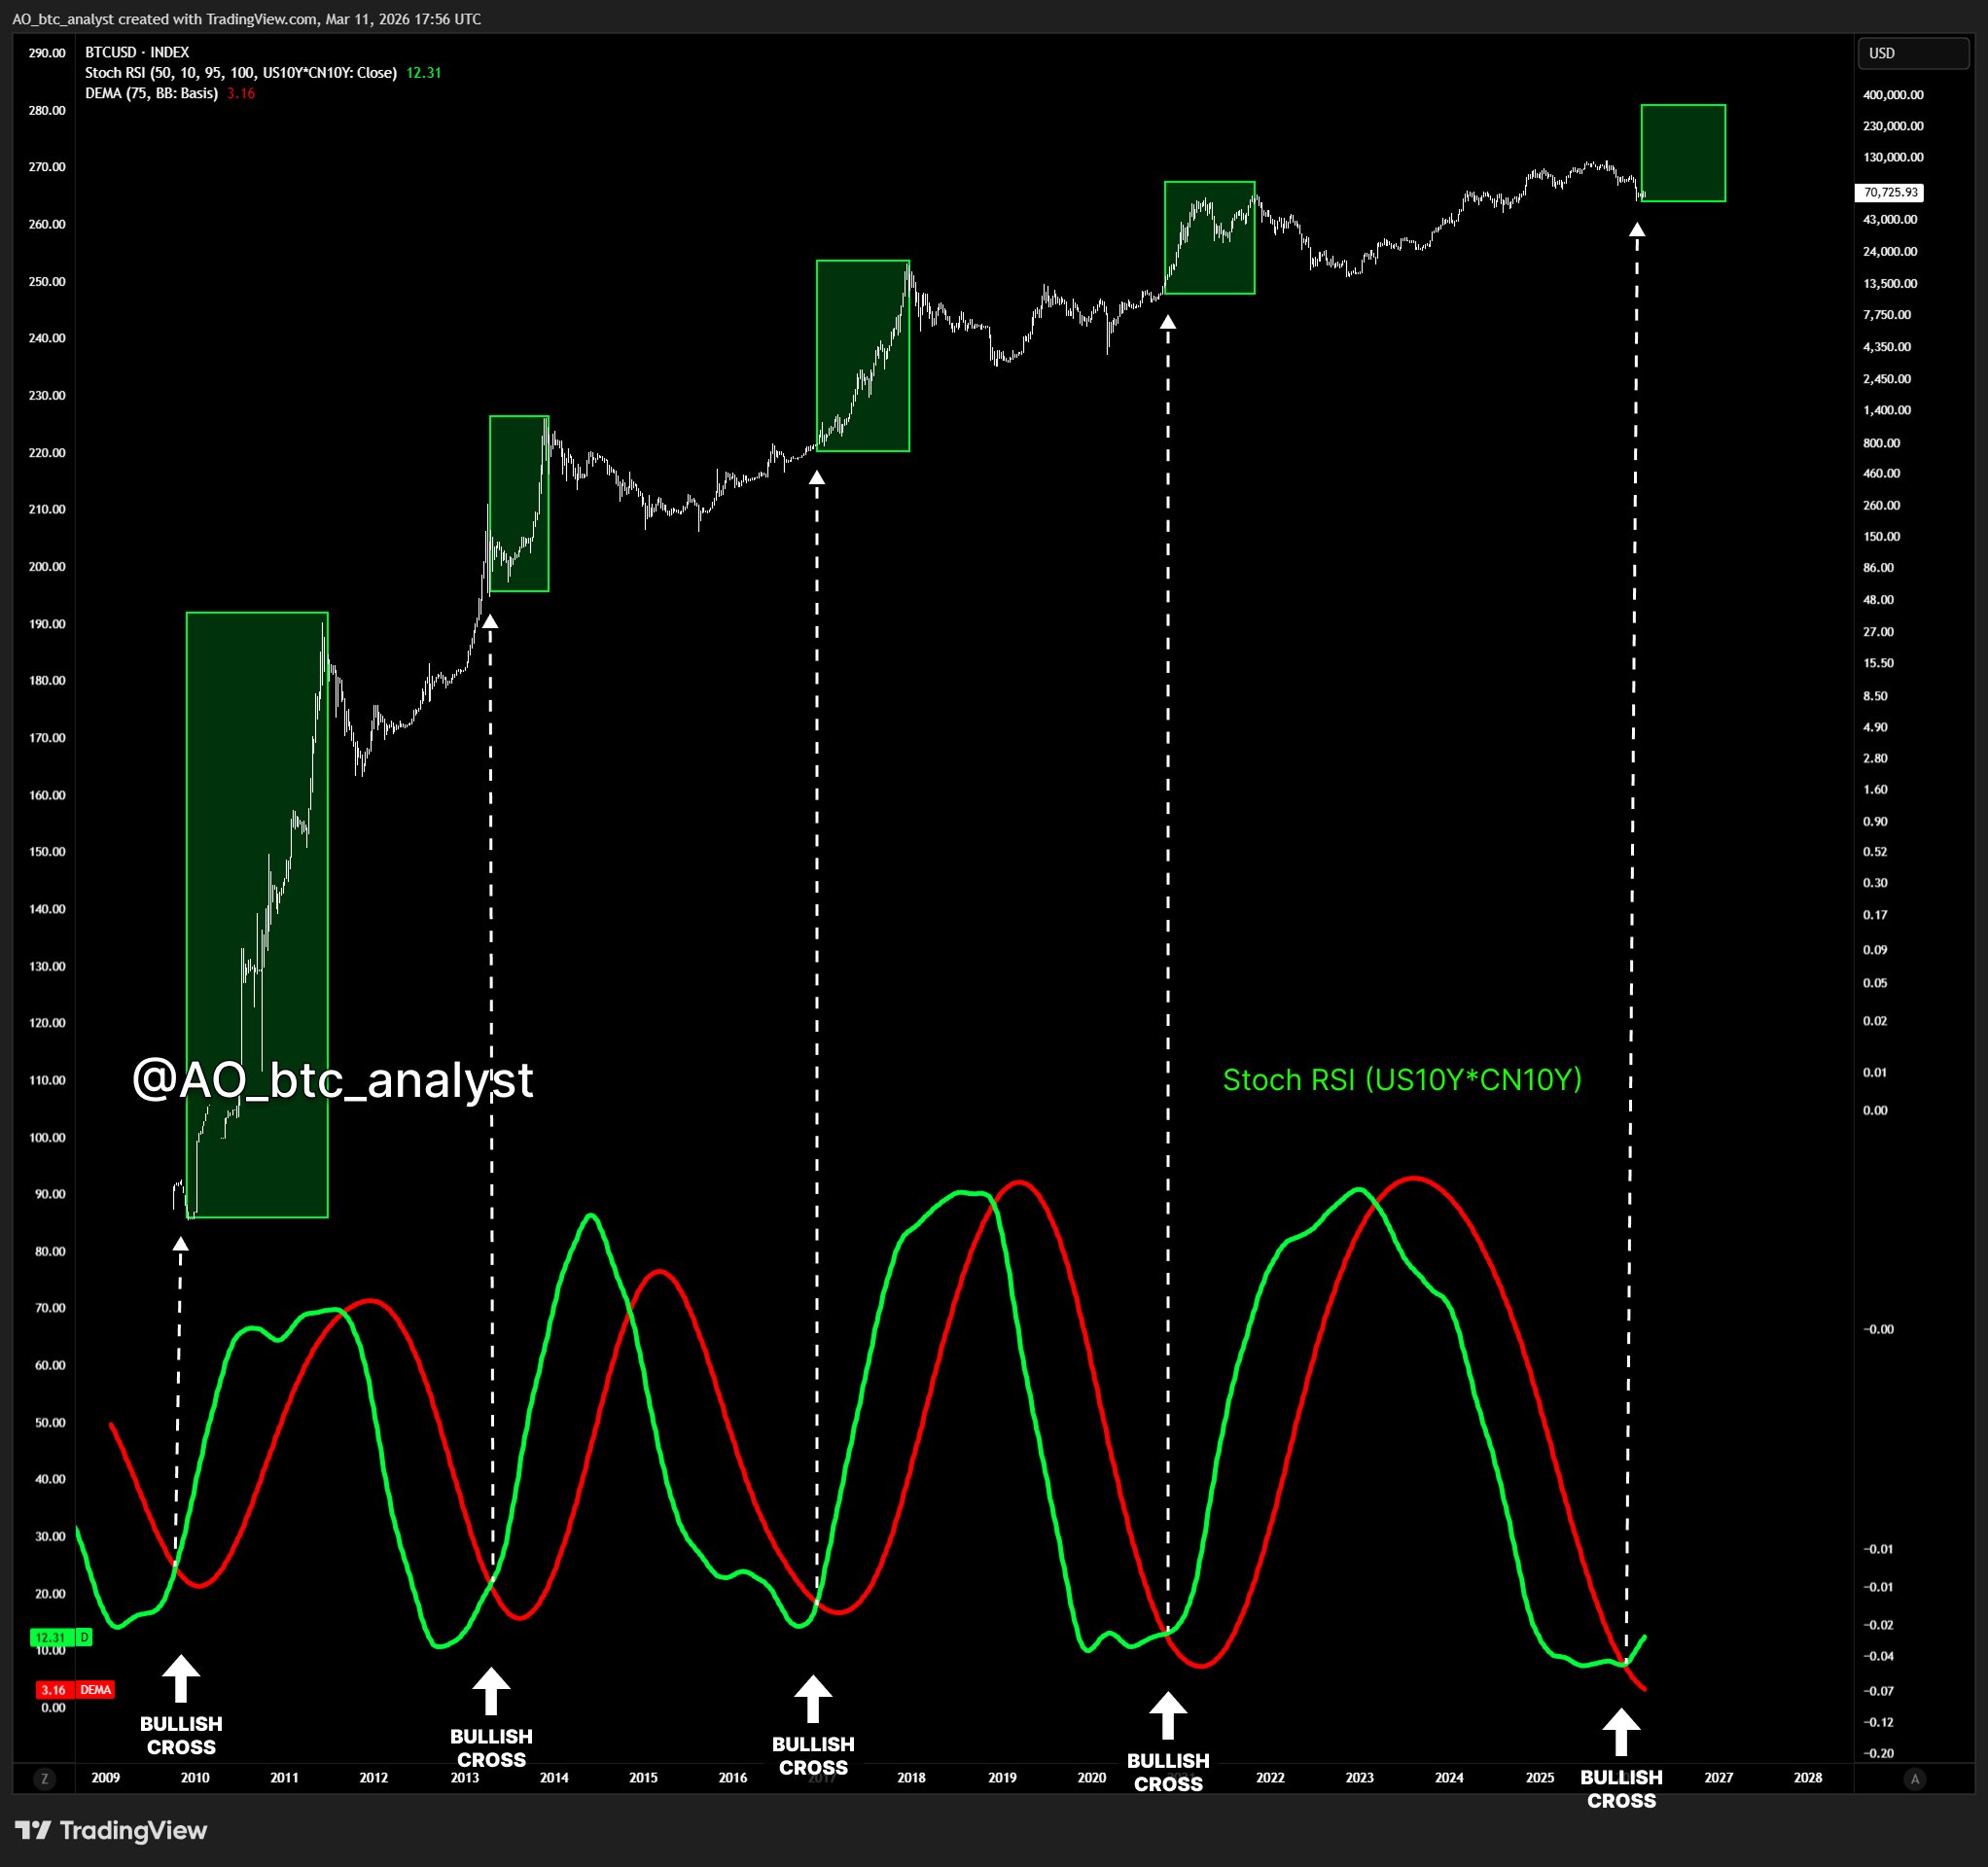
The model, shared by analyst AO, applies a Stochastic RSI oscillator to the product of US10Y and CN10Y.
When overlaid with Bitcoin’s historical price action, the indicator shows that bullish crossovers from oversold levels have historically appeared near major BTC market bottoms.

For instance, in 2013, the crossover preceded a 8,700% surge in Bitcoin prices. Similar signals appeared before the 2017 bull run (+1,900%), the 2020–2021 cycle (+600%), and the 2023 rebound (+350%+).
In March, the Stoch RSI flashed another “extremely precise” bullish crossover, according to analyst Crypto Rand, who said the signal suggests Bitcoin is “going way higher.”
Whale behavior backs case for a Bitcoin bottom
Onchain data tracking Bitcoin whales support the macro outlook discussed above.
For instance, Bitcoin wallets holding between 1,000 BTC and 10,000 BTC resumed accumulation during the recent price decline, resembling the behavior seen near earlier market bottoms.

For instance, the same cohort began buying in early 2023 near the price lows before Bitcoin went on to rally more than 350%.
Related: STRC may help Strategy reach 1M Bitcoin milestone before BlackRock
Similar accumulation phases by large holders also appeared before the 2017 and 2020 bull runs. This setup may improve Bitcoin’s odds of bottoming out earlier than some analysts predict.
BTC technicals hint at rebound toward $100,000
Bitcoin’s weekly chart is also showing early signs of a potential rebound.
Over the past month, bears failed to push BTC decisively below its 100-week simple moving average (100-week SMA, the blue line), a level that has often marked the price bottom in past cycles.

Following the March 2020 test, Bitcoin rebounded by more than 1,000% from that support line, while a similar bounce in 2019 preceded gains of over 300%.
Additionally, BTC’s relative strength index (RSI) has slipped into oversold territory below 30, suggesting that the price has fallen too far, too fast, increasing the chances of a recovery.
A decisive rebound from the 200-week SMA could send the BTC price toward $100,000 by August, where the 50-week SMA and 1.618 Fibonacci level converge.
Conversely, some analysts warned about a potential bull trap if Bitcoin fails to rise above the $78,000 resistance level, which is key for a bullish trend reversal.
Below the spot price, the areas of interest include the 200-week exponential moving average at $68,300 and the $60,000-65,500 support zone.
This article does not contain investment advice or recommendations. Every investment and trading move involves risk, and readers should conduct their own research when making a decision. While we strive to provide accurate and timely information, Cointelegraph does not guarantee the accuracy, completeness, or reliability of any information in this article. This article may contain forward-looking statements that are subject to risks and uncertainties. Cointelegraph will not be liable for any loss or damage arising from your reliance on this information.


One of the major crypto conferences in Dubai has been rescheduled for next year.
One of the largest annual crypto-oriented events, Token2049 in Dubai, has reportedly been rescheduled for next year.
According to Wu Blockchain, the Dubai TOKEN2049 conference will be hled on the 21st and 22nd of April in 2027. It was originally supposed to take place in April this year.
Per the official statement:
This decision was not taken lightly. Preparations for the event were progressing strongly. However, ensuring the global crypto industry can gther safely, and at the scale and quality that define TOKEN2049, remains our top priority.
Exclusive: The Dubai TOKEN2049 summit, originally scheduled for April 29-30, 2026, has been postponed to April 21-22, 2027. This comes after several locations in Dubai were attacked by Iranian drones and shrapnel, prompting many in the crypto industry to evacuate. pic.twitter.com/aSl4qbRKKr
— Wu Blockchain (@WuBlockchain) March 13, 2026
Binance Free $600 (CryptoPotato Exclusive): Use this link to register a new account and receive $600 exclusive welcome offer on Binance (full details).
LIMITED OFFER for CryptoPotato readers at Bybit: Use this link to register and open a $500 FREE position on any coin!

The price of XRP is stabilizing near a key technical level even as institutional flows weaken, raising questions about the token’s next move.
Summary
- XRP spot ETFs recorded about $6.08 million in daily net outflows, signaling softer institutional demand.
- The token is trading around $1.41, consolidating after falling from highs near $1.90 earlier this year.
- Momentum indicators such as the RSI near 50 and a rising Awesome Oscillator suggest bearish pressure may be fading.
The Ripple token (XRP) was trading around $1.41 on March 13, gaining roughly 2.4% on the day, according to data from Crypto.News. The token has been consolidating in a narrow range after declining from highs near $1.90 earlier this year, suggesting that the market is searching for a new directional catalyst.
Institutional sentiment appears to be softening. Data tracking XRP spot exchange-traded funds shows daily net outflows of about $6.08 million, while total net assets across these products remain close to $967 million.
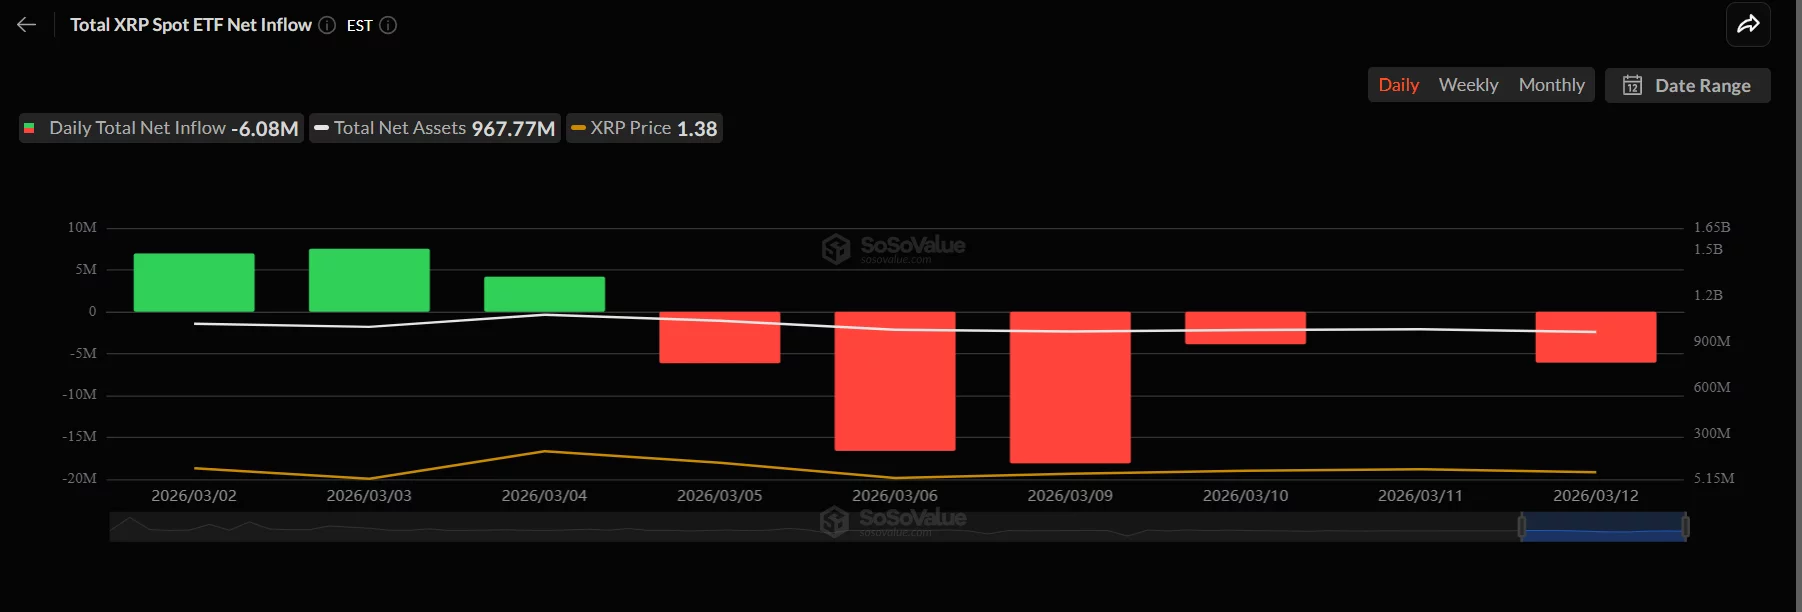
The chart indicates that after several sessions of inflows earlier in March, ETF activity has turned negative with multiple red days in a row, signaling that some institutional investors may be reducing exposure or locking in profits following previous gains.
Despite the cooling ETF demand, XRP has managed to maintain support above the $1.40 level, an area that traders are closely watching as a potential pivot for the next move.
XRP price analysis
From a technical perspective, momentum indicators suggest that bearish pressure is gradually fading. The relative strength index (RSI) currently sits near 50, reflecting neutral momentum and a balance between buyers and sellers.
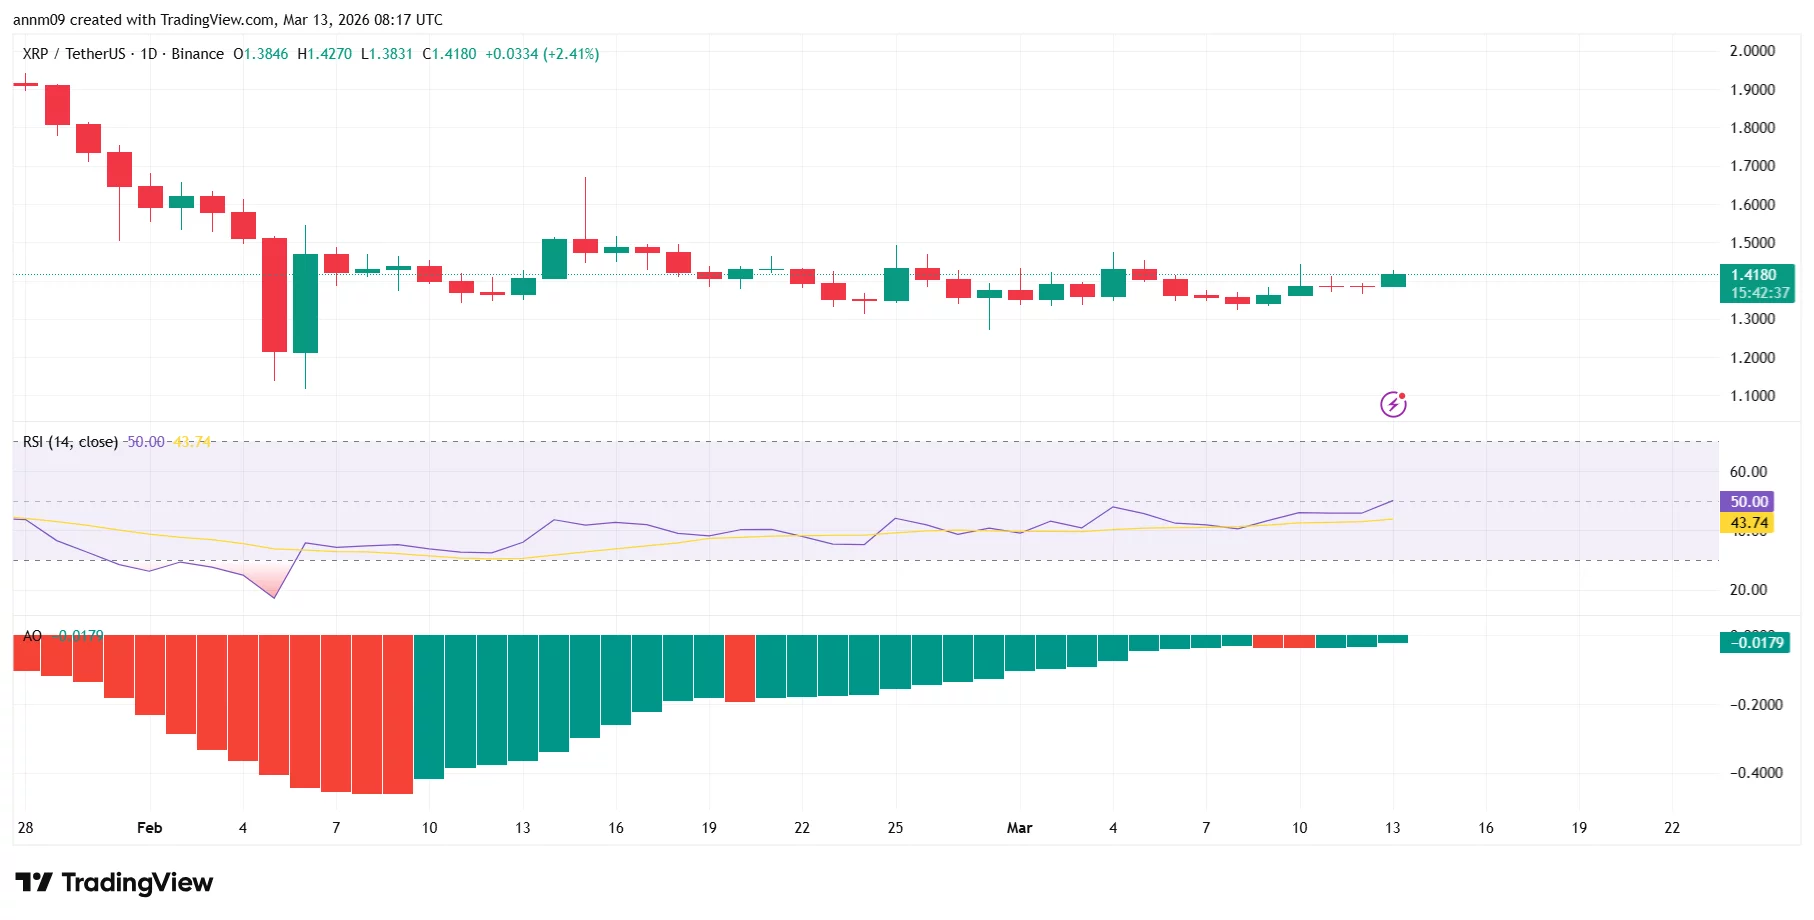
Meanwhile, the Awesome Oscillator has steadily climbed toward the zero line after spending several weeks in negative territory, a shift that typically indicates weakening downside momentum and the possibility of a trend reversal.
Additional support for market sentiment could come from developments around Ripple, which recently launched a $750 million share buyback program aimed at repurchasing shares from early investors and employees.
While the buyback does not directly affect XRP supply, it is often viewed by market participants as a sign of confidence in the broader ecosystem surrounding the token.
Technically, XRP faces immediate resistance near $1.45 to $1.50, a zone that has repeatedly capped recent rallies.
A decisive breakout above that level could open the path toward $1.60 and potentially $1.70, while failure to hold above $1.30–$1.35 could expose the token to renewed downside pressure.
Crypto World
Can Ethereum price rally continue above $2100 as BlackRock’s staked Ethereum ETF launches?
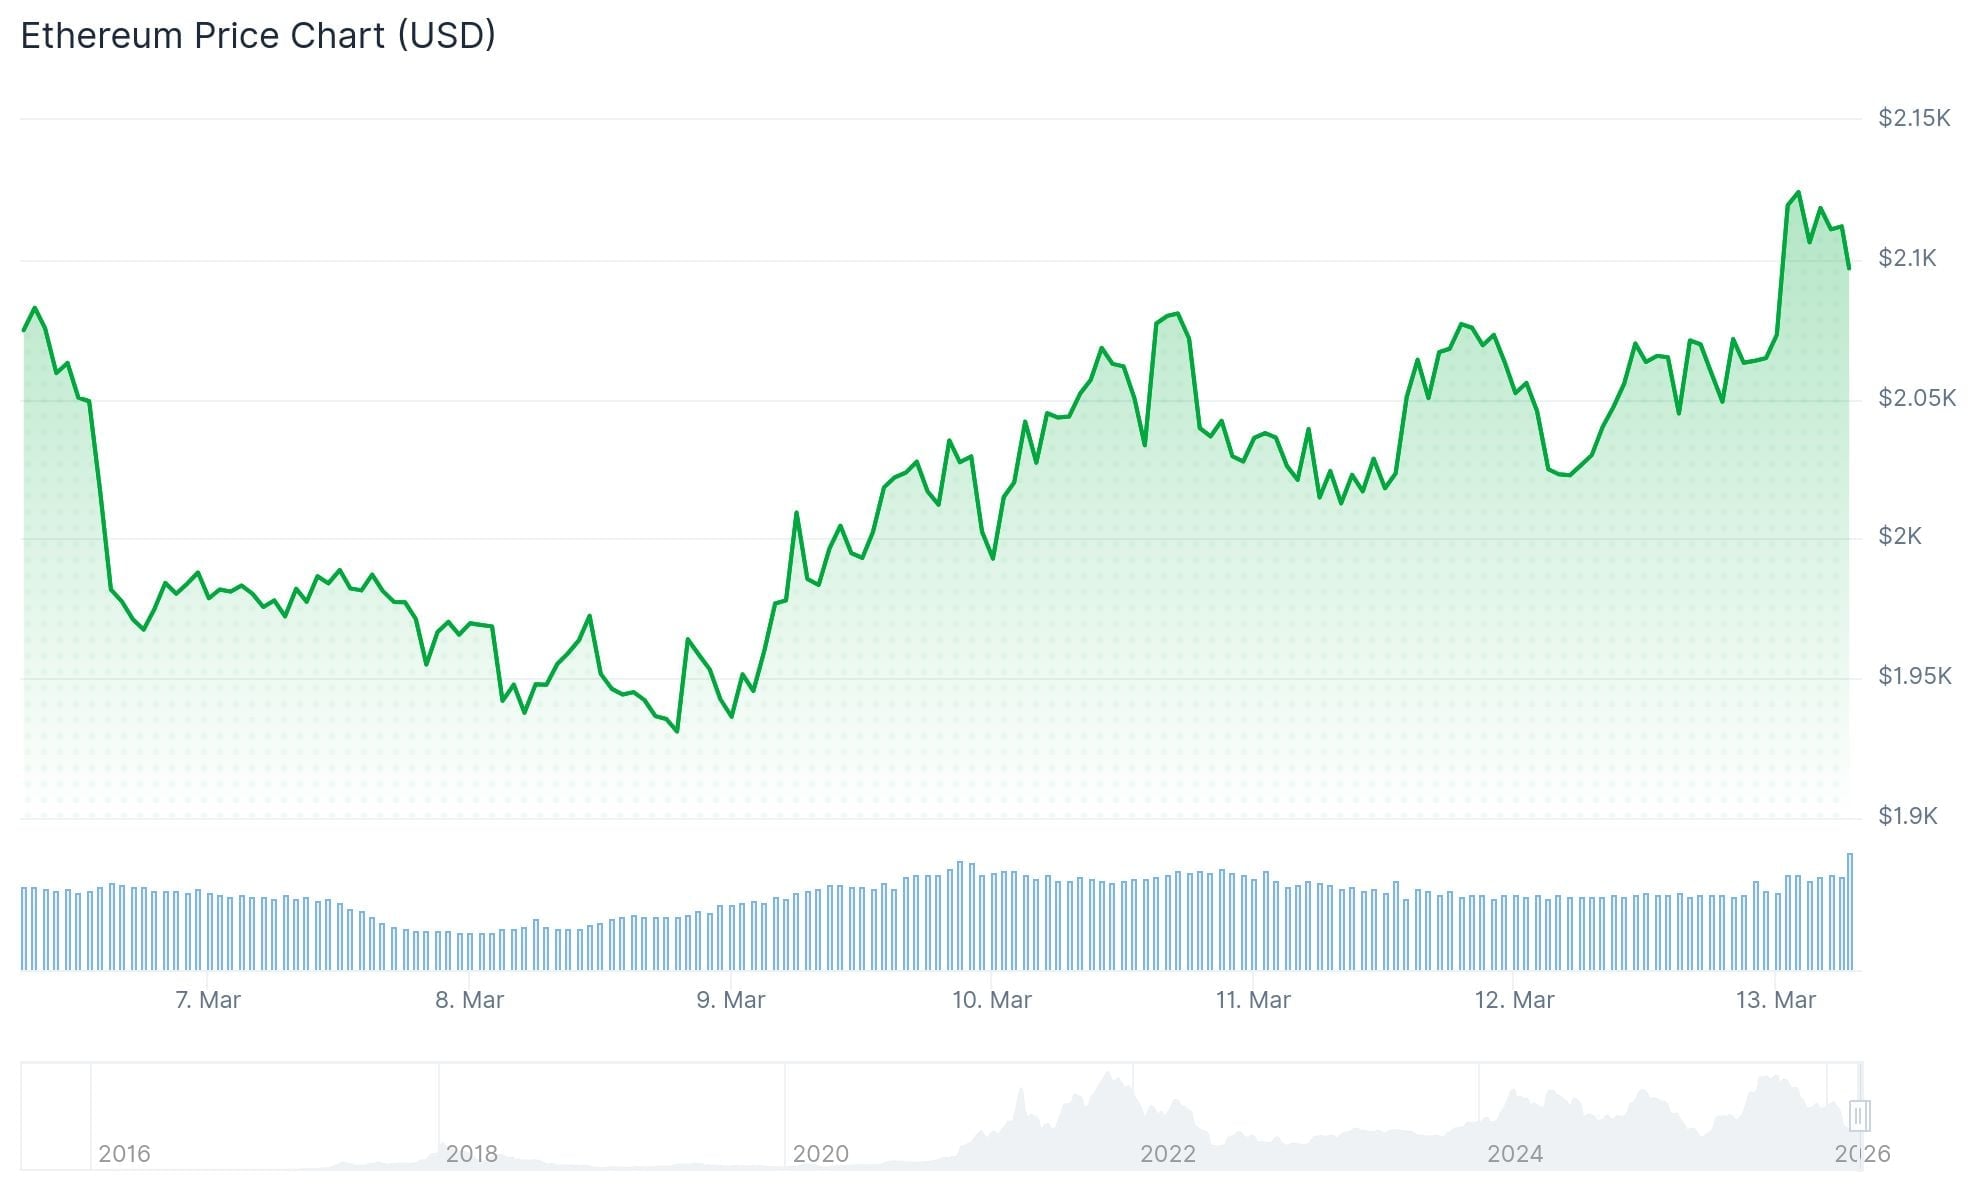
Ethereum’s price rallied to a weekly high of $2,144 on Friday following the strong debut of investment manager BlackRock’s staked Ethereum ETF.
Summary
- Ethereum price broke past the $2,100 resistance level on March 13.
- BlackRock’s staking ETF ETHB pulled in $15.5 million in trading volume on launch day.
- A bullish SMA crossover is close to confirmation on the daily chart.
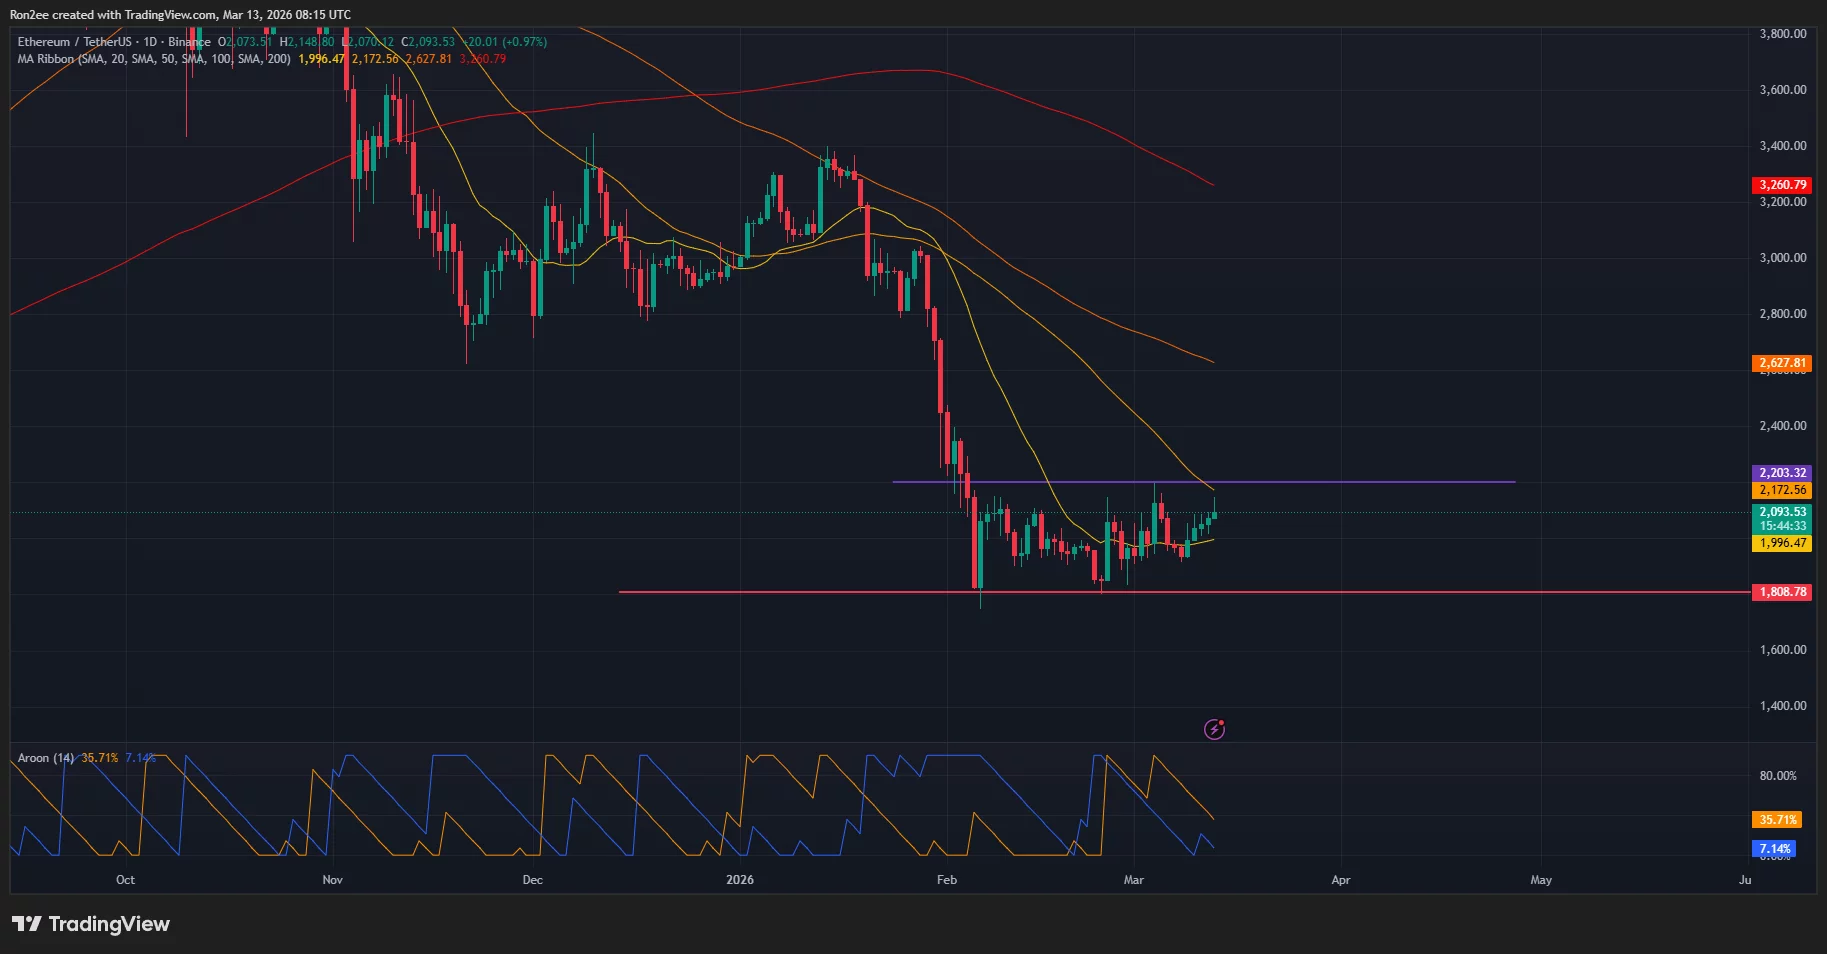
According to data from crypto.news, Ethereum (ETH) price shot up nearly 6% to $2,144 during Friday morning Asian time before stabilizing around $2,100 at the time of writing. At this valuation, the second-largest crypto asset by market cap sits 11% above its weekly low and over 18% from its lowest point in February.
The rally gained momentum after BlackRock recorded a very strong debut with its iShares Staked Ethereum ETF (ETHB) on Nasdaq. The first Ethereum ETF from the world’s largest asset manager to include staking pulled in around $15.5 million in trading volume on its first day.
For context, the iShares Staked Ethereum Trust (ETHB) operates by holding spot Ethereum and dynamically staking between 70% and 95% of its reserves directly on the Ethereum network. This structure allows investors to receive 82% of staking rewards through monthly distributions. This largely differs from existing Ethereum ETFs, where investors forego staking rewards, making those older products much less appealing.
As such, there is a strong possibility that investors could begin rotating their capital from other ETH ETFs, including BlackRock’s own ETHA, which offers no staking, into the new ETHB.
Investors who have previously stayed on the sidelines due to the lack of yield could now also enter the market while enjoying the added benefits of staking rewards. This shift, driven by those who finally see the ETF as a productive asset, could likely act as a fresh catalyst to sustain the current uptrend.
Meanwhile, besides the ETF news, a sharp drop in crude oil prices provided extra tailwinds. Brent crude dropped 7% today, renewing investor demand for risk assets, including Ethereum, as they rotate away from traditional safe-haven assets.
On the daily chart, technical indicators seem to suggest that Ethereum’s price could sustain its rally above $2,100 in the short term.
Notably, the 20-day moving average appears to be close to confirming a bullish crossover with the 50-day moving average. Meanwhile, the Aroon Up remains at 35.71%, which is comfortably above the Aroon Down at 7.14%. Ethereum’s RSI has also yet to enter the overbought area.

This suggests there is still room for the uptrend to continue before any potential exhaustion or reversal occurs.
For now, $2,200 could act as the immediate resistance that traders will be watching closely for signs of a breakout. A move above that level could act as a definitive confirmation of a positive shift in market sentiment.
A rally above that mark would also invalidate a major bearish pattern. As previously reported by analysts at crypto.news, the price has been forming a bearish flag pattern over multiple months.
Bearish flag patterns are considered some of the most bearish formations in technical analysis. If ETH falls towards $1800, it would confirm the pattern.

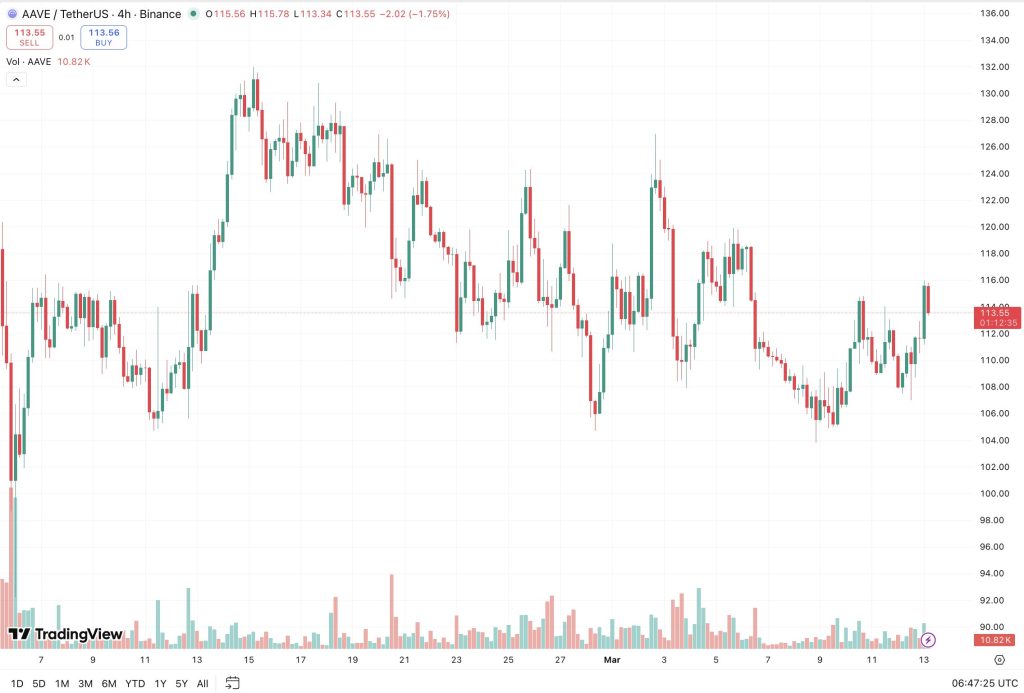
Despite clear warnings, a trader confirmed a massive $50M swap and received just 324 Aave tokens
A user attempted to purchase the AAVE token with $50 million worth of Tether through the Aave interface on March 12, but the trade executed poorly after the user accepted a warning about extreme slippage.
According to Aave Labs founder and CEO Stani Kulechov, the transaction involved a single order of significant size placed through the Aave interface, which integrates routing infrastructure provided by CoW Swap. Because of the unusually large order size, the interface displayed a warning about extraordinary slippage and required explicit confirmation before the swap could proceed.
$50M Trade Gone Wrong
The warning appeared as a confirmation checkbox, which the user had to manually accept before completing the transaction. Kulechov said the user confirmed the warning on a mobile device and chose to proceed with the trade despite the slippage notification. Due to the execution conditions and the liquidity available through the routing path, the user ultimately received only 324 AAVE tokens in return for the $50 million USDT order.
Kulechov stated that the transaction could not have moved forward without the user explicitly acknowledging the warning and confirming acceptance of the associated risks through the interface. He said the routing infrastructure functioned as designed and that the integration with CoW Swap followed standard practices commonly used across the DeFi sector.
However, the final execution was significantly worse than what would typically be expected in a more liquid market environment. Kulechov noted that events involving high slippage can occur in DeFi when users attempt to execute trades that are far larger than the liquidity available in the relevant markets, although he said the scale of this specific transaction was significantly larger than what is normally seen in the space.
In response to the incident, the exec said the Aave team sympathizes with the user and will attempt to establish contact with them. He added that the protocol plans to return approximately $600,000 in fees that were collected from the transaction. Kulechov said that while maintaining the permissionless nature of DeFi remains important, the industry can still build additional guardrails to help reduce the likelihood of similar incidents in the future.
User Freedom vs Protection
CoW Protocol, which is a DEX aggregator, took to X and explained that “preventing users from making trades removes choice and can lead to terrible outcomes in some situations.” It also added that trades like these demonstrate that “DeFi UX still isn’t where it needs to be to protect all users. As a team, we are now reviewing how we balance strong safeguards with preserving user autonomy.”
You may also like:
The platform asserted that it will refund any fees sent to CoW DAO.
The incident quickly drew reactions across the crypto community. A popular crypto analyst, Autism Capital, described the event as a “teachable moment about money.”
Meanwhile, another crypto commentator, KJ Crypto, questioned the motivation behind such a large purchase attempt and tweeted that it raises questions about why someone would want to acquire $50 million worth of Aave in a single transaction.
Binance Free $600 (CryptoPotato Exclusive): Use this link to register a new account and receive $600 exclusive welcome offer on Binance (full details).
LIMITED OFFER for CryptoPotato readers at Bybit: Use this link to register and open a $500 FREE position on any coin!


The Bitcoin Policy Institute said it plans to review and respond to an upcoming proposal from the Federal Reserve that could shape how U.S. banks treat Bitcoin under international banking standards.
Summary
- The Bitcoin Policy Institute plans to review and comment on an upcoming Federal Reserve proposal on Basel rules.
- The proposal will open a 90-day public comment period for industry feedback.
- Current Basel guidance assigns Bitcoin a 1250% risk weighting, discouraging banks from holding or servicing the asset.
Bitcoin Policy Institute to weigh in as Fed prepares Basel proposal for banks
According to Conner Brown, the Federal Reserve is expected to issue a public proposal next week outlining how American banks should implement risk-weighting guidance under the Basel Accords.
The proposal will apply to the largest U.S. banks and will open a 90-day public comment period, allowing industry participants, policy groups and financial institutions to submit feedback before the rules are finalized.
Brown said the institute intends to participate in the process to ensure regulators “get Bitcoin’s treatment right.”
Under the Basel framework, Bitcoin (BTC) is currently assigned a 1250% risk weighting, which effectively treats the cryptocurrency as a highly risky asset on bank balance sheets. Such a requirement forces banks to hold significantly higher levels of capital against Bitcoin exposure compared with most traditional assets.
Critics argue that this classification makes it difficult for banks to provide financial services to Bitcoin users and companies, as the capital requirements can discourage institutions from interacting with the sector.
“The Federal Reserve just announced that next week they will issue a public proposal for how banks should implement Basel risk weighting guidance,” Brown said in a post on X, adding that the think tank would review the document and submit a formal public comment.
The upcoming consultation comes as policymakers in the United States continue to debate how digital assets should fit within the global banking regulatory framework.
Industry advocates say the outcome of the Federal Reserve’s proposal could play a key role in determining whether traditional financial institutions expand or limit their engagement with Bitcoin-related services in the future.
In crypto’s latest infrastructure race, blockchains are competing to host perpetual futures exchanges. Many are now launching or incubating decentralized derivatives markets themselves, even as centralized platforms continue to dominate.
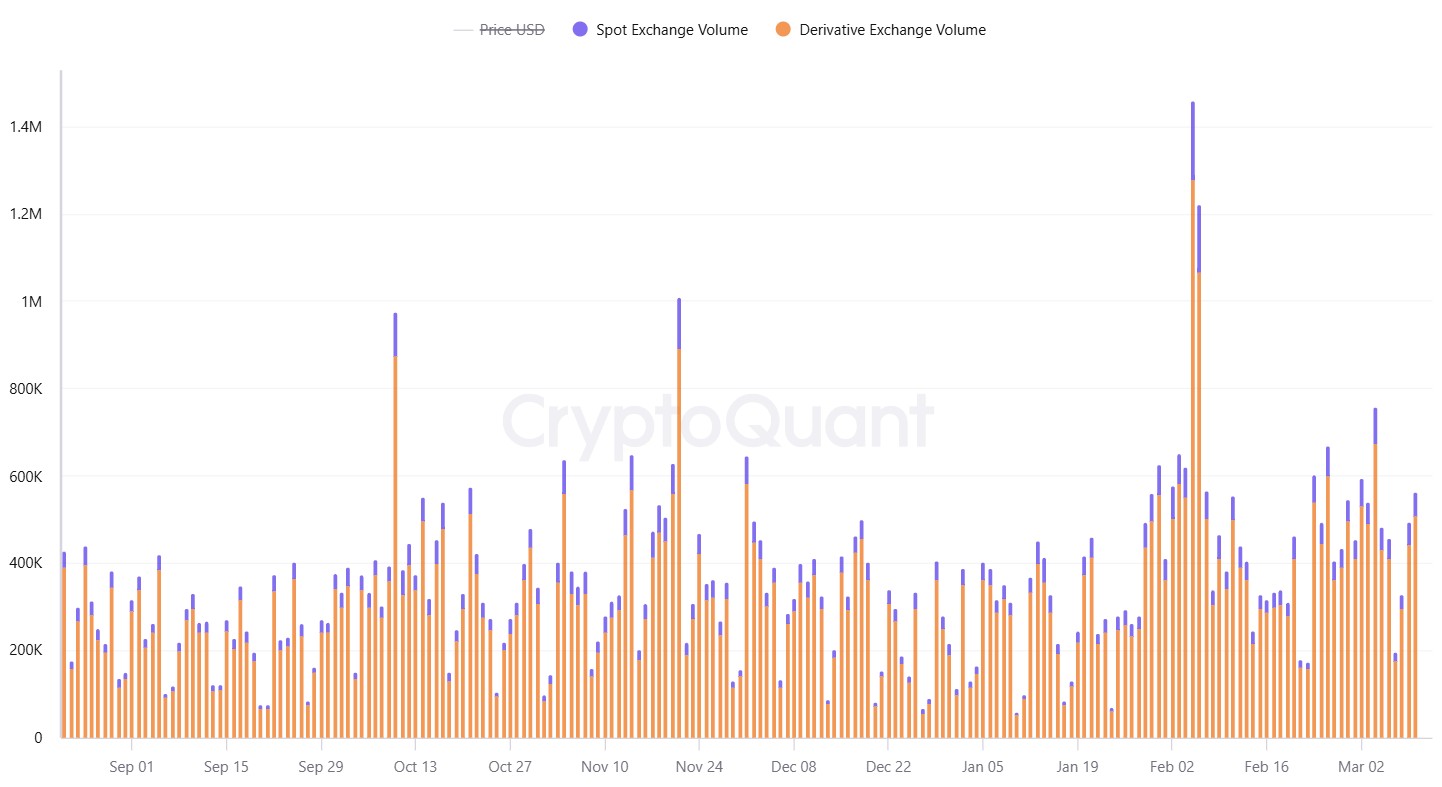
Derivatives make up most of today’s crypto trading activity, often accounting for the majority of total volume. On Tuesday, Bitcoin (BTC) spot trading volume across centralized exchanges reached about 55,230 BTC while derivatives volume totaled more than 506,600 BTC, according to CryptoQuant.

Perpetual decentralized exchanges, or perp DEXs, now act as core infrastructure as they give traders, market makers and institutional participants access to leveraged products, according to Nina Rong, executive director of growth at BNB Chain.
“When these players are active on a chain, they bring liquidity, hedging activity, and arbitrage flows, which significantly increase overall onchain volume and strengthen the ecosystem’s trading environment,” she told Cointelegraph.
While several blockchains are exploring their own derivatives venues, launching one does not automatically translate into meaningful or sustained trading activity. Derivatives liquidity has historically consolidated around a small number of dominant exchanges rather than spreading evenly across platforms.
Blockchains begin building or incubating their own perp DEXs
The logic is quite straightforward. If derivatives drive a large share of crypto trading volume, a perp DEX can help a blockchain attract more trading activity.
“In many ways, it has become a competitive race: the chains that host the largest number of successful derivatives platforms are more likely to attract and sustain higher trading volume within their ecosystem,” said Rong.
For BNB Chain, that platform is Aster. On Thursday, it had the second-highest open interest among perp DEXs, according to DefiLlama. Rong claimed that Aster’s rise has helped BNB’s ability to maintain its market share.

Some chains are actively incubating perp DEXs instead of waiting for an external team to select their network to build on. One such example is Decibel, which went live on the Aptos mainnet on Feb. 26.
“What you actually see in the crypto ecosystem as a whole is different L1s and different blockchains starting to think about what is actually going to use the block space,” Brylee Whatley, the head of Decibel Foundation, told Cointelegraph.

“A lot of L1 teams realize they are in the best position to understand the mechanics of their own chains and build applications on top of them,” he said.
Related: Aster delisting exposes DeFi’s growing integrity crisis
Whatley added that Decibel itself was not part of the recent rush by blockchains to build perp DEXs. Aptos has been incubating Decibel for about a year, many months before Hyperliquid, Aster and Lighter vied for market dominance.
Liquidity tends to consolidate around dominant venues
Launching a perp DEX will not guarantee a fountain of eternal liquidity. According to Stephan Lutz, CEO of BitMEX, derivatives trading has historically tended to cluster around a few platforms.
“All markets (derivatives and spot) rely heavily on market makers and strong risk management systems. These participants usually favor platforms that already have liquidity and a track record,” Lutz told Cointelegraph.
This means in the long run, it is inefficient to separate trading venues per chain or coin. Given that traders often trade across multiple chains and coins, we believe that consolidation is an almost natural process.”
A similar pattern has played out in traditional financial markets over the past three decades. The shift to electronic trading in the 1990s led to a wave of exchanges and alternative platforms entering the market. Over time, liquidity often reconsolidated around venues with deeper order books, lower spreads and more reliable infrastructure, according to research published by the Bank for International Settlements.
Chicago Mercantile Exchange (CME) dominates much of the US futures market in TradFi today. The Intercontinental Exchange leads in energy derivatives and Eurex Exchange is a major venue for European index futures.
In crypto, the majority of Bitcoin and Ether (ETH) derivatives trading has historically concentrated on a few exchanges like Binance, OKX, Bybit and Deribit. More recently, decentralized platforms such as Hyperliquid have emerged as significant players for perpetual futures activity.

Centralized exchanges still provide advantages such as order handling, risk management, liquidity and trading infrastructure, while fully onchain platforms are limited by block times, leading to delays and slippage, Sidrah Fariq, head of retail sales at Deribit, told Cointelegraph.
“In addition, centralized exchanges can offer greater privacy, which can be important for institutional traders,” she added.
Meanwhile, proponents of onchain exchanges argue that decentralization and composability allow derivatives liquidity to embed itself within specific ecosystems.
Related: Why institutions still prefer Ethereum despite faster blockchains
“Your order book is on the blockchain and verifiable, and order matching follows price-time priority set by the blockchain itself,” said Decibel’s Whatley.
“When you send an order you know exactly how it’s getting matched and that it’s entering the order book fairly instead of being routed somewhere else,” he said.
The “U” shape of derivatives markets
The long-term picture for derivatives may depend on whether perp DEXs differentiate themselves across networks or simply replicate the same products. Rong of BNB Chain said networks that offer distinct features may have an advantage.
“Chains win by offering unique yield opportunities or distinctive trading venues that are not available elsewhere,” she said. But if similar platforms emerge everywhere, “the result will likely be fragmentation across multiple ecosystems, rather than a single dominant hub.”
At the same time, market dynamics may eventually push liquidity back toward a smaller set of venues. Lutz from BitMEX said market makers and professional traders tend to cluster where they can deploy capital efficiently and manage risk across many assets without jumping between platforms.
“If liquidity is too spread out across several derivatives platforms, it often leads to wider spreads and more volatile markets,” he said.
That dynamic may produce what Lutz described as a cyclical pattern for ecosystems experimenting with their own derivative platforms.
“We expect a U-shaped technical liquidity development per ecosystem,” he said, where new venues initially see a surge of activity before momentum fades.
Perpetual futures markets now influence where liquidity forms, how traders hedge risk and which platforms dominate trading activity. As blockchains compete to host those markets, derivatives trading is increasingly becoming core infrastructure for crypto ecosystems.
Magazine: The debate over Bitcoin’s four-year cycle is over: Benjamin Cowen

Quick Overview
- BlackRock’s iShares Staked Ethereum Trust (ETHB) entered the market with $15.5M first-day trading activity
- The new ETF began operations with $106.7M in net assets, charging a 0.25% fee (discounted to 0.12% during year one)
- Large Ethereum holders have accumulated approximately $480M in ETH throughout March, increasing profitable positions
- ETH maintains position above $2,080 with $2,000 serving as critical support
- Clearing $2,150 resistance could trigger an advance toward $2,800 price target
The world’s largest asset manager has introduced its staked Ethereum exchange-traded fund, expanding institutional crypto investment options. Simultaneously, significant accumulation by major holders and developing technical formations are capturing trader attention.
BlackRock introduced the iShares Staked Ethereum Trust (ETHB) on Nasdaq this Thursday. The investment vehicle generated
$15.5 million in first-day activity, with 592,804 shares traded. Bloomberg’s ETF specialist James Seyffart described the launch as exceptionally strong for an inaugural trading session.
The trading activity trailed behind two similar Solana-focused staking products. Bitwise’s Solana Staking ETF (BSOL) achieved $55.4 million during its October debut, while the REX-Osprey SOL + Staking ETF (SSK) generated $33.7 million at its July launch.
ETHB commenced operations holding $106.7 million in net assets secured through Coinbase custody. The product allocates 80% to staked Ether and 20% to unstaked Ether. It aims to deliver approximately 4% annual staking returns, with monthly reward distributions via validators operated by Figment, Galaxy Digital, and Attestant.
The fund implements a 0.25% annual fee, though this drops to 0.12% throughout the first year on initial assets up to $2.5 billion.
BlackRock Expands Digital Asset Offerings
ETHB represents another addition to BlackRock’s cryptocurrency portfolio. The firm’s iShares Bitcoin Trust ETF (IBIT) has accumulated more than $62.8 billion in investor capital since its 2024 debut. Meanwhile, the iShares Ethereum Trust ETF (ETHA) has gathered $11.9 billion during the same timeframe.
BlackRock is additionally developing a Bitcoin Premium Income ETF designed to generate returns through covered call options on Bitcoin futures contracts.
Ethereum Price Action and Large Holder Accumulation
Ethereum has declined approximately 3% across the previous seven days but maintained its position above the $2,000 threshold. For the year, ETH has dropped roughly 30%.
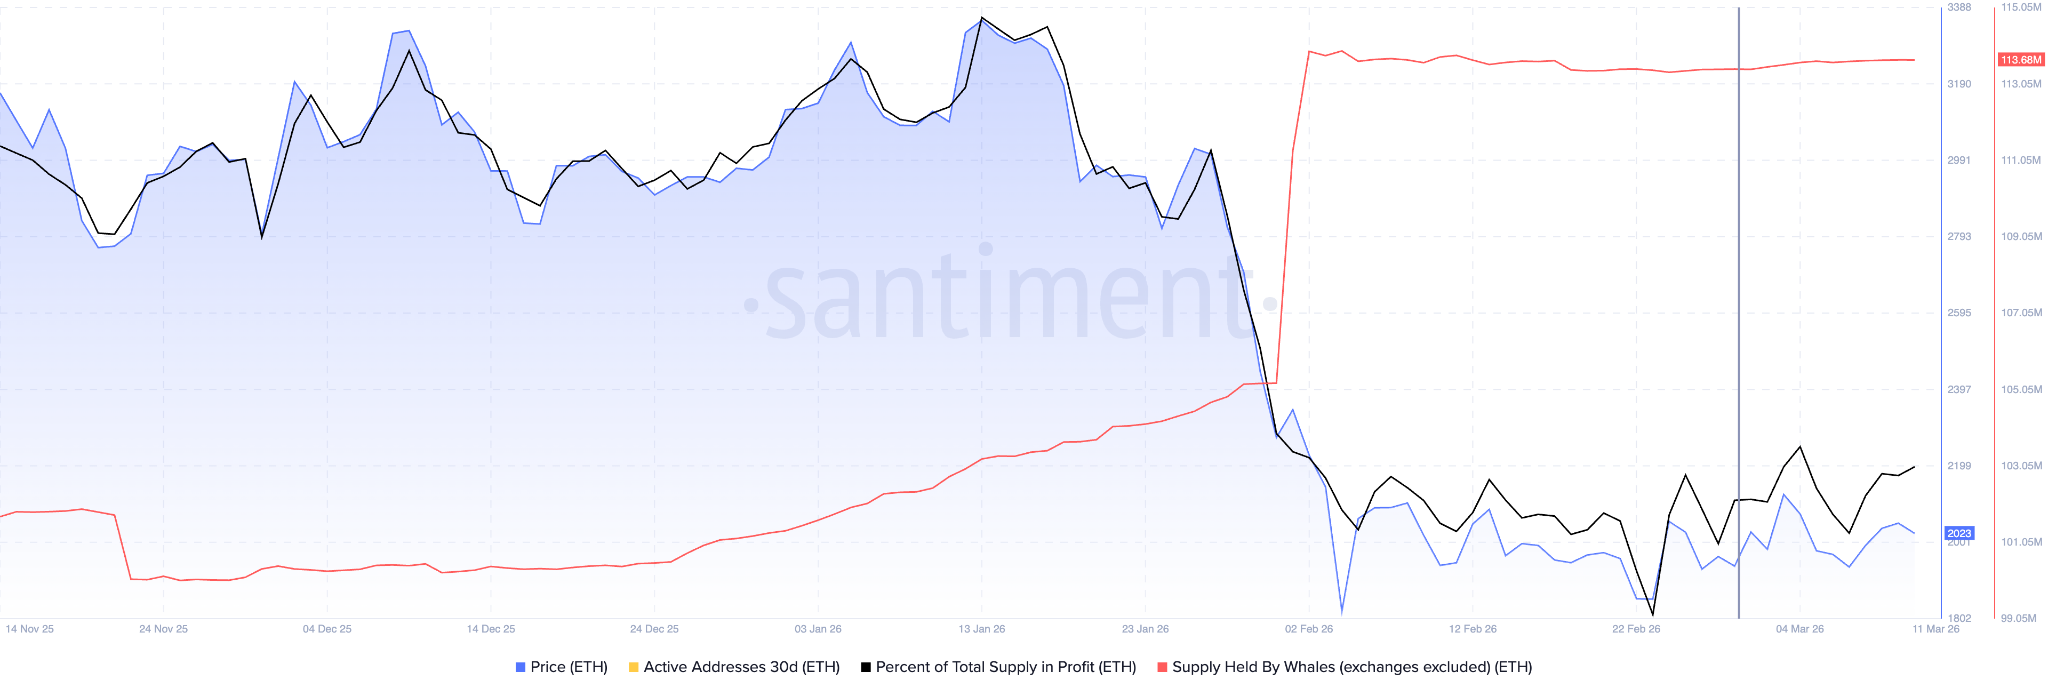
Blockchain analytics from Santiment reveal that major holders have acquired around 240,000 ETH tokens, valued near $480 million, since early March. During this accumulation period, the proportion of Ethereum tokens showing unrealized gains climbed from 39.8% to 42.3%.
Market volumes have contracted lately, which market observers suggest may signal diminishing selling momentum.
Ethereum currently changes hands above $2,080, positioned above its 100-hour Simple Moving Average. Initial resistance appears around $2,135, followed by $2,150. A decisive move past $2,150 could initiate momentum toward $2,220 and possibly $2,320.
Should the price slip below $2,050, support zones emerge at $2,000, followed by $1,950, with a critical foundation near $1,920.
A technical buy indication emerged on the hourly timeframe during Thursday’s U.S. trading hours, though market watchers emphasize that a validated breakout above key resistance would strengthen the signal before considering aggressive entries.


TLDR
- Extreme slippage on Aave led to a devastating loss of nearly $50 million for one cryptocurrency trader in a single swap transaction.
- The transaction converted $50.4 million into approximately 327 AAVE tokens valued at just $36,000.
- The trader acknowledged and bypassed several explicit slippage warnings on mobile before executing the trade.
- An MEV bot executed a sandwich attack on the same transaction, extracting close to $10 million in profits.
- The Aave protocol announced plans to refund approximately $600,000 in protocol fees to the impacted trader.
On Thursday, March 12, 2026, a cryptocurrency trader experienced one of the most devastating losses in DeFi history, losing approximately $50 million in just one transaction. The incident occurred while executing a token swap on Aave, a prominent decentralized finance platform.
The wallet in question, freshly funded via Binance, contained $50,432,688 worth of aEthUSDT. These interest-bearing tokens represent Tether’s USDT stablecoin deposited within the Aave lending ecosystem operating on Ethereum.
The trader initiated a swap to exchange the entire balance for aEthAAVE, the tokenized version of Aave’s governance token. This transaction was processed through CoW Protocol and executed on the SushiSwap decentralized exchange.
Due to the massive size of the order relative to available pool liquidity, the swap suffered catastrophic slippage exceeding 99%. The final result was a mere 327 AAVE tokens worth roughly $36,000.
Effectively, the trader paid approximately $154,000 for each AAVE token when the prevailing market rate stood at around $114.
What the Warnings Said
Stani Kulechov, founder of Aave, verified that the platform’s user interface had displayed prominent warnings before execution. In a post on X, he explained that the system alerted the user about “extraordinary slippage” resulting from the “unusually large size of the single order.”
The platform mandated that users check a confirmation box acknowledging the risk. The trader completed this step on a mobile device and moved forward with the transaction.
“The transaction could not be moved forward without the user explicitly accepting the risk,” Kulechov stated. He emphasized that the CoW Swap routing system functioned exactly as designed.
CoW DAO released its own statement, explaining that “no DEX, DEX aggregator, public liquidity pool, or private liquidity pool would have been able to fill this trade at anywhere near a reasonable price.”
The MEV Bot Attack
Compounding the slippage disaster, an MEV bot launched a sophisticated “sandwich attack” targeting this transaction.
MEV bots constantly scan pending blockchain transactions for profitable opportunities. This particular bot identified the massive incoming AAVE purchase and positioned itself to exploit it.
The bot secured a flash loan of $29 million in wrapped Ether from Morpho, deployed it to purchase AAVE on Bancor (artificially inflating the price), then sold directly into the trader’s order on SushiSwap. This strategy generated approximately $9.9 million in profits for the bot operator.
The manipulation drove AAVE’s price significantly higher immediately before the trader’s order executed, amplifying an already catastrophic outcome.
This incident followed closely after approximately $27 million in liquidations on Aave, which some observers suggested might have been connected to a temporary pricing anomaly affecting the wstETH token.
Kulechov expressed sympathy for the affected trader. The Aave protocol intends to contact the user and reimburse approximately $600,000 in fees collected during the transaction.
CoW DAO similarly committed to refunding any protocol fees associated with the trade.

When a trader wipes out $50M in seconds, the industry usually assumes a bridge hack or a sophisticated exploit. Late on Thursday (March 12), however, a crypto whale incinerated nearly their entire balance with a single click of AAVE crypto swap.
The user attempted to swap $50M worth of USDT for AAVE in a single on-chain transaction. Due to a complete lack of liquidity for an order of that magnitude, the trade suffered catastrophic slippage, returning just 324 AAVE crypto, worth roughly $50,000, for the $50M spent.
Poor fellow swapped $50m -> $35k on eth mainnet — deebeez (@deeberiroz) March 12, 2026
 https://t.co/fYRYqGzXlt pic.twitter.com/QGW8NnTikh
Data from the transaction shows the wallet interacted with the Aave interface via CoW Swap. According to Aave Labs founder Stani Kulechov, the interface explicitly “warned the user about extraordinary slippage and required confirmation via a checkbox.”
In a statement on X, CoW Swap confirmed that clear price-impact warnings were displayed and that the transaction followed the signed parameters. This comes down to user error and a lack of self-preservation in not using MEV bot protection.
How a Single Swap Cost One Whale $50M While Buying AAVE Crypto
The mechanics behind this loss are brutal but standard. Decentralized exchanges (DEXs) rely on liquidity pools. When a buy order exceeds the available liquidity at the current price, the automated market maker (AMM) moves the price up the curve to fill the order.
To fill the $50M order, the protocol had to buy available AAVE at astronomically higher prices, resulting in an average entry price that wiped out the capital immediately.
This highlights why institutional players typically break such trades into thousands of smaller chunks or use OTC (over-the-counter) desks.
While Ethereum is quickly cementing itself as the backbone of institutional settlement, this event shows that the user interface layer still allows for catastrophic human error. Smart contracts do not judge the wisdom of a trade; it only executes the parameters signed by the wallet.
DISCOVER: The 16 Best Meme Coins to Buy in March 2025
What This Reveals About DeFi Market Structure
This event exposes the dangerous reality of “fat finger” trades in DeFi, where human intervention or flagging systems would likely pause such an anomaly in traditional finance.
Current liquidity on Aave, or almost any single DEX pool, cannot absorb $50M in a single tick without massive price distortion.
Interestingly, the AAVE crypto token is up +5% over the past 24 hours, a price surge that may have been buoyed by an unfortunate user who bought $50,000 worth of the token for $50M.
We have seen similar risks highlighted recently, as just yesterday, the Bonk.fun website was hijacked leading to user funds being drained.
While that incident involved malicious actors, the AAVE swap shows that users can cause similar losses to themselves without a compromised platform.
What Happens Next for the Whale and How to Avoid Their Mistake
There is no reversal button on the blockchain. However, Kulechov noted that Aave Labs is attempting to contact the user to return approximately $600,000 in fees collected from the transaction.
While a sympathetic gesture, it represents slightly more than 1% of the lost funds. For the broader market, the lesson is stark: liquidity warnings are not suggestions.
If the interface warns of “Extraordinary Slippage,” take note. And even for smaller transactions, let alone five-figure ones, always enable MEV protection when executing trades, protecting users from sandwich attacks and being front-ran.
EXPLORE: Best Crypto Presales to Buy in 2026
The post AAVE Crypto Swap Costs Nearly $50M Lost: ETH MEV Pocketed $9.9M appeared first on Cryptonews.

Zumiez: Pullback Creates Opportunity Given Margin Expansion (Rating Upgrade) (NASDAQ:ZUMZ)

Historically Accurate Macro Signal Hints at a Bitcoin Price Bottom
New Dewey actor watches Jane Kaczmarek shave Bryan Cranston's crotch in latest “Malcolm in the Middle” revival trailer

Smart energy pays enters the US market, targeting scalable financial infrastructure

Why Israel is blocking foreign journalists from entering

Bitcoin: We’re Entering The Most Dangerous Phase

The First Financial Scam in History #history #finance

No relief for motorists as oil jumps above $US100 per barrel | Finance Report | ABC NEWS

Iran BOMBS Dubai BREAKING: Iran’s Shahed Drones POUND Dubai Int’l Financial Centre | CHILLING VIDEO
-
Business7 days ago
Form 8K Entergy Mississippi LLC For: 6 March
-

 News Videos4 days ago
10th Algebra | Financial Planning | Question Bank Solution | Board Exam 2026
-

 Fashion7 days ago
Weekend Open Thread: Ann Taylor
-

 Crypto World4 days ago
Paradigm, a16z, Winklevoss Capital, Balaji Srinivasan among investors in ZODL
-
 Tech2 days ago
A 1,300-Pound NASA Spacecraft To Re-Enter Earth’s Atmosphere
-

 Tech3 days ago
ChatGPT will now generate interactive visuals to help you with math and science concepts
-

 Politics7 days ago
Top Mamdani aide takes progressive project to the UK
-

 Business3 days ago
ExxonMobil seeks to move corporate registration from New Jersey to Texas
-

 Sports6 days ago
Three share 2-shot lead entering final round in Hong Kong
-

 Sports5 days ago
Braveheart Lakshya downs Lai in epic battle to enter All England Open final | Other Sports News
-

 NewsBeat2 days ago
Residents reaction as Shildon murder probe enters second day
-

 Entertainment6 days ago
Hailey Bieber Poses For Sexy Selfies In New Luscious Lip Thirst Traps
-

 Business5 days ago
Search for Nancy Guthrie Enters 37th Day as FBI Probes Wi-Fi Jammer Theory
-

 Business2 days ago
Search Enters Sixth Week With New Leads in Tucson Abduction Case
-
 NewsBeat3 days ago
Pagazzi Lighting enters administration as 70 jobs lost and 11 stores close across Scotland
-

 Tech4 days ago
Despite challenges, Ireland sixth in EU for board gender diversity
-

 Business4 days ago
Search Enters 39th Day with FBI Tip Line Developments and No Major Breakthroughs
-

 NewsBeat2 days ago
I Entered The Manosphere. Nothing Could Prepare Me For What I Found.
-

 Business6 days ago
Iran war enters second week as Trump demands ’unconditional surrender’
-

 Sports4 days ago
Skateboarding World Championships: Britain’s Sky Brown wins park gold