

Crypto World
What next for crypto market as stablecoin MC hits $315B ATH?


The crypto market has yet to react even as stablecoin supply reaches a new milestone.
Summary
- Stablecoin market cap surpassed $315 billion, reaching a new all-time high.
- Crypto market remains range-bound as stablecoin flows to exchanges stay weak.
- Analysts say growing stablecoin liquidity could fuel a future rally if inflows return.
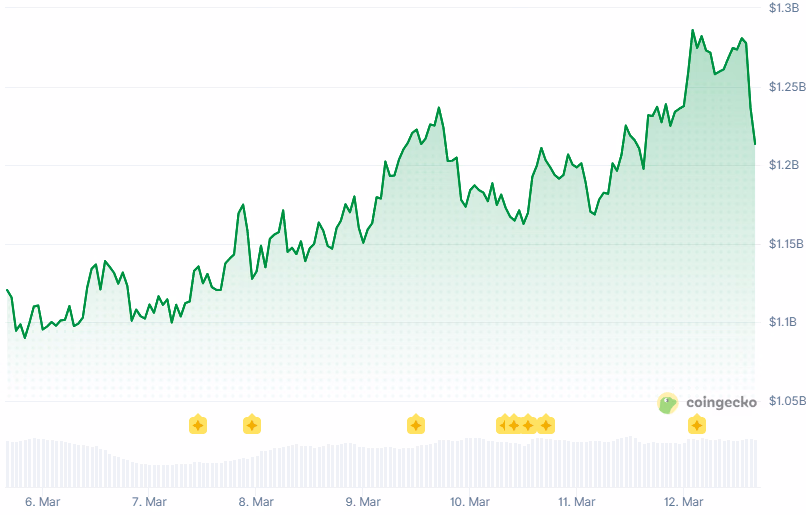
Data from DeFiLlama shows the total market capitalization of stablecoins has surpassed $315 billion, setting a new all-time high. The figure increased by about $2.48 billion, or 0.79%, over the past seven days, highlighting steady growth in on-chain liquidity.
Among the largest issuers, Tether (USDT) leads with a market cap of $183.93 billion, representing about 58% of the sector. USD Coin (USDC) follows with roughly $78.8 billion, while USDS holds close to $8 billion.
Historically, such expansion has often preceded rallies across the crypto market. Stablecoins usually function as liquidity waiting to be deployed, giving traders a way to move capital quickly into assets like Bitcoin, Ethereum, or decentralized finance protocols.
During the 2020–2021 bull cycle, stablecoin supply grew from around $20 billion to more than $120 billion. That growth came shortly before Bitcoin surged from roughly $10,000 to nearly $69,000.
A similar trend appeared during the 2024–2025 recovery, when rising stablecoin issuance led to renewed demand across digital assets.
Stablecoin supply rises, but trading demand stays muted
Despite the record supply, the broader crypto market has remained relatively quiet.
Exchange flow data shows that stablecoins have not been moving into trading platforms in large numbers. On the contrary, some exchanges have recorded consistent outflows this year.
For example, Binance has reportedly seen around $2 billion in monthly stablecoin outflows, while Bitfinex has recorded roughly $336 million leaving the platform.
This pattern suggests that new stablecoin liquidity is not immediately being used for speculative trading. As a result, prices across major cryptocurrencies have remained range-bound, with Bitcoin hovering near the $70,000 level in recent weeks.
Why stablecoins may be bypassing the crypto market
One explanation is that stablecoins are no longer used only as trading tools. Their role in the digital economy has expanded significantly.
Today, stablecoins are widely used for cross-border payments, remittances, and online settlements. For many users in emerging markets, they also serve as a practical alternative to volatile local currencies.
Major payment and crypto firms are also building infrastructure around these assets. Companies such as Circle and Stripe have explored systems that allow stablecoins to support new financial services, including automated payments and tokenized assets.
Because of this shift, a growing share of stablecoin activity now occurs outside traditional crypto trading. Liquidity may still be entering the ecosystem, but it is not immediately flowing into exchanges or spot markets.
For the crypto market, that leaves a mixed outlook. In the short term, prices could continue to move sideways as traders wait for stronger inflows.
Over a longer horizon, however, the expanding stablecoin supply may still provide the foundation for the next major rally, if that liquidity eventually returns to crypto markets.


Summary
- French Hill said the CLARITY Act could resolve issues left open by the GENIUS Act.
- Hill noted the House passed the CLARITY Act with bipartisan backing, including 78 Democratic votes.
- Lawmakers aim to ensure equal rules for bank and nonbank stablecoin issuers, Hill said.
French Hill, chair of the U.S. House Financial Services Committee, said the CLARITY Act could help address unresolved issues in the GENIUS Act.
French Hill remarks on CLARITY and GENIUS Acts
Hill discussed concerns raised by banks about how crypto firms may be regulated under the proposed framework, according to a Fox Business interview. The lawmaker pointed out that the House had already passed the CLARITY Act with bipartisan support.
“In the House last summer, we created the act, and we passed CLARITY Act in the House, with 78 Democratic votes,” Hill said. The legislation is part of broader efforts in Washington to define how stablecoins and other digital assets should operate within U.S. financial markets. Policymakers are also debating whether crypto firms should face the same oversight as banks.
Hill said lawmakers from both parties have already agreed on one key principle. “On a bipartisan basis we said stablecoin should not pay yield,” he said. The issue has become central to discussions around the GENIUS Act. That bill focuses on the regulatory framework for stablecoin issuers.
Hill suggested that some remaining concerns could be addressed through the CLARITY Act. “In my view this independent issue can be resolved in the CLARITY Act,” he said.
He also indicated that certain questions may be handled through regulatory rulemaking rather than new legislation. In particular, he pointed to potential rules on rewards or incentives tied to stablecoin transactions.
“I think all the issues about paying rewards should be dealt with in the regulatory proposal that Treasury has to come up with,” Hill said. “I think that’s best resolved in the GENIUS Act,” he added.
Banks Oppose CLARITY Act
Major banks have argued that crypto companies could gain a competitive advantage if they operate under lighter regulation. Executives from traditional finance have called for equal standards across the industry.
Hill said parity between different issuers is a key objective. “We want equal treatment between bank and nonbank issuers of stablecoins,” he said. The debate has drawn comments from banking leaders such as Jamie Dimon of JPMorgan Chase & Co.
Some executives have questioned whether the proposed legislation gives crypto firms too much flexibility. Hill said lawmakers want to avoid regulatory imbalance as the market evolves. “All issuers should be treated the same way,” he said. “You don’t want to have an imbalance between people using a dollar-backed stablecoin on their platform,” Hill remarked.
Crypto World
DeepSnitch AI Price Prediction 2026: Investors Rush In After $14 Targets As March 31 Launch Approaches, Can This New AI Coin Replace Bonk After Bonk.Fun Hack?

Solana will be joining the Mastercard Crypto Partner Program with an aim to bring digital payments into everyday use. As confirmed in a post on X by Solana Payments, the firm has joined more than 85 crypto firms focusing on bringing clear payment solutions.
Despite this development, the price of Solana (SOL) remained red on March 12. However, market participants are now rotating into DeepSnitch AI (DSNT) as the DeepSnitch AI price prediction for 2026 points to a breakout towards $14.
DeepSnitch AI is a market analytics and prediction platform capitalizing on AI to provide retail investors with actionable insights. This crypto, now in presale, is priced at $0.04399. DeepSnitch AI has accumulated more than $2.1 million, as interest continues to grow day-by-day.

Solana joins Mastercard’s crypto partner program in a bid to boost payments
The Mastercard Crypto Partner Program brings together top crypto entities looking to work together to bring effective payment solutions. By joining the program, Solana will be a part of a shared platform where expertise flows both ways, bridging on-chain solutions with everyday commerce.
Currently, Solana can process up to 65,000 transactions per second. However, the network aims to continue building sustainable growth for digital asset use cases. Other notable firms on the program include the likes of Binance, Ripple, and PayPal.
DeepSnitch AI price prediction for 2026 as Bonk gets hacked
1. DeepSnitch AI prediction 2026: Is DSNT set for a rally to $14?
Artificial intelligence is here to stay, especially in crypto. AI agents introduce speed and accuracy in a sector where they matter the most. As you know, one moment a coin may be up, the next, it’s crashing.
DeepSnitch AI understands that fully, and that’s why SnitchFeed, SnitchCast, SnitchGPT, SnitchScan, and AuditSnitch were developed to offer you a helping hand. These tools flag sentiment shifts, potential risks, gems, and FUD changes. Interestingly, these tools are all found under one roof.
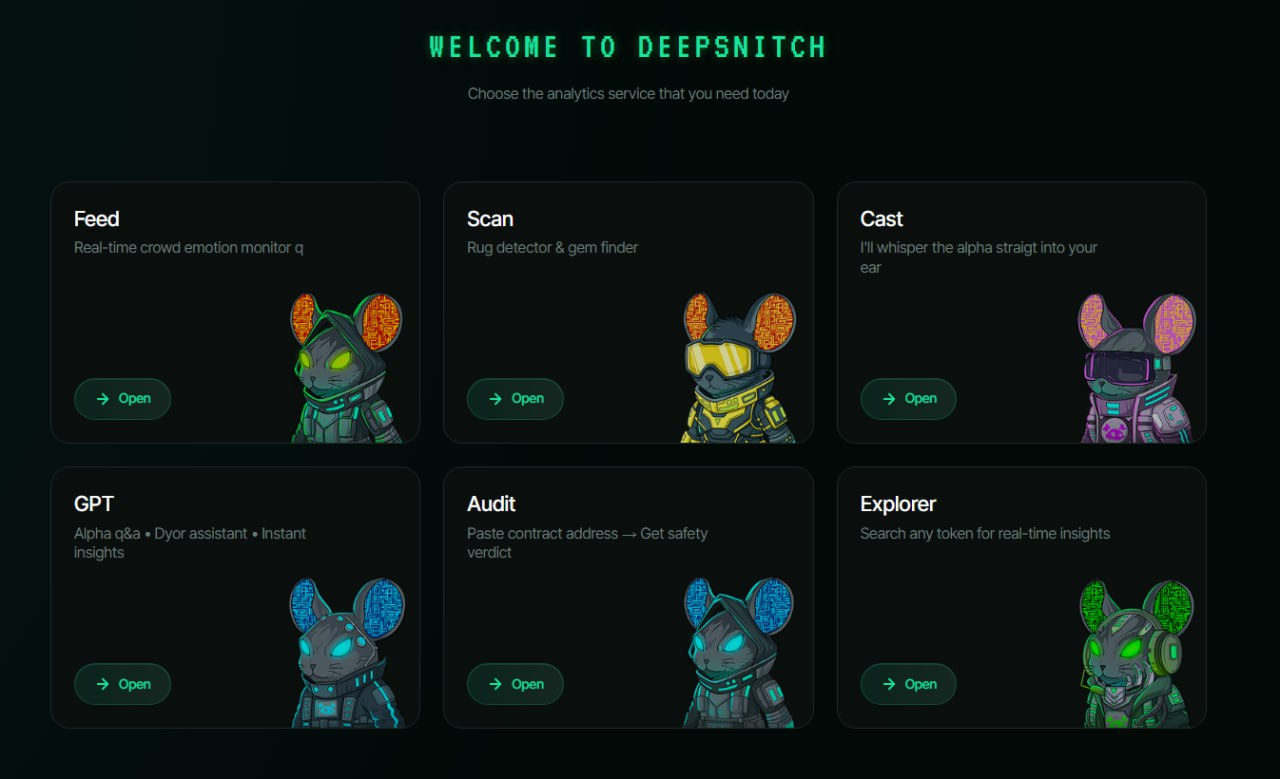
However, DeepSnitch AI is not a one-size-fits-all. Instead, each tool has a distinct purpose. But together, the tools combine to make DYOR easier, turning crypto trading into a lucrative venture.
Because of its clear value, DeepSnitch AI is experiencing significant bullish sentiment, with a bullish DeepSnitch AI price prediction. The forecasts suggest that a 300x rally could materialize.
According to the DeepSnitch AI token outlook, DSNT is now priced at $0.04399. A 300x rally could push the DeepSnitch AI future price to $14. This could turn even $1,000 into a huge portfolio.
2. Midnight price prediction for 2026
Midnight (NIGHT) traded at $0.04739 on March 12, following a 1.9% surge on the day. However, NIGHT is down by 21% over the past 7 days, signaling this crypto could be fading out.
According to the daily chart on TradingView, Midnight is plummeting towards a key support zone around $0.04382. If this level breaks, NIGHT could slide further. However, a surge past $0.06215 could invalidate the bearish Midnight price prediction.
3. Bonk price prediction as Bonk.fun gets hacked
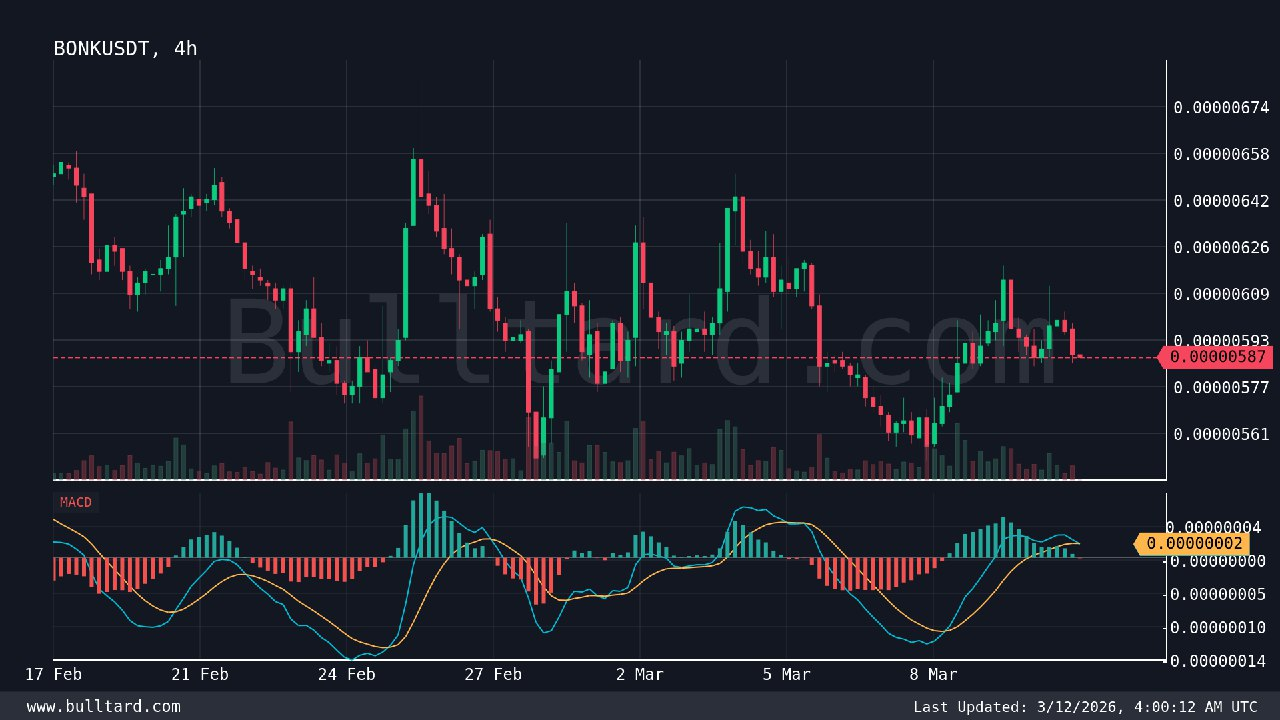
Bonk.fun, a community-driven Solana token issuance platform backed by Raydium and the BONK, was hacked on Thursday as malicious individuals installed wallet drainers on the official website. While the team moved swiftly to warn users, the news spread across the market.
However, the incident did not have much impact on the BONK token. Bonk traded at $0.000005977, down by 1.1% on the weekly timeframe and 0.7% over the past 24 hours. The latest Bonk price prediction shows that Bonk could continue to face bearish pressure as the MACD remains bearish.
Final verdict
The DeepSnitch AI price prediction for 2026 is bullish, while Bonk and Midnight face bearish pressure. Stemming from the bullish sentiment, the DeepSnitch AI future price may reach $14.
Such a move would mean actualization of the 300x rally, as rumors swirl. DeepSnitch AI could launch soon, hence now is the right time to buy this 2026 runner.
Visit the official website for more information, and join X and Telegram for community updates.
FAQs
1. How high will DeepSnitch AI go in 2026?
The DeepSnitch AI token outlook shows that DeepSnitch AI is very bullish. Once launched, this crypto is expected to rally to $14 this year, as indicated by the ‘DeepSnitch AI prediction 2026’.
2. Is DeepSnitch AI legit?
Yes, DeepSnitch AI is a legit crypto, audited by SOLIDProof and Coinsult. This year, the DeepSnitch AI price prediction highlights a potential 300x rally.
3. Is DeepSnitch AI a good investment?
The DeepSnitch AI future price is expected to reach above $14. This positions DSNT as the best crypto presale to purchase if you are chasing substantial returns.
Disclaimer: This is a Press Release provided by a third party who is responsible for the content. Please conduct your own research before taking any action based on the content.


Synthetix price moved slightly higher as the project published its roadmap for 2026, which includes token buybacks and new trading products.
Summary
- Synthetix price rose slightly after the protocol published its roadmap for 2026.
- The plan includes SNX buybacks, multi-collateral trading, and new markets on Ethereum.
- On the chart, Synthetix price is forming a compression pattern near the $0.32 level.
At press time, Synthetix (SNX) token traded at $0.3251, up about 2.9% in the last 24 hours. The token has stayed inside a narrow weekly range between $0.3008 and $0.3262.
Price movement has been slow but steady in recent weeks. SNX is up around 2% over the past seven days and roughly 20% over the past month as the market attempts to recover from earlier losses.
Trading activity has also increased slightly. 24-hour volume reached about $13.4 million, which is 11% higher than the previous day. Derivatives data from CoinGlass shows futures volume rising 10% to $41 million, while open interest climbed 6% to $16.39 million.
2026 roadmap included SNX buybacks
The move comes after the Synthetix team published a long update outlining how the protocol plans to grow during 2026.
According to the roadmap, trading revenue from Synthetix Perps will initially be used to buy back both SNX and the protocol’s stablecoin sUSD. Once the sUSD peg is fully restored, buybacks are expected to focus entirely on SNX.
The plan also includes a major expansion of trading features. In April, users will be able to deposit assets like ETH and cbBTC directly as margin on Synthetix Perps, rather than converting everything into a single collateral asset.
The change could bring more liquidity into the platform by allowing traders to use idle assets already held on Ethereum.
Other updates are scheduled later in the year. The protocol plans to introduce basis trade vaults, launch a public liquidity pool vault, and expand markets beyond crypto to include commodities and forex trading.
Developers also outlined a longer-term plan to transform sUSD into a fully decentralized stablecoin backed by delta-hedged crypto collateral.
The roadmap marks another step in the protocol’s restructuring. Over the past year, the project moved away from multiple Layer-2 deployments and shifted its focus back to Ethereum mainnet, where it now runs a centralized limit order book-style perpetual futures exchange.
Technical analysis: SNX forms tight compression
On the chart, SNX is moving inside a tight consolidation zone near $0.32–$0.33 after months of decline.
Volatility has dropped during the past several weeks. The Bollinger Bands have started to narrow, which often appears before a stronger price move once the range breaks.
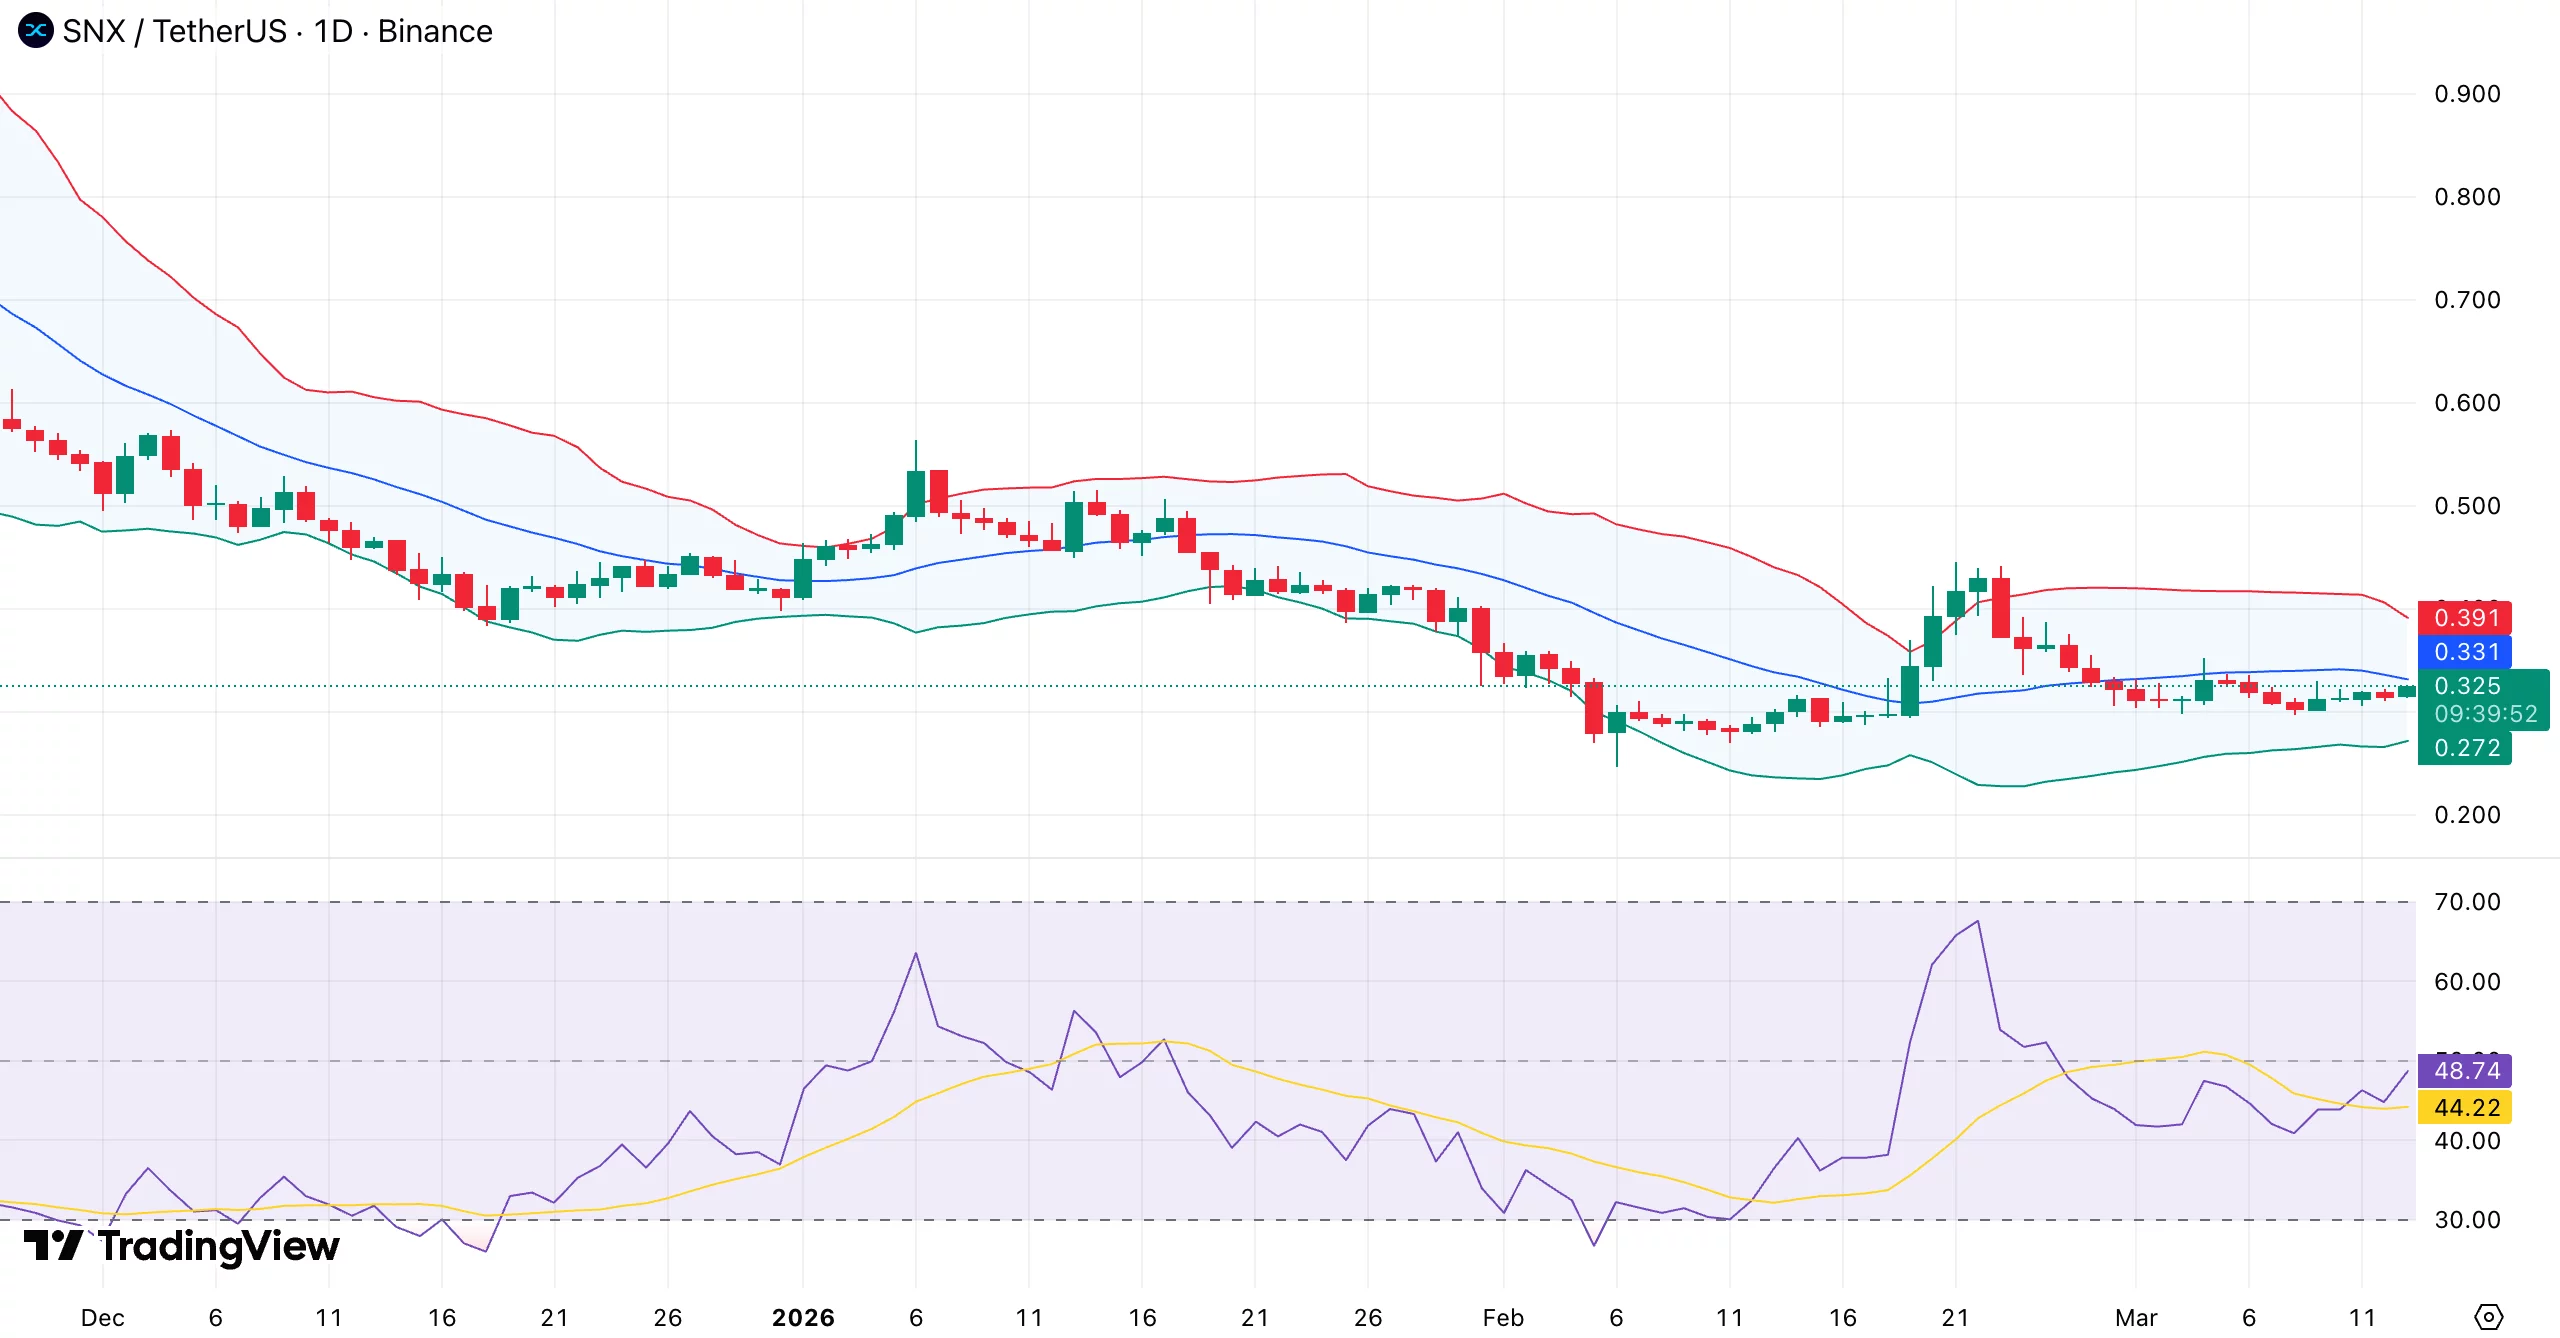
Resistance is now seen around $0.39–$0.40, a level where price was rejected during earlier rallies. Support remains lower, around $0.27–$0.30, where buyers stepped in during the February decline.
Momentum indicators show that selling pressure has eased. The relative strength index has climbed back toward the 50 level, moving away from the oversold zone that appeared earlier in the downtrend.
If SNX pushes above $0.39, the move could open the door toward the $0.45–$0.50 range. That would confirm a breakout from the compression pattern.
On the downside, a drop below $0.30 could weaken the structure and expose the $0.27 area again, which has acted as a key support level in recent months.


Binance spot flows show a late‑cycle alt pattern: oversold names like GTC and OGN mean‑revert, QTUM and RUNE lead thin breakouts, while SCR, THETA and TRX bleed as liquidity exits.
Summary
- Binance spot data flag GTC, OGN and BANANA in “bottoming rebound” mode, with 5–8% bounces off oversold levels rather than fresh trend breaks.
- QTUM, RUNE and MOVE are printing intraday highs with 5–7% gains, showing where real short‑term momentum and order‑book slippage now sit.
- SCR, THETA and TRX are sliding to new lows, a classic distribution tape where liquidity leaves and anyone still “investing” without stops is just donating.
Binance spot is doing what it always does in late‑stage moves: rewarding early degenerates in illiquid names and punishing anyone chasing laggards without a plan.
Altcoins in “bottoming rebound” mode
Binance spot data show several small and mid‑cap altcoins staging what the feed calls a “bottoming rebound.” GTC is up 7.52% over the past 24 hours, OGN has gained 5.84%, and BANANA is higher by 5.03%, all bouncing off depressed levels rather than breaking into new trend regimes. For anyone trading these, understand the context: this is classic mean‑reversion from oversold, not some structural rotation into fundamentals.
In parallel, QTUM, RUNE and MOVE have pushed to intraday highs, with gains of 5.34%, 7.22% and 6.28% respectively. That’s where real momentum lives right now: coins with just enough liquidity to move, just illiquid enough to blow through order books when a few desks lean the same way.
Bleeders: SCR, THETA, TRX
On the other side of the tape, a trio of names is getting clubbed. SCR is down 8.38% from intraday high to low, THETA has dropped 9.06% to a new weekly low, and TRX printed a new daily low, off 5.29%. This is what distribution looks like: previously‑bid names running out of greater fools while the rest of the market celebrates elsewhere.
If you are still long these without a defined stop, you are not “investing,” you are donating. The market is telling you liquidity is leaving the room; your job is to listen, not argue.
How to actually trade this
Treat the “bottoming rebound” names as short‑horizon vehicles: tight risk, fast profit‑taking, no diamond‑hands fantasy. When you see low‑liquidity coins flying 5–8% in a day after being left for dead, that’s order‑flow, not structural demand — size accordingly.
For the winners making intraday highs (QTUM, RUNE, MOVE), only two strategies are acceptable: buy early and cut fast if momentum dies, or fade parabolic spikes with defined invalidation once funding and spot volumes go stupid. For the losers (SCR, THETA, TRX), either you cut and move capital to where the tape is paying, or you write the position to zero and stop pretending you’re a trader.
The feature lets tokenized agents direct onchain revenue toward buying back and burning their own tokens.
Solana-based memecoin launchpad pumpfun has rolled out a new feature that connects AI agents to tokenonomics, allowing projects to automatically funnel agent-generated revenue into token buybacks and burns.
The tool, called Tokenized Agents, targets what pumpfun describes as a core problem in the growing “agentic economy” – a lack of value alignment between successful AI agent projects and the communities that form around them.
How It Works
Under the new system, developers launch a token on the platform, set a revenue buyback percentage, and integrate their agent using a provided configuration file. When the agent earns revenue, whether from SaaS products, trading, or other sources, a portion is automatically used to buy back and burn the token.
Buybacks are executed by a centralized buyback authority and instantly burned. Only revenue denominated in SOL and USDC is eligible, and a minimum threshold of $10 in accumulated revenue is required before a buyback is triggered.
It’s worth noting that the agents themselves are not deployed on pumpfun, whose role is limited to enabling the onchain buyback-and-burn mechanism tied to the token.
Existing Tokens Can Opt In
The feature is not limited to new launches. Existing tokens on the bonding curve or migrated to PumpSwap can activate the Tokenized Agent toggle from their coin page. Multiple unrelated agents can also contribute revenue toward buybacks for the same token.
Token creators retain the ability to adjust buyback percentages at any time. Revenue not allocated to buybacks remains claimable by the creator. Creator fees, which are rewards generated from trading volume, are enabled by default, though creators can opt to redirect them as cashback for traders instead, a feature the platform introduced in February.
The launchpad’s native PUMP token is up 8% over the past week amid a broad market rebound.

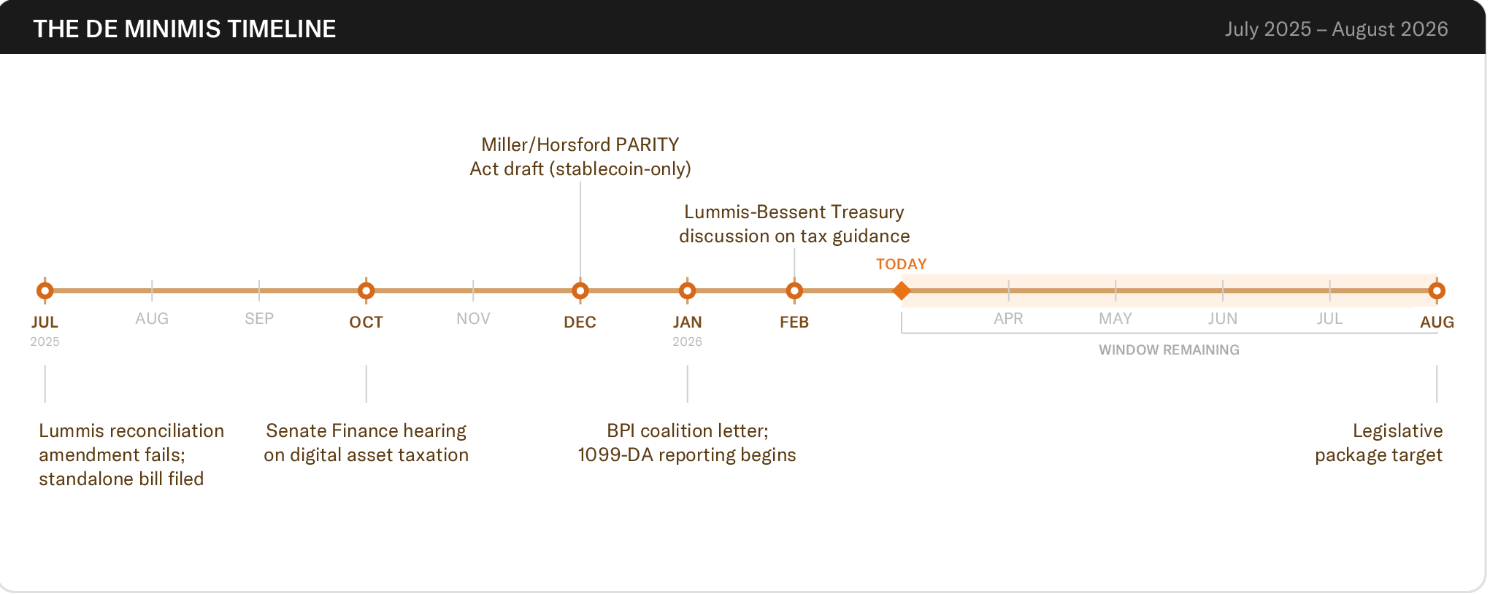
The Bitcoin Policy Institute (BPI), an industry advocacy group, is eyeing a target window between March and August 2026 to pass a de minimis tax exemption for Bitcoin through Congress, warning that time to pass meaningful legislation is running out.
BPI said it has engaged with 19 Congressional offices in both the House and Senate over the last three months to pitch US lawmakers on a tax exemption for Bitcoin (BTC) transactions below a certain threshold.
Expanding the de minimis tax exemptions beyond dollar-pegged stablecoins has bipartisan support, but the BPI warned that the “window is narrowing” for Bitcoin tax legislation. The BPI said:
“Congress will be increasingly consumed by midterm dynamics as summer approaches, and the bandwidth for complex tax legislation shrinks with every passing week. Senator Lummis, the issue’s most forceful champion, departs the Senate in January 2027.
If a package does not come together in the next few months, the opportunity may not return for years,” the BPI continued.

Under current US tax rules, using BTC to pay for goods and services triggers a taxable event and tax reporting to the Internal Revenue Service (IRS), preventing the use of Bitcoin as a medium of exchange.
A de minimis exemption would allow small crypto transactions, typically below a set dollar threshold, to be excluded from capital gains reporting, allowing users to spend Bitcoin without calculating gains or losses on minor purchases.
Related: Bitcoin advocate group to fight Basel’s ‘toxic’ treatment of cryptocurrency
Tax policy has kept Bitcoin as an investment and out of commerce
Wyoming Senator Cynthia Lummis introduced a bill in July 2025 proposing a de minimis tax exemption for cryptocurrency transactions of $300 or less, capped at $5,000 annually.
However, the bill failed to gain traction in the Senate, and a competing bill focused entirely on tax exemptions for stablecoins was introduced to the House of Representatives by Congresspersons Max Miller and Steven Horsford in 2025.

Bitcoin payments are held back by the digital asset’s current treatment under the US tax code, according to Pierre Rochard, a board member for BTC treasury company Strive.
“The number one impediment to Bitcoin payments adoption is tax policy, not scaling technology,” Rochard said on X.
Magazine: Big questions: Should you sell your Bitcoin for nickels for a 43% profit?
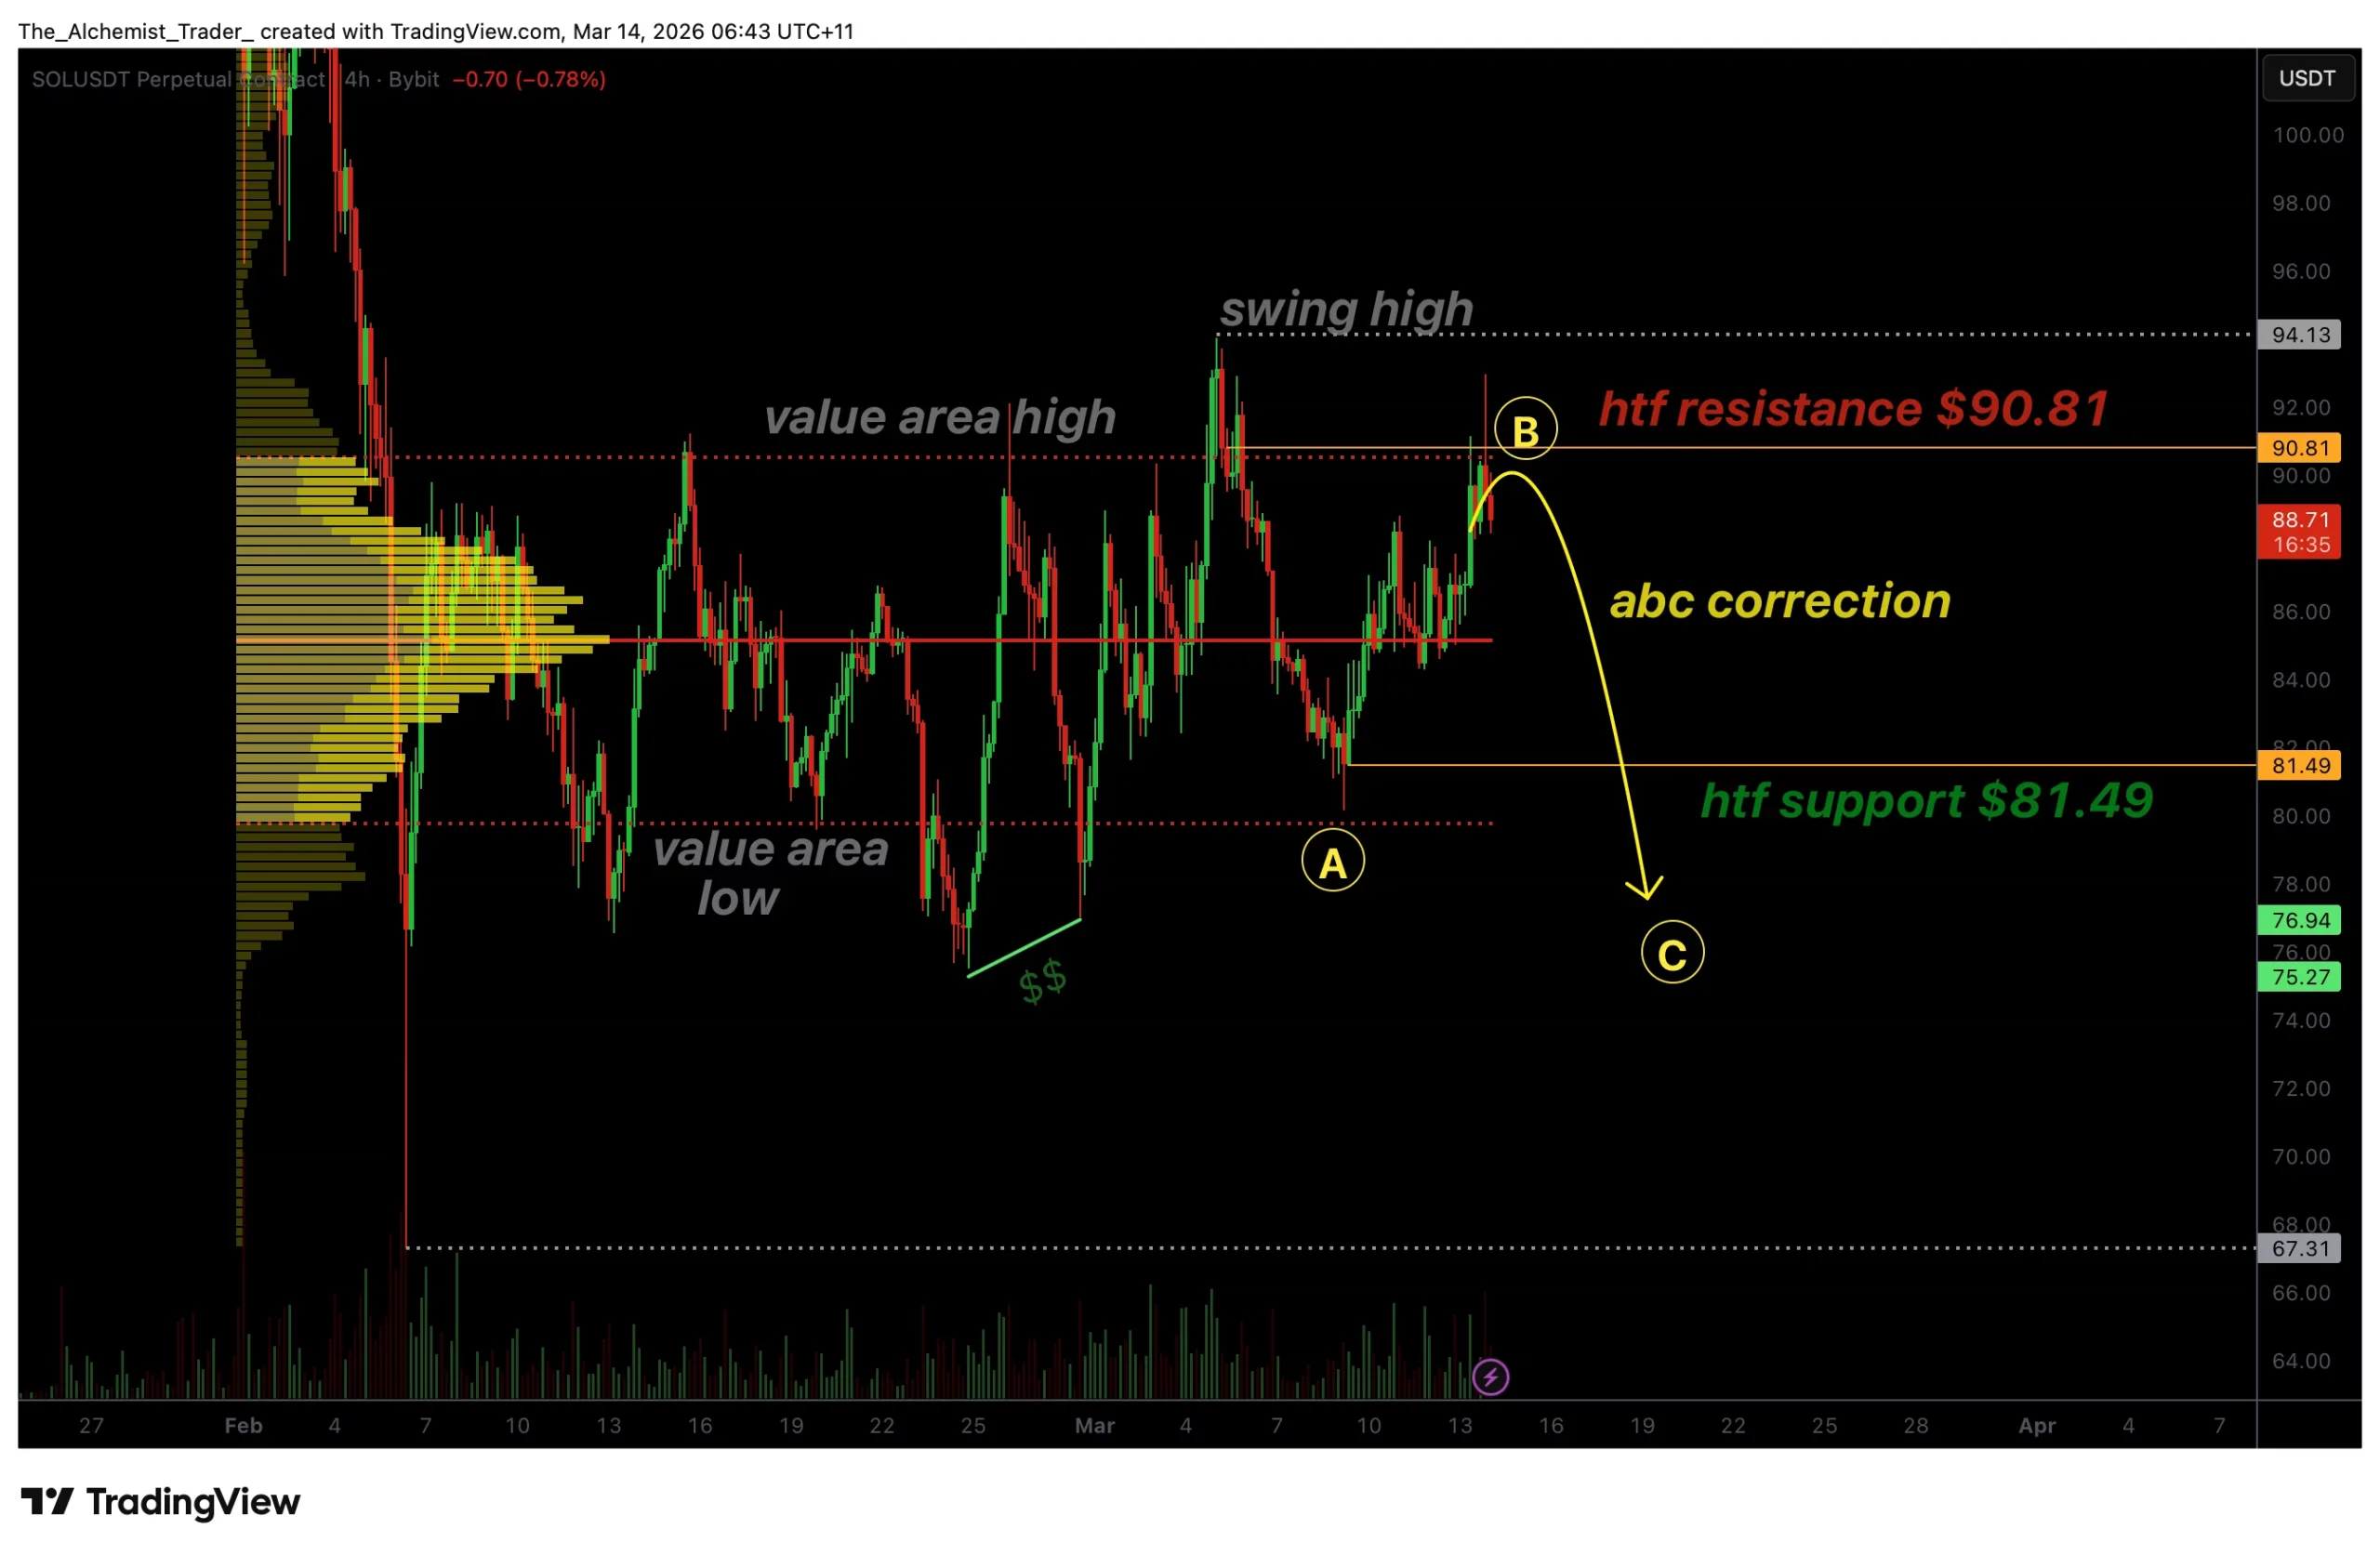
Solana price has rejected a key resistance zone near $90, signaling the potential continuation of an ABC corrective structure.
Summary
- Key Resistance: $90 aligns with high-timeframe resistance and the value area high.
- ABC Correction: Rejection suggests the C-leg of a corrective structure may be underway.
- Support to Watch: A break below $81 could open downside toward the value area low.
Solana’s (SOL) recent price action suggests the market may be entering a corrective phase following a clear rejection from the upper boundary of its trading range. The $90 region has acted as a significant high-timeframe resistance zone, aligning with the value area high and several structural resistance levels on the chart.
With the latest move failing to hold above this region, the probability of a deeper corrective move is beginning to increase.
Solana price key technical points
- Range-High Resistance: $90 aligns with high-timeframe structural resistance and the value area high.
- ABC Structure: Price action is signaling the continuation of a corrective ABC pattern.
- Downside Target: Potential move toward $81 support and the value area low.
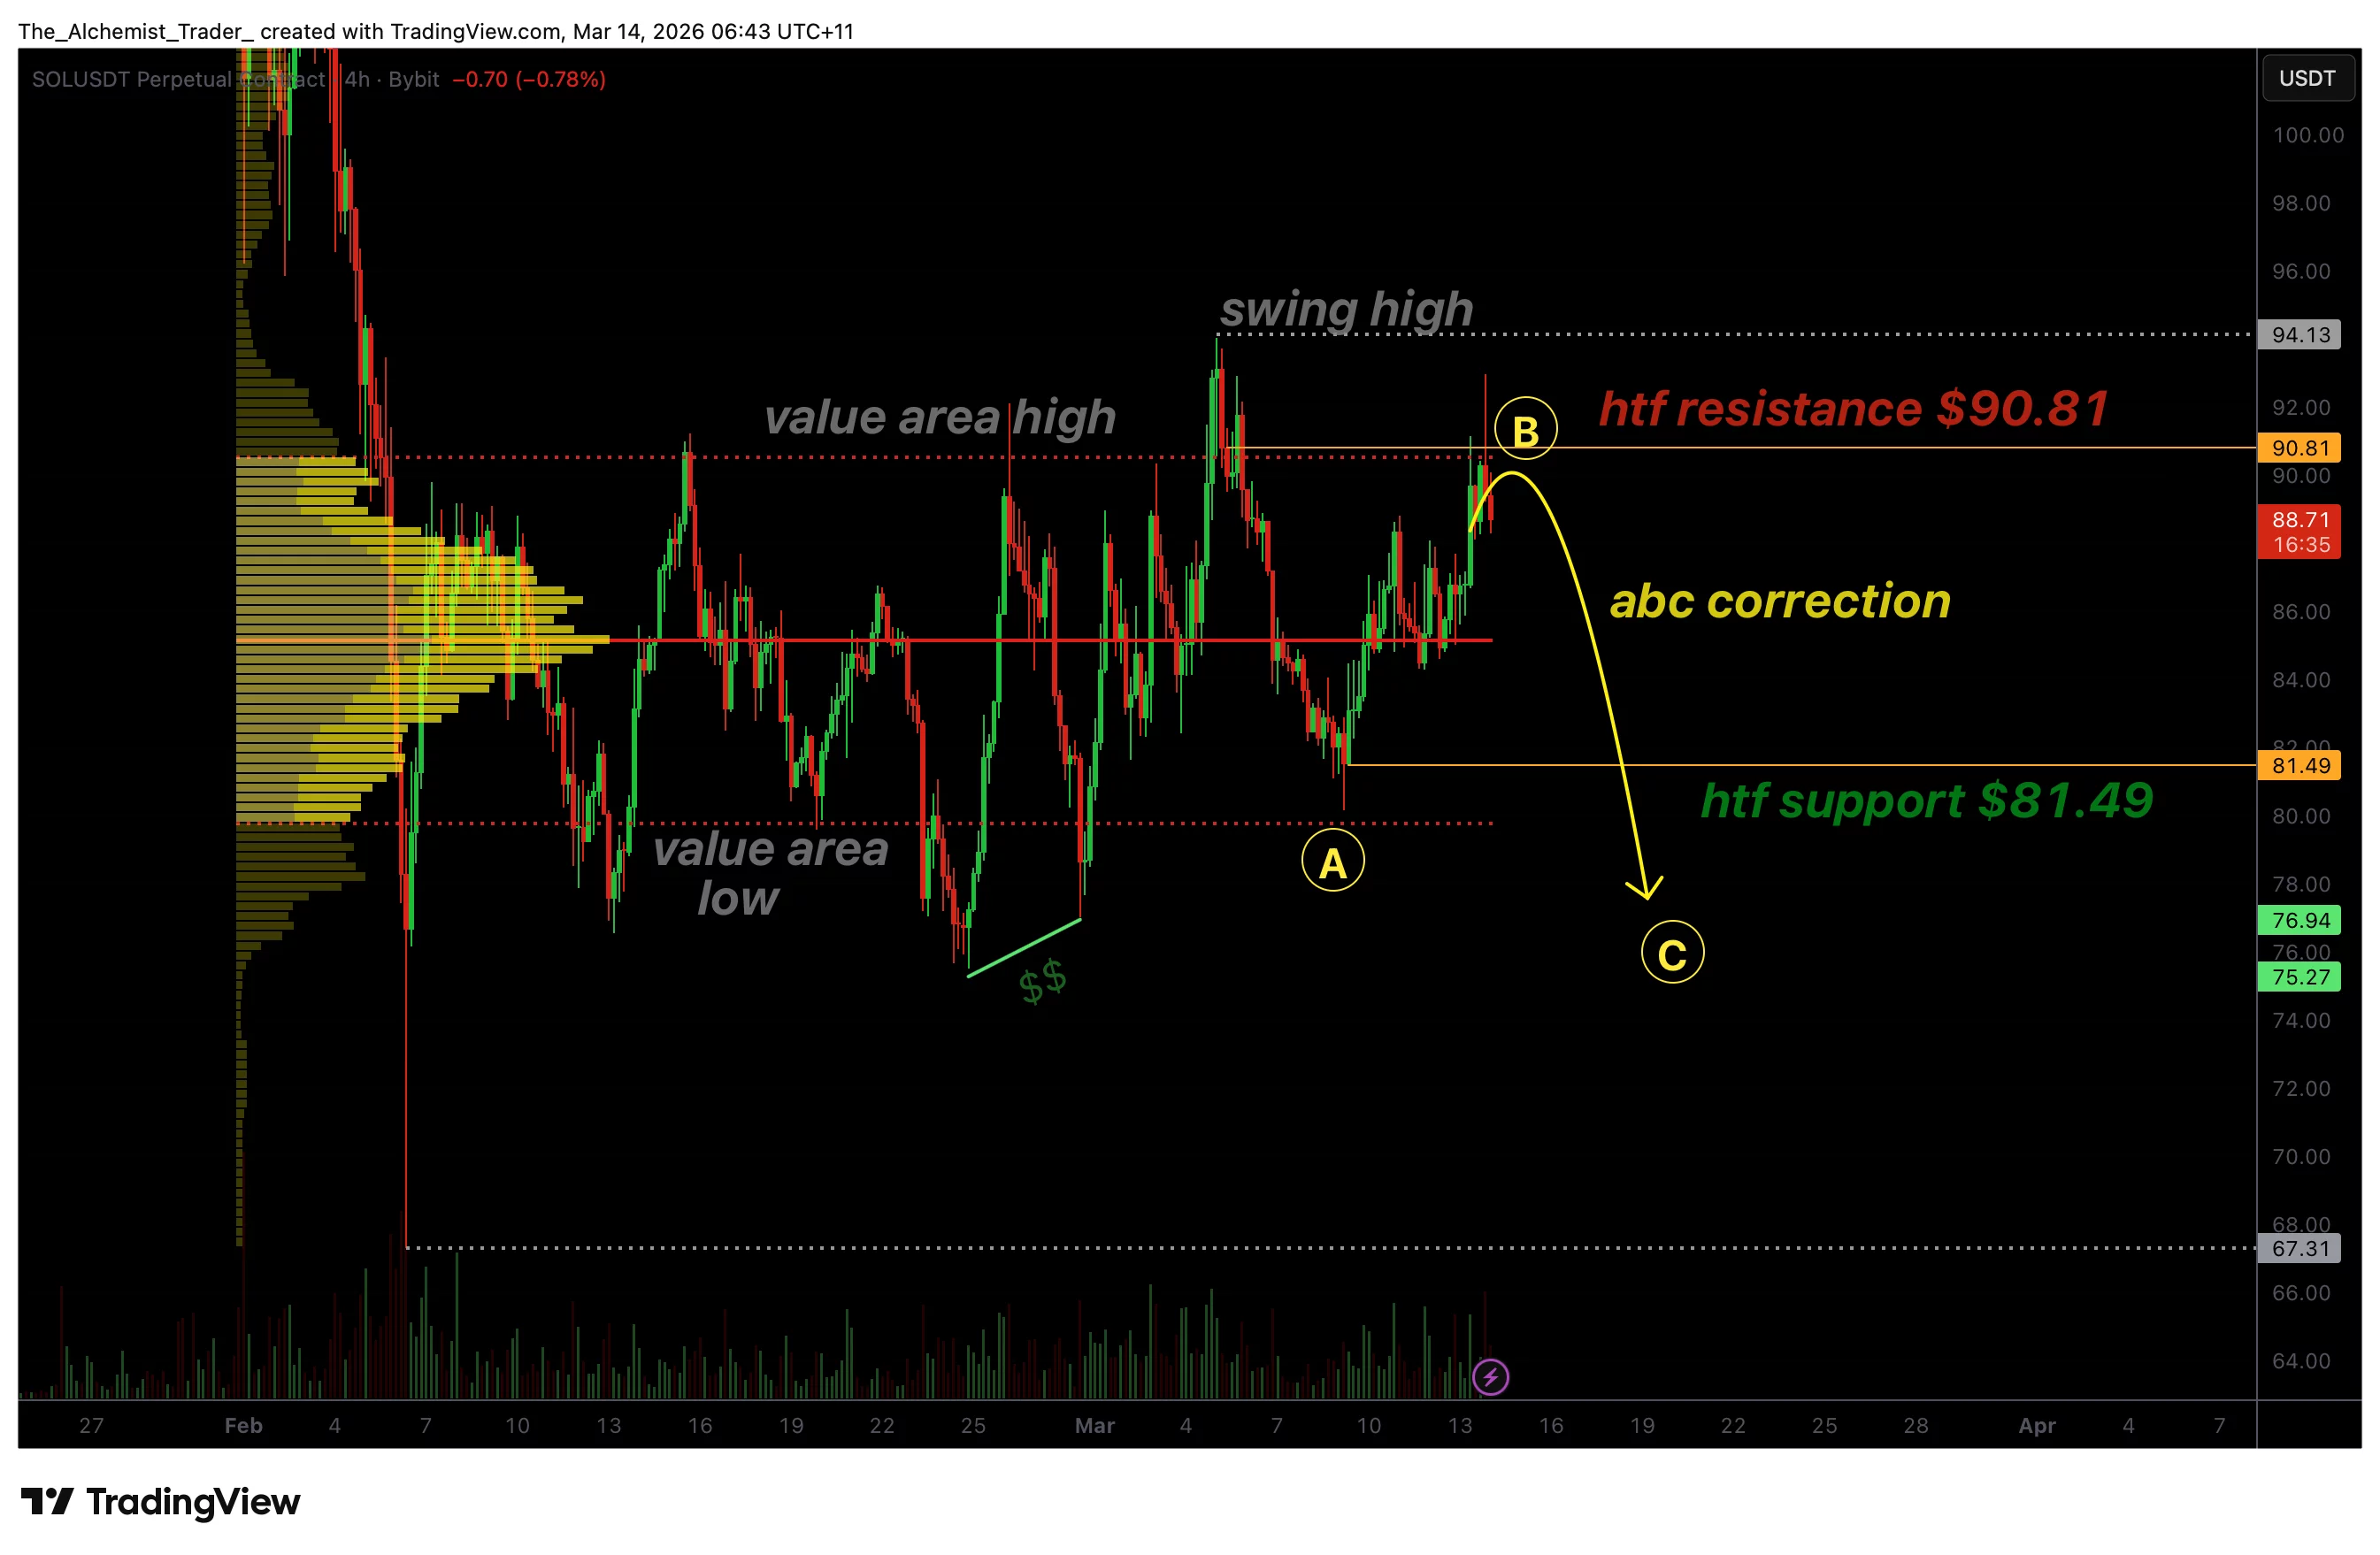
Solana’s price action recently approached the $90 region, which has historically acted as an important resistance level within the current market structure. This zone represents the upper boundary of the broader trading range and aligns closely with the value area high derived from the volume profile. When price approaches these areas, selling pressure often emerges as traders look to defend previous resistance.
The latest price movement shows a clear rejection from this region, reinforcing the idea that Solana remains within a corrective phase rather than entering a sustained breakout. The inability for price to reclaim the $90 resistance level suggests that buyers may be losing momentum at this point in the trend.
From a technical perspective, the rejection also aligns with a developing ABC corrective pattern, a common structure in market cycles where price moves through three phases before potentially resuming a broader trend. In this structure, the initial decline forms the A leg, followed by a temporary recovery known as the B leg, before the market enters the C leg, which typically extends toward lower liquidity zones.
In Solana’s case, the recent rally toward $90 may represent the B leg of the correction. Because the move has failed to sustain above resistance, the market may now be transitioning into the C leg of the structure, which typically involves price breaking below intermediate support levels as liquidity is cleared from the market.
This technical setup is unfolding as broader ecosystem developments continue, including Nasdaq-listed Solmate Infrastructure announcing plans to establish a Solana infrastructure hub in the United Arab Emirates as part of a wider corporate restructuring and capital overhaul.
One of the key levels to watch in this scenario is the $81 support zone, which represents an important high-timeframe support level within the current structure. If price moves below this level, it would confirm increasing bearish pressure and open the door for a deeper rotation toward the value area low.
The value area low acts as a key liquidity region where large clusters of orders tend to accumulate. In range-bound markets, price frequently rotates between the value area high and value area low as traders rebalance positions and search for liquidity.
Another important factor supporting the corrective outlook is the presence of untapped swing lows below the current price. Markets often move toward these zones as they contain resting stop orders and liquidity pools that larger participants may target before establishing a new directional move.
The confluence of resistance levels near $90 strengthens the probability that the rejection will continue to influence price direction. Multiple technical factors align in this region, including structural resistance, the value area high, and Fibonacci retracement levels, making it a significant barrier for bullish continuation.
Because of this, the broader market structure suggests that Solana may remain in a rotational environment until either the range high or range low is decisively broken. For now, the rejection from resistance suggests that the downside portion of the range may be tested next.
What to expect in the coming price action
As long as Solana remains below the $90 resistance zone, the ABC corrective structure is likely to remain active. A break below the $81 support level could accelerate downside momentum toward the value area low, while a strong reclaim of $90 would invalidate the bearish outlook and signal renewed bullish momentum.


Major crypto conferences have been postponed amid ongoing drone strikes and airspace restrictions across the Gulf.
Two of the crypto industry’s most prominent Dubai-based events have been cancelled or postponed as the escalating U.S.-Israel-Iran conflict continues to disrupt travel and logistics across the Middle East.
Token2049, one of the world’s largest annual crypto conferences,announced Friday that its Dubai edition, originally slated for April 29-30, would be pushed to April 2027. Organizers cited “ongoing uncertainty in the region and its impact on safety, international travel and logistics.”
The move follows Thursday’s cancellation of Gateway Dubai, an event organized by The Open Network (TON), the blockchain ecosystem affiliated with Telegram. That event, which had been scheduled for May, wasscrapped entirely.
The Token2049 postponement marks a sharp reversal from organizers’ position earlier this week, when a spokespersontold Fortune that preparations were continuing and registrations were tracking toward a sold-out event.
The conference had been expected to draw roughly 15,000 attendees. Scheduled speakers included Polymarket CEO Shayne Coplan, Tether CEO Paolo Ardoino, and Circle co-founder Jeremy Allaire.
The cancellations come as the UAE faces growing disruption from the conflict. Two drones fell near Dubai’s main airport on Wednesday, and Dubai’s media office confirmed Friday that debris from an intercepted missile caused minor damage to a building in the city center.
The UAE has emerged as one of the fastest-growing hubs for the digital asset industry, hosting more than 1,800 crypto companies, according to Cointelegraph.
This article was written with the assistance of AI workflows. All our stories are curated, edited and fact-checked by a human.
Analysts at Mizuho say a shift in stablecoin usage is underway, with a Circle-issued dollar-pegged token appearing to surpass its main rival in on-chain transaction volume for the first time since 2019. In a Friday research note, the bank highlighted year-to-date adjusted volumes of about $2.2 trillion for the Circle-backed stablecoin against roughly $1.3 trillion for the Tether-backed option, signaling a move toward routine payments rather than just crypto trading. The report also notes that the Circle-backed coin claims about 64% of the combined turnover between the two, reversing a long-running pattern in which the Tether-backed token led on volume. Circle’s public listing on the NYSE in June 2025 drew attention, though the initial price reaction was muted. By market cap terms, the Tether-backed stablecoin remains dominant, with approximately $184 billion in circulation compared to about $79 billion for its Circle-backed rival.
Key takeaways
- The Circle-backed stablecoin surpassed the Tether-backed counterpart in on-chain transaction volume for the year to date, underscoring a shift toward stablecoins used for everyday payments rather than speculative activity.
- Adjusted volumes show Circle’s token at about $2.2 trillion versus roughly $1.3 trillion for Tether’s stablecoin, translating into a 64% market share for Circle’s offering within the two assets’ daily activity.
- Despite the volume leadership, Tether’s stablecoin remains larger in terms of market capitalization, with around $184 billion in circulating supply versus about $79 billion for Circle’s stablecoin.
- Circle’s stock began trading on the NYSE in June 2025, and the initial move after the IPO was modest, indicating a separation between on-chain usage dynamics and traditional equity performance.
- Policy and regulatory hurdles in the United States continue to shape stablecoin discussions, with lawmakers weighing a digital asset market framework even as debates over stablecoin yield and tokenized equities persist.
Tickers mentioned: $USDC, $USDT
Sentiment: Neutral
Price impact: Neutral. The report highlights a shift in usage patterns rather than immediate price movements, with market capitalization remaining skewed toward the Tether-backed stablecoin.
Market context: The findings come as the broader crypto market contends with liquidity dynamics and ongoing regulatory discussions in Washington over stablecoins and market structure, illustrating how on-chain activity and regulatory policy can diverge in the near term.
Why it matters
The potential migration of everyday transactions toward a Circle-backed stablecoin could recalibrate how participants fund wallets, settle micro-payments, and bridge assets across networks. If a stablecoin gains traction as the preferred medium for routine exchanges, its on-chain liquidity profile, settlement efficiency, and interoperability across exchanges and wallets could influence funding costs and user experience. Yet the distinction between on-chain transaction volume and market capitalization remains pronounced: even with higher volumes, USDT continues to dominate in overall supply and market depth, which matters for liquidity when markets swing or during large withdrawals.
For builders and exchanges, the volume shift flags a possible reallocation of demand toward a different stability mechanism or settlement rails. Protocols that rely on stablecoin liquidity for cross-chain liquidity provision, automated market makers, and DeFi lending could feel the impact of changing user preferences. Regulators, meantime, watch and weigh how stablecoins interact with yield, compliance, and consumer protection norms as they craft potential standards for a broader digital asset framework.
The data also highlights how headline market capitalizations may diverge from real-world usage metrics. A stablecoin can be widely used for payments and remittances even if its nominal market cap remains smaller than that of a rival. In this case, the Circle-backed token’s stronger daily turnover suggests broader acceptance in payments corridors, merchant integrations, and cross-border settlements, while Tether’s larger capitalization preserves its role as a liquidity backbone. The coming quarters will reveal whether the usage trend persists or whether market forces re-balance these two pillars of the stablecoin ecosystem.
As part of the broader narrative, policymakers continue to weigh a structured framework for digital assets, including debates over stablecoin yield and tokenized equities. The CLARITY Act, which previously moved through parts of Congress, has faced hurdles in the Senate, where leaders indicate a priority on voting requirements rather than immediate market-structure reforms. These political dynamics create a backdrop in which on-chain metrics may diverge from regulatory momentum, making immediate price or allocation signals less predictable than the underlying activity data might suggest.
For readers tracking the big-picture trajectory, the divergence between on-chain activity and market capitalization can be telling. The shift toward a more transaction-focused usage pattern does not necessarily translate into an immediate re-rating of the asset’s value, but it does imply a growing role for a Circle-backed stablecoin in daily payments and merchant settlement. Investors and users should monitor whether this usage trend endures as merchant adoption, cross-border flows, and DeFi integrations evolve in parallel with regulatory developments.
To contextualize these movements, a separate data point underpins the narrative: Circle’s public listing on the NYSE in June 2025. While the IPO event catalyzed attention around the governance and corporate side of the ecosystem, the market reaction to the volume shift remains a separate thread, underscoring how on-chain dynamics can outpace traditional equity performance in this rapidly evolving space. The ongoing conversation around stablecoins—how they yield, how they are regulated, and how tokenized instruments may coexist—will continue to shape liquidity, risk appetites, and product design across the crypto ecosystem.
For a direct look at the discussion around USDC, USDT, and their evolving roles, readers can explore the linked materials, including deep-dive notes and index references that track price and circulation metrics over time. A video discussion related to the topic is available here: Video discussion on stablecoin dynamics.
What to watch next
- Upcoming quarterly volume disclosures for USDC and USDT to confirm whether the 64% share persists into the next data cycle.
- Progress on the CLARITY Act or alternative US digital asset market framework bills in Congress and any votes scheduled in the Senate.
- Shifts in market capitalization versus on-chain usage, including any notable changes in the size of each stablecoin’s circulating supply.
- Broader regulatory guidance on stablecoin yield, ethics, and tokenized equities and how those will impact issuer strategies.
Sources & verification
- Mizuho research note comparing transaction volumes between Circle-backed USDC and Tether-backed USDT, including the 64% market-share figure and the $2.2 trillion vs $1.3 trillion volume comparison.
- Circle stock listing on the NYSE in June 2025 and subsequent price action.
- Price index references for USDC (CRYPTO: USDC) and USDT (CRYPTO: USDT) as cited in price-tracking discussions.
- US Senate discussions around the CLARITY Act and related market-structure debates affecting stablecoins, including notes about voting-priority scheduling in the Senate.
Stablecoin usage shifts and the on-chain volume race
The latest data from a major investment bank captures a pivotal moment in stablecoin dynamics. The Circle-issued stablecoin (CRYPTO: USDC) appears to have overtaken its Tether counterpart (CRYPTO: USDT) in on-chain transaction volume for the year to date, marking a departure from a multi-year pattern in which USDT led most volume metrics. The bank’s analysis shows USDC posting about $2.2 trillion in adjusted year-to-date volume, while USDT sits around $1.3 trillion. With these figures, USDC has captured roughly 64% of the combined turnover between the two entities, signaling a shift toward stablecoins as day-to-day payment rails rather than merely a liquidity layer for whales and traders.
The juxtaposition of high transaction activity with market capitalization also tells an important story. While USDC is catching up in usage, USDT retains a commanding head start in global supply, boasting a market capitalization near $184 billion compared with USDC’s roughly $79 billion. This divergence underscores a broader theme in crypto markets: usage and liquidity can outpace capitalization when user adoption and merchant integration expand. The leadership in on-chain volume does not automatically translate into price or market-share dominance, but it does illuminate where real-world activity is concentrated and where demand for stable value storage is coalescing.
The discussion around stablecoins in the policy arena adds another layer of complexity. Lawmakers continue to debate a digital asset market structure that could govern stablecoins, yield-bearing tokens, and tokenized equities. While the CLARITY Act has flowed through various chambers, its path in the Senate remains uncertain, and recent statements from Senate leadership suggested a focus on voting requirements rather than a comprehensive market-structure bill in the near term. In this environment, traders and users may react to on-chain data and market sentiment independently of how quickly lawmakers move on the regulatory front.
From a market perspective, the contrast between volume leadership and market capitalization is not merely a curiosity; it shapes how ecosystem participants allocate capital and design services. Exchanges and wallets perspective that favor stablecoin liquidity for payments could prioritize integration with USDC’s rails if the usage trend endures, while liquidity providers still rely on USDT for broad market depth. The net effect for users could be a more diverse stablecoin landscape where multiple tokens compete on reliability, ease of use, and the breadth of acceptance by merchants and platforms.
In sum, Mizuho’s data points to a period of evolving usage patterns among the stablecoins that anchor much of the crypto economy. The fact that a Circle-backed token is capturing a larger share of on-chain volume signals a potential shift in user preference for stability in routine transactions. As policymakers weigh structural reforms and market participants adjust to new usage realities, the next several quarters will reveal whether this shift solidifies or whether the market rebalances toward a broader mix of stablecoins for settlement and payments. For readers following the crosscurrents of price, volume, and policy, the evolving picture remains a critical lens on how the crypto economy is mutating beyond headline market caps.
Crypto World
Best Crypto to Buy Now: Pepeto Becomes The Top Choice For Trader as Trump Ends War and Bitcoin Reclaims $70K

Trump declared victory in the Iran conflict, Bitcoin surged past $72,000, and the search for the best crypto to buy now intensified overnight. Spot Bitcoin ETFs pulled $568 million in a single week according to Coinfomania, ending a four month outflow streak, and the rotation into high upside positions has already begun.
Best Crypto to Buy Now: Trump Ends War and Capital Rotates Into Pepeto
As crypto.news reported, Trump declared the US won through Operation Epic Fury, and analysts say clearing $72,500 could trigger a broader rally.
Understanding the opportunity means understanding why the best crypto to buy now is not a large cap waiting to recover, it is the presale that already built the infrastructure before the bull run arrives.
Pepeto: The Best Crypto to Buy Now for Traders Who Refuse to Miss This Cycle
Trying to find the best crypto to buy now can be overwhelming, especially when every chart is red and every headline contradicts the last. Tracking whale movements, liquidity shifts, and which projects actually deliver versus which ones disappear after listing is exhausting even for experienced traders. Pepeto was built to solve exactly that problem by giving every investor access to an exchange where the tools do the heavy lifting.
PepetoSwap is an intelligence layer for the entire market. Zero fee swaps across Ethereum, BNB Chain, and Solana from one platform, a cross chain bridge routing tokens between networks without cost, and AI risk screening that evaluates every contract before capital touches it. All of that feeds into one exchange that removes the guesswork and replaces it with infrastructure traders will use every single day.

The exchange went live for stress testing and handled real volume without issues, giving Pepeto an edge over every project still promising features on a roadmap. The presale has seen 190% growth in wallet participation over the past month, and early investors understand that the utility itself is what will attract volume the moment the listing arrives.
Pepeto is still at presale pricing of $0.000000186, which leaves massive room for the kind of growth that only exists before the public market opens. Over $7.9 million raised during fear conditions, SolidProof audited codebase, the $7 billion Pepe ecosystem cofounder leading the build, a former Binance executive on the advisory board, and 199% APY staking compounding daily. Revenue sharing sends permanent income from every exchange trade to presale wallets.
The Binance listing is approaching and once it arrives, this presale entry disappears and never returns. That is why Pepeto is the best crypto to buy now for investors who recognize that the window between presale and listing is where the real wealth in crypto has always been created.
IMPORTANT: Many fraudulent sites are trying to mislead investors using Pepeto’s name. Only purchase through the Pepeto official website. Verify the domain carefully before connecting any wallet.
XRP and Solana Are Not the Best Crypto to Buy Now at These Market Caps
XRP sits at $1.42 according to CoinMarketCap, down 62% from its $3.66 all time high despite Ripple launching a $750 million buyback valuing the company at $50 billion. Futures open interest remains 80% below the peak. Solana trades at $90.90, down 63% from $237 in November 2025, with Goldman Sachs holding $107 million in SOL ETFs but price action refusing to respond.
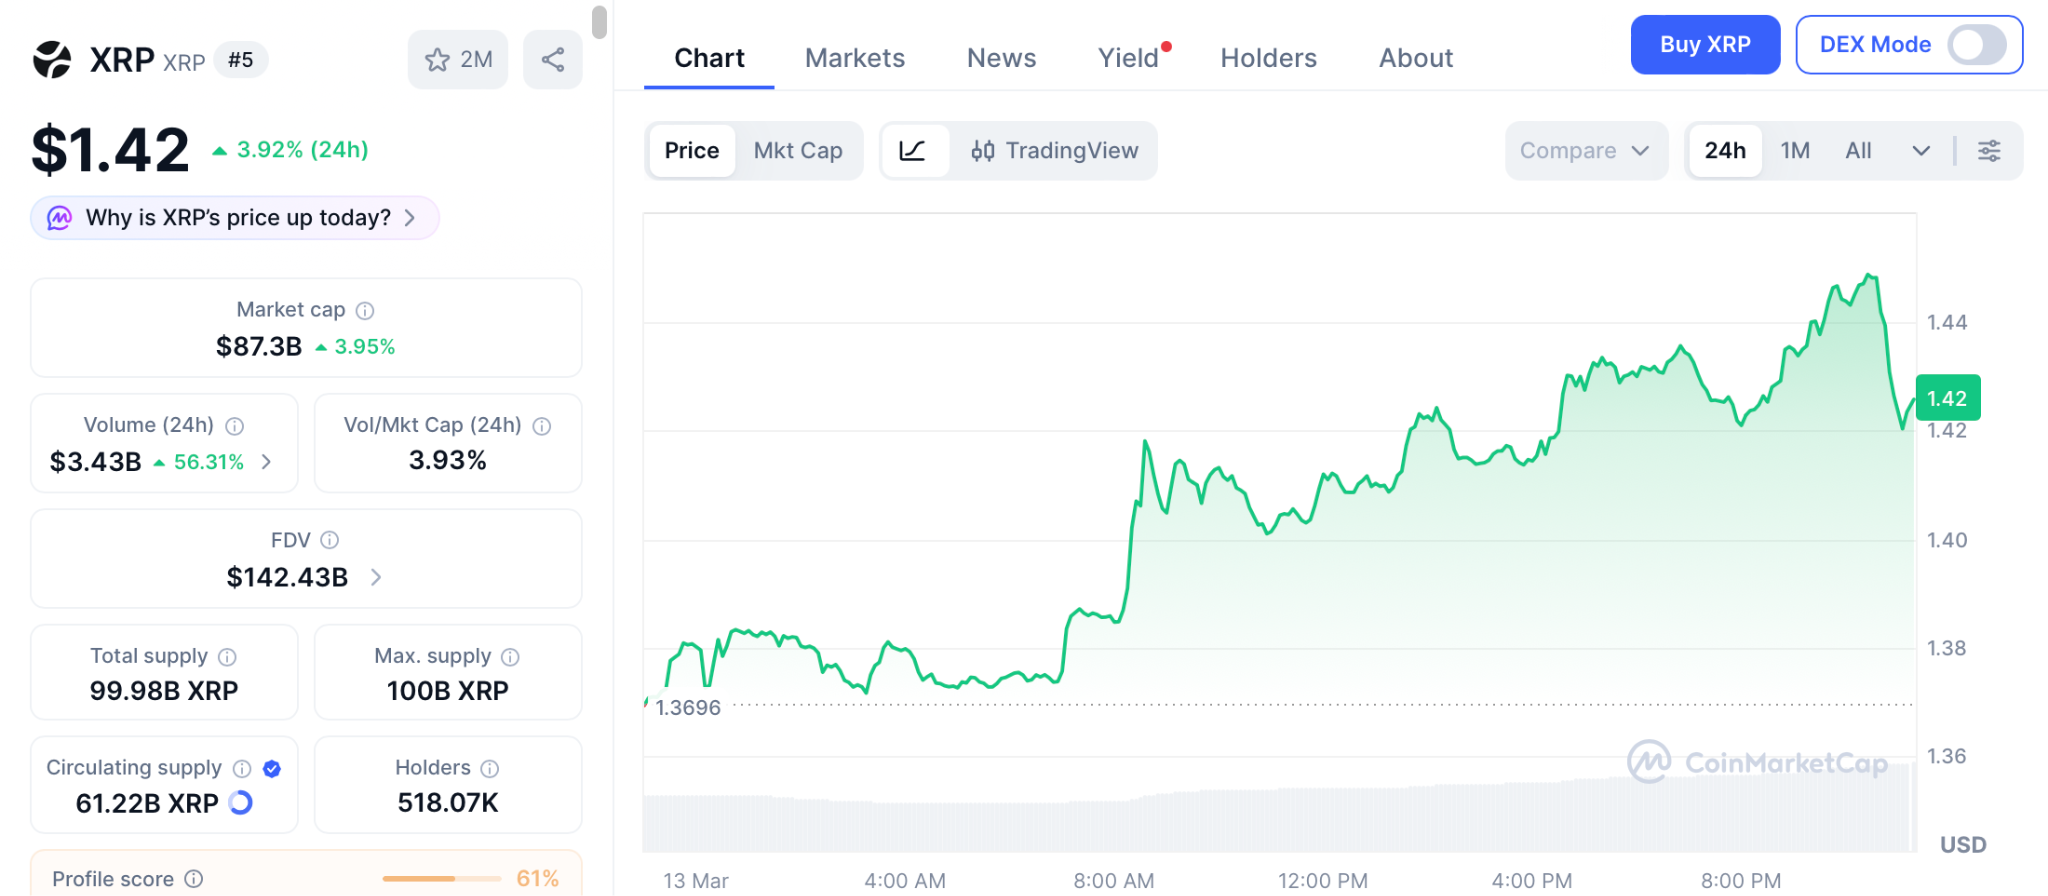
Both are real assets with institutional backing, but at these market caps the returns are incremental, and the best crypto to buy now for life changing multiples is at presale pricing, not recovery pricing.
Conclusion
Every cycle teaches the same lesson: the investors who build wealth in crypto are not smarter than everyone else, they just act without hesitation when the opportunity is still open. Crypto is the most rewarding asset class in the world but that same speed makes the best entries disappear in days not months.
XRP and Solana both point higher, but the best crypto to buy now is Pepeto, sitting at presale price with PepetoSwap about to go live and the kind of demand that only forms when serious potential is behind a project.
Once the listing arrives this price level stops existing permanently, and the investors who waited will spend this cycle watching the wallets that moved today collect what could have been theirs. Visit the Pepeto official website and decide which side of that outcome belongs to the wallets that act now.
Click To Visit Pepeto Website To Enter The Presale

FAQs
What is the best crypto to buy now in 2026?
The best crypto to buy now is Pepeto with $7.9 million raised, a SolidProof audited exchange, a $7 billion cofounder, 199% APY staking, and permanent revenue sharing at presale pricing before the Binance listing.
Will XRP recover to its all time high?
XRP at $1.42 is down 62% from $3.66 with futures open interest 80% below the peak, and while Ripple secured regulatory wins the returns at this market cap are modest compared to presale entries.
Disclaimer: This is a Press Release provided by a third party who is responsible for the content. Please conduct your own research before taking any action based on the content.
Death in Paradise confirms Gary Wilmot’s return in tense murder plot

'We're not profiteering on fuel. But my staff still face abuse'

French Hill says CLARITY Act could fix gaps left by GENIUS Act


-

 News Videos4 days ago
10th Algebra | Financial Planning | Question Bank Solution | Board Exam 2026
-
 Tech3 days ago
A 1,300-Pound NASA Spacecraft To Re-Enter Earth’s Atmosphere
-

 Crypto World4 days ago
Paradigm, a16z, Winklevoss Capital, Balaji Srinivasan among investors in ZODL
-

 Business3 days ago
ExxonMobil seeks to move corporate registration from New Jersey to Texas
-

 Tech3 days ago
ChatGPT will now generate interactive visuals to help you with math and science concepts
-

 Sports6 days ago
Three share 2-shot lead entering final round in Hong Kong
-

 Sports6 days ago
Braveheart Lakshya downs Lai in epic battle to enter All England Open final | Other Sports News
-

 NewsBeat2 days ago
Residents reaction as Shildon murder probe enters second day
-

 Fashion5 hours ago
Weekend Open Thread: Addict Lip Glow
-

 Entertainment7 days ago
Hailey Bieber Poses For Sexy Selfies In New Luscious Lip Thirst Traps
-

 Business5 days ago
Search for Nancy Guthrie Enters 37th Day as FBI Probes Wi-Fi Jammer Theory
-

 Business3 days ago
Search Enters Sixth Week With New Leads in Tucson Abduction Case
-
 NewsBeat4 days ago
Pagazzi Lighting enters administration as 70 jobs lost and 11 stores close across Scotland
-

 Tech4 days ago
Despite challenges, Ireland sixth in EU for board gender diversity
-

 Business4 days ago
Search Enters 39th Day with FBI Tip Line Developments and No Major Breakthroughs
-

 NewsBeat2 days ago
I Entered The Manosphere. Nothing Could Prepare Me For What I Found.
-

 Business7 days ago
Iran war enters second week as Trump demands ’unconditional surrender’
-

 Sports5 days ago
Skateboarding World Championships: Britain’s Sky Brown wins park gold
-

 Crypto World3 days ago
Will Chainlink price reclaim $10 amid volatility squeeze?
-

 Sports5 days ago
Tomorrow’s Top 25 Today: Florida jumps to No. 4; Louisville, Wisconsin enter projected rankings