

Crypto World
USDC Overtook USDT in Adjusted YTD Volume, Says Mizuho
Analysts at Mizuho say a shift in stablecoin usage is underway, with a Circle-issued dollar-pegged token appearing to surpass its main rival in on-chain transaction volume for the first time since 2019. In a Friday research note, the bank highlighted year-to-date adjusted volumes of about $2.2 trillion for the Circle-backed stablecoin against roughly $1.3 trillion for the Tether-backed option, signaling a move toward routine payments rather than just crypto trading. The report also notes that the Circle-backed coin claims about 64% of the combined turnover between the two, reversing a long-running pattern in which the Tether-backed token led on volume. Circle’s public listing on the NYSE in June 2025 drew attention, though the initial price reaction was muted. By market cap terms, the Tether-backed stablecoin remains dominant, with approximately $184 billion in circulation compared to about $79 billion for its Circle-backed rival.
Key takeaways
- The Circle-backed stablecoin surpassed the Tether-backed counterpart in on-chain transaction volume for the year to date, underscoring a shift toward stablecoins used for everyday payments rather than speculative activity.
- Adjusted volumes show Circle’s token at about $2.2 trillion versus roughly $1.3 trillion for Tether’s stablecoin, translating into a 64% market share for Circle’s offering within the two assets’ daily activity.
- Despite the volume leadership, Tether’s stablecoin remains larger in terms of market capitalization, with around $184 billion in circulating supply versus about $79 billion for Circle’s stablecoin.
- Circle’s stock began trading on the NYSE in June 2025, and the initial move after the IPO was modest, indicating a separation between on-chain usage dynamics and traditional equity performance.
- Policy and regulatory hurdles in the United States continue to shape stablecoin discussions, with lawmakers weighing a digital asset market framework even as debates over stablecoin yield and tokenized equities persist.
Tickers mentioned: $USDC, $USDT
Sentiment: Neutral
Price impact: Neutral. The report highlights a shift in usage patterns rather than immediate price movements, with market capitalization remaining skewed toward the Tether-backed stablecoin.
Market context: The findings come as the broader crypto market contends with liquidity dynamics and ongoing regulatory discussions in Washington over stablecoins and market structure, illustrating how on-chain activity and regulatory policy can diverge in the near term.
Why it matters
The potential migration of everyday transactions toward a Circle-backed stablecoin could recalibrate how participants fund wallets, settle micro-payments, and bridge assets across networks. If a stablecoin gains traction as the preferred medium for routine exchanges, its on-chain liquidity profile, settlement efficiency, and interoperability across exchanges and wallets could influence funding costs and user experience. Yet the distinction between on-chain transaction volume and market capitalization remains pronounced: even with higher volumes, USDT continues to dominate in overall supply and market depth, which matters for liquidity when markets swing or during large withdrawals.
For builders and exchanges, the volume shift flags a possible reallocation of demand toward a different stability mechanism or settlement rails. Protocols that rely on stablecoin liquidity for cross-chain liquidity provision, automated market makers, and DeFi lending could feel the impact of changing user preferences. Regulators, meantime, watch and weigh how stablecoins interact with yield, compliance, and consumer protection norms as they craft potential standards for a broader digital asset framework.
The data also highlights how headline market capitalizations may diverge from real-world usage metrics. A stablecoin can be widely used for payments and remittances even if its nominal market cap remains smaller than that of a rival. In this case, the Circle-backed token’s stronger daily turnover suggests broader acceptance in payments corridors, merchant integrations, and cross-border settlements, while Tether’s larger capitalization preserves its role as a liquidity backbone. The coming quarters will reveal whether the usage trend persists or whether market forces re-balance these two pillars of the stablecoin ecosystem.
As part of the broader narrative, policymakers continue to weigh a structured framework for digital assets, including debates over stablecoin yield and tokenized equities. The CLARITY Act, which previously moved through parts of Congress, has faced hurdles in the Senate, where leaders indicate a priority on voting requirements rather than immediate market-structure reforms. These political dynamics create a backdrop in which on-chain metrics may diverge from regulatory momentum, making immediate price or allocation signals less predictable than the underlying activity data might suggest.
For readers tracking the big-picture trajectory, the divergence between on-chain activity and market capitalization can be telling. The shift toward a more transaction-focused usage pattern does not necessarily translate into an immediate re-rating of the asset’s value, but it does imply a growing role for a Circle-backed stablecoin in daily payments and merchant settlement. Investors and users should monitor whether this usage trend endures as merchant adoption, cross-border flows, and DeFi integrations evolve in parallel with regulatory developments.
To contextualize these movements, a separate data point underpins the narrative: Circle’s public listing on the NYSE in June 2025. While the IPO event catalyzed attention around the governance and corporate side of the ecosystem, the market reaction to the volume shift remains a separate thread, underscoring how on-chain dynamics can outpace traditional equity performance in this rapidly evolving space. The ongoing conversation around stablecoins—how they yield, how they are regulated, and how tokenized instruments may coexist—will continue to shape liquidity, risk appetites, and product design across the crypto ecosystem.
For a direct look at the discussion around USDC, USDT, and their evolving roles, readers can explore the linked materials, including deep-dive notes and index references that track price and circulation metrics over time. A video discussion related to the topic is available here: Video discussion on stablecoin dynamics.
What to watch next
- Upcoming quarterly volume disclosures for USDC and USDT to confirm whether the 64% share persists into the next data cycle.
- Progress on the CLARITY Act or alternative US digital asset market framework bills in Congress and any votes scheduled in the Senate.
- Shifts in market capitalization versus on-chain usage, including any notable changes in the size of each stablecoin’s circulating supply.
- Broader regulatory guidance on stablecoin yield, ethics, and tokenized equities and how those will impact issuer strategies.
Sources & verification
- Mizuho research note comparing transaction volumes between Circle-backed USDC and Tether-backed USDT, including the 64% market-share figure and the $2.2 trillion vs $1.3 trillion volume comparison.
- Circle stock listing on the NYSE in June 2025 and subsequent price action.
- Price index references for USDC (CRYPTO: USDC) and USDT (CRYPTO: USDT) as cited in price-tracking discussions.
- US Senate discussions around the CLARITY Act and related market-structure debates affecting stablecoins, including notes about voting-priority scheduling in the Senate.
Stablecoin usage shifts and the on-chain volume race
The latest data from a major investment bank captures a pivotal moment in stablecoin dynamics. The Circle-issued stablecoin (CRYPTO: USDC) appears to have overtaken its Tether counterpart (CRYPTO: USDT) in on-chain transaction volume for the year to date, marking a departure from a multi-year pattern in which USDT led most volume metrics. The bank’s analysis shows USDC posting about $2.2 trillion in adjusted year-to-date volume, while USDT sits around $1.3 trillion. With these figures, USDC has captured roughly 64% of the combined turnover between the two entities, signaling a shift toward stablecoins as day-to-day payment rails rather than merely a liquidity layer for whales and traders.
The juxtaposition of high transaction activity with market capitalization also tells an important story. While USDC is catching up in usage, USDT retains a commanding head start in global supply, boasting a market capitalization near $184 billion compared with USDC’s roughly $79 billion. This divergence underscores a broader theme in crypto markets: usage and liquidity can outpace capitalization when user adoption and merchant integration expand. The leadership in on-chain volume does not automatically translate into price or market-share dominance, but it does illuminate where real-world activity is concentrated and where demand for stable value storage is coalescing.
The discussion around stablecoins in the policy arena adds another layer of complexity. Lawmakers continue to debate a digital asset market structure that could govern stablecoins, yield-bearing tokens, and tokenized equities. While the CLARITY Act has flowed through various chambers, its path in the Senate remains uncertain, and recent statements from Senate leadership suggested a focus on voting requirements rather than a comprehensive market-structure bill in the near term. In this environment, traders and users may react to on-chain data and market sentiment independently of how quickly lawmakers move on the regulatory front.
From a market perspective, the contrast between volume leadership and market capitalization is not merely a curiosity; it shapes how ecosystem participants allocate capital and design services. Exchanges and wallets perspective that favor stablecoin liquidity for payments could prioritize integration with USDC’s rails if the usage trend endures, while liquidity providers still rely on USDT for broad market depth. The net effect for users could be a more diverse stablecoin landscape where multiple tokens compete on reliability, ease of use, and the breadth of acceptance by merchants and platforms.
In sum, Mizuho’s data points to a period of evolving usage patterns among the stablecoins that anchor much of the crypto economy. The fact that a Circle-backed token is capturing a larger share of on-chain volume signals a potential shift in user preference for stability in routine transactions. As policymakers weigh structural reforms and market participants adjust to new usage realities, the next several quarters will reveal whether this shift solidifies or whether the market rebalances toward a broader mix of stablecoins for settlement and payments. For readers following the crosscurrents of price, volume, and policy, the evolving picture remains a critical lens on how the crypto economy is mutating beyond headline market caps.

Bitcoin’s brief jump above $73k shows bulls still in control, but Iran war risks, oil shocks and crowded leverage leave BTC vulnerable to a violent flush.
Summary
- Bitcoin price reclaimed the $73k area as global risk assets bounced despite ongoing Iran war headlines and oil market stress.
- Derivatives data show rising funding, packed longs and whale leverage on BTC and ETH, primed for cascade liquidations if momentum stalls.
- With Iran threatening shipping and higher oil, traders are shifting to tighter stops, staged profit‑taking and options hedges into late‑cycle volatility.
Bitcoin (BTC) price briefly cleared the $73,000 mark in the last trading session, signaling the current bullish phase is intact but leverage and positioning are now approaching blow‑off conditions.
Bitcoin breaks above $73K as risk appetite returns
Bitcoin pushed above $73,000 in the past 24 hours, gaining around 4% and extending its march to new all‑time highs against a backdrop of renewed risk appetite in global markets. This move comes as US equities continue to trade near record levels and traders maintain expectations for at least one Federal Reserve rate cut before year‑end, keeping liquidity conditions supportive for high‑beta assets such as BTC. On major derivatives venues, funding rates and open interest have been grinding higher, reflecting aggressive long positioning rather than spot‑led demand.
The latest leg higher follows weeks of sustained inflows into Bitcoin exchange‑traded products and centralized exchanges, with market depth still thinner than in prior cycles despite the larger nominal price. That combination of rising leverage and limited resting liquidity leaves the market vulnerable to sharp liquidations if price momentum stalls or macro data surprise to the upside on inflation.
Leverage and whale positioning intensify
Onchain and derivatives‑tracking dashboards show that a handful of large traders have materially increased risk into the breakout, using double‑digit leverage on both BTC and ETH. One heavily watched account has built sizeable long positions on Ethereum with leverage around 15x, echoing similar high‑stakes trades reported in prior ETH rallies in 2025 that at times exceeded 25,000 ETH notional and over $100 million in exposure. While the current configuration differs in size and entry levels, the underlying dynamic is the same: concentrated players are amplifying upside moves, but also raising the risk of cascade liquidations if the market reverses.
In parallel, research firm Trend Research and its affiliates have repeatedly moved large ETH tranches between self‑custody, lending protocols and centralized exchanges in recent weeks, including deposits and withdrawals in the tens of thousands of ETH and tens to hundreds of millions of dollars in value. These flows underline how a small group of funds can influence short‑term liquidity and sentiment when Bitcoin tests new highs and investors chase beta down the risk curve.
What this means for traders
For directional traders, Bitcoin reclaiming and holding above the $70,000–$73,000 band confirms that the primary trend remains intact, but it also suggests that risk management now matters more than raw conviction. Elevated open interest, richer funding rates and large whale leverage all point to a market that can overshoot higher but will unwind violently on any macro or regulatory shock.
From a portfolio‑construction perspective, professional desks are likely to favor staggered profit‑taking on strength, tighter stop‑losses on high‑leverage BTC and ETH longs, and increased use of options to hedge downside tails while keeping upside participation. Retail investors chasing the breakout should be aware that the easy part of the move is probably behind, and that late‑cycle volatility around psychological levels like $75,000 and $80,000 historically separates disciplined participants from forced sellers.
Ethereum price surges as derivatives open interest jumped nearly 9% to above $30b, concentrating leverage on Binance, Gate, Bybit and OKX and priming Ethereum for sharper liquidations.
Summary
- Ethereum derivatives open interest climbed about 9% in 24 hours to roughly $30.4b, tracking Ethereum above $2,180.
- Binance, Gate, Bybit and OKX now hold most ETH OI, raising spillover risk if one venue sees a funding squeeze or outage.
- Rising OI with higher prices signals a reflexive setup: further gains could richen funding, while any stall may trigger fast deleveraging.
Ethereum (ETH) derivatives just lit up. Here’s a clean crypto.news-style piece on the ETH open interest story, using $ not “dollar.”
ETH derivatives open interest has jumped nearly 9% in 24 hours, pushing total ETH contract exposure above $30 billion and underscoring how fast leverage is building behind the latest leg of the rally.
ETH open interest climbs as traders add leverage
According to derivatives tracker Coinglass, total ETH contract open interest has increased by 8.94% over the past 24 hours, with aggregate open interest now at $30.451 billion across major exchanges. Binance leads with $6.593 billion in ETH OI, followed by Gate at $3.875 billion, Bybit at $2.358 billion, and OKX at $2.042 billion. The move comes as ETH trades above $2,180 and tracks Bitcoin’s push into fresh all‑time highs, drawing in both speculative longs and basis traders.
The pace of growth in ETH open interest mirrors similar spikes seen in late February, when Ethereum derivatives OI rose between 7% and 14% in a single day as traders positioned around key resistance and ETF narratives. Each of those prior expansions in open interest preceded periods of elevated intraday volatility, as crowded positions were tested by relatively small spot flows.
Market structure: more size, more sensitivity
With more than $30 billion now tied up in ETH futures and perpetuals, relatively minor price moves can trigger meaningful liquidation flows. Recent Coinglass data shows that when open interest in ETH contracts has sat in the mid‑20s to high‑20s billions range, subsequent 24–48 hour windows often featured sharp wipe‑outs as funding flipped and over‑levered longs or shorts were forced out.
Exchange concentration also matters. Binance, Gate, Bybit, and OKX have repeatedly accounted for the bulk of ETH derivatives risk in recent months, with Binance alone often carrying more than $5 billion in ETH OI. That clustering means that any sudden funding squeeze, outage, or large liquidation event on one of these venues can spill quickly into spot books and cross‑exchange pricing.
What traders should watch next
For short‑term ETH traders, the combination of rising open interest and higher spot prices typically signals a more reflexive environment: price drives positioning, and positioning in turn drives price. If ETH continues grinding higher with OI expanding, funding rates and basis are likely to richen, creating both carry opportunities and greater downside risk if the trade becomes too crowded.
If, instead, OI starts to roll over while price stalls or pulls back, that would indicate aggressive deleveraging and could mark a local top or a reset phase similar to prior episodes where ETH contract open interest dropped 4–6% in a day. In both cases, the key tells will be funding, liquidation clusters, and whether open interest continues to climb above the $30 billion mark or snaps back toward the mid‑20s.
Crypto World
DeepSnitch AI Bonus: Hurry Up, Only a Few Days Left! The Bull Run Every Trader Has Been Waiting For Finally Has a Starting Gun

Oil almost touched $100 this week after tensions around the Strait of Hormuz sparked a macro panic. Stocks sold off and macro Twitter went into meltdown mode. Then, US Treasury Secretary Scott Bessent stepped in with a temporary license allowing countries to buy Russian oil already stranded at sea, calling the spike a short-term disruption. Oil dropped quickly, and crypto reacted fast.
Bitcoin pushed close to $72,000 with strong ETF inflows and continued accumulation from major buyers. The dollar also weakened, which is exactly the kind of macro setup that usually fuels risk assets.
The macro setup that every trader has been waiting for is building exactly the way the textbook says it should, and the Deepsnitch AI bonus codes are still live, but not for long. Here’s why you should hurry up ahead of the launch.

BTC jumps to $72K after Bessent kills the oil scare
Treasury Secretary Scott Bessent stepped into a market that was panicking about oil racing toward $100 a barrel and cooled things down fast. Iran’s new supreme leader had said the Strait of Hormuz would stay closed, and Donald Trump said stopping Iran mattered more than oil prices, which sent equities sliding and macro Twitter into full panic mode.
Then Bessent announced General License 134, a temporary move allowing countries to buy Russian oil that was already stuck at sea. He called the spike a short-term disruption and said the economy could actually benefit once things settle. Oil quickly dropped about $2 a barrel, and Bitcoin jumped close to $72,000 within hours while stocks were still trying to catch up.
This is what the setup looks like right before a sustained bull move starts: macro fear gets resolved faster than expected, institutional buying was already happening before the resolution, and the Deepsnitch AI bonus countdown is ticking in the exact window when new capital starts looking for the highest-asymmetry entries it can still access before the crowd arrives.
Three positions to load before this window shuts: $DSNT, BTC and ETH
1. The DeepSnitch AI bonus still live! Hurry up, only a few days left!
If you are still sitting on the sidelines reading about the Deepsnitch AI bonus and not positioning, this section is your last clear-headed moment before FOMO kicks in at the Uniswap listing price.
$DSNT is the only presale in this market where five AI security tools are already live and working for traders every single day at $0.04399 before the ground floor closes.
AuditSnitch scans any smart contract in seconds and risk-scores it before you sign anything. SnitchGPT handles your on-chain research with real market context, so you are not walking into positions based on vibes and influencer threads.
SnitchFeed streams whale wallet activity and volume anomalies in real time, so you see the move before the chart confirms it and before retail gets trapped. Token Explorer gives you full holder concentration, liquidity depth, and risk scoring on any token before you commit a dollar.
SnitchCast keeps your market read sharp and current without building your own research stack from scratch. Coinsult and SolidProof have both independently audited the smart contract, and $2 million has already been raised with up to 300% bonuses still active.
If the bull case sends $DSNT to $30, this is the type of trade that creates serious wealth. This is a crypto presale ending soon situation with zero wiggle room because March 31 is the date and there is no extension coming.
2. Bitcoin (BTC) update for March 2026
BTC is currently trading around $72,000 on March 13 after recovering from the $63,000 to $64,000 range that defined February’s fear cycle, and the setup underneath it right now is the strongest it has been since Q4 2025 when BTC hit its all-time high of $126,000.
The 2026 bull target sits at $200,000, and the majority of analyst consensus clusters between $120,000 and $150,000 for the cycle high. BTC will not give you 100x from here. But as a store-of-value position running alongside a presale like $DSNT that is still in its final days of token presale window, BTC is the safest way to make sure you have exposure to the broad market recovery without having to time an altcoin rotation correctly.
3. Ethereum (ETH) update for March 2026
ETH reclaimed $2,000 this week and is currently trading around $2,100 on March 13 after spending the past several months in a brutal drawdown from its $4,105 ATH in December 2024.
The current entry is sitting 50% below the all-time high, with the Pectra upgrade scheduled for Q1 to Q2 2026.
The 2026 ETH high target sits at $6,000, and the most bullish analyst projections reach $10,000 to $15,000 in the supercycle case.
The upside math is still a 3x to 5x from here in the base case. That is a good trade, but it is not the same as DeepSnitch AI.
DeepSnitch AI bonus code: Hurry up, only a few days left before launch!
Bessent just gave the market a macro green light by capping oil at $100, BTC responded by jumping to $72K with ETF inflows running for three straight weeks, and the bull run setup that serious traders have been positioning for all year is starting to look a lot more like the real thing.
BTC and ETH are the right plays for traders who want cycle exposure with lower volatility and a clear path to 3x to 5x from current levels. But the Deepsnitch AI bonus is for the traders who want the move that makes the BTC chart look boring in comparison.
$DSNT at $0.04399 with five live tools, dual audits, 41.4M staked coins, and a 150% bonus on $10K-plus entries is the final days token presale setup that closes March 31 and never reopens at this price.
Visit the official DeepSnitch AI website and lock in your $DSNT before the deadline. Join X and Telegram community to catch the listing announcement drop.
FAQs
What exactly is the Deepsnitch AI bonus and does the deadline actually move?
The Deepsnitch AI bonus deadline is March 31 and the team has confirmed zero extension. It is a crypto presale ending soon situation with up to 300% bonuses that disappear the moment the presale closes.
Is the limited-time crypto bonus on DSNT worth stacking alongside BTC at $72K and ETH at $2,100 right now?
BTC and ETH are solid cycle plays, but a 3x to 5x is the realistic ceiling from current prices. The limited-time crypto bonus of up to 300% on $DSNT at $0.04399 puts tokens in your wallet for free.
Why is the final days token presale window on $DSNT more urgent than waiting for a discount after the Uniswap listing?
There is no discount after the listing. The final days token presale price of $0.04399 could be the floor that never returns. Every AI infrastructure token from TAO to RENDER listed above presale and never looked back. This is the last entry at ground floor and it is closing on March 31.
Disclaimer: This is a Press Release provided by a third party who is responsible for the content. Please conduct your own research before taking any action based on the content.

Ether (ETH) traded about 30% below its yearly open of $2,990, as traders grow increasingly risk-averse amid a global conflict and macroeconomic uncertainties.
Still, stronger network usage and increasing inflows into ETH accumulation addresses could provide a spark that may see the price finally break $2,200 resistance.
Key takeaways:
-
ETH held in accumulation wallets has risen 32% since January, showing strong long-term confidence.
-
Staked ETH reaches a record 37.85 million, representing over 30% of supply.
-
Analysts say Ether bulls must reclaim $2,200 as support
6.5 million ETH increase in accumulation addresses
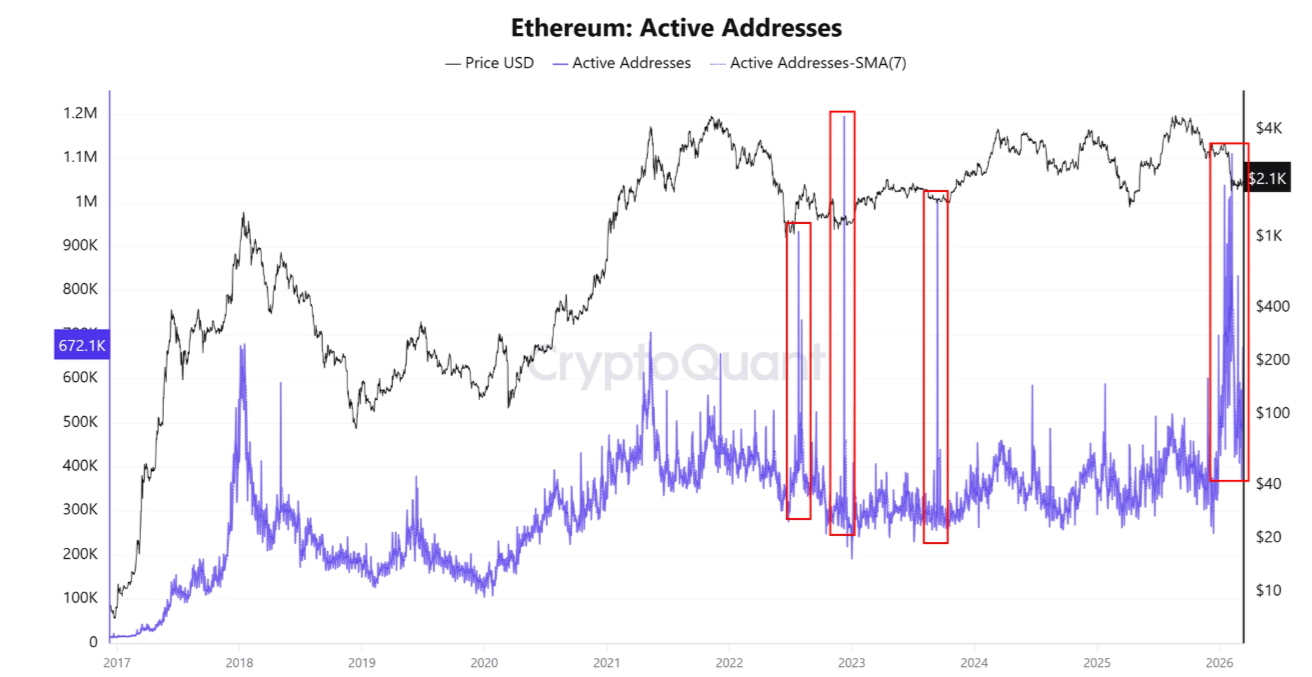
Although Ether’s price has fallen in 2026, network activity increased, with daily active addresses (DAA) rising to 1.1 million in February, the highest level since December 2022. The DAAs jumped by 80% to 672,170 from 370,390 in the past seven days.
“The increase in ETH active addresses indicates bullish market movements,” CryptoQuant analyst CW8900 said in a QuickTake note on Friday.
The chart below shows that activity increased most significantly after Ether’s recent drop below $2,000.
“This implies that accumulation activity was at its most active,” the analyst added.

Similar activity has been consistently observed near macro bottoms since 2022, preceding significant ETH price rallies.
Additionally, daily inflows into accumulation addresses have increased steadily since mid-2025, reaching a record high of 1.14 million ETH in November 2025. The inflows have continued to climb in 2026, averaging 200,000 ETH per day, with a spike to over 350,000 on Thursday.
As a result, the amount of ETH held in accumulation wallets, or holders with no history of selling, has increased by 6.5 million to 26.55 million from 20.1 million on Jan. 1, representing a 32% increase.
The ETH supply held in accumulation addresses is an important indicator for traders and market participants, as it reflects overall confidence in Ether’s long-term outlook.

The total value of ETH staked further reinforces this outlook. The supply of staked Ether reached an all-time high of 37.85 million this week, signaling growing investor confidence and a squeeze on the liquid supply. This represents over 30% of the total ETH supply.

A growing staked supply also indicates that a large percentage of investors are preparing to hold their ETH for longer.
As Cointelegraph reported, Ether supply held on exchanges fell to a new multi-year low of 3.46 million ETH, further tightening the available liquidity on the order books.
Ether price needs to flip $2,200 into support
Data from TradingView shows ETH attempting to breach the $2,100-$2,200 resistance that has suppressed its price over the last month.
“This has been an important price area over the past couple of years of price action for Ethereum,” analyst Daan Crypto Trades said in a recent X post.
The last time the ETH/USD pair reclaimed this level was in May 2025. It rallied 24% in less than a week. In June 2025, it served as a launchpad for a 126% ETH price rally to the current all-time high of $4,950 reached in August 2025.

A key area to watch on the downside is $1,750-$1,850, which, if lost, could extend the downtrend to as low as $1,000.
“I assume that when this breaks either side of the range, we will see a large move occur,“ Daan Crypto Trades added.
This support area coincides with an ascending trend line that has upheld the price on the weekly chart since 2022.
Technical analyst Prof said holding this support would then trigger a retest of the 21-week exponential moving average at $2,700, 22% above the current price.

As Cointelegraph reported, a decisive break above the $2,100 resistance and the 50-day EMA at $2,200 will have the bulls target $2,600 next.
This article does not contain investment advice or recommendations. Every investment and trading move involves risk, and readers should conduct their own research when making a decision. While we strive to provide accurate and timely information, Cointelegraph does not guarantee the accuracy, completeness, or reliability of any information in this article. This article may contain forward-looking statements that are subject to risks and uncertainties. Cointelegraph will not be liable for any loss or damage arising from your reliance on this information.
Crypto World
BTC Rejected at $74K Amid Rising Middle East Tensions, BlackRock’s ETHB Debuts: Weekly Recap
BTC experienced some intense volatility on Friday after the release of the US PCE data. However, its rally was quickly halted.
It was another eventful week, with the headlines strongly focused on the quickly developing (and, in most cases, worsening) situation in the Middle East as both sides continue to hit each other, or allies.
In the meantime, the ever-volatile cryptocurrency industry responds to almost all new developments. Bitcoin, for example, started the week on the wrong foot, slipping from $68,000 on Sunday to a multi-day low of $65,600 when almost all financial markets opened for trading after the strikes and statements during the weekend.
However, the bulls were quick to intervene and didn’t allow further decline. Instead, BTC began its gradual recovery, which saw it near $70,000 by Wednesday. After the initial rejection, the bulls stepped up and pushed the asset to almost $72,000. It faced more resistance at this level and returned to $69,000 when the US CPI numbers came out later that day.
Although expectations and reality met, BTC remained relatively calm at first, but jumped by nearly two grand later on after Trump said there’s “practically nothing left to target” in Iran. Following another volatile session around $70,000, the cryptocurrency went on the offensive on Friday after the release of the US PCE data for January. which showed a 0.3% MoM increase, and a 2.8% YoY rise.
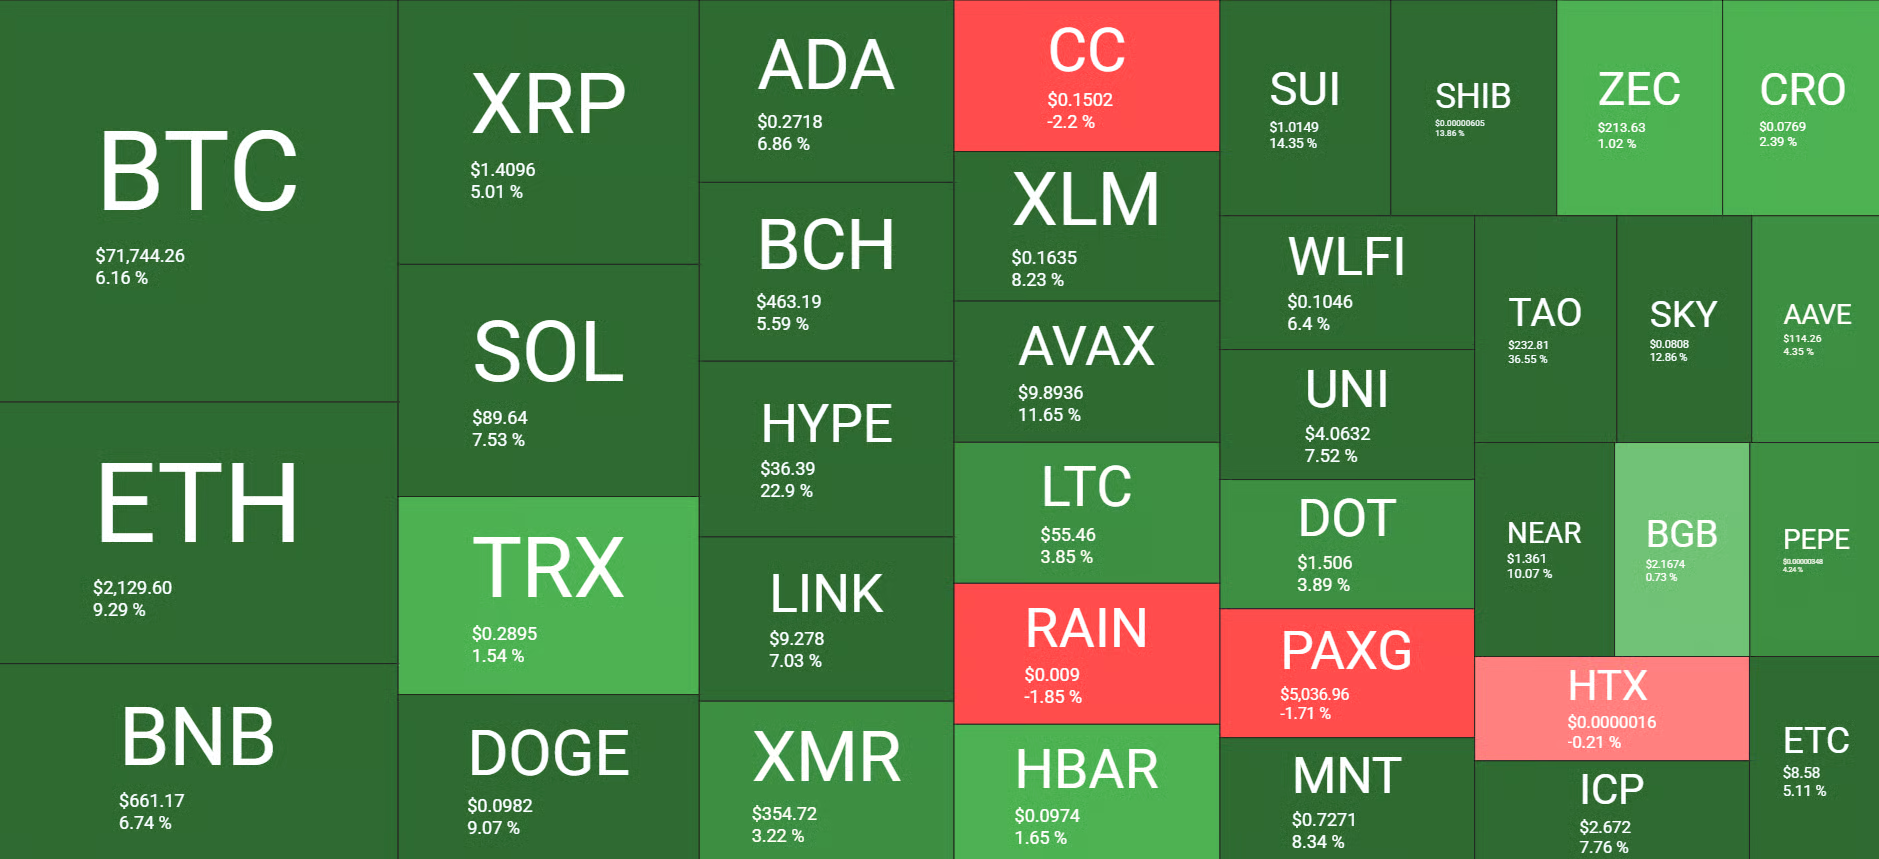
Bitcoin tapped $74,000 for the second time in the past 10 days, but it was stopped once again and driven south by over two grand. Nevertheless, it’s still 6% up weekly, similar to BNB, XRP, and SOL. Ethereum has added almost 10% in the past seven days, while HYPE has exploded by 23%.
Market Data
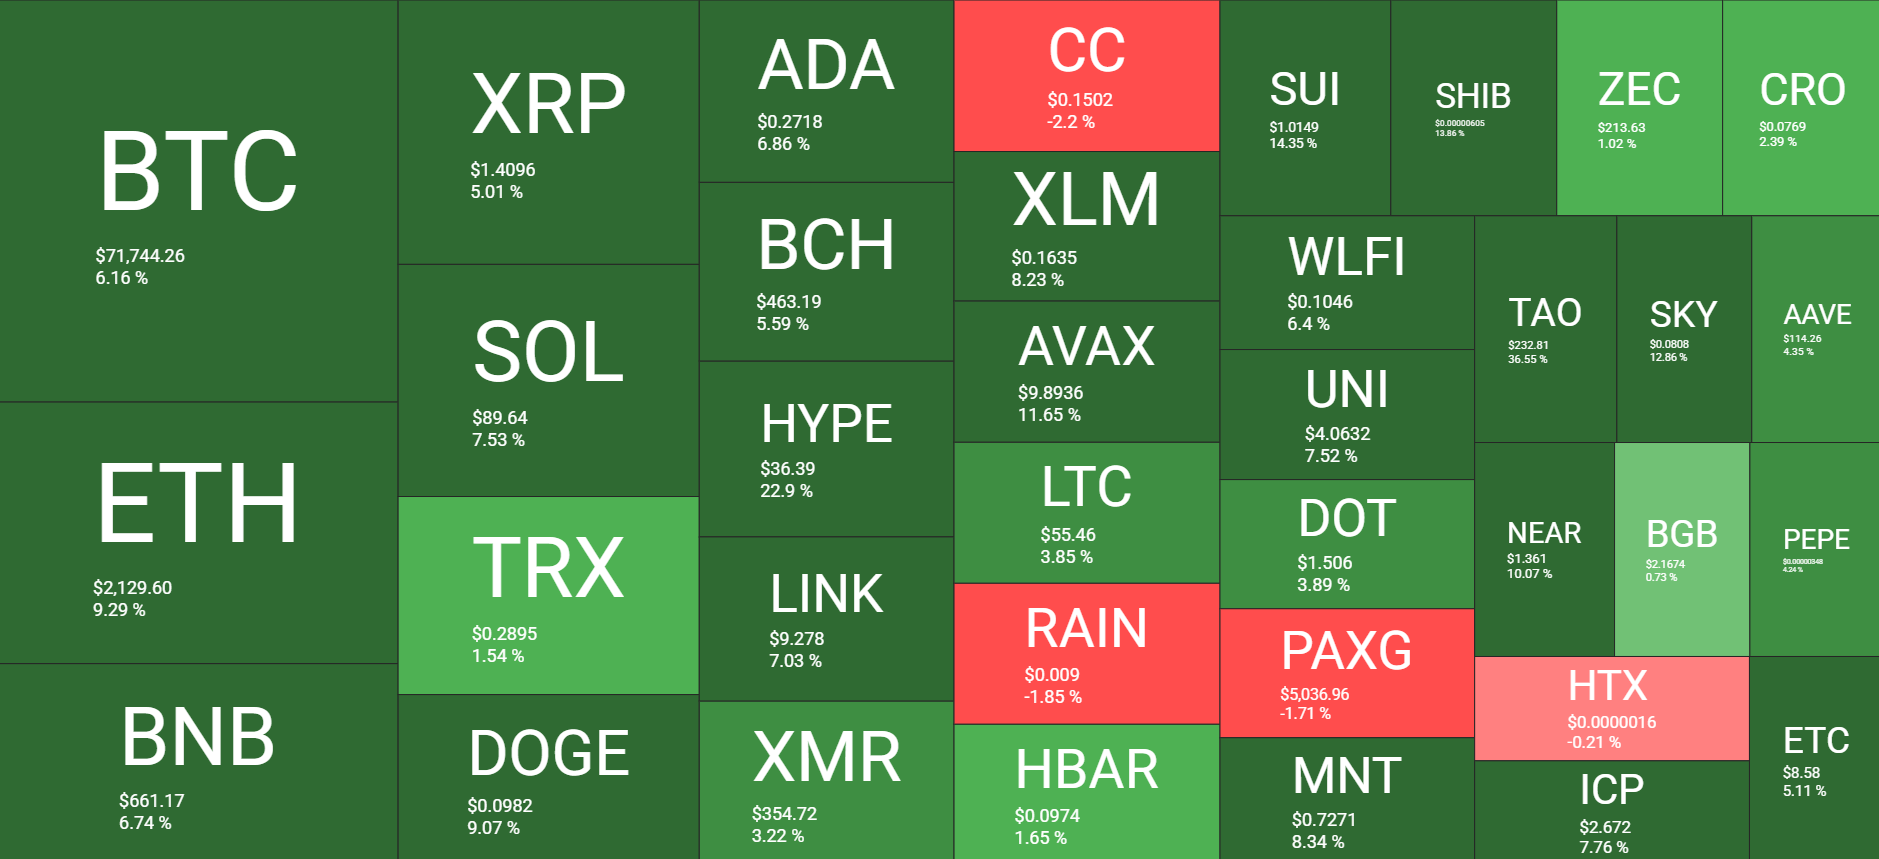
Market Cap: $2.52T | 24H Vol: $138B | BTC Dominance: 56.9%
BTC: $71,700 (+6.1%) | ETH: $2,130 (+9.3%) | XRP: $1.4 (+5%)
You may also like:
This Week’s Crypto Headlines You Can’t Miss
BlackRock Staked Ethereum ETF Sees $15.5M First-Day Volume. Perhaps the most significant piece of industry news this week came from the world’s largest asset manager. BlackRock debuted a new sort of Ethereum ETF that allows investors to take advantage of the network’s staking function. The launch day saw $15.5 million in daily volume.
Ripple Targets $50B Valuation With $750M Buyback Amid Major Partnerships. A recent report indicated that Ripple has launched a share buyback program that puts it at a whopping valuation of $50 billion. Its plan is to repurchase up to $750 million in shares from employees and investors.
POTUS to Headline Gala for Top TRUMP Holders as Price Soars 50% After ATL. Following a consistent and painful decline for the meme coin TRUMP, the US President stepped up to headline a gala for the top asset holders in several weeks. The token reacted immediately with a massive 50% surge.
Here’s When Arthur Hayes Will Buy Bitcoin Again. The co-founder of BitMEX remains a bitcoin bull, but he believes the asset is likely to retrace again amid the ongoing conflict between the US and Israel on one side, and Iran on the other. As such, he said he might look for a new bottom below $60,000 before he starts accumulating again.
Binance Under DOJ Investigation for Possible Iran Sanctions Violations: WSJ. The Wall Street Journal reported that the US Department of Justice has begun an investigation into whether Binance was used in any form to help Iranian-linked wallets bypass American sanctions. Meanwhile, the exchange has sued the publication for defamation over an article from February 24.
Elon Musk Confirms Early Public Access Launch of X Money Next Month. Musk continues with his attempts to transform the social media platform, and indicated that users will receive public access to X Money in April.
Charts
This week, we have a chart analysis of Ethereum, Ripple, Cardano, Binance Coin, and Hyperliquid – click here for the complete price analysis.
Binance Free $600 (CryptoPotato Exclusive): Use this link to register a new account and receive $600 exclusive welcome offer on Binance (full details).
LIMITED OFFER for CryptoPotato readers at Bybit: Use this link to register and open a $500 FREE position on any coin!


Ethereum co-founder Vitalik Buterin says large political efforts to regulate artificial intelligence could backfire.
Vitalik Buterin has said that his previous donation to the Future of Life Institute (FLI) does not mean that he agrees with the group’s current political stance on AI.
According to him, big political campaigns about AI safety could lead to authoritarian outcomes or a global backlash if governments and corporations fight for control of the technology.
Buterin Clarifies Link to FLI
The Ethereum co-founder explained in a lengthy post on X that he got involved with FLI after Shiba Inu’s (SHIB) creators sent him half of their supply to help promote the meme coin. Shortly after, the tokens’ paper value skyrocketed, even flying past $1 billion.
Buterin said he thought the bubble would burst quickly and so rushed to swap some of the SHIB for ETH, donating the funds to a number of causes. He also gave half of the remaining SHIB to CryptoRelief, an India-focused medical relief effort, and the other half to FLI.
The institute ultimately cashed out around $500 million from the donated SHIB holding, far more than Buterin had thought possible, given the token’s thin trading volume at the time. The developer claims he got sold on FLI based on their roadmap, which covered existential risks across biosafety, nuclear, and AI, as well as what he called their “pro-peace and pro-epistemics initiatives.”
However, according to him, the organization has since pivoted, focusing instead on cultural and political action. They justified the shift, saying the situation was no longer the same as it had been in 2021, with the proliferation of artificial general intelligence demanding the change to better counter the lobbying warchests of large AI companies.
Concerns About Political Approaches
Buterin insisted that concentrating on regulatory or political campaigns to control AI development could produce fragile systems or centralized power structures.
You may also like:
“My worry is that large-scale coordinated political action with big money pools is a thing that can easily lead to unintended outcomes, cause backlashes, and solve problems in a way that is both authoritarian and fragile, even if it was not originally intended that way,” he wrote.
The 32-year-old said that limiting biosynthesis tools or AI models by imposing guardrails “so that they refuse to create bad stuff” was a weak solution that could be easily worked around. He added that such strategies could also lead to governments banning open-source systems or backing one “approved” company to take over the development of AI.
“Approaches like this VERY EASILY backfire,” said Buterin. “They make the rest of the world your enemy.”
His proposal is a technological approach focused on developing defensive tools to help society stay safe in a world with powerful technology. He pointed out that his most recent funding decisions include approximately $40 million for research to build secure hardware and systems that could improve digital privacy and cybersecurity.
Binance Free $600 (CryptoPotato Exclusive): Use this link to register a new account and receive $600 exclusive welcome offer on Binance (full details).
LIMITED OFFER for CryptoPotato readers at Bybit: Use this link to register and open a $500 FREE position on any coin!

The Official Trump token surged on heavy trading after news spread that large holders could receive invitations to a private event at Mar-a-Lago.
Summary
- TRUMP price jumped more than 50% after the project announced a Mar-a-Lago luncheon for top token holders.
- Trading volume and derivatives activity spiked as traders rushed into the market.
- On the chart, the token broke above key resistance levels after months of decline.
At press time, The Official Trump (TRUMP) traded at $4.28, up about 52% in the past 24 hours. The token is now close to the top of its weekly range, which sits between $2.74 and $4.35.
Momentum has been building over the past several weeks. TRUMP has gained around 34% over the last seven daysand about 40% over the past month. Despite the recent rally, the token still sits roughly 94% below its January 2024 all-time high, after a long slide through 2025.
Trading activity exploded alongside the price jump. 24-hour spot volume reached about $1.4 billion, a 1,498% increase from the previous day.
Derivatives data from CoinGlass shows futures activity climbing even faster. Futures volume rose nearly 1,971% to $2.94 billion, while open interest jumped 154% to $253 million.
Such sharp increases often appear when traders rush to open new positions after a strong news catalyst.
Luncheon invitation drives attention
The latest rally follows an announcement tied to Donald Trump and an upcoming event at Mar-a-Lago.
According to details shared with the community, the top 297 holders of the TRUMP token may receive invitations to a crypto and business conference along with a gala luncheon scheduled for April 25, 2026.
Eligibility will be determined through a time-weighted points system based on token holdings between March 12 and April 10. Investors who hold larger amounts for longer periods rank higher on the leaderboard.
Extra benefits are reserved for the top 29 holders, who may attend a smaller VIP reception with Trump and other guests. Reports mention a private gathering and champagne toast, though organizers say there will be no personal meetings or gifts.
Participants must also pass security checks and maintain their token holdings through the event date.
The luncheon follows a similar promotion held in 2025, when top holders were invited to a dinner event. That earlier gathering drew criticism from some observers who argued that the model blends politics with speculative crypto marketing.
Supporters see the idea differently. For many traders, the token acts as a form of “token-gated access,” where ownership provides entry to exclusive events connected to the political figure.
Technical analysis: breakout follows news catalyst
The price chart shows a sharp reaction after the announcement.
A large bullish candle pushed the token from roughly $2.8–$3.0 to above $4.2 in a single session. That move represents a gain of more than 50% in one day, confirming strong demand following the news.
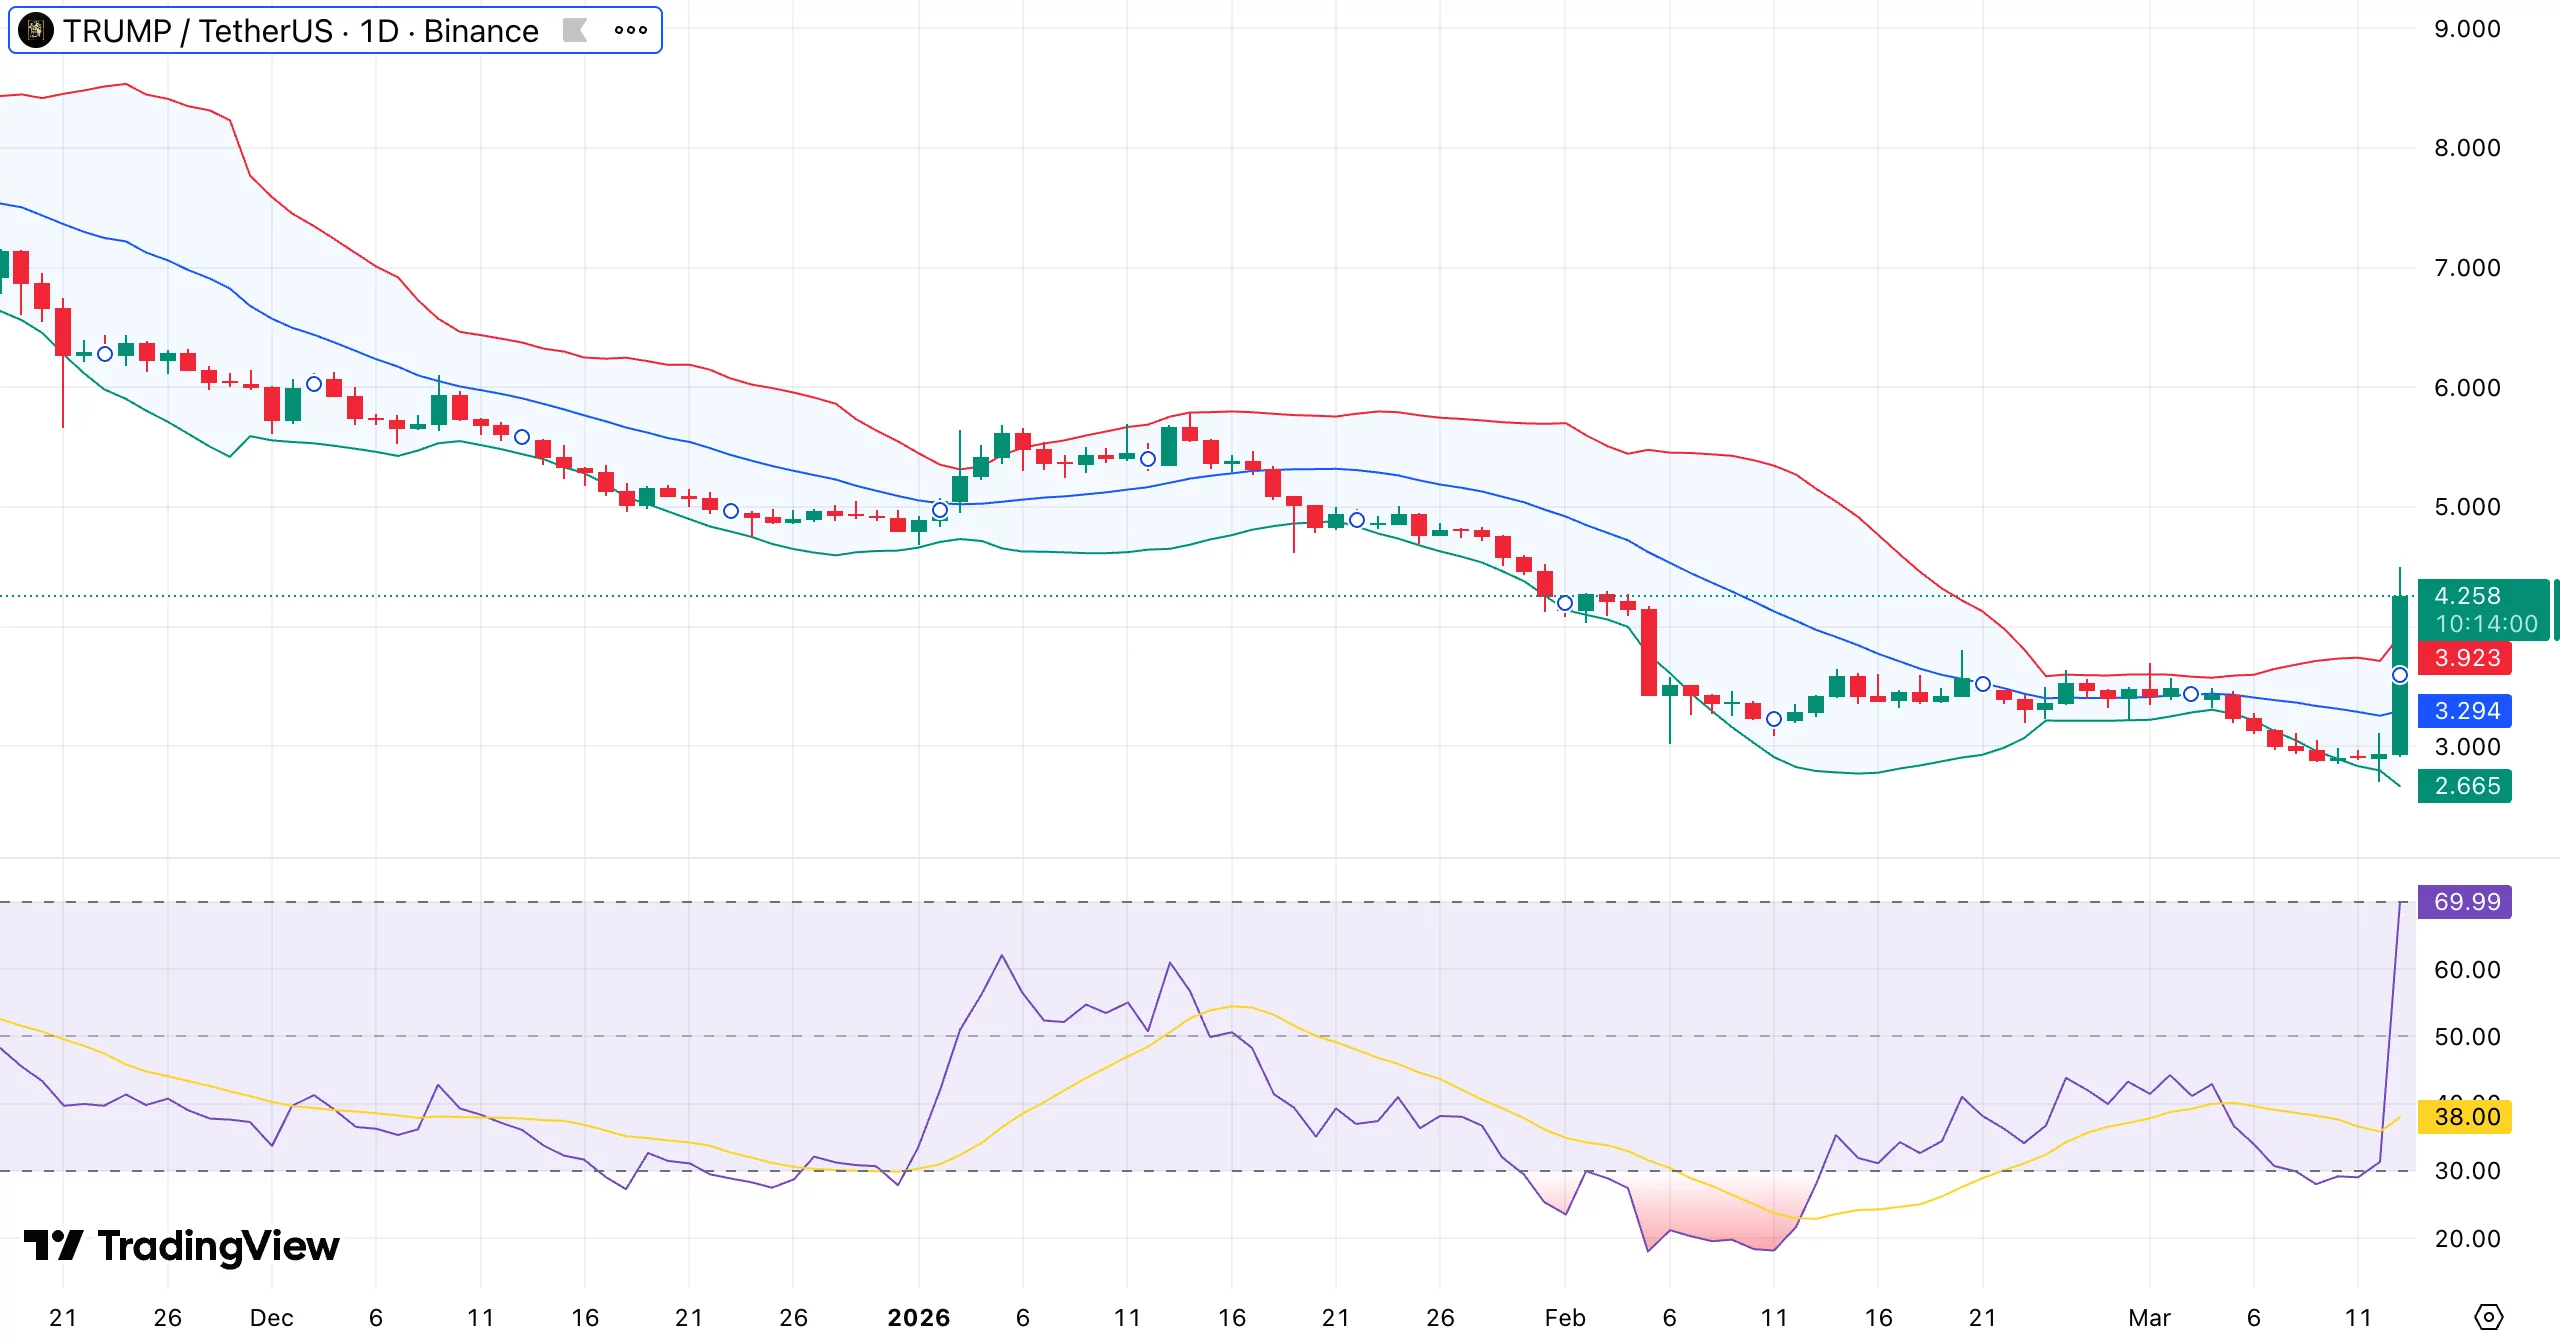
The rally also pushed price above several short-term moving averages near $3.29, levels that had acted as resistance during the previous downtrend. Once those levels broke, buying accelerated.
Volatility has started to increase as well. Bollinger Bands widened after the breakout, which often happens when price leaves a tight trading range.
Momentum indicators climbed quickly. The relative strength index moved close to 70, a level that shows strong buying pressure. When RSI approaches this zone, markets sometimes pause or pull back before deciding the next direction.
The chart also shows that a descending structure that formed over several months has been broken, marking the first strong bullish signal since the prolonged decline from earlier highs.
For now, traders are watching $4.50 and $5.00 as the next resistance zones. If the rally cools, $3.90 could act as support, followed by the $3.30 area, where several moving averages sit.


A US federal court has rejected Custodia Bank’s final attempt to challenge the Federal Reserve’s authority over granting master accounts — effectively ending the crypto-focused bank’s five-year-long battle for direct access to the central bank’s payment system.
The US Court of Appeals for the Tenth Circuit said in a filing on Friday that it wouldn’t hear Custodia’s final appeal on that point in a 7-3 vote.
Custodia first applied for a master account in October 2020, which allows financial institutions to hold reserves directly at the Federal Reserve and access its payment rails, enabling them to settle transactions without relying on intermediary banks.
After the Fed rejected its master account application, Custodia turned to the courts, arguing the Monetary Control Act entitles state-chartered banks to access Fed services and therefore a master account.
However, the multiple courts have now ruled that the Fed retains discretion over whether to grant master accounts.
Custodia’s blow comes as Kraken became the first crypto platform to receive a master account from the Federal Reserve Bank of Kansas City on March 4.
Kraken’s master account enables it to connect to the Fedwire payments system, though it does not include the full range of services available to traditional banks.
The move raised hopes that US regulators could offer “skinny” or limited master accounts to crypto firms.
Banks not given master accounts akin to “death sentence”
While only three judges sided with Custodia, one of them, Judge Timothy Tymkovich, wrote a strong dissenting opinion, stating that “a master account is ‘indispensable’ for a bank’s operations” and being denied one is “akin to a death sentence.”
Related: Democrats say they will oversee reported DOJ probe into Binance
He noted that three months after Custodia’s application in October 2020, the Fed said Custodia was eligible and told it there were “no showstoppers” with its application.
He added, “I do not agree that Reserve Banks have discretion over account applications and would have allowed the mandamus claim to go forward.”
Magazine: Clarity Act risks repeat of Europe’s mistakes, crypto lawyer warns


Michael Saylor has responded sharply after former UK Prime Minister Boris Johnson criticized Bitcoin (BTC) and suggested that it resembles a Ponzi scheme.
Former UK Prime Minister Boris Johnson criticizes Bitcoin
Johnson described a conversation with a church acquaintance who lost money after being lured into a supposed crypto investment opportunity. According to Johnson, the man initially handed over £500 to someone who promised to double his money through Bitcoin.
“After three and a half years of muddle… he was down £20,000,” Johnson wrote in a report. He also described how the individual paid repeated fees in an attempt to recover the funds. The former prime minister used the story to question the value and structure of cryptocurrencies.
He contrasted BTC with traditional assets and collectibles.“I can see the intrinsic value of gold,” Johnson wrote. “I can even understand why Pokemon cards have kept their value.”
He then questioned the foundations of digital assets, arguing that Bitcoin lacks an identifiable authority or issuer. “But Bitcoin? What is it? It’s just a string of numbers stored in a series of computers,” he wrote.
Johnson also referenced the mysterious origins of the BTC’s creator, Satoshi Nakamoto, adding that the system depends heavily on collective belief. “The whole thing depends completely on the collective belief… of the Bitcoin holders,” Johnson said.
He warned that increasing cases of fraud linked to crypto investments could weaken confidence in the sector. “I have always suspected from the outset that all cryptocurrencies were basically a Ponzi scheme,” Johnson wrote. He argued that the ecosystem relies on a continuous flow of new investors.
Michael Saylor claps back at Johnson
Saylor rejected that characterization in a post on the social platform X. “Bitcoin is not a Ponzi scheme,” Saylor wrote. “A Ponzi requires a central operator promising returns and paying early investors with funds from later ones.”
He argued that Bitcoin’s structure makes it fundamentally different from such schemes. “Bitcoin has no issuer, no promoter, and no guaranteed return—just an open, decentralized monetary network driven by code and market demand,” Saylor said.
The executive has long been one of the most prominent corporate advocates for Bitcoin. His company, MicroStrategy, holds billions of dollars worth of the crypto on its balance sheet. Johnson’s comments also revisited broader debates about monetary systems.
In his remarks, he referenced historical currency models backed by government authority, pointing to Roman coins bearing the image of emperors as an example of trust in state-backed money. Crypto supporters, however, often argue that Bitcoin’s decentralized structure is precisely what protects it from political influence and inflation tied to government spending.
The XRP Ledger has never been busier, but traders are yet to catch up.
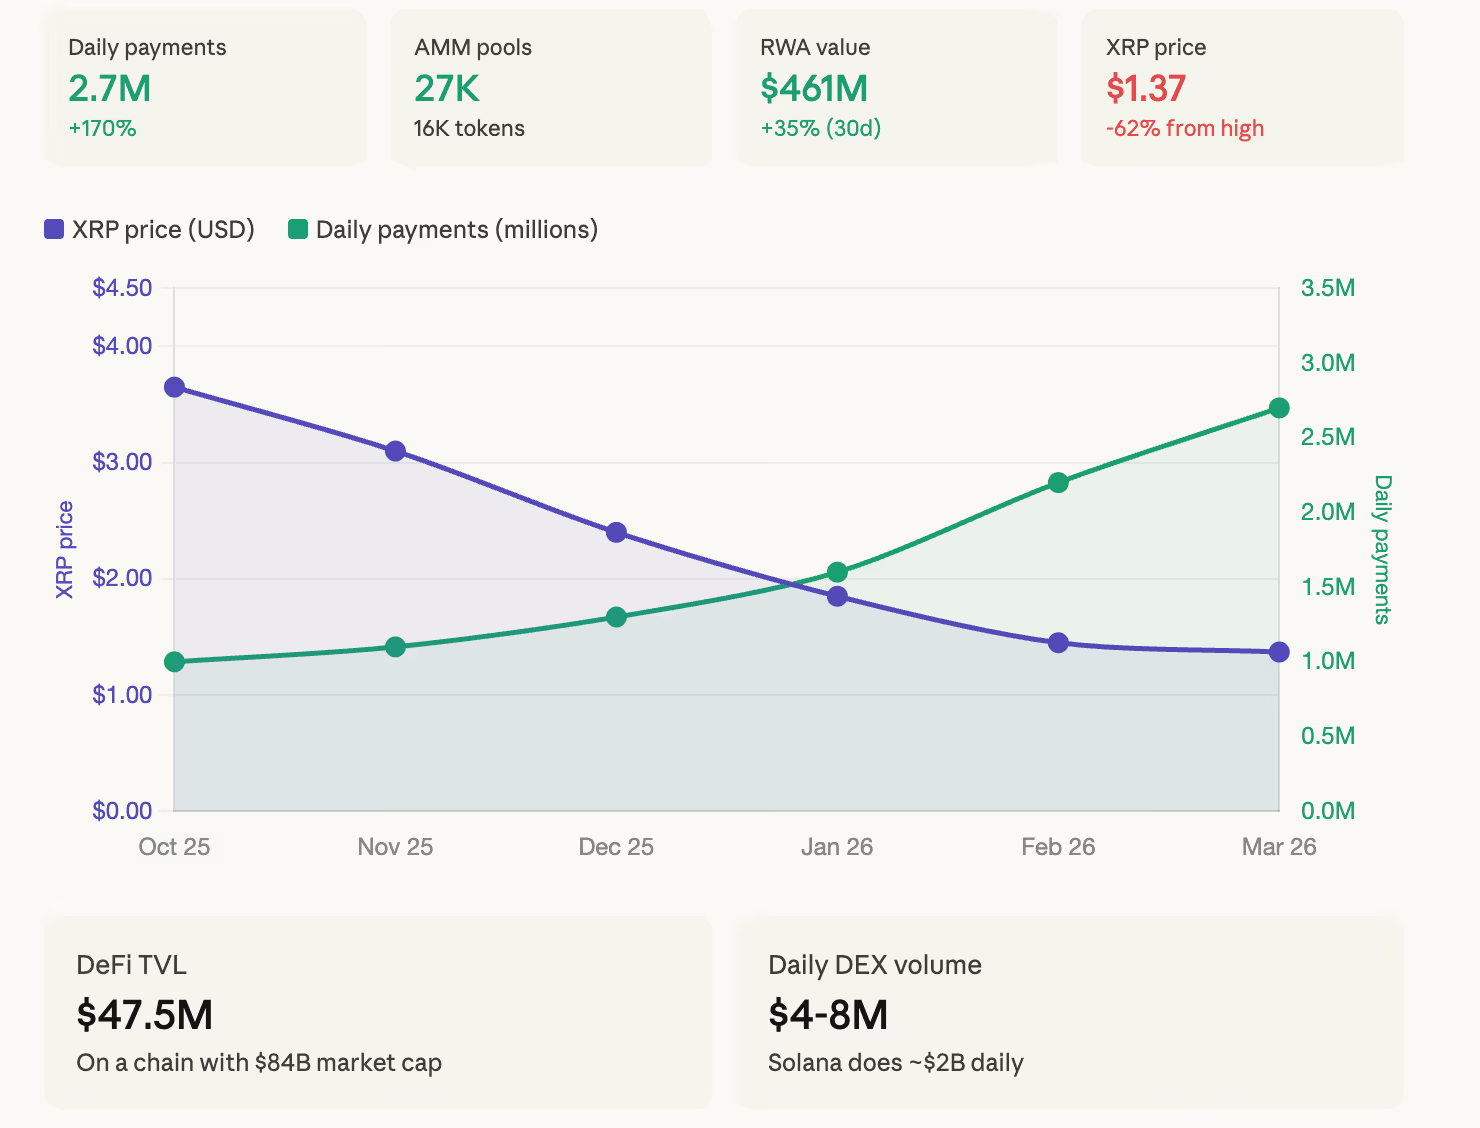
Daily successful payments on XRPL recently hit a 12 month high of over 2.7 million, up from roughly 1 million in late 2025, according to XRPSCAN data. The network is processing between 2 and 2.8 million transactions per day at 20 to 26 transactions per second.

Automated market maker pools have exploded to nearly 27,000 active pools supporting more than 16,000 unique tokens. Tokenized real-world asset value on the ledger climbed to $461 million, up 35% in the past 30 days, per RWA.xyz. Stablecoin transfer volume over the same period hit $1.19 billion.
XRP is trading at $1.37 and is down 26% year-to-date. It’s 62% below its late-2025 high of $3.65.
That gap between what the ledger is doing and what the token is doing is the most important thing happening in XRP right now, and it’s a question the market hasn’t answered yet.
The standard crypto thesis is that network activity drives token value. More usage means more demand for the native asset, which pushes price higher. It’s the framework that worked for Ethereum during DeFi summer and for Solana during the meme coin boom.
But XRP is breaking the pattern. Every metric that should matter for a utility token is up, but the price is down.
The most likely explanation is structural. XRPL’s growing activity is increasingly driven by RLUSD, Ripple’s stablecoin, and tokenized assets that flow through XRP as a bridge currency but don’t create sustained demand for the token.
A payment that uses XRP for three seconds to settle a cross-border transaction between fiat currencies doesn’t generate the same kind of buy pressure as someone staking ETH for months or locking SOL in a DeFi protocol. The network gets busier, but the token stays liquid and transient. Activity goes up but scarcity doesn’t.
The DeFi numbers make this stark. DeFiLlama shows XRPL’s total value locked at $47.54 million. That’s the entire DeFi ecosystem on a chain whose native token has an $84 billion market cap.

For comparison, Solana carries roughly $4 billion in TVL. Ethereum has over $40 billion. XRP’s DeFi layer is a rounding error relative to its valuation, which means the market cap is still overwhelmingly driven by speculative positioning and ETF expectations rather than capital locked into productive on-chain activity.
The native DEX tells a similar story. Daily volume runs between $4 million and $8 million on recent data, modest for any Layer 1 and especially small for one ranked fifth by market cap.
The AMM pool growth is real, with 27,000 pools and 12 million XRP deposited, but the dollar value of that liquidity remains thin relative to the scale of the token’s market.
The RWA picture is the one area where the data genuinely supports the bull case. $461 million in distributed asset value and $1.5 billion in represented asset value puts XRPL ahead of several larger chains in specific tokenization categories.
Stablecoin market cap on the ledger sits at $339 million with 35,800 holders. The 30-day RWA transfer volume of $149 million, up over 1,300%, suggests real institutional activity rather than wash trading. If the tokenization thesis plays out over the next few years, XRPL has a foothold that most competitors don’t.
As such, March historically averages an 18% return for XRP, and the $1.27 to $1.30 support zone has held through multiple tests. If macro conditions stabilize and the Iran conflict moves toward resolution, a relief bounce to $1.60 or higher is plausible.

Make it York looks back over its winter events for 2025-26

Port of Tauranga Limited (PTAUY) Analyst/Investor Day – Slideshow
Bill Haney announces Devin Haney’s next fight: “You heard it from me”


-

 News Videos5 days ago
10th Algebra | Financial Planning | Question Bank Solution | Board Exam 2026
-
 Tech3 days ago
A 1,300-Pound NASA Spacecraft To Re-Enter Earth’s Atmosphere
-

 Crypto World4 days ago
Paradigm, a16z, Winklevoss Capital, Balaji Srinivasan among investors in ZODL
-

 Business3 days ago
ExxonMobil seeks to move corporate registration from New Jersey to Texas
-

 Tech3 days ago
ChatGPT will now generate interactive visuals to help you with math and science concepts
-

 Sports6 days ago
Three share 2-shot lead entering final round in Hong Kong
-

 Fashion7 hours ago
Weekend Open Thread: Addict Lip Glow
-

 Sports6 days ago
Braveheart Lakshya downs Lai in epic battle to enter All England Open final | Other Sports News
-

 NewsBeat2 days ago
Residents reaction as Shildon murder probe enters second day
-

 Entertainment7 days ago
Hailey Bieber Poses For Sexy Selfies In New Luscious Lip Thirst Traps
-

 Business5 days ago
Search for Nancy Guthrie Enters 37th Day as FBI Probes Wi-Fi Jammer Theory
-

 Business3 days ago
Search Enters Sixth Week With New Leads in Tucson Abduction Case
-
 NewsBeat4 days ago
Pagazzi Lighting enters administration as 70 jobs lost and 11 stores close across Scotland
-

 Tech4 days ago
Despite challenges, Ireland sixth in EU for board gender diversity
-

 Business4 days ago
Search Enters 39th Day with FBI Tip Line Developments and No Major Breakthroughs
-

 NewsBeat2 days ago
I Entered The Manosphere. Nothing Could Prepare Me For What I Found.
-

 Business7 days ago
Iran war enters second week as Trump demands ’unconditional surrender’
-

 Sports5 days ago
Skateboarding World Championships: Britain’s Sky Brown wins park gold
-

 Crypto World3 days ago
Will Chainlink price reclaim $10 amid volatility squeeze?
-

 Sports5 days ago
Tomorrow’s Top 25 Today: Florida jumps to No. 4; Louisville, Wisconsin enter projected rankings