

Crypto World
XRP Network Activity Surges While Token Price Searches for Macro Bottom
TLDR
- The XRP Ledger recorded 2.7 million daily payments, marking a 12-month peak, even as XRP’s value dropped 26% since January
- Automated market maker pools expanded to nearly 27,000 while tokenized real-world assets on the platform climbed 35% over 30 days to $461 million
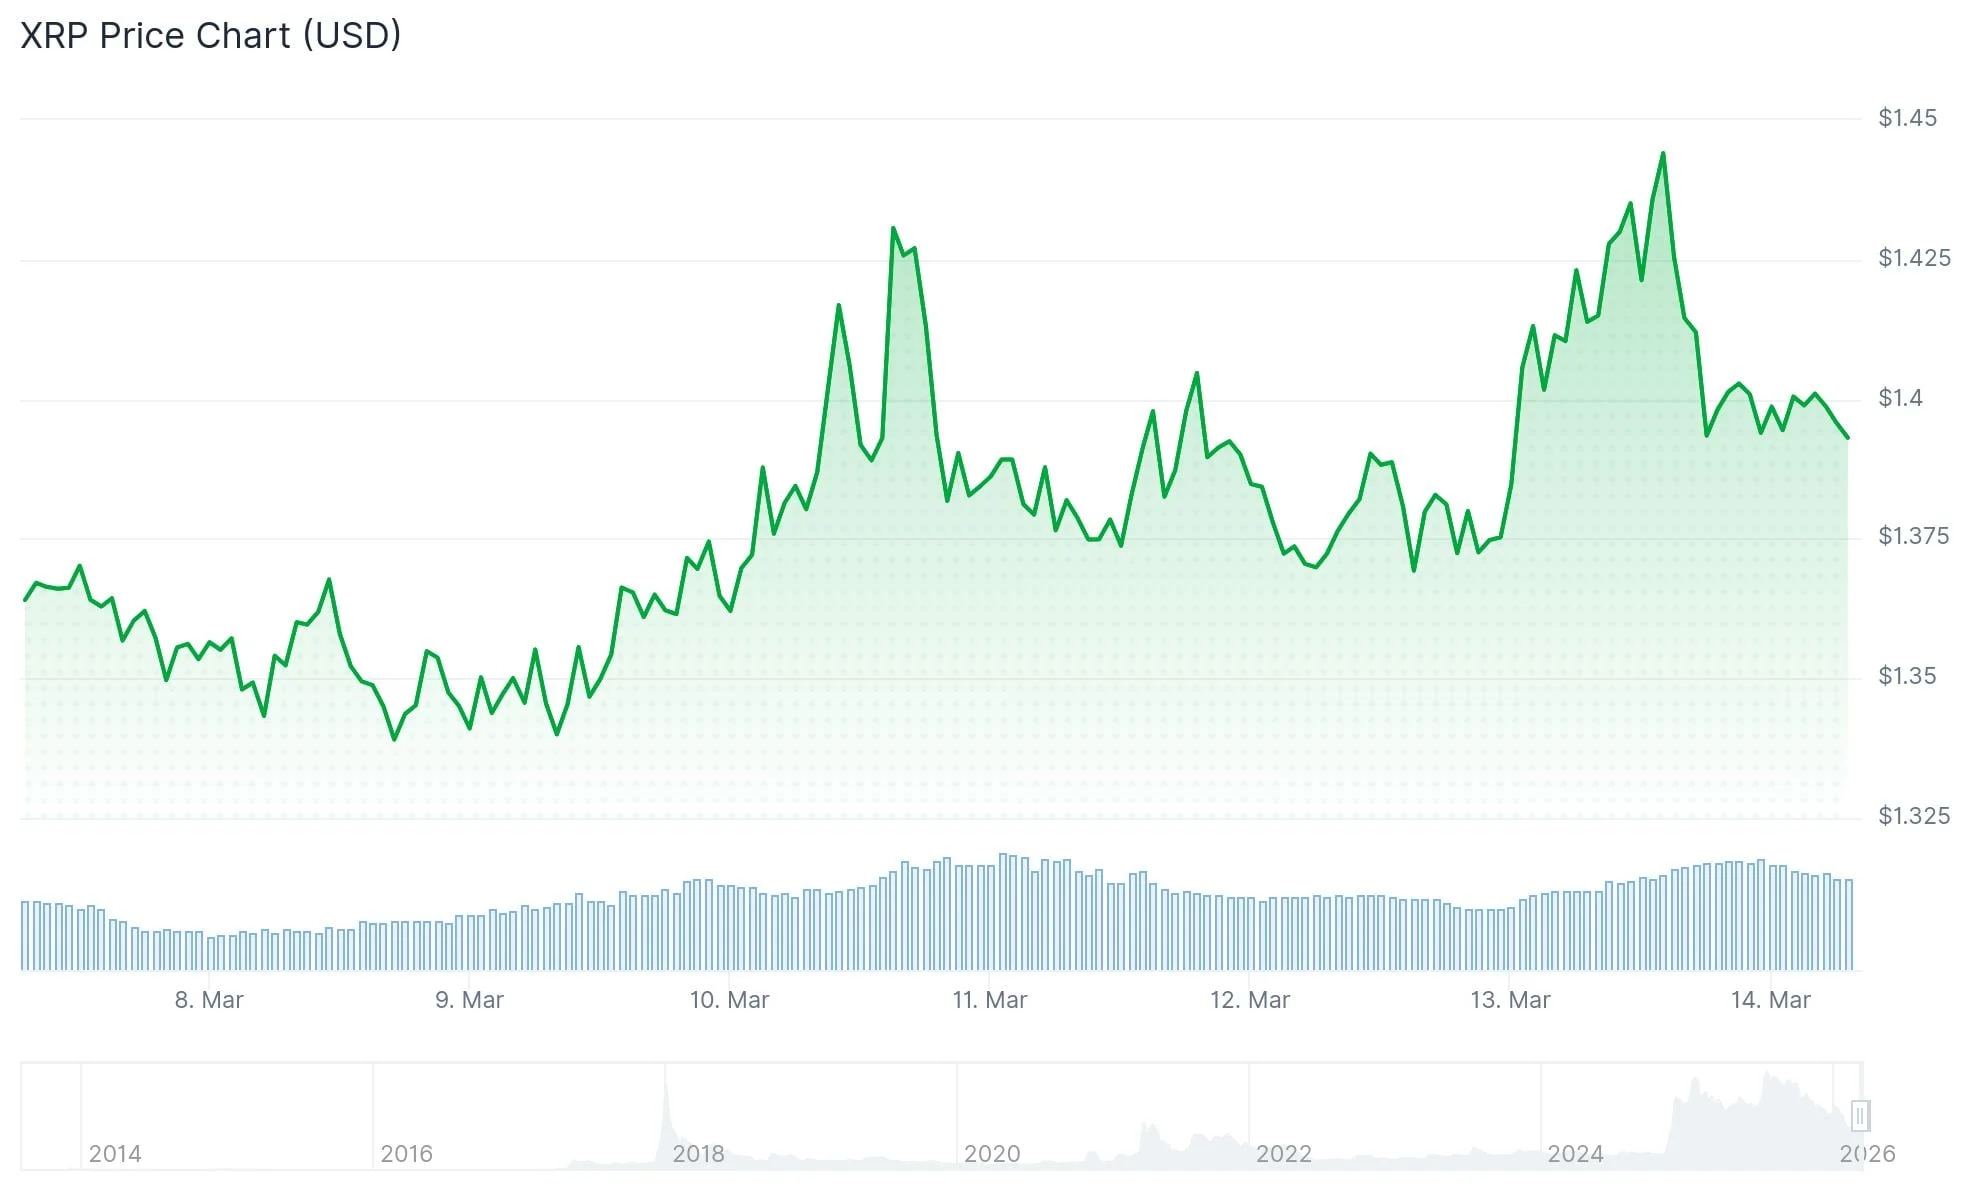
- The token currently hovers near $1.42, representing a 62% decline from its December 2025 high of $3.65
- Technical analysts highlight critical support between $0.80–$0.95, while a surge past $3.32 could unlock targets ranging from $27–$48
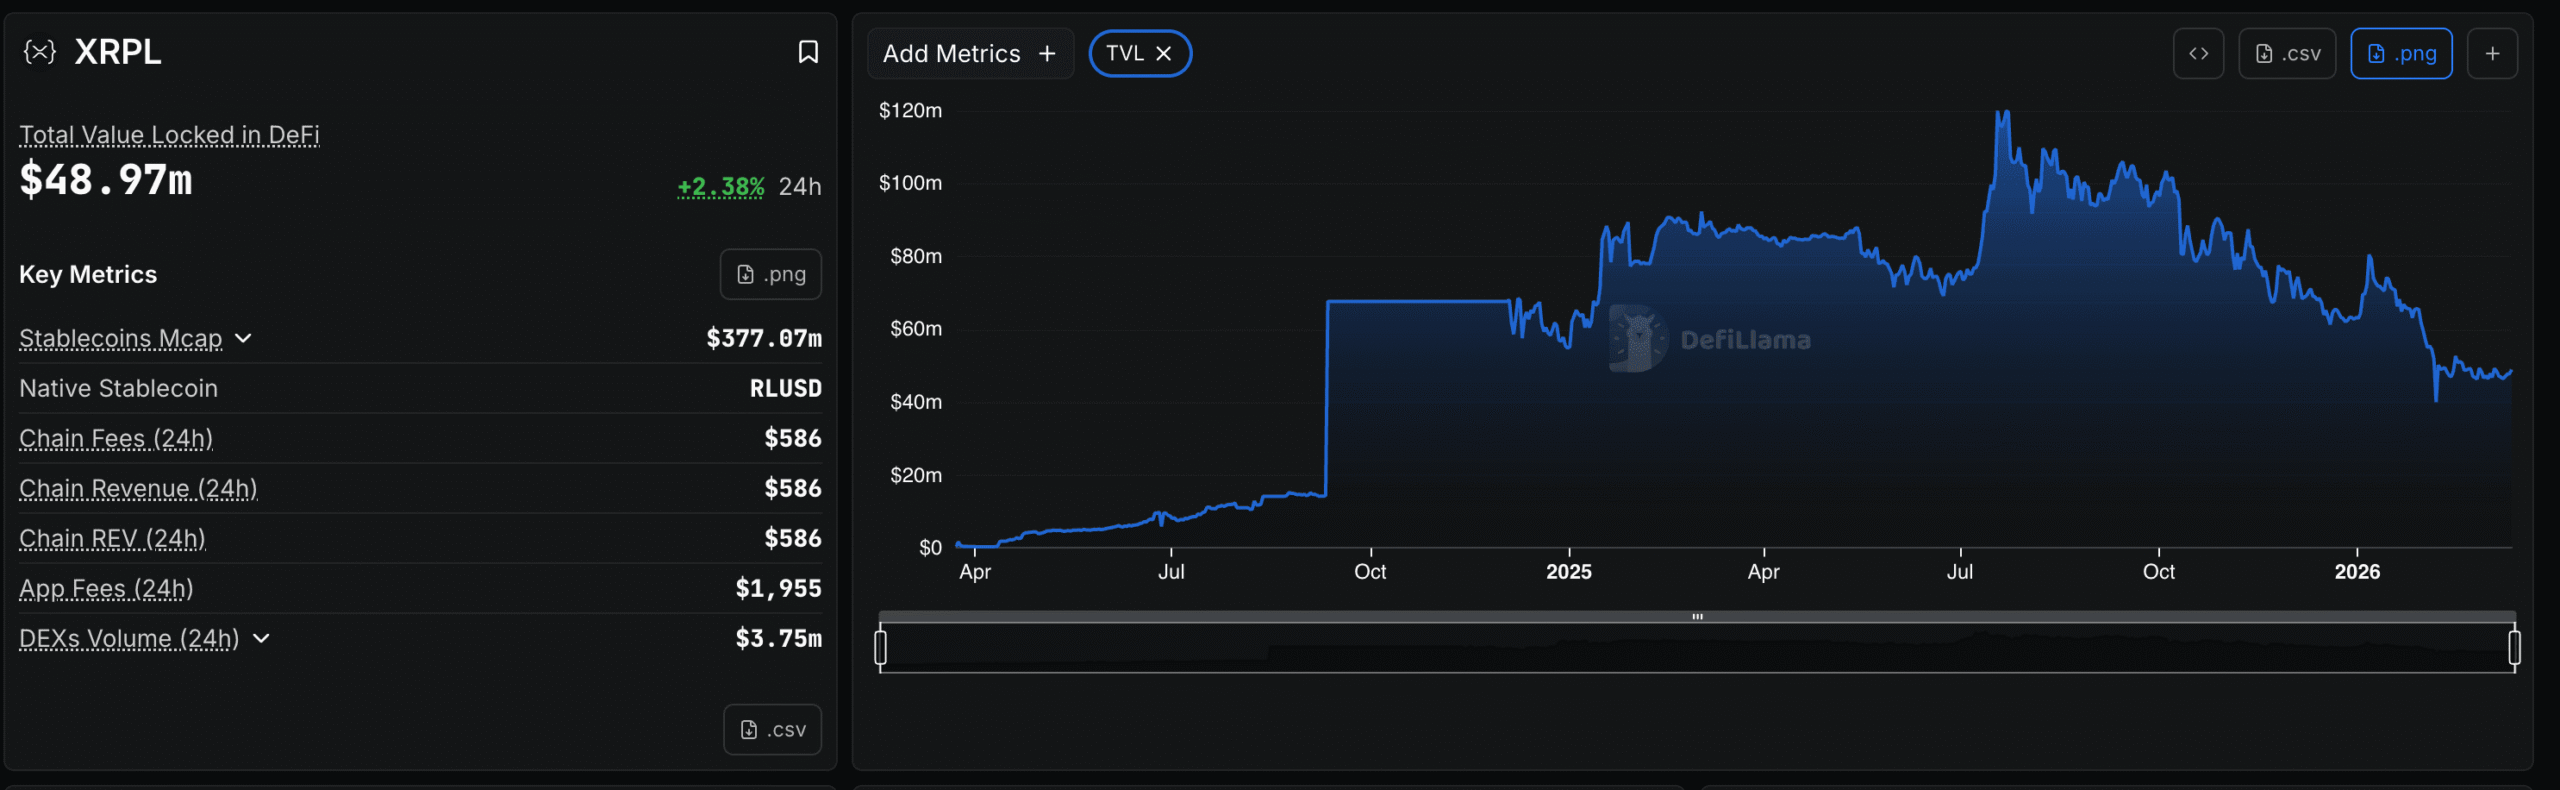
- Despite XRP’s $84 billion market capitalization, XRPL’s total value locked remains at a modest $47.54 million
The XRP Ledger is experiencing unprecedented network utilization, yet the token’s market performance tells a contrasting story. Currently valued at approximately $1.42, XRP has shed 26% of its value year-to-date and sits 62% beneath its late-2025 zenith of $3.65.

Successful payment transactions on the XRP Ledger recently climbed above 2.7 million daily, establishing a new 12-month benchmark. This represents a substantial increase from approximately 1 million recorded in late 2025, with the blockchain consistently handling 20 to 26 transactions every second.
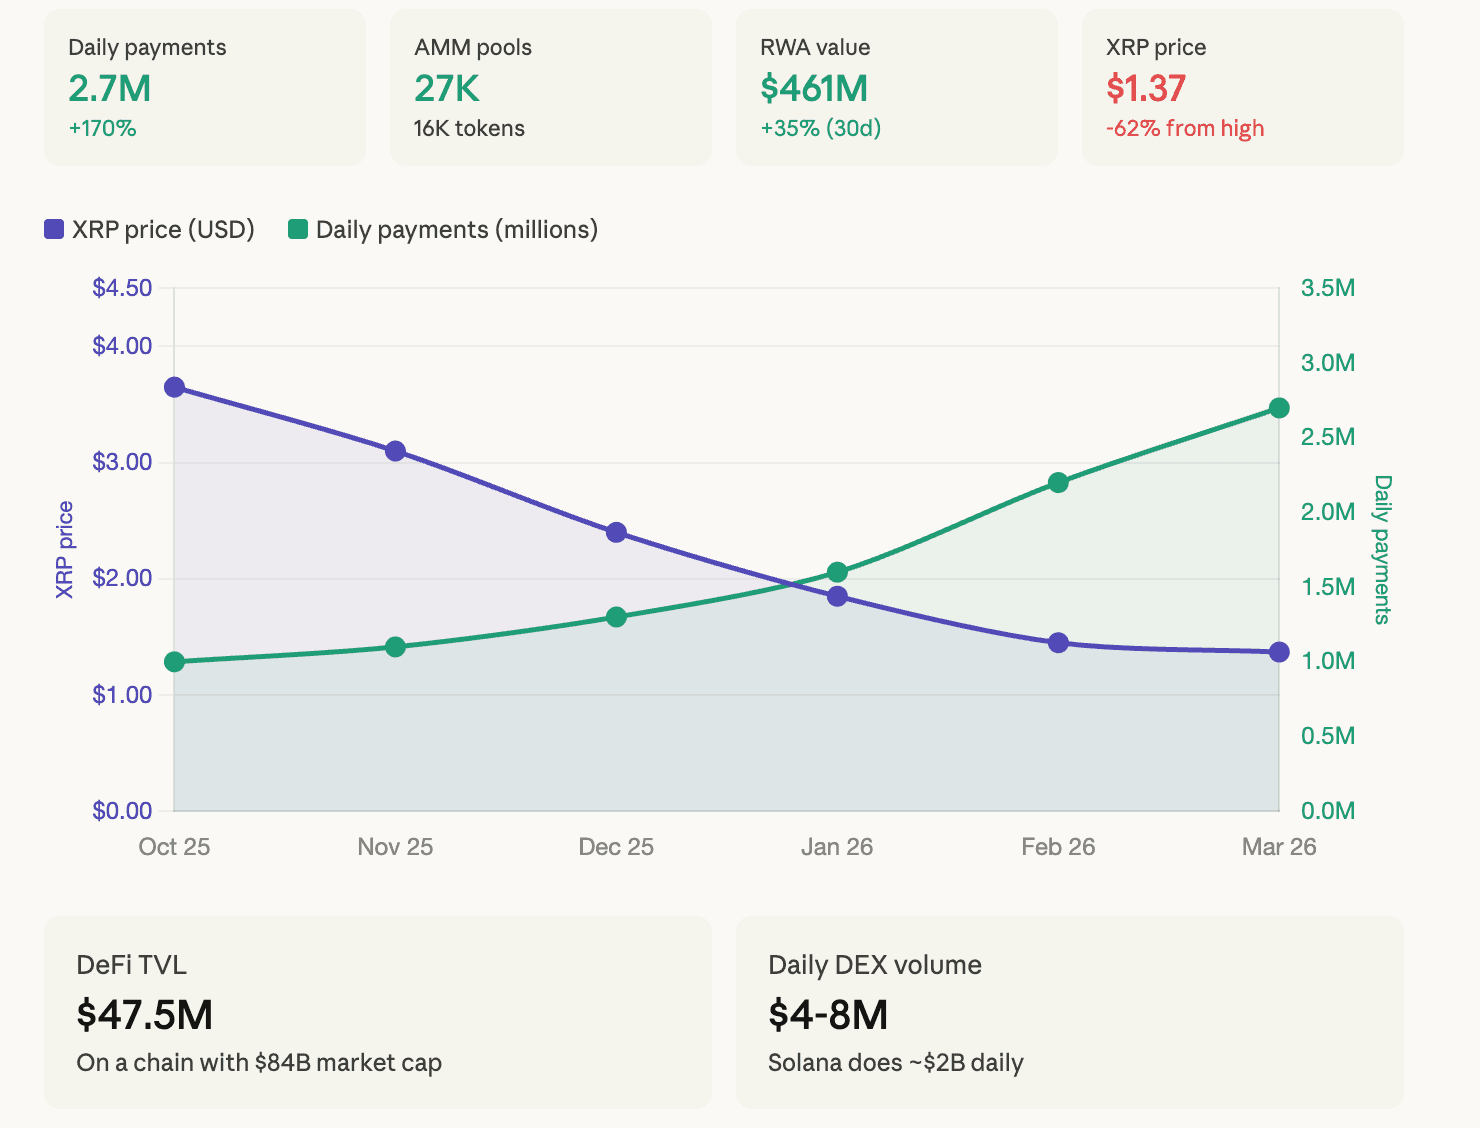
The platform’s automated market maker infrastructure has expanded to encompass nearly 27,000 pools, facilitating trading for more than 16,000 distinct tokens. Currently, twelve million XRP sits deposited within these liquidity pools.
The value of tokenized real-world assets on the ledger climbed to $461 million, representing a 35% expansion over the preceding 30 days. During this same timeframe, stablecoin transfer volume reached $1.19 billion, with the total stablecoin market cap on XRPL standing at $339 million distributed among 35,800 holders.
A significant portion of this network utilization connects to Ripple’s RLUSD stablecoin and tokenized instruments that employ XRP temporarily as a bridge asset. These operations don’t generate enduring demand for holding the token long-term.
Why Activity Isn’t Lifting XRP’s Price
When XRP facilitates a cross-border transaction for mere seconds to connect two fiat currencies, it doesn’t create persistent buying pressure. The blockchain processes more volume, but the token functions as a fleeting intermediary.
According to DeFiLlama, the XRP Ledger’s total value locked reaches only $47.54 million. By comparison, Solana maintains approximately $4 billion in TVL. Ethereum commands over $40 billion.
Daily decentralized exchange volume on XRPL fluctuates between $4 million and $8 million. For a Layer 1 blockchain carrying an $84 billion market valuation, these figures remain relatively modest.
The 30-day RWA transfer volume of $149 million — representing an increase exceeding 1,300% — does suggest genuine institutional participation in the asset tokenization sector.
What Analysts Are Watching
Analyst EGRAG CRYPTO highlights a critical accumulation zone spanning $0.80 to $0.95, where several technical signals align, including convergence of the 21, 50, and 100 exponential moving averages alongside a sustained ascending trendline.
Should XRP recapture the 21 EMA and escape its present corrective formation, the subsequent price objective would land near $2.20. The base-building phase could extend through Q2–Q3 2026.
Analyst Ali Martinez recognizes a long-term ascending triangle configuration with horizontal resistance positioned around $3.32. A decisive move above this threshold projects macro objectives spanning $27 to $48.
Analyst Crypto Patel observes a validated multi-year triangle breakout, with a projected bull-market target approaching $50.
The $1.27–$1.30 support region has withstood numerous retests. Historically, XRP delivers an average 18% gain during March.


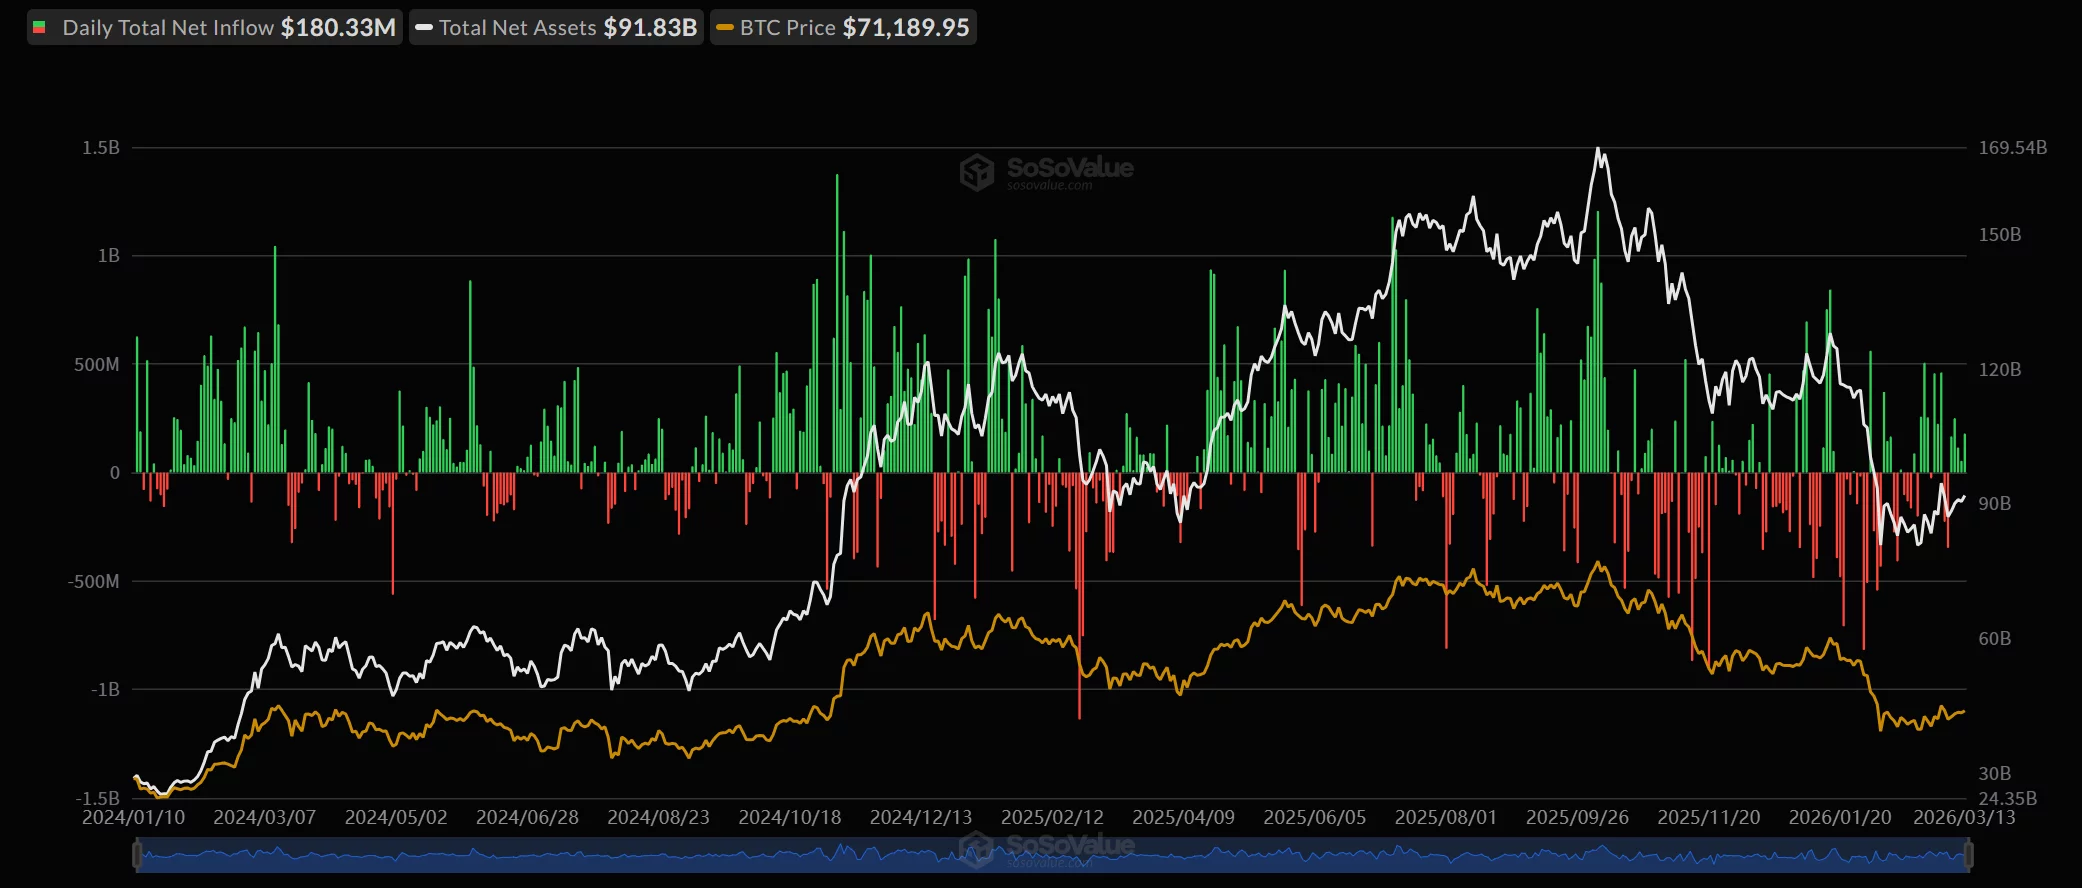
Spot Bitcoin ETFs recorded strong inflows on March 13, adding fresh momentum to institutional demand as market analysts pointed to key resistance and support levels for BTC price. Data shared by Farside Investors shows that U.S. spot Bitcoin ETFs attracted $180.4 million in net inflows on March 13, 2026.
Spot Bitcoin ETFs continue inflow streak
The funds extended a streak of positive flows after several volatile sessions earlier in the month.The largest share of inflows came from BlackRock’s IBIT, which added $143.6 million. Fidelity’s FBTC followed with $23.2 million, while Bitwise’s BITB recorded $3.1 million. ARK Invest’s ARKB posted $2.4 million, and VanEck’s HODL brought in $8.1 million.
Other Bitcoin ETFs reported no daily inflows, including Grayscale’s GBTC, Invesco’s BTCO, and Franklin Templeton’s EZBC. The latest figures from Farside UK reflect a rebound in ETF demand after significant outflows earlier in March. On March 6, spot Bitcoin ETFs collectively recorded $348.9 million in outflows.
The flows later turned positive, with $167.1 million in inflows on March 9 and $246.9 million on March 10, before moderating to $53.8 million on March 12. Since launch, cumulative inflows remain heavily concentrated in a few products. BlackRock’s IBIT has attracted more than $63 billion, while Fidelity’s FBTC has gathered nearly $11 billion, according to the totals displayed in the dataset.
Analysts remain optimistic on BTC price
At the same time, analysts are closely watching Bitcoin’s technical structure. Crypto analyst Ali Martinez said Bitcoin has entered a “low-resistance zone,” suggesting the asset could move higher with relatively limited selling pressure.
“Bitcoin $BTC has entered a low-resistance zone, with little standing in the way until $82,045,” Martinez wrote. He added, “Meanwhile, the key support floor sits at $66,898.”
A chart shared by crypto analyst Michaël van de Poppe shows Bitcoin trading around $71,720 on the 4-hour timeframe after rebounding from earlier March lows. The chart highlights a higher-low structure forming near $65,117, which Poppe described as a support level the market continues to hold.
Above the current price range, the chart marks a potential resistance band between $76,604 and $79,127, while a broader upside target zone sits near $80,646. The technical setup also shows Bitcoin reclaiming a short-term moving average after a series of consolidations.
Poppe described the recent price move as typical end-of-week volatility.“Classic price action on a Friday afternoon on #Bitcoin,” Poppe wrote on X. He noted, “Runs all the way towards the recent high, takes liquidity and inverses.”
Poppe added that he would be watching the next few sessions closely as he expects fresh highs soon. “Would be interested to see how this develops coming days, but would suggest that we’re going to attack the highs again in next two weeks.”


BlackRock digital assets head Robert Mitchnick said Bitcoin and Ethereum remain the only two cryptocurrencies attracting meaningful investor demand.
Summary
- BlackRock says Bitcoin and Ethereum dominate investor demand.
- IBIT saw $26B inflows in 2025 despite Bitcoin’s price decline.
- ETH staking ETF aims to add yield to ether exposure.
This comes as the asset manager evaluates future ETF products. Speaking on CNBC following the launch of BlackRock’s ETHB staked ether ETF, Mitchnick stated Bitcoin commands approximately 60% of crypto market share while Ethereum holds the low teens.
The comments come as BlackRock’s IBIT Bitcoin ETF recorded $26 billion in inflows during 2025 despite Bitcoin falling nearly 50% from its October all-time high.
IBIT ranked fourth globally for ETF inflows last year, becoming the only product in the top 20 to post positive flows while delivering negative price returns.
Year-to-date flows for IBIT remain slightly positive, with approximately 90% of the investor base maintaining steady accumulation patterns through the drawdown.
Bitcoin and Ethereum dominate investor allocation decisions
Mitchnick described Bitcoin as a “digital gold emerging monetary alternative” while calling Ethereum as “a technology centric bet around blockchain innovation and the various use cases of ether and digital assets.”
The distinction decides how investors approach portfolio allocations, with Ethereum exposure aligning more closely with technology and venture equity allocations.
BlackRock’s ETHA became the third-fastest ETF in history to reach $10 billion in assets under management, trailing only IBIT and Fidelity’s FBTC.
The newly launched ETHB adds staking yield to spot ether exposure, addressing what Mitchnick called a “limitation” in original ether ETF products that lacked yield capture mechanisms.
The staking feature makes ETHB “much closer, like the Bitcoin ETPs were, to a silver bullet for a lot of investors in terms of a super convenient exposure vehicle,” Mitchnick said.
Long-term investors drive Bitcoin and Ethereum ETF flows
Retail investors and financial advisors comprise the majority of ETF demand, with both segments showing opportunistic buying during price declines.
Hedge funds account for roughly 10% of flows, primarily running basis trades that go long ETFs while shorting futures contracts. These trades remain neutral for Bitcoin’s price but create flow volatility when basis spreads compress.
Mitchnick noted BlackRock sees “pockets of interest” in other crypto assets but maintains a “discerning approach” to product expansion.
The firm continues evaluating assets as liquidity, scale, and use cases develop, but Bitcoin and Ethereum remain where investor interest concentrates overwhelmingly.
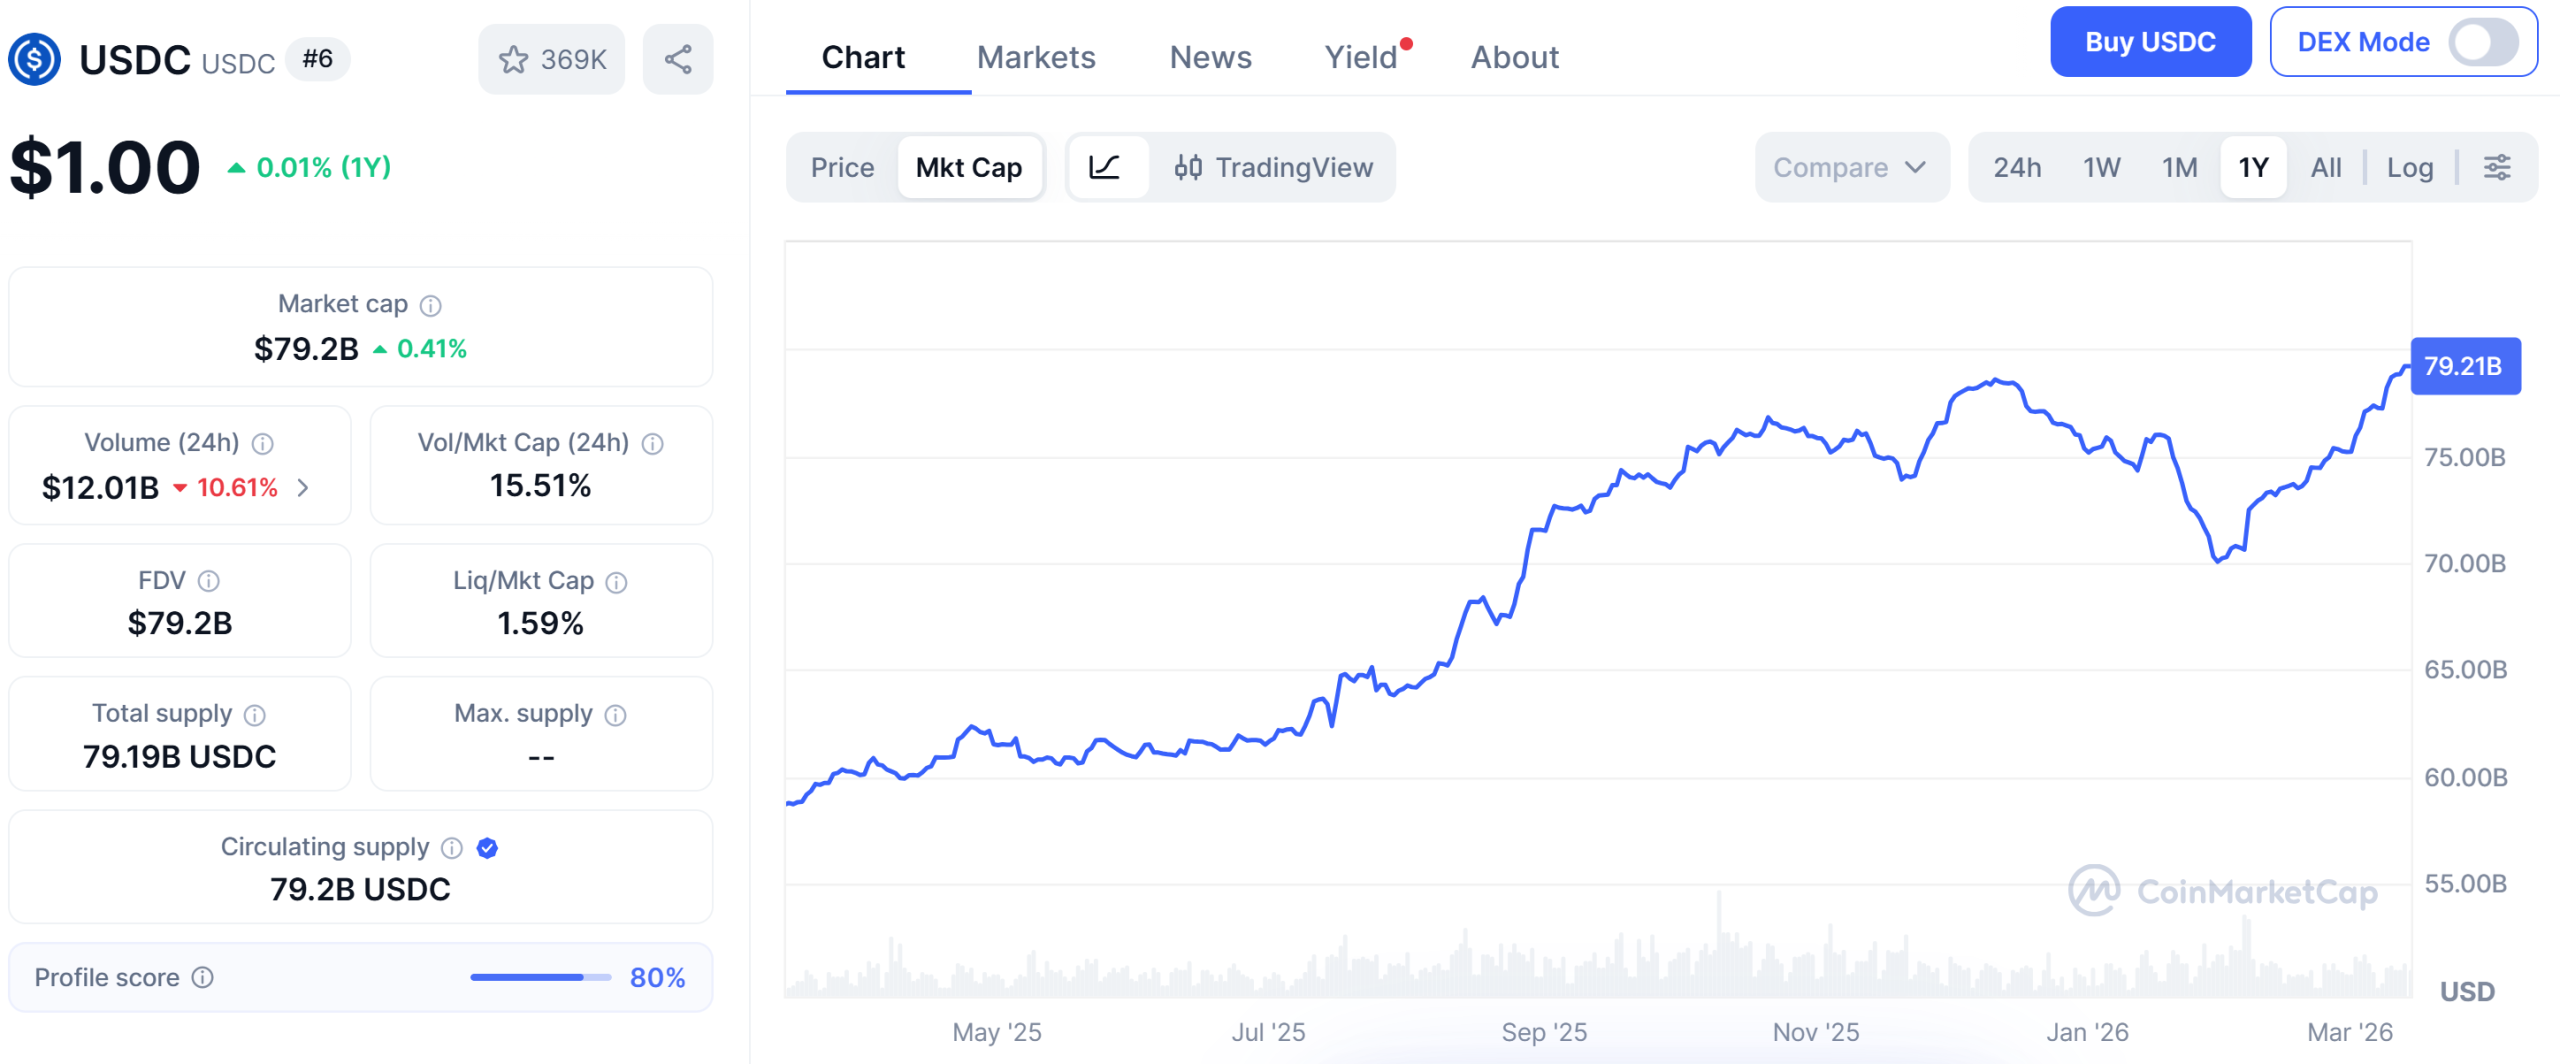
The market capitalization of the USDC stablecoin is approaching a record high near $80 billion as demand surges in the Middle East, with one analyst linking the spike to capital flight from the United Arab Emirates.
According to data from CoinMarketCap, USDC (USDC)’s circulating supply has risen to roughly $79.2 billion, marking a new all-time high for the dollar-pegged stablecoin. The stablecoin’s market cap previously hit a high of below $79 billion in December last year.
The increase comes after supply expanded by billions of dollars in recent weeks. The stablecoin’s market cap stood at just over $70 billion in early February and at $75 billion earlier this month.

Self-proclaimed Dubai-based analyst Rami Al-Hashimi claimed the surge reflects growing demand from investors seeking to move funds out of traditional markets. In a Friday post on X, Al-Hashimi said over-the-counter (OTC) desks in Dubai have struggled to meet demand for the stablecoin.
Related: Stablecoins could form backbone of global payments in 10 years: Billionaire
Dubai property slump may be driving USDC surge
Al-Hashimi tied the surge in stablecoin demand to turmoil in the UAE’s real estate market. The analyst claimed property prices in Dubai have fallen roughly 27% this month, sparking a rush among investors to move capital into digital assets.
“War panic. Capital flight. Sellers are bleeding,” he wrote, describing what he said was a rapid shift in investor behavior.
Data from TradingView also shows that the DFM Real Estate Index, which tracks the performance of listed real estate and construction companies in Dubai, has suffered a sharp sell-off, with the index falling from around 16,800 at its recent peak to about 11,516, a decline of roughly 31%.
Al-Hashimi claimed the situation has also led some property sellers to accept cryptocurrency payments directly. He said certain real estate listings now advertise discounts for buyers who pay using Bitcoin (BTC).
“Pay in BTC, get 5–10% off,” he wrote, adding that the trend reflects growing demand for digital assets during periods of financial uncertainty.
Related: Crypto Biz: Circle stock defies Wall Street and digital asset selloff
USDC overtakes USDt in adjusted transaction volume
Japanese investment bank Mizuho says USDC has surpassed Tether’s USDt (USDT) in adjusted transaction volume for the first time since 2019. According to the bank’s research note, USDC recorded about $2.2 trillion in adjusted transaction volume year-to-date, compared with $1.3 trillion for USDt, giving USDC roughly 64% of combined transaction share.
Despite the shift in activity, USDt remains the largest stablecoin by market capitalization at about $184 billion, far ahead of USDC’s $79 billion.
AI Eye: IronClaw rivals OpenClaw, Olas launches bots for Polymarket

TLDR:
- Bitcoin marked its 2025 cycle top at $126,230 on October 6, starting a 159-day correction phase.
- The 2017 cycle took 1,180 days to reach a new ATH, while 2021 required 1,093 days to recover.
- For the first time ever, Bitcoin reached a new ATH in 2025 without a halving event preceding it.
- Spot Bitcoin ETFs launched in January 2024 disrupted historical halving-driven market cycle patterns.
Bitcoin correction timelines have historically tested investor patience across multiple market cycles. The most recent cycle top was marked on October 6, with Bitcoin reaching approximately $126,230.
Since then, the asset has been in a correction phase spanning 159 days. Market analysts are comparing this period against previous Bitcoin bear markets and recovery timelines.
Historical data shows earlier cycles required far longer before a new all-time high was reached. Long-term investors continue to track these patterns for perspective.
Bitcoin’s 159-Day Correction in Historical Context
The cycle top for Bitcoin was recorded on October 6 at approximately $126,230. Since that date, the correction has extended to 159 days based on current market data.
Many investors view this period as prolonged, though historical comparisons offer a contrasting view. Prior Bitcoin cycles consistently required far longer recovery timelines before reaching new highs.
Crypto analyst Darkfost published comparative data spanning Bitcoin’s most notable market cycles. In the 2017 cycle, it took 1,180 days before Bitcoin achieved a new all-time high.
The 2021 cycle required 1,093 days to reach that same milestone. The current 2025 cycle, by comparison, has so far lasted only 849 days from its peak.
Looking at these numbers, a clear trend toward shorter cycle durations becomes apparent. The time between Bitcoin’s all-time highs has been consistently shrinking across each major cycle.
This pattern points to Bitcoin’s continued maturation as a widely held global financial asset. For long-term holders who accumulate steadily rather than trade short-term moves, this trend is encouraging. It also suggests that Bitcoin’s recovery pace may continue to accelerate in future cycles.
Halvings, ETFs, and Bitcoin’s Long-Term Supply Dynamics
A key observation in the current Bitcoin cycle is the break from the established halving pattern. Historically, a Bitcoin halving had always come before a new all-time high in each prior cycle.
The 2025 cycle broke that precedent for the first time in Bitcoin’s recorded history. This departure has prompted analysts to revisit traditional assumptions around halving-driven market cycles.
Darkfost directly linked this pattern disruption to the launch of spot Bitcoin ETFs in January 2024. These financial products introduced institutional demand that did not follow traditional halving-driven market cycles.
The ETFs altered the timing dynamics that many traders and analysts had previously relied on. As a result, Bitcoin reached a new all-time high without waiting for a halving event to serve as a catalyst.
Despite the disrupted pattern, the halving continues to play a role in Bitcoin’s broader supply picture. Each halving reduces the rate of new Bitcoin issuance, gradually cutting the selling pressure from miners.
Over extended periods, this steady reduction in supply decreases Bitcoin’s overall inflation rate. This mechanism remains a structural support for Bitcoin’s long-term price performance, independent of short-term cycle behavior.

A US federal appeals court has rejected Custodia Bank’s final attempt to challenge the Federal Reserve’s authority over granting master accounts, bringing an end to the crypto-focused bank’s five-year legal fight for direct access to the central bank’s payment infrastructure.
Key Takeaways:
- A US appeals court refused to hear Custodia Bank’s final appeal, ending its five-year fight for a Federal Reserve master account.
- Courts ruled the Federal Reserve has discretion to decide which institutions can access its payment system.
- The case comes as more fintech and crypto firms pursue US bank charters and direct access to the banking system.
The US Court of Appeals for the Tenth Circuit said in a filing on Friday that it would not hear Custodia’s final appeal in a 7–3 vote, effectively closing the case and reinforcing the Federal Reserve’s discretion over who can access its banking services.
Custodia Argued Fed Must Grant Master Account to State-Chartered Banks
Custodia first applied for a Federal Reserve master account in October 2020.
Such accounts allow financial institutions to hold reserves directly at the central bank and connect to its payment rails, enabling banks to settle transactions without relying on intermediary institutions.
After its application was denied, Custodia took the dispute to court, arguing that the Monetary Control Act requires the Fed to provide services to state-chartered banks and therefore entitles it to a master account.
The bank maintained that access to the central bank’s payment system was critical to its operations as a digital asset-focused institution.
However, courts reviewing the case repeatedly sided with the Federal Reserve, concluding that the central bank retains discretion when deciding whether to grant master accounts.
denial of @custodiabank’s fed membership & master account on concerns of “safety and soundness” looks a bit absurd right now
custodia was to be a non-lending fully reserved depository with its cash in a fed account. no asset-liability mismatch, no duration risk@CaitlinLong_
— Alex Thorn (@intangiblecoins) March 10, 2023
The decision arrives shortly after crypto exchange Kraken secured a limited form of direct access to the Federal Reserve system.
On March 4, Kraken became the first crypto platform to obtain a master account from the Federal Reserve Bank of Kansas City.
Kraken’s account allows the firm to connect to the Fedwire payments network, though it does not grant the full suite of services typically available to traditional banks.
The development sparked speculation that US regulators might consider issuing “skinny” or restricted master accounts to crypto firms seeking closer integration with the banking system.
Despite the ruling against Custodia, one judge offered a forceful dissent. Judge Timothy Tymkovich argued that access to a master account is “indispensable” for banks and said denying one is “akin to a death sentence.”
Tymkovich noted that shortly after Custodia submitted its application in 2020, the Federal Reserve initially indicated that the proposal had “no showstoppers.”
He added that he disagreed with the majority’s view that reserve banks have broad discretion over such applications.
Revolut Files Second Bid for US Bank Charter to Expand Nationwide
Fintech company Revolut has filed a new application for a US national bank charter, marking its second attempt to obtain a banking license in the country.
The London-based firm submitted the application to the Office of the Comptroller of the Currency (OCC) and the Federal Deposit Insurance Corporation (FDIC) to establish “Revolut Bank US, N.A.”
If approved, the charter would allow Revolut to operate under a single federal regulatory framework across all 50 US states.
Revolut’s move comes as more fintech and crypto firms seek US bank charters through the OCC.
Recent applicants for national bank charters include Nubank, Crypto.com, Circle, Ripple, BitGo, Fidelity Digital Assets and Paxos, signaling growing interest among fintech and digital asset firms in gaining direct access to the US banking system.
The post Custodia Bank Loses Final Court Appeal Over Federal Reserve Master Account appeared first on Cryptonews.

Billionaire investor Stanley Druckenmiller says blockchain-based tokens, and in particular stablecoins, could power the next wave of global payments within the next decade. Speaking in an interview with Morgan Stanley recorded Jan. 30 and released last week, Druckenmiller framed stablecoins as a productivity boost for merchants and consumers alike, arguing they are faster, cheaper and more scalable than traditional rails. He envisions a future in which much of the payments ecosystem runs on tokenized rails, while reserving skepticism about crypto as a universal store of value. Bitcoin (CRYPTO: BTC) remains his skeptical exception, though he acknowledges some niche use cases. Western Union (EXCHANGE: WU) and MoneyGram (EXCHANGE: MGI) have signaled interest in stablecoin settlements as part of their digitization efforts, and the GENIUS Act has provided a regulatory scaffolding for such initiatives.
Druckenmiller—who founded Duquesne Capital Management in 1981 and later closed the fund in 2010 after a career that delivered an average annual return around 30% with no down years—frames the technology as a productivity lever rather than a reform of money itself. In the Morgan Stanley discussion, he highlighted how tokenized payments could streamline processes that currently rely on legacy rails. The argument rests on a simple premise: stablecoins, as blockchain-based representations of fiat, can cut settlement times, reduce reconciliation complexity and lower fees, especially in cross-border transactions. The discussion aligns with a broader industry push toward on-chain settlement experiments by traditional payments incumbents following the GENIUS Act, which established a regulatory pathway for digital asset services in payments and remittance environments.
Druckenmiller’s case for blockchain-enabled payments hinges on why stablecoins might be preferable to existing mechanisms. He contends that even the most efficient card networks and banks face frictions—intermediaries, FX costs, and delays—that stablecoins can help mitigate. When transactions settle on a blockchain-backed token, the same value can move almost instantaneously and at a fraction of the cost, enabling businesses to optimize cash cycles and consumer experiences. The argument is not that every payment should be tokenized, but that a growing portion of the payment mix could ride on tokenized rails where appropriate, with stablecoins serving as the most practical bridge between fiat currencies and digital settlement layers.
In the same breath, Druckenmiller’s remarks acknowledge the political and regulatory uncertainties that still surround digital assets. The GENIUS Act, which was advanced in July and later shaped the regulatory framework for stablecoin-related services, has provided a degree of clarity for firms seeking to offer digital-asset services in the payment space. The interview notes that legacy players—some already broadening their digital-payments playbooks—are testing stablecoin-based settlement mechanisms to improve efficiency in cross-border flows. In this context, Western Union and MoneyGram have signaled their interest in building out stablecoin settlement capabilities, while Zelle and other traditional rails have also been cited as potential participants in future cross-border and domestic tokenized settlements. The broader implication is that the payments landscape could increasingly mix traditional rails with tokenized alternatives as banks and remittance firms explore these options under regulatory guardrails.
Despite the optimism around stablecoins as a payments catalyst, Druckenmiller remains wary of crypto assets’ role as a store of value. He described Bitcoin as “a solution looking for a problem” and asserted that the asset class does not, in his view, perform the traditional role of a stable store of value. The Morgan Stanley remarks echo a long-running stance: he has previously noted that Bitcoin, despite its narrative appeal, has not found him to be a compelling long-term hold. In a separate 2023 reflection, he compared Bitcoin to gold, but he still argued gold’s longer historical track record and brand strength give it a different standing in his framework. He has also stated he does not own Bitcoin, though he acknowledged that the narrative around crypto can generate broader adoption and speculative demand among audiences that value the technology’s promise.
In the broader arc of Druckenmiller’s commentary, the interview underscores a tension within the crypto discourse: utility and efficiency versus the store-of-value narrative. The truth, as many market observers suggest, may lie in a hybrid reality where stablecoins enable faster, cheaper, and more scalable payments for everyday use while a limited set of assets—like Bitcoin—occupies a niche role in portfolios or as a brand-driven store of value for some investors. The discussion also reflects the ongoing experimentation by traditional finance firms with tokenized settlements and the growing regulatory clarity that could accelerate credible use cases in the near term. While the era of universal crypto-backed money remains contested, the stream of high-profile endorsements and pilots indicates a gradual mainstreaming of tokenized payments as a complement to existing systems.
Why it matters
The conversation signals a practical, near-term shift in how institutions view crypto-enabled payments. If large incumbents pursue stablecoin settlements and tokenized rails, the friction points that dog traditional cross-border payments—latency, settlement risk and FX costs—could be mitigated in meaningful ways for merchants and consumers alike. This matters not just for traders and fintechs but for users who rely on international transfers, remittances and merchant payments. It also frames a more nuanced crypto narrative: utility and efficiency can coexist with skepticism about store-of-value properties, potentially diluting pure hype in favor of tangible improvements in payments infrastructure.
For builders and policymakers, the takeaways are clear. Stablecoins are likely to remain central to pilots and pilots-to-scale pathways, particularly where regulatory clarity is present. The GENIUS Act’s framework appears to have provided a foundation for compliant digital-asset services in payments, which could accelerate institutional experimentation and customer adoption. Regulators, meanwhile, are watching carefully to balance consumer protection with innovation, ensuring that tokenized payments deliver on reliability and security without inviting undue risk to financial systems.
From an investment perspective, the emphasis on productivity gains rather than a universal replacement of fiat money suggests a measured approach: a subset of payments-related assets and networks could benefit from tokenized settlement, while traditional assets may persist in parallel. Druckenmiller’s stance reinforces the view that any significant financial-system overhaul would occur incrementally, with stablecoins bridging the efficiencies of digital technology and the stability of established currencies.
What to watch next
- Regulatory developments on stablecoins and digital-asset service providers in major jurisdictions within the next 6–12 months.
- Announcements from Western Union or MoneyGram related to pilot programs or commercial deployments of stablecoin settlements in emerging markets.
- Progress on the GENIUS Act’s provisions and how financial institutions translate them into operational pilots.
- Ongoing discussions on the role of Bitcoin in portfolios and possible shifts in retail or institutional sentiment toward crypto stores of value.
Sources & verification
- Morgan Stanley interview with Iliana Bouzali from Jan. 30, discussing Druckenmiller’s views on blockchain and stablecoins. https://www.youtube.com/watch?v=FJwBpWSSgSg
- Stablecoin yields and the U.S. banking clarity act article. https://cointelegraph.com/news/stablecoin-yields-united-states-banking-clarity-act-white-house
- Discussion of a ledger-based system potentially replacing USD rails. https://cointelegraph.com/news/billionaire-druckenmiller-says-ledger-based-system-could-replace-usd-worldwide
- Bitcoin versus gold comparison and Druckenmiller’s stance on BTC. https://cointelegraph.com/news/bitcoin-gold-outperform-prediction-macroeconomist-lyn-alden
- Druckenmiller’s comments on Bitcoin and related coverage. https://cointelegraph.com/news/legendary-investor-stanley-druckenmiller-wants-bitcoin
Market reaction and key details
Note: The above narrative draws from public discussions and published interviews that frame blockchain technology and stablecoins as potential accelerants for payments infrastructure. While Druckenmiller remains skeptical about Bitcoin as a store of value, the broader narrative around tokenized settlement continues to unfold through enterprise pilots, regulatory clarifications, and ongoing industry experimentation. For readers seeking a deeper dive, the cited sources provide additional context and primary-source materials surrounding these discussions.
US spot Bitcoin ETFs posted their first five-day inflow streak of 2026, tallying roughly $767.32 million for the week and signaling renewed investor appetite for physical-exposure products amid a volatile macro backdrop. Net inflows on Friday reached $180.33 million, extending a trend that began earlier in the week. The strongest day fell on Tuesday, when spot Bitcoin ETFs drew $250.92 million, according to data from SoSoValue. The run mirrors a late-2025 period when five consecutive days of inflows between November 25 and December 2 delivered about $284.61 million in total. Overall, US spot BTC ETFs now hold about $91.83 billion in net assets, with cumulative net inflows reaching $56.14 billion and roughly $4.93 billion in total value traded on the day. Ether-centered funds have joined the move, underscoring a broad shift toward spot exposure even as macro headwinds persist.
Key takeaways
- US spot Bitcoin ETFs logged their first five-day inflow streak of 2026, totaling approximately $767.32 million for the week.
- Tuesday marked the peak with spot BTC ETFs attracting about $250.92 million in net inflows, the strongest single-day figure of the period.
- Ether ETFs posted a four-day inflow streak, contributing roughly $212.14 million in new liquidity and reversing earlier March outflows.
- Cumulative inflows into US spot Ether ETFs stand at about $11.79 billion, with total net assets near $12.26 billion and around $1.30 billion traded on the day.
- Bitcoin remained range-bound as macro tensions influenced risk sentiment, with short-liquidity clusters near $71,300 and resistance between $72,000 and $73,500.
- ETF assets globally have grown to roughly $91.83 billion in net assets, reflecting sustained demand for spot exposure amid ongoing volatility.
Tickers mentioned: $BTC, $ETH
Sentiment: Neutral
Price impact: Neutral. Persistent inflows have yet to translate into a decisive breakout in price, given macro uncertainty.
Trading idea (Not Financial Advice): Hold. Market participants may wait for clearer macro signals before expanding exposure to spot coin ETFs.
Market context: The week unfolded against a backdrop of heightened geopolitical risk and energy-price volatility, factors that have historically weighed on risk appetite. Analysts note that tensions in the Middle East and pressure on oil markets can dampen aggressive rate-cut expectations, pushing traders toward liquidity and near-term catalysts rather than long-horizon bets. In this environment, Bitcoin and Ether ETFs have shown resilience through inflows that suggest ongoing demand for regulated, transparent access to spot crypto markets.
Why it matters
The resurgence of inflows into US spot Bitcoin and Ether ETFs signals a maturation in the market for regulated crypto exposure. Institutional and retail investors alike have sought regulated vehicles to gain direct crypto exposure without taking on the operational complexities of self-custody, and the latest weekly totals reinforce that demand. The breadth of the inflows—across BTC and ETH—also points to a broader appetite for the two largest by market cap assets, suggesting that current price action may reflect a shift toward accumulation rather than mere tactical trading.
From a price-discovery perspective, sustained ETF liquidity contributes to transparent flows and on-chain price signaling, potentially narrowing the gap between futures dynamics and spot realities. Yet the macro environment—characterized by geopolitical tensions, oil-price volatility, and a wary risk sentiment—continues to cap upside momentum. Traders appear to be prioritizing liquidity and risk management over bold directional bets, keeping BTC in a defined range while Ether fans out similar patterns of activity. The balance between inflows and macro headwinds will likely dictate whether the current pattern of consolidation evolves into a more pronounced move in the coming weeks.
As the data indicate, the market is moving with a preference for regulated, auditable exposure. The ongoing inflows into spot ETFs reduce the opacity of price discovery and may attract a broader pool of buyers who previously steered clear of crypto markets due to custody or regulatory concerns. The broader implications are not limited to price; potential implications for product development, ETF approvals, and the regulatory narrative around crypto exposure could shape investor behavior in the months ahead.
Additionally, observers note that the market is watching liquidity dynamics closely. On the risk-off side, the macro environment has created a structure where support levels and liquidity zones matter as much as absolute price levels. The trading community is digesting the possibility that macro catalysts—such as inflation data or central-bank commentary—could trigger a shift from the current consolidation toward a new regime of volatility or trend direction.
For readers looking for broader context, references to market-related analyses such as Bitcoin’s price catalysts and Ethereum momentum are explored in industry discussions, including pieces like “Bitcoin’s ‘narrative vacuum,’ Ethereum now inevitable: Trade Secrets.”
What to watch next
- Next week’s BTC and ETH ETF inflows, and whether the five-day BTC streak extends or reverses.
- Key resistance around $71,300 and the $72,000–$73,500 zone, and whether a break above or below these levels alters risk sentiment.
- Changes in daily liquidity and trading volumes for spot ETFs as macro indicators (inflation, jobs, geopolitical updates) evolve.
- Continued net asset growth in BTC and ETH ETFs, and the potential impact on custody and regulatory discussions.
Sources & verification
- SoSoValue data on weekly inflows to US spot BTC ETFs, including the $250.92 million Tuesday figure and the $767.32 million weekly total.
- Ether ETF inflow data showing a four-day streak totaling about $212.14 million and related cumulative inflows.
- Metrics on total ETF assets (BTC and ETH) under management, including $91.83 billion in net assets and $56.14 billion in cumulative inflows for BTC ETFs, plus $12.26 billion in Ether ETF net assets and $11.79 billion in cumulative Ether inflows.
- Market analysis on Bitcoin price action and liquidity clusters around $71,300, with resistance in the $72,000–$73,500 range and support near $69,000.
- Historical reference to late November 2025 inflows totaling $284.61 million during a similar five-day stretch.
US spot ETFs extend inflows and Ether momentum amid macro pressure
US spot Bitcoin ETFs posted their first five-day inflow streak of 2026, highlighting sustained demand for regulated exposure in a period of elevated macro risk. The week culminated with a Friday print of $180.33 million in net inflows, adding to a Tuesday surge of $250.92 million—the strongest single-day reading in the period—which underscores persistent appetite for direct BTC exposure even as broader market conditions remain unsettled. In parallel, Ether ETFs captured a parallel narrative of renewed interest, with a four-day inflow sequence contributing to a total of roughly $212.14 million in new liquidity for the week. The combined momentum helped push the assets toward multi-billion-dollar baselines, reinforcing the attraction of regulated avenues for on-chain price discovery.
From the numbers, Bitcoin ETFs now command about $91.83 billion in net assets, with cumulative inflows reaching $56.14 billion and roughly $4.93 billion traded on the day. Ether ETFs, by contrast, have amassed around $11.79 billion in cumulative inflows, with total net assets near $12.26 billion and approximately $1.30 billion traded on the day. This dual strength marks a notable shift from earlier in the year, when inflows were more volatile, and it aligns with a broader pattern of institutions and retail buyers seeking regulated access to crypto markets as liquidity conditions evolve.
The market backdrop remains a critical driver of price action. Heightened tensions in the Middle East and volatility in energy markets have led to cautious risk sentiment, which tends to favor liquidity and short-term positioning over aggressive, long-horizon bets. In this context, Bitcoin has traded within a defined range, with derivatives liquidity heatmaps identifying a key short-liquidity cluster near $71,300—acting as a near-term resistance—while a broader concentration sits between $72,000 and $73,500. On the downside, liquidity support sits around $69,000, with more pronounced long-liquidation risks near $68,800. These dynamics suggest that BTC could continue to consolidate absent a macro catalyst capable of triggering a decisive breakout.
Within industry coverage and market literature, some pieces discuss broader crypto price catalysts and the evolving narrative around Ethereum’s momentum, while others examine the potential impact of evolving ETF product strategies on the asset class. For readers exploring deeper analysis, related stories include discussions about Bitcoin price catalysts, Ethereum momentum, and trade secrets in the crypto space.

TLDR
- Executive VP Paul Darren Grasby offloaded 7,500 shares of AMD at approximately $204.87 per share on March 11, totaling $1.54M and reducing his holdings by 5.47%.
- Shares declined 2.2% on Friday, reaching an intraday low of $192.27 with trading volume 30% below average.
- Recent quarterly earnings exceeded expectations: EPS of $1.53 (vs. $1.32 estimate) with revenue of $10.27B, representing 34.1% year-over-year growth.
- Wall Street maintains a “Moderate Buy” consensus with an average price objective of $290.53; price targets span from $240 (Goldman Sachs) to $358 (Evercore).
- Challenges include emerging Chinese GPU competition, Meta’s internal chip development efforts, and macroeconomic pressures affecting the semiconductor industry.
Shares of Advanced Micro Devices tumbled 2.2% on Friday following news that a top executive had divested $1.54 million in company stock days earlier. Paul Darren Grasby, who serves as Executive Vice President and Chief Strategy Officer, sold 7,500 shares at an average price of approximately $204.87 on March 11.
Advanced Micro Devices, Inc., AMD
The chipmaker’s shares touched an intraday bottom of $192.27 during Friday’s trading session before settling at $193.39. This represented a decline from the prior session’s closing price of $197.74.
Approximately 27.4 million shares changed hands on Friday — about 30% lighter than AMD’s typical daily volume of 39 million shares. The reduced trading activity indicates the price movement wasn’t fueled by widespread selling pressure.
Following the transaction, Grasby maintains ownership of 129,598 AMD shares, worth approximately $26.5 million based on the sale price. The 5.47% stake reduction was disclosed to the SEC through a mandatory Form 4 filing required for corporate insiders.
While insider transactions don’t necessarily indicate negative sentiment — executives divest shares for various personal reasons including portfolio diversification and tax strategies — the timing caught market attention amid AMD’s roughly 7.7% year-to-date decline.
Recent Quarterly Performance Exceeded Expectations
AMD’s latest quarterly earnings, unveiled on February 3, delivered impressive results that surpassed Wall Street forecasts. The semiconductor manufacturer reported earnings per share of $1.53, exceeding the analyst consensus of $1.32 by $0.21.
Quarterly revenue reached $10.27 billion — representing a 34.1% increase compared to the year-ago period and topping analyst projections of $9.65 billion. The company’s EPS showed significant improvement from the prior year’s $1.09.
Wall Street expects the company to deliver $3.87 in full-year earnings per share.
The company’s financial position appears robust. Its debt-to-equity ratio stands at a modest 0.04, while maintaining a current ratio of 2.85 and quick ratio of 2.01. The price-to-earnings multiple of approximately 73 appears elevated, though the price-to-earnings-growth ratio of 0.77 indicates reasonable valuation when accounting for growth prospects.
Recent strategic developments include a multi-year patent licensing agreement with Adeia and the introduction of new AI-focused products at MWC 2026, featuring Ryzen AI Embedded processors and telecommunications AI solutions.
Wall Street Price Targets Show Wide Dispersion
Analyst sentiment on AMD remains predominantly constructive, though price target expectations vary considerably. Goldman Sachs maintains a neutral stance with a $240 price objective. UBS projects a $310 target. Evercore shows greater optimism with an outperform rating and $358 target.
According to MarketBeat data, the collective analyst consensus stands at “Moderate Buy” with an average price target of $290.53 — representing substantial upside from current levels.
Among analysts tracking AMD, 29 rate it a Buy, one assigns a Strong Buy, and 10 recommend Hold. No analysts currently rate the stock as a Sell.
Multiple challenges loom on the horizon. Chinese semiconductor firm Lisuan Technology recently unveiled GPU products that sparked concern across AMD and Nvidia investor bases. Meta’s initiative to design proprietary AI chips threatens to diminish demand from major third-party customers.
Broader macroeconomic factors — including elevated oil prices, geopolitical instability, and export restrictions on AI chips — have created additional pressure across the semiconductor sector.
AMD currently trades below both its 50-day moving average of $216.76 and its 200-day moving average of $209.62.
As of Friday’s market close, AMD’s market capitalization stood at roughly $315 billion.
Crypto World
Pi Network’s PI Token Erases Recent Gains, Bitcoin (BTC) Slips Toward $70K: Weekend Watch
Pi has plunged by over 30% in the past 24 hours. The gains charted after the Kraken listing have been pretty much erased.
Bitcoin’s price rally to $74,000 came to a quick halt, as it did during the previous attempt, and BTC is close to breaking below $70,000 after the latest massive attacks against Iran.
Most altcoins are in the red as well, with ETH slipping below $2,100, and ADA dropping by over 4% daily. CC is among the few exceptions today.
BTC Slides Toward $74K
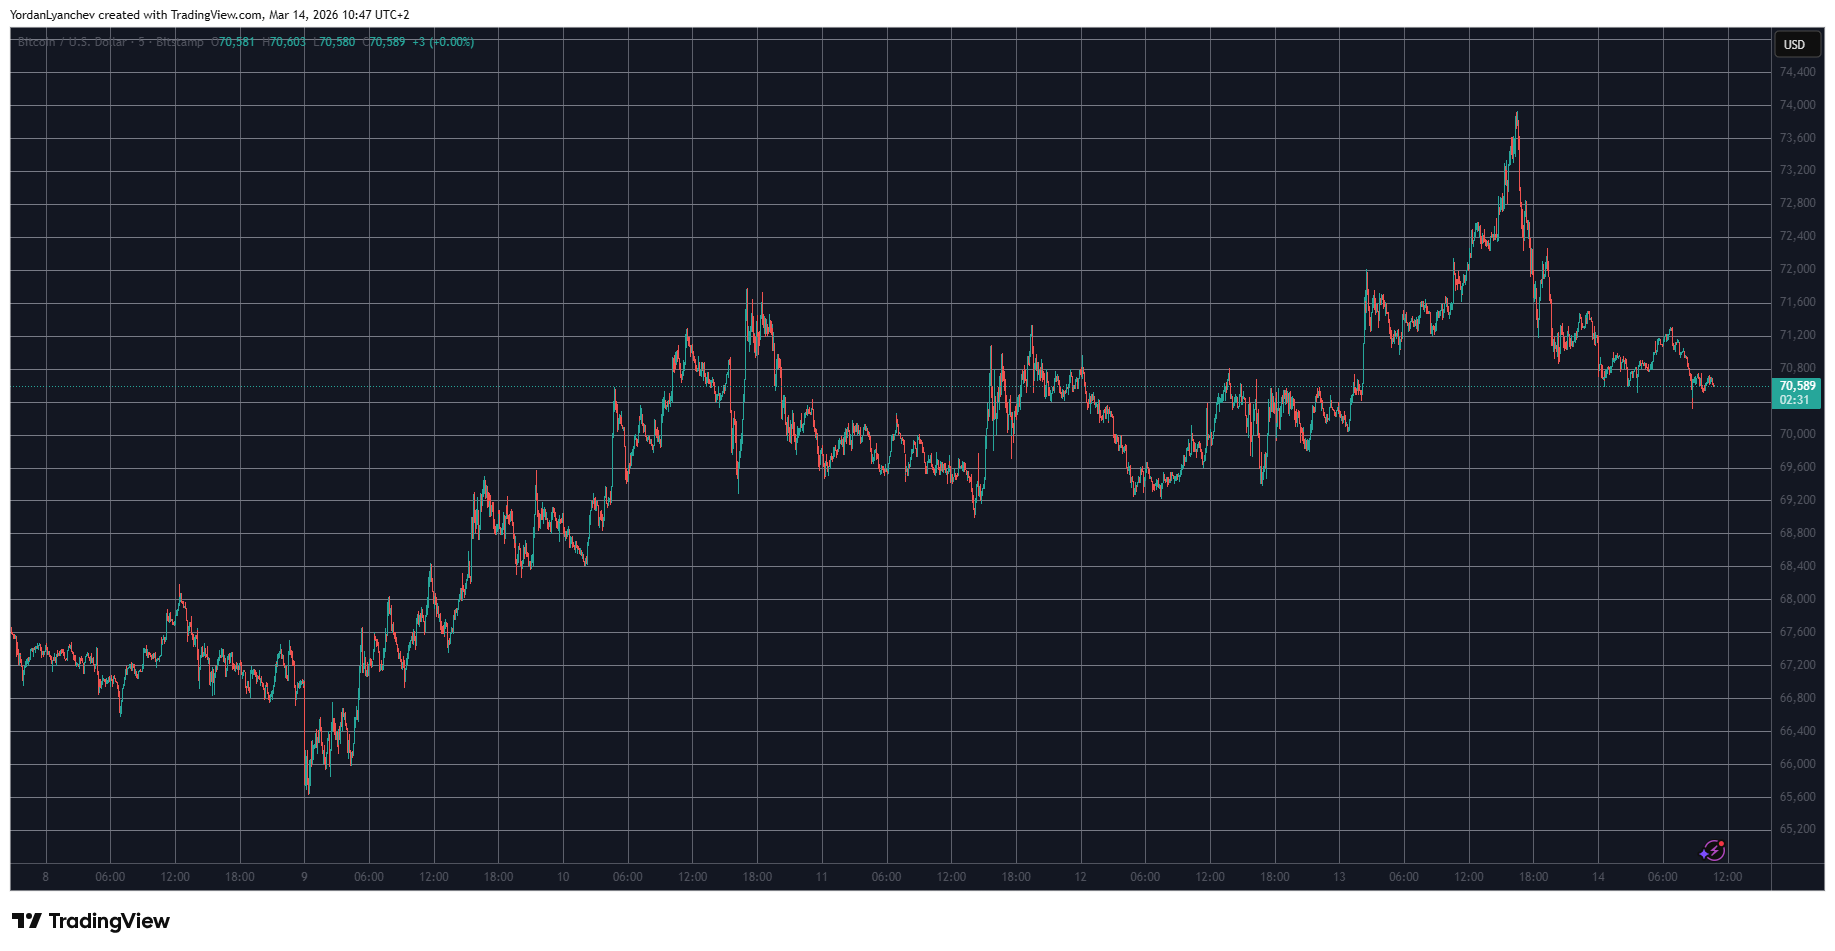
The quickly escalating situation in the Middle East continues to impact most of bitcoin’s price moves. The asset dipped to $65,600 last Monday morning when most legacy financial markets opened for trading after the second weekend of the conflict. However, it rebounded quickly and challenged $70,000 on Wednesday.
Although it failed at first, the rather positive CPI numbers for February and Trump’s somewhat promising remarks about the war sent it flying to $71,800. It was stopped there at first and dropped to $69,000, but went hard on the offensive on Friday.
In less than a whole trading day, bitcoin shot up to a 10-day peak of $74,000. However, it was rejected immediately after it touched that line and fell to under $71,000. The latest attacks, which were described as some of the most devastating in the Middle East region, pushed it toward $70,000, a level that the bulls are currently trying to defend.
Its market cap has declined to $1.410 trillion, while its dominance over the alts is slightly below 57% on CG.

PI Plummets
Pi Network’s native token has been the most volatile in the crypto industry lately, and the past 24 hours have solidified this trend. However, it’s in the opposite direction now. After rocketing to $0.30 yesterday on the hype of the big listing on Kraken, the token has plummeted by over 31% as of now, and it’s struggling to remain above $0.20 as of press time.
Meanwhile, most larger-cap alts are also in the red, but in a significantly less violent manner. ETH is beneath $2,100 after a 1.3% daily drop, and BNB is down to $650 after a 2% decline. XRP struggles at $1.40, SOL is down to $87, while ADA has dumped by over 4%. CC has defied the market-wide correction, with a 5% increase to $0.155.
The total crypto market cap has erased roughly $100 billion since yesterday’s peak and is down to $2.480 trillion on CG.

Binance Free $600 (CryptoPotato Exclusive): Use this link to register a new account and receive $600 exclusive welcome offer on Binance (full details).
LIMITED OFFER for CryptoPotato readers at Bybit: Use this link to register and open a $500 FREE position on any coin!
Disclaimer: Information found on CryptoPotato is those of writers quoted. It does not represent the opinions of CryptoPotato on whether to buy, sell, or hold any investments. You are advised to conduct your own research before making any investment decisions. Use provided information at your own risk. See Disclaimer for more information.

Buying access to a sitting U.S. President Trump usually requires a maxed-out Super PAC donation, not a wallet full of meme coins. Yet here we are, with on-chain holdings effectively acting as tickets to Mar-a-Lago.
Fight Fight Fight LLC, a company affiliated with the viral $TRUMP memecoin, is planning to host its top 297 investors at Donald Trump’s Florida club next month.
The event, slated for April 25, is advertised as “The Most Exclusive Crypto & Business Conference in the World” and promises a luncheon with Trump as the keynote speaker.
Furthermore, the top 29 holders get an invite to an even more exclusive reception and champagne toast with the President himself.
There is a significant scheduling conflict, however. April 25 is the same night as the White House Correspondents’ Association dinner in Washington, D.C., an event Trump is expected to attend for the first time.
Administration officials have stated the Mar-a-Lago event is not currently on the President’s schedule, raising questions about whether he’ll actually turn up at Mar-a-Lago.
The organizers have included a disclaimer noting that if Trump cannot attend the “all-day event,” they will reschedule it, or attendees will receive a limited edition NFT instead. This uncertainty introduces a layer of risk for crypto investors who have held onto their bags specifically for this purpose.
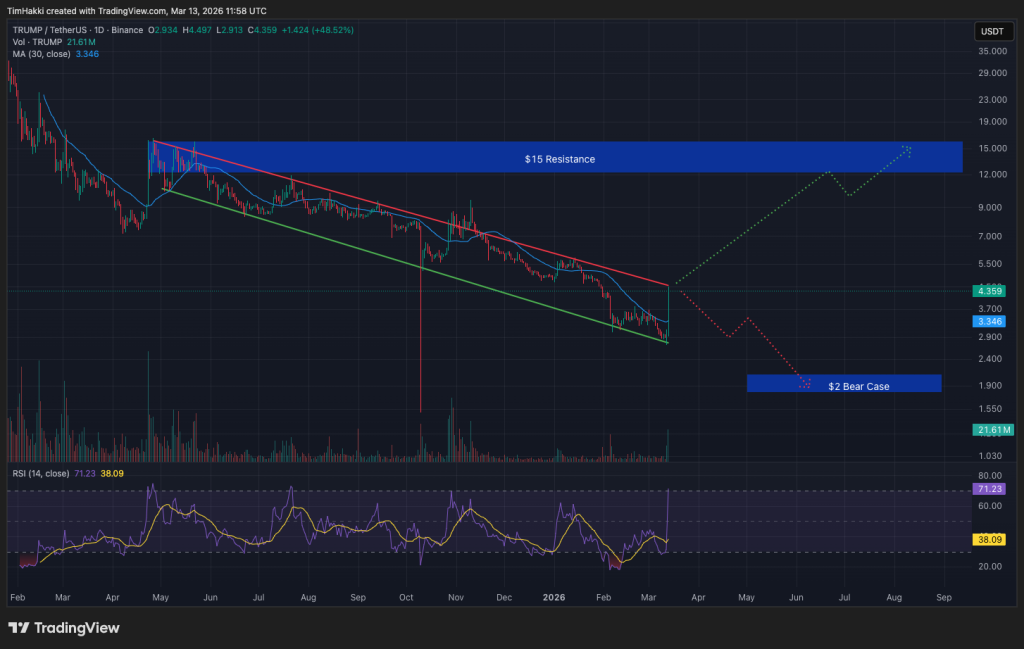
TRUMP Price Action: Buy the Rumor, Sell the Meme Coin?
The announcement triggered immediate volatility for the $TRUMP token. The price rallied 53% on the news to hit $4.37, a level not seen since January 31.
This behavior is typical of the high-stakes PolitiFi sector, where headlines often drive price action more than fundamental tokenomics.
The token’s top holders are a mix of pseudonymous whales and known industry figures, with previous events attracting major international players.
While the broader meme market has seen massive volume on platforms like Solana, where revenues for launchpads like Pump.fun have hit the billions, $TRUMP remains unique because its utility stems from giving holders direct physical access to political power.
If the meeting occurs, it validates the thesis that digital assets can serve as modern political donor tiers. If it fails or results in an NFT consolation prize, the resulting sell-off could be severe.
The token is currently trading at a market cap of approximately $2.7 billion, making it a heavyweight asset that can move significantly on logistical updates alone.
The Crypto President’s TRUMP Coin Draws Scrutiny and Praise Alike
This event underscores the blurred lines between the current administration and the crypto industry.
Trump has ushered in a drastically friendlier regulatory environment, but direct commercial engagements with token holders continue to draw scrutiny from ethics watchdogs.
Regulators are already in a complex position. With agencies moving toward clearer frameworks, like the recent coordination deals between the SEC and CFTC, the existence of a Trump-affiliated meme coin creates a unique compliance paradox.
Any forthcoming official comments from the White House that confirm his attendance will likely be the primary catalyst for the token’s price action leading up to April 25.
The post TRUMP Memecoin Investors Offered Mar-a-Lago Presidential Meeting appeared first on Cryptonews.
Dollar Extends Gains as Iran Conflict Shows No Signs of Abating
The true story behind “Marty Supreme”: How real-life ping-pong legend Marty Reisman inspired the Oscar contender

XRP – WE HAVE A BIG PROBLEM! (THE FIX IS…)


-
 Tech3 days ago
A 1,300-Pound NASA Spacecraft To Re-Enter Earth’s Atmosphere
-

 News Videos5 days ago
10th Algebra | Financial Planning | Question Bank Solution | Board Exam 2026
-

 Crypto World5 days ago
Paradigm, a16z, Winklevoss Capital, Balaji Srinivasan among investors in ZODL
-

 Business4 days ago
ExxonMobil seeks to move corporate registration from New Jersey to Texas
-
Crypto World7 hours ago
HYPE Token Enters Net Deflation as HyperCore Buybacks Outpace Staking Rewards
-

 Fashion17 hours ago
Weekend Open Thread: Addict Lip Glow
-

 Tech4 days ago
ChatGPT will now generate interactive visuals to help you with math and science concepts
-

 Sports7 days ago
Three share 2-shot lead entering final round in Hong Kong
-

 Sports6 days ago
Braveheart Lakshya downs Lai in epic battle to enter All England Open final | Other Sports News
-

 NewsBeat3 days ago
Residents reaction as Shildon murder probe enters second day
-

 Business6 days ago
Search for Nancy Guthrie Enters 37th Day as FBI Probes Wi-Fi Jammer Theory
-

 Business3 days ago
Search Enters Sixth Week With New Leads in Tucson Abduction Case
-
 NewsBeat4 days ago
Pagazzi Lighting enters administration as 70 jobs lost and 11 stores close across Scotland
-

 Tech5 days ago
Despite challenges, Ireland sixth in EU for board gender diversity
-

 Business5 days ago
Search Enters 39th Day with FBI Tip Line Developments and No Major Breakthroughs
-

 NewsBeat3 days ago
I Entered The Manosphere. Nothing Could Prepare Me For What I Found.
-

 Sports5 days ago
Skateboarding World Championships: Britain’s Sky Brown wins park gold
-

 Crypto World4 days ago
Will Chainlink price reclaim $10 amid volatility squeeze?
-

 Sports5 days ago
Tomorrow’s Top 25 Today: Florida jumps to No. 4; Louisville, Wisconsin enter projected rankings
-

 Politics3 days ago
Trump Says Middle East Is ‘Very Lucky’ That He’s President