

Crypto World
Ripple (XRP) ETFs Lose Investor Momentum
Moreover, the overall negative streak stretches out to March 5.
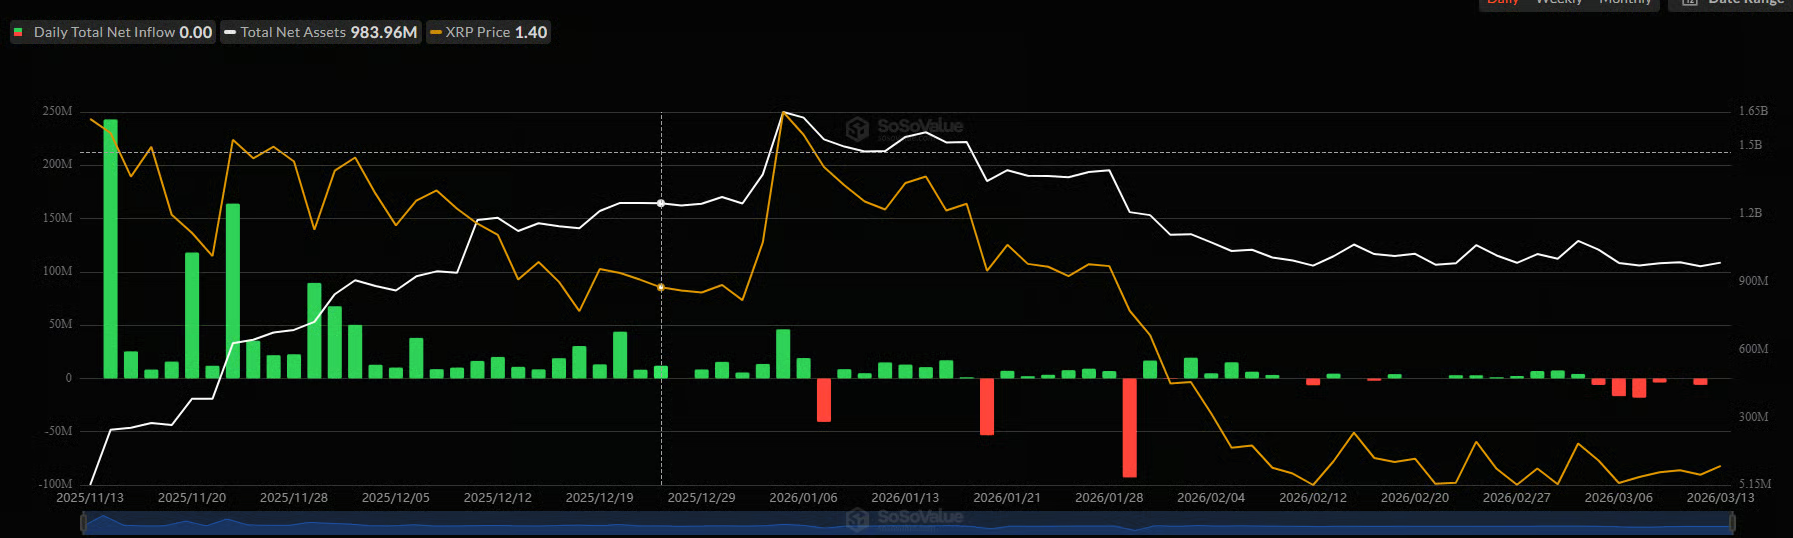
The demand for the spot XRP ETFs in the United States has seemingly evaporated as the funds have not seen a single day of net inflows for over one whole week.
Nevertheless, the underlying token managed to post some gains over the past week before it was halted at $1.45.
XRP ETFs See Investor Exodus
The exchange-traded funds tracking the performance of the cross-border token enjoyed their initial honeymoon period that lasted roughly a month, in which they attracted over $1 billion in cumulative net flows. However, they began to slowly disappear from investors’ radar. The first two warning signs were observed on January 7 and 20 when $40.80 million and $53.32 million were pulled out of the funds.
January ended with another mass withdrawal of $92.92 million on January 29, and the overall month was just slightly in the green – $15.59 million; a figure significantly lower than the $666.61 million seen in November and $500 million in December.
February picked up the pace, as the total monthly inflows stood at $58.09 million. However, more warning shots were seen as there were days with zero net inflows. Such trading days returned in the previous week – SoSoValue shows $0.00 reportable inflow data for March 11 and March 13. Moreover, the other three trading days were in the red, with $18.11 million leaving the funds on Monday, $3.88 million on Tuesday, and $6.08 million on Thursday.
This negative streak extends to the previous business week. In fact, the funds have not seen a green day since March 4.

XRP Price Ascent Halted
Despite the investor exodus, XRP’s price fared rather well in the past week, jumping from a Monday low of $1.34 to a multi-week peak of just over $1.45. However, it was stopped there and now struggles below $1.40.
You may also like:
Its most recent price moves have been contained in a relatively tight trading range, which has prompted many analysts to suggest that there’s a big move in the making. Ali Martinez, for example, noted a few days ago that XRP’s Bollinger Bands have been squeezing, hinting at a major breakout soon.
He doubled down earlier today, saying that XRP’s current triangular consolidation is approaching its tipping point, with a 30% price move brewing.
$XRP is consolidating in a triangle, hinting at a 30% price move. pic.twitter.com/lgjOWKUBHU
— Ali Charts (@alicharts) March 14, 2026
Binance Free $600 (CryptoPotato Exclusive): Use this link to register a new account and receive $600 exclusive welcome offer on Binance (full details).
LIMITED OFFER for CryptoPotato readers at Bybit: Use this link to register and open a $500 FREE position on any coin!

Ethereum is still in recovery mode, but the rebound is starting to look more organized than before. The asset continues to hold above the February base and is pressing closer to a key breakout area, which suggests buyers are gradually gaining confidence even if the larger trend has not fully turned yet.
Ethereum Price Analysis: The Daily Chart
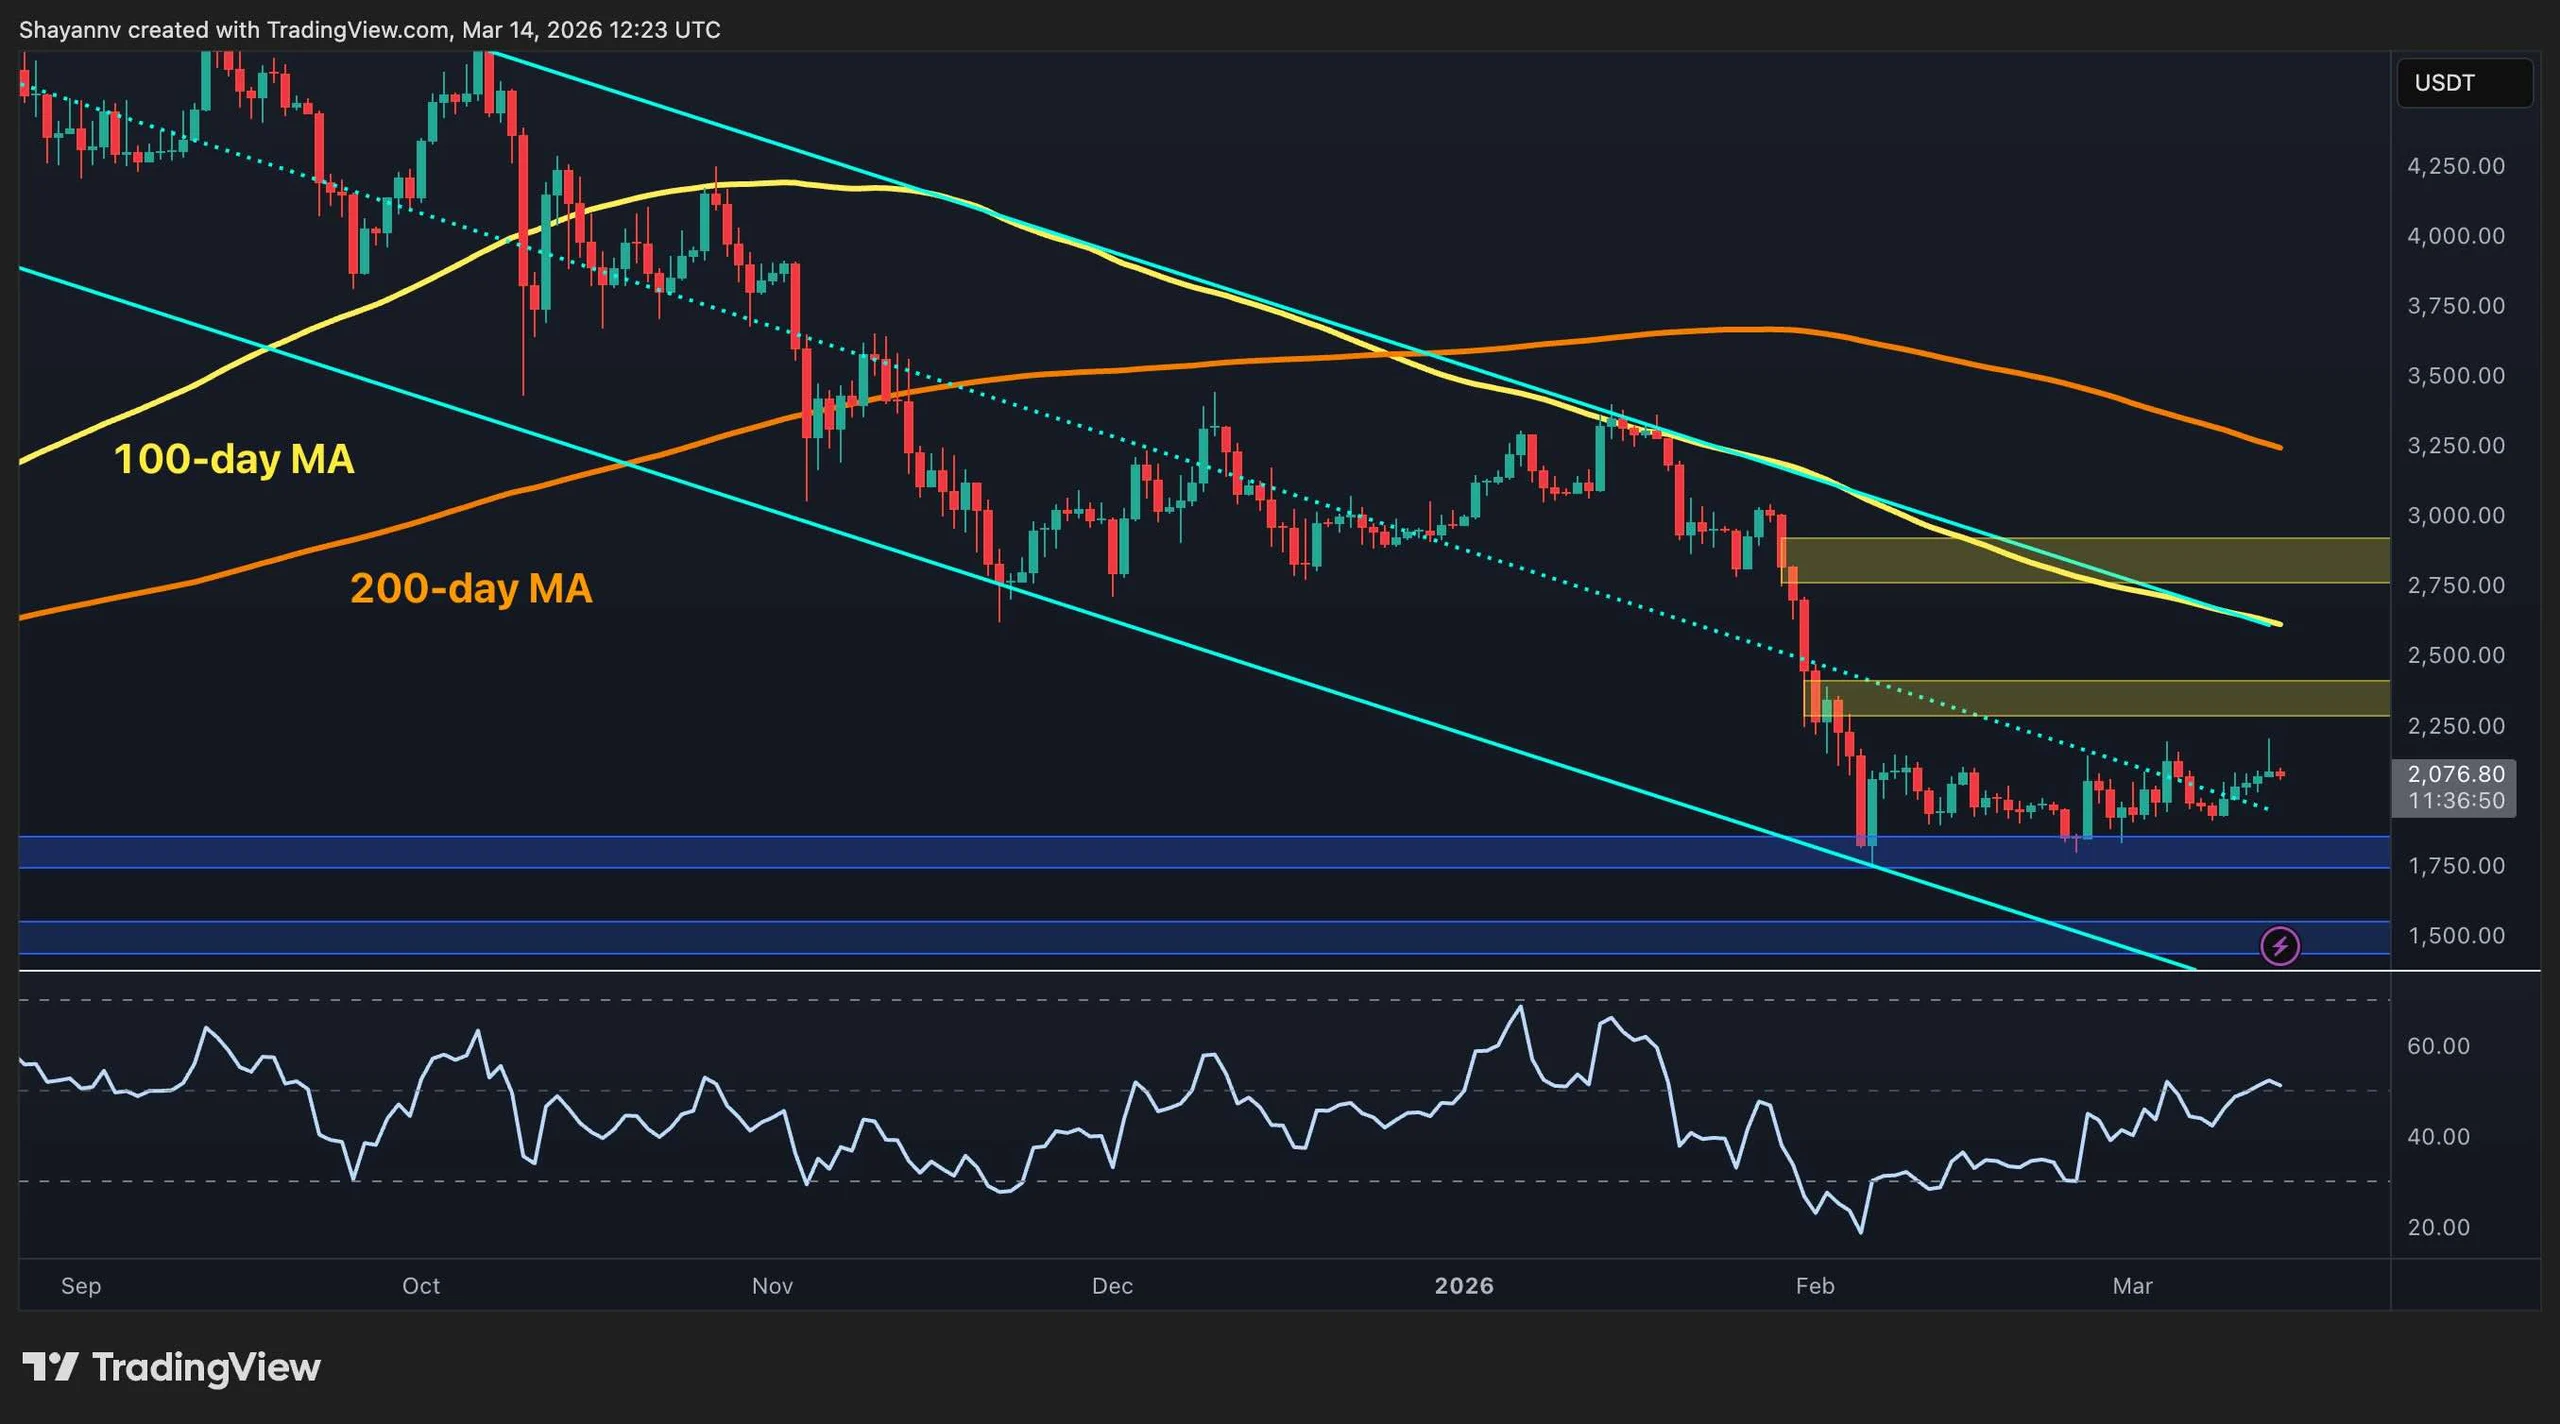
The daily chart still carries the scars of the broader downtrend. ETH remains below the 100-day and 200-day moving averages, and both are still sloping in a way that favors sellers on the higher timeframe. The descending structure from the prior months also remains intact, so the market is not out of danger yet.
Even so, the picture has improved at the margin. Ethereum has spent several weeks defending the $1,800 zone and has now pushed back toward the $2,150 short-term resistance area again. If that ceiling breaks, the next upside region to watch sits around $2,300 to $2,400, while the much larger barrier remains near $2,800. On the downside, losing the $1,800 support cluster would weaken the recovery thesis considerably and likely lead to another round of decline capitulation.

ETH/USDT 4-Hour Chart
On the 4-hour chart, ETH looks more constructive than it does on the daily. The market has been printing a sequence of higher lows from the February bottom, and the rising trendline underneath the price shows that dip buyers are still active. That does not guarantee a breakout, but it does show that the short-term structure is leaning upward rather than flat or weak.
What matters now is the repeated test of $2,143. The asset has reached that level several times, which usually makes the next reaction important. A decisive move through it could trigger a fast push into the next supply zone around $2,400 and possibly higher. Another rejection, however, would likely keep ETH rotating sideways and send it back toward the trendline and the $1,800 support area.

Sentiment Analysis
Funding data shows that sentiment is no longer fearful, but it is not overheated either. Rates are mostly positive, which means long positioning is present, and traders are generally leaning bullish, yet the readings are still relatively moderate compared to the stronger speculative phases seen in the past.
That is usually a healthier backdrop than an aggressively crowded long market. In other words, sentiment is supportive, but not euphoric. This gives ETH room to extend higher if price confirms with a breakout, though it also means the market still needs spot follow-through rather than relying purely on leveraged optimism.

Binance Free $600 (CryptoPotato Exclusive): Use this link to register a new account and receive $600 exclusive welcome offer on Binance (full details).
LIMITED OFFER for CryptoPotato readers at Bybit: Use this link to register and open a $500 FREE position on any coin!
Disclaimer: Information found on CryptoPotato is those of writers quoted. It does not represent the opinions of CryptoPotato on whether to buy, sell, or hold any investments. You are advised to conduct your own research before making any investment decisions. Use provided information at your own risk. See Disclaimer for more information.
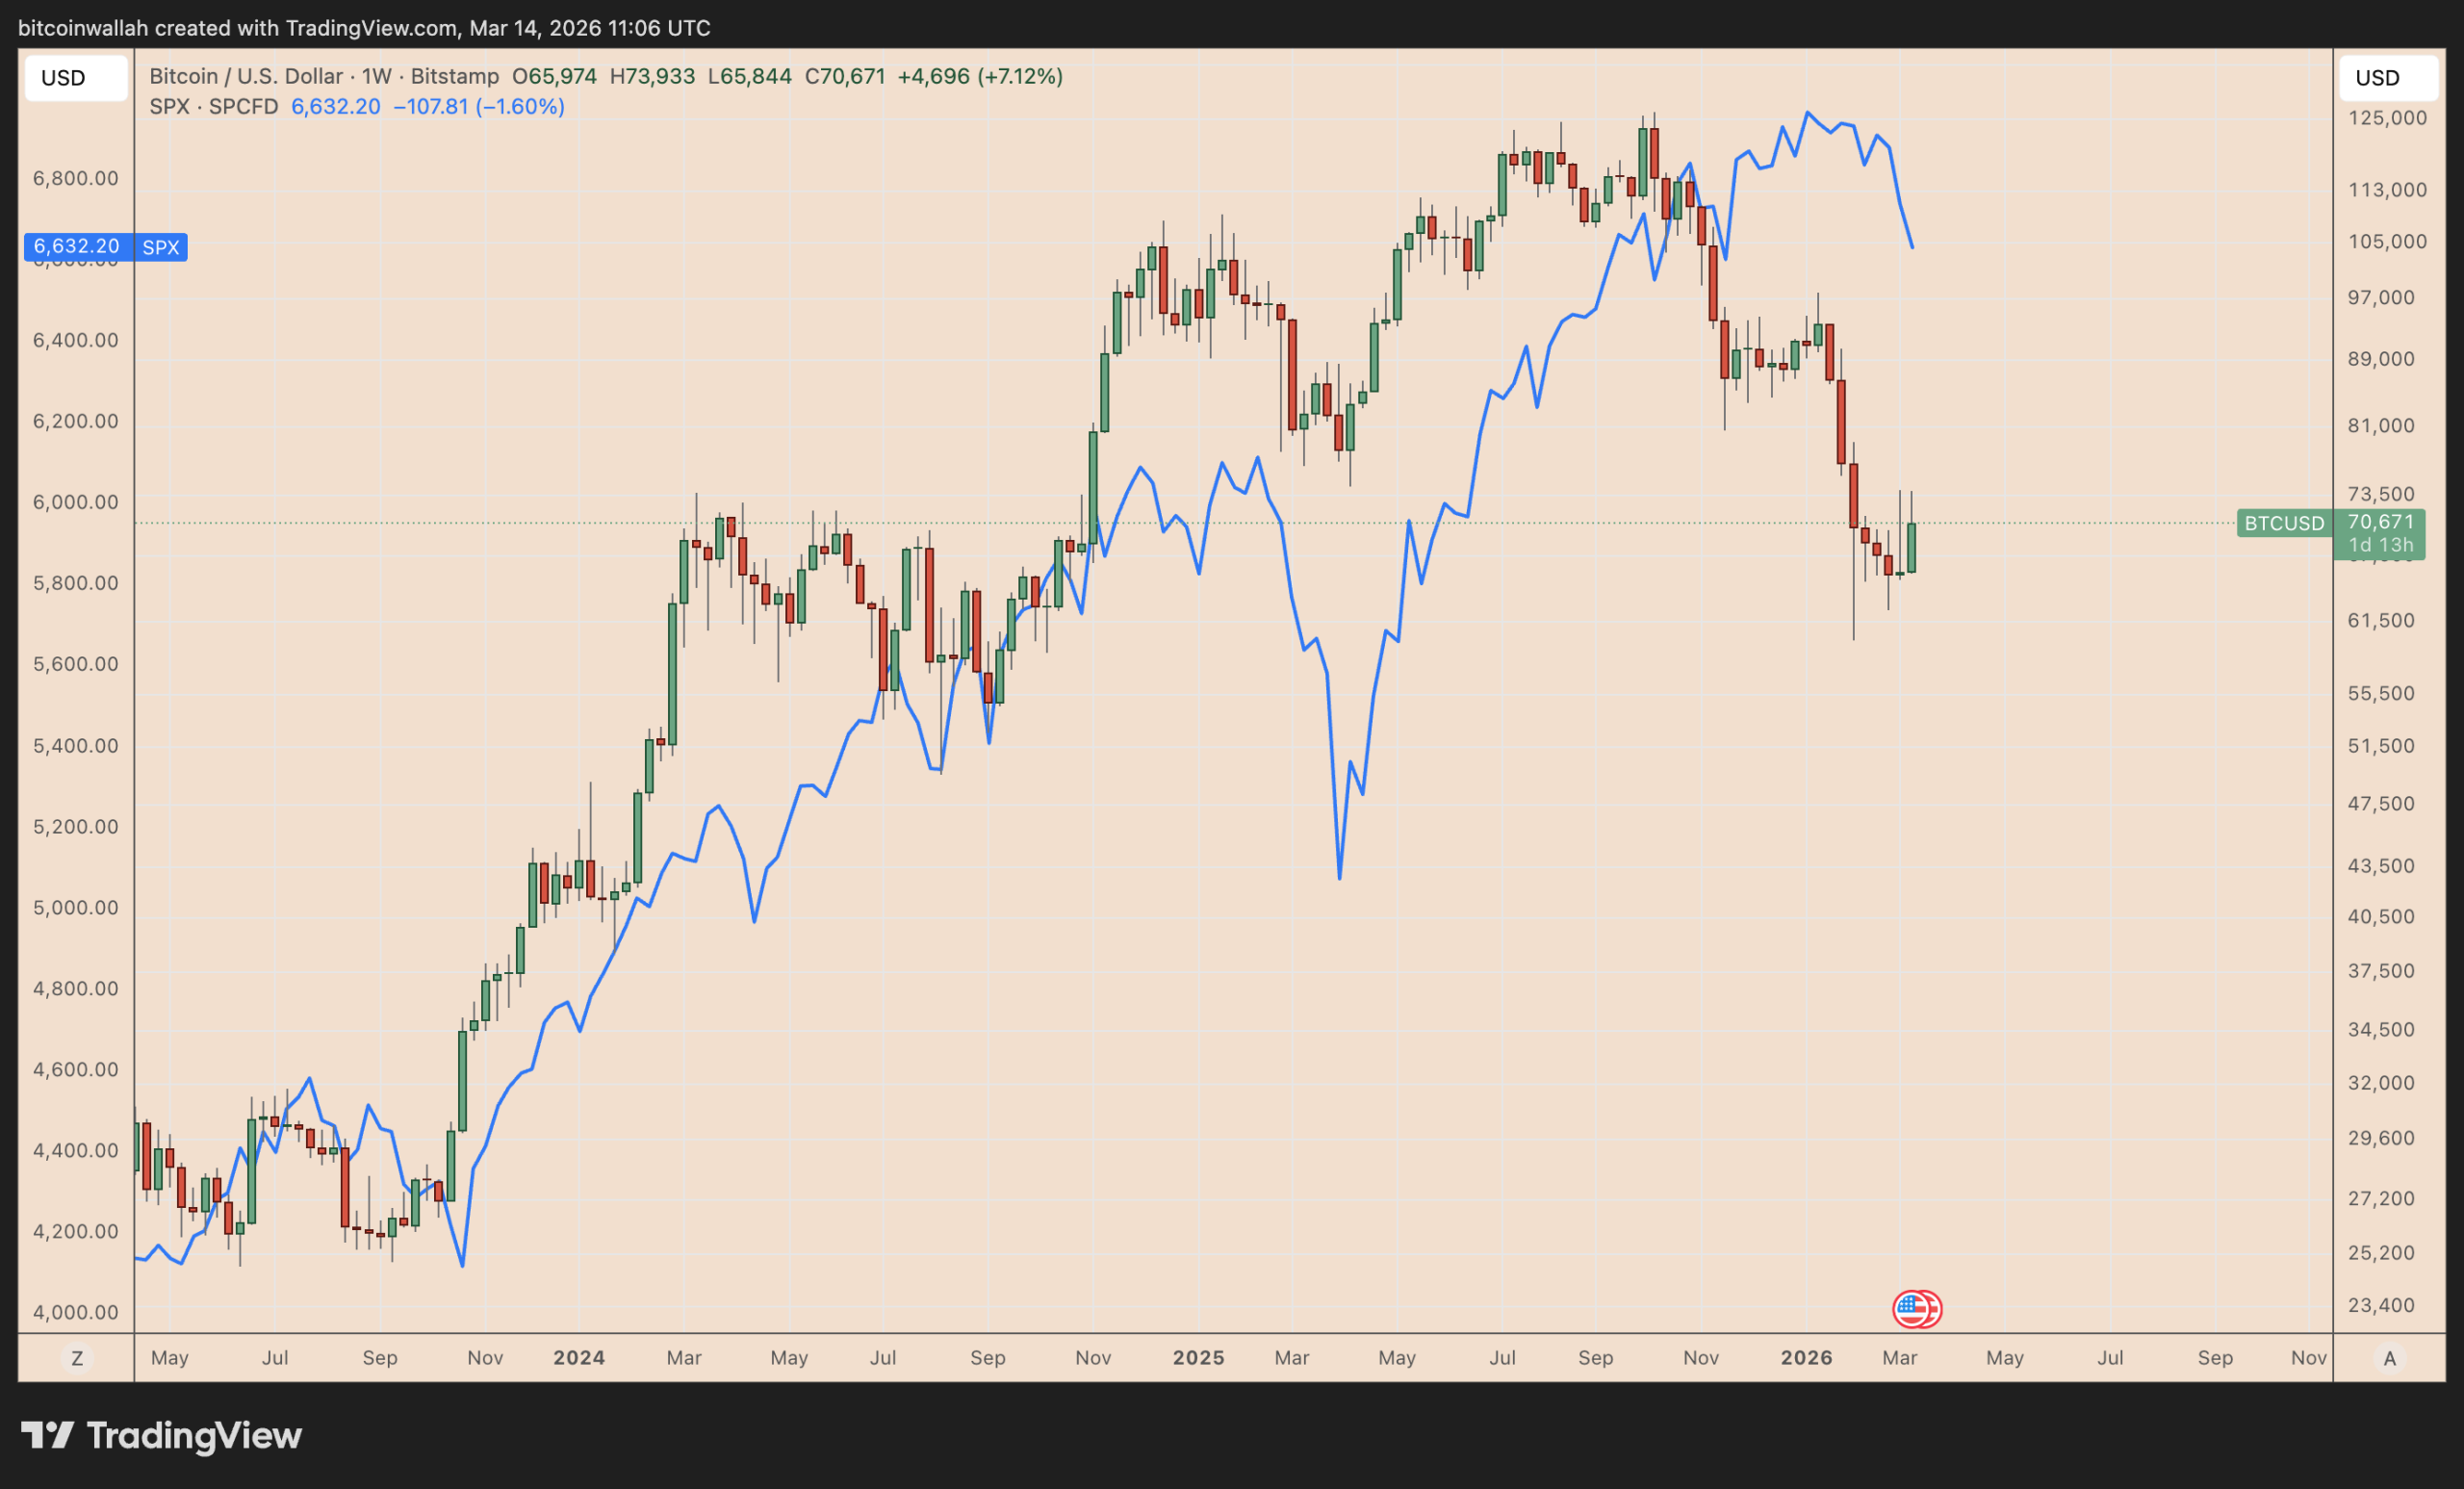
Bitcoin (BTC) is on track for its strongest weekly gain since September 2025, defying a broader risk-off backdrop driven by the escalating US and Israel-Iran war.
Key takeaways:
-
Strategy raised $776 million this week, which could lead to the purchase of over 11,000 BTC.
-
US Bitcoin ETFs had $767 million in inflows in the same period.
STRC hints at $776 million in Bitcoin buying power
As of Saturday, BTC/USD had risen more than 7% over the past week to around $70,625. Over the same period, the benchmark S&P 500 (SPX) was down 1.60%.

The divergence came as STRC.LIVE estimates indicated that Strategy may have raised enough cash through at-the-market sales of its STRC instrument this week to buy more than 11,000 BTC.
At current prices, that would amount to roughly $776 million in Bitcoin.

STRC is Strategy’s exchange-traded income-paying instrument that helps it raise investor cash for Bitcoin buys. When it trades at or above its $100 par value, Strategy can issue more shares and turn that demand into fresh BTC-buying capital.
Related: Bitcoin ‘passing geopolitical stress test’ as BTC price spikes above $72K
Last week, Strategy had purchased 17,994 BTC, equivalent to about $1.28 billion at that time. About 30% of the BTC allocation was funded by STRC sale proceeds.
Bitcoin’s price was also boosted by US spot Bitcoin ETFs, which attracted $767 million in net inflows across five straight trading days, reflecting growing demand for BTC despite the Middle East crisis.
Bitcoin gains during geopolitical crises
In the past, Bitcoin has experienced selloffs at the start of major geopolitical conflicts, only to recover and deliver larger gains.
In February 2022, Russia’s invasion of Ukraine caused an initial dump, but was followed by a 40% BTC price rally, as shown below.

A similar sequence played out after Israel’s June 2025 strikes on Iran. Bitcoin dipped in the immediate aftermath, then flipped higher, gaining about 25% over the next two months.
During the January 2020 US–Iran flare-up after General Qasem Soleimani’s killing, Bitcoin rose more than 50% overall, even though the first reaction included a brief price drop.

Bitcoin price may rise further if history is any indication, with macro models hinting at an escalation toward $100,000 in the coming months.
Bear flag keeps BTC’s downside risks intact
Conversely, a bear flag formation on the Bitcoin chart increases the likelihood of a bull trap.
Bear flags form when the price rises inside an ascending, parallel channel after a strong downtrend. They usually resolve when the price breaks below the lower boundary and falls by as much as the previous downtrend’s height.
As of Saturday, Bitcoin showed signs of upside exhaustion near the flag’s upper boundary, also aligning with the 50-day exponential moving average (50-day EMA, the red line) at around $72,750.

Applying the bear flag principle to Bitcoin’s chart places the measured downside target at around $51,000.
This article does not contain investment advice or recommendations. Every investment and trading move involves risk, and readers should conduct their own research when making a decision. While we strive to provide accurate and timely information, Cointelegraph does not guarantee the accuracy, completeness, or reliability of any information in this article. This article may contain forward-looking statements that are subject to risks and uncertainties. Cointelegraph will not be liable for any loss or damage arising from your reliance on this information.

Ether surged to a monthly peak near $2,209 on Friday before retreating and failing to sustain a move beyond a resistance level that has capped gains on five occasions since February. On-chain indicators point to a sizable cohort of investors with cost bases clustered around $2,800, suggesting meaningful demand in that zone. Meanwhile, futures market activity shows traders trimming risk after the week’s rally, signaling a cautious stance even as spot demand strengthens. Taken together, the setup places ETH at a crossroads: a clean break above current congestion could invite a faster move toward the $2,800 area, while the clock remains on the side of risk management in the near term.
Key takeaways
- On-chain cost-basis distribution identifies a heavy accumulation near $2,800, with more than 3 million ETH previously purchased in that band.
- The price has tested the $2,200–$2,400 range multiple times this year, with the 200-day moving average converging near the $2,800 zone on the daily chart.
- Futures open interest expanded during the rally, rising about 21% to $10.9 billion as ETH approached $2,200, then declined roughly 6% after the upper range was tested.
- Spot demand improved during the move, with the spot-volume cumulative delta turning positive, suggesting buyers stepped in as ETH rebounded from the $2,000 region.
- Derivatives positioning remained balanced, with long exposure on Binance accounting for about 59% of futures position, signaling potential for choppy action near key resistances.
- Near-term dynamics point toward a potential acceleration toward the $2,800 zone if supply concentration remains thin between $2,200 and that level.
Tickers mentioned: $ETH
Sentiment: Neutral
Price impact: Negative. The pullback after testing the upper range indicates near-term downside pressure unless demand re-asserts itself.
Trading idea (Not Financial Advice): Hold.
Market context: The market remains attentive to on-chain accumulation signals and how derivatives positioning interacts with price movement, all within a broader backdrop of cautious risk appetite and macro uncertainty.
Why it matters
From a market context perspective, the convergence of on-chain and derivatives signals matters because it highlights a potential floor beneath ETH’s price and a ceiling that could invite renewed pressure. The heavy accumulation around $2,800 suggests that a large cohort of participants view that price as a long-run entry zone or a critical defense level, which can act as a magnet if prices march higher. If ETH can clear the $2,800 barrier with conviction, liquidity dynamics could shift more decisively in favor of bulls, potentially turning the current range into a launching pad for a sustained up-leg.
On the other side, the futures market’s cautious tilt—illustrated by a 21% jump in open interest during the rally followed by a ~6% pullback after the upper bound test—signals participants are managing risk rather than doubling down on leverage. This balance often translates into range-bound or choppy price action as traders wait for clearer catalysts. The spot market’s improving demand, evidenced by a positive shift in the cumulative delta, shows that buyers stepped in when ETH dipped toward the $2,000 mark, lending some credibility to a resilient bid there. Still, the lack of overwhelming liquidity just below the $2,800 cluster implies that a decisive break could hinge on broader market momentum or a new flow of fundamental news.
Regulatory and governance context also influences sentiment. Notably, discussions around the Ethereum Foundation’s mandate and goals have surfaced, underscoring that organizational evolution and mission clarity can indirectly affect network development and investor perception. For those tracking longer-term risk, the combination of on-chain accumulation patterns and a balanced derivatives backdrop emphasizes the importance of monitoring liquidity flows, hurdle levels, and macro catalysts that could tip the balance toward or away from a sustained ascent toward the $2,800 area. As these dynamics unfold, traders will likely keep a close eye on whether the current structure holds or yields a breakout that accelerates ETH’s trajectory.
Earlier reporting highlighted a broader context around Ethereum’s roadmap and governance, including articles on the Ethereum Foundation’s mandate and related analyses on accumulation wallets. These pieces provide background on how structural developments and investor behavior interact, reinforcing the view that price action in the near term will be shaped by how market participants interpret both on-chain signals and institutional intentions.
For ongoing context, traders and observers can also consider the ongoing attention on Ethereum price dynamics in relation to standard benchmarks like the Ethereum price page and related market data coverage, as well as the broader ecosystem signals documented in market analyses tied to accumulation trends and wallet activity.
What to watch next
- Watch for a decisive move beyond the $2,800 cost-basis cluster; a sustained breakout could invite additional buying interest and a faster push toward the next resistance.
- Monitor the 200-day simple moving average near $2,800 for potential support or a shift in momentum if ETH tests it again.
- Track open interest changes on major exchanges; a renewed rise could indicate fresh leverage interest as price improves.
- Observe spot market indicators, particularly CVD and bid-ask dynamics, to gauge whether buyers can sustain a move through key supply zones.
- Keep an eye on governance and foundation-related updates that could influence long-term investor confidence and network development.
Sources & verification
- On-chain cost-basis distribution heatmap showing accumulation near $2,800 (more than 3 million ETH).
- Ether price action and daily chart context, including proximity to the 200-day SMA near $2,800.
- Futures data: open interest movements around $10.9 billion during the rally and subsequent pullback.
- Derivatives positioning on Binance, with long exposure around 59.4% of futures exposure.
- Related reporting on Ethereum accumulation wallets and governance/goals discussions.
Why it matters
Ether’s near-term trajectory remains shaped by a blend of on-chain demand and risk management in the derivatives market. The concentration of cost basis near $2,800 indicates that a large supply of market participants would likely defend that level, making it a critical reference point for future price discovery. If buyers manage to push prices above the current congestion and dissolve the supply at $2,200–$2,800, liquidity could accelerate toward the $2,800 target, aligning with the observed accumulation signals.
Conversely, a failure to convert the upper end of the range could see traders reassess risk, particularly given the balanced or modestly long positioning on major platforms. In such a scenario, any renewed hesitation near resistance could translate into a protracted consolidation, with small negative catalysts potentially curbing momentum. The evolving narrative around Ethereum’s governance and strategic priorities—alongside the Foundation’s mandate discussions—adds another layer of context for investors considering the path ahead for ETH.
What to watch next
- Dates and milestones related to updates in Ethereum Foundation governance and roadmap clarifications.
- Upcoming data on open interest across major exchanges to gauge fresh leverage entering the market.
- Key price triggers around the $2,800 zone and potential liquidity shifts as supply bands align with demand pockets.


Former U.K. Prime Minister Boris Johnson has called bitcoin a “giant Ponzi scheme,” prompting a swift rebuttal from Strategy chairman Michael Saylor and other netizens.
In a column published in the Daily Mail and posted on social media platform X, Johnson wrote that he had long suspected cryptocurrencies relied on “a supply of new and credulous investors” rather than real value. He pointed to a story from his village in Oxfordshire about a retired man who handed £500 ($661) to someone in a pub who promised to double the money through bitcoin.
According to Johnson’s account, the man spent three and a half years paying fees and trying to withdraw funds. He ultimately lost about £20,000 ($ 26,450), referring to what he admitted was “some kind of scam.”
Johnson argued that assets such as gold or even collectibles like Pokémon cards hold some cultural or physical appeal. Bitcoin, he wrote, is “just a string of numbers stored in a series of computers.”
He also questioned why people should trust a system created by a pseudonymous entity, Satoshi Nakamoto, without institutional backing.
“Who do we talk to if they decrypt the crypto?” Johnson asked. “There’s no one except this Nakamoto, who may be no more real than Pikachu or Charmander themselves.”
Community push back
Reacting to the column, the cryptocurrency community pushed back against Johnson’s claims.
Saylor, Executive Chairman of the world’s largest corporate bitcoin holder Strategy (MSTR), refuted the claims, saying a Ponzi scheme requires a “central operator promising returns and paying early investors with funds from later ones.”
Bitcoin, Saylor added, has “no issuer, no promoter, and no guaranteed return—just an open, decentralized monetary network driven by code and market demand.”
Bitcoin is not a Ponzi scheme. A Ponzi requires a central operator promising returns and paying early investors with funds from later ones. Bitcoin has no issuer, no promoter, and no guaranteed return—just an open, decentralized monetary network driven by code and market demand.
— Michael Saylor (@saylor) March 13, 2026
On X, in the “community notes program,” a note was added pointing out that Ponzi schemes promise artificially high rates of returns with next to no risk.
“Bitcoin has no issuer and its value is purely determined by the free market. The code is totally public and opt-in. Nobody can force you to run any particular version,” the note reads.
Other responses ranged from technical explanations of Bitcoin’s design to broader criticism of government monetary policy.
Other responses ranged from technical explanations of Bitcoin’s design to broader criticism of government monetary policy. Some users pointed to Bitcoin’s fixed supply and decentralized network as evidence that it differs from classic Ponzi structures
Others took a more combative tone, posting memes and criticizing central banks for expanding the money supply during the pandemic. As for who’s in charge, BitMEX Research replied, “nobody is in charge.”

The crypto casino market has matured enough to produce its own internal rivalries. This is no longer about whether crypto gambling can work — that question was answered years ago. The question now is which crypto-native platform does it best. Stake.com has held the crown as the most recognised name in crypto gambling for some time, built through massive marketing spend and a distinctive product. ZunaBet launched in 2026 with a platform specifically designed to challenge where Stake falls short — particularly around welcome bonuses, loyalty transparency, and game library scale. Both platforms run on crypto. Both serve the same core audience. The comparison comes down to which one delivers more value to the player sitting behind the screen.

Stake.com: The Name That Defined Crypto Gambling
Stake.com went live in 2017 and rapidly became the face of crypto casino gaming worldwide. Operating under a Curaçao license, the platform achieved massive visibility through sponsorship deals with the UFC, Drake, and multiple football clubs. That marketing firepower, combined with a distinctive product, turned Stake into a brand that transcended the crypto gambling niche and entered mainstream awareness.
The gaming experience at Stake centres partly around its proprietary Stake Originals. Titles like Crash, Plinko, Mines, Dice, and Limbo have become signature games within the crypto gambling community — simple in design but addictive in execution. Third-party games from providers like Pragmatic Play, Hacksaw Gaming, and others supplement the originals, though the total library has not prioritised reaching the same volume levels as some newer platforms.
The sportsbook is genuinely strong. Football, basketball, tennis, MMA, cricket, boxing, and a broad selection of other sports receive thorough treatment. Esports betting has been an area of particular strength with markets covering CS2, Dota 2, League of Legends, and more. The sports product is well-integrated and competitive at the highest level.
Stake accepts multiple cryptocurrencies including BTC, ETH, LTC, DOGE, and others, with fiat available in select markets. Transactions process at blockchain speed without platform fees. The payment experience is consistent with what crypto-native users expect.
Loyalty operates through a VIP programme that combines automatic progression at lower levels with an invitation-based system for the upper tiers. Lower-level players receive modest rakeback and occasional reload bonuses. Top-tier VIPs enjoy personalised hosts, custom deals, and significantly higher rakeback. The gap between what lower and upper tiers receive has been a consistent source of frustration for players who wager regularly but below whale thresholds.
Notably, Stake does not provide a welcome bonus. No deposit match. No free spins. New players begin with exactly what they deposit and nothing more.
ZunaBet: Built to Win the Crypto Player’s Attention
ZunaBet debuted in 2026 under Strathvale Group Ltd, holding an Anjouan gaming license and built by a team with over 20 years of combined industry experience. The platform was constructed on crypto-native infrastructure with a deliberate focus on addressing the specific shortcomings that players have identified in existing crypto casinos. The result is a platform that matches the crypto foundations of competitors like Stake while exceeding them on content volume, bonus value, and reward transparency.
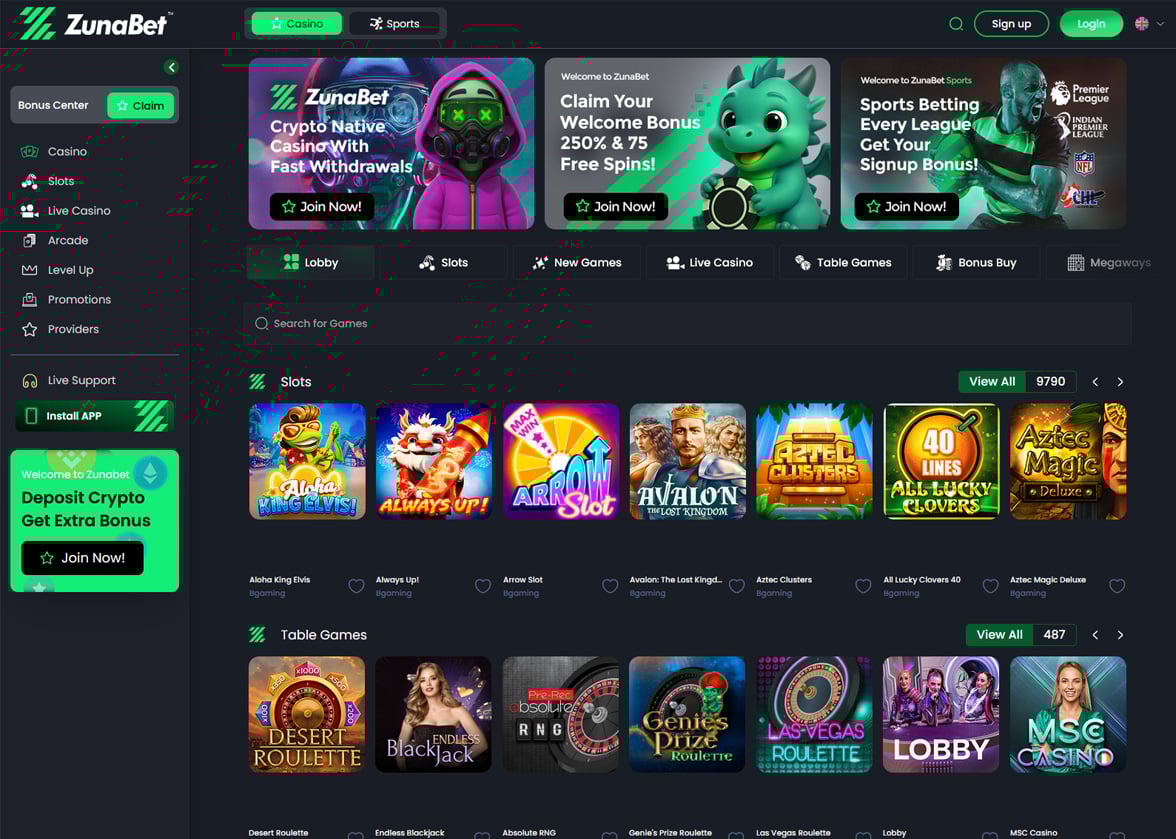
The game library immediately establishes scale. ZunaBet hosts 11,294 titles from 63 providers. Pragmatic Play, Evolution, Hacksaw Gaming, BGaming, and Yggdrasil lead the roster, supported by more than fifty additional studios. Slots dominate the count, but live dealer tables and RNG games carry genuine variety. The breadth of the catalog gives ZunaBet a content advantage that even the most established crypto casinos have difficulty matching.
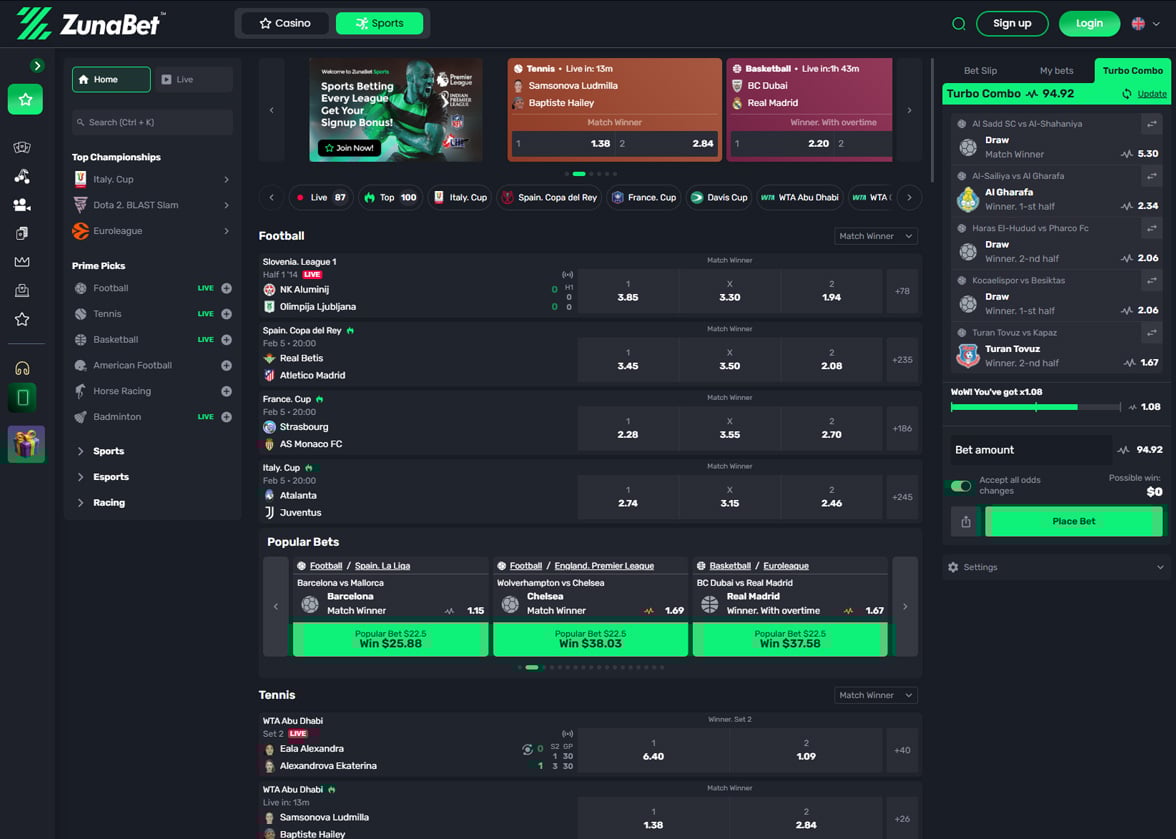
Sports betting was treated as a primary product from the outset. Football, basketball, tennis, hockey, and major global sports get full market depth. Esports are permanently integrated with dedicated markets on CS2, Dota 2, League of Legends, and Valorant. Virtual sports and combat sports expand the coverage. The sportsbook competes directly with Stake’s offering and adds coverage that ensures evolving betting interests are fully addressed.
The welcome package is one of ZunaBet’s most visible differentiators. Up to $5,000 plus 75 free spins across three deposits provides new players with a substantial starting advantage. First deposit earns 100% up to $2,000 with 25 spins. Second earns 50% up to $1,500 with 25 spins. Third earns 100% up to $1,500 with 25 spins. In a market where Stake offers nothing to new players, this package alone shifts the opening value proposition decisively in ZunaBet’s direction.
Payment infrastructure supports over 20 cryptocurrencies — BTC, ETH, USDT across multiple chains, SOL, DOGE, ADA, XRP, and many others. No fees. Fast blockchain withdrawals. The payment experience matches the standard that Stake established, ensuring no ground is lost on this front.
Native apps for iOS, Android, Windows, and MacOS deliver a consistent experience across every device. The dark-themed responsive interface loads quickly. Live chat support runs 24/7.
The Bonus Question: Generosity vs Austerity
The welcome bonus comparison could not be more straightforward. Stake offers none. ZunaBet offers $5,000 plus 75 free spins.
A new player choosing between these platforms faces a simple calculation. Deposit at Stake and start with your deposit amount. Deposit at ZunaBet and start with up to double your deposit plus free spins. The second scenario provides more games played, more chances to explore, and more runway before a player is operating purely on their own funds.
Stake has long argued that its product speaks for itself and that welcome bonuses are unnecessary. ZunaBet takes the position that rewarding players from the very first interaction is fundamental to the relationship. For the majority of players who appreciate tangible value on arrival, ZunaBet’s approach resonates more strongly.
Loyalty: Invitation Walls vs Open Doors
Both platforms reward ongoing play, but the accessibility and transparency of those rewards differ sharply.
Stake’s VIP programme delivers impressive value at the top. High-volume players who reach the upper invitation-only tiers receive personalised attention, custom rakeback arrangements, and exclusive benefits. The problem is that most players never reach those tiers. The lower levels offer modest returns, and the criteria for advancing into the premium VIP levels remain opaque. For the average regular player, the VIP system can feel like watching a party through a window they cannot open.
ZunaBet opens the door to everyone from the start. The dragon evolution loyalty programme publishes six clear tiers — Squire at 1% rakeback, Warden at 2%, Champion at 4%, Divine at 5%, Knight at 10%, and Ultimate at 20%. A dragon mascot called Zuno evolves alongside the player. Higher tiers bring up to 1,000 free spins, VIP club access, and double wheel spins.
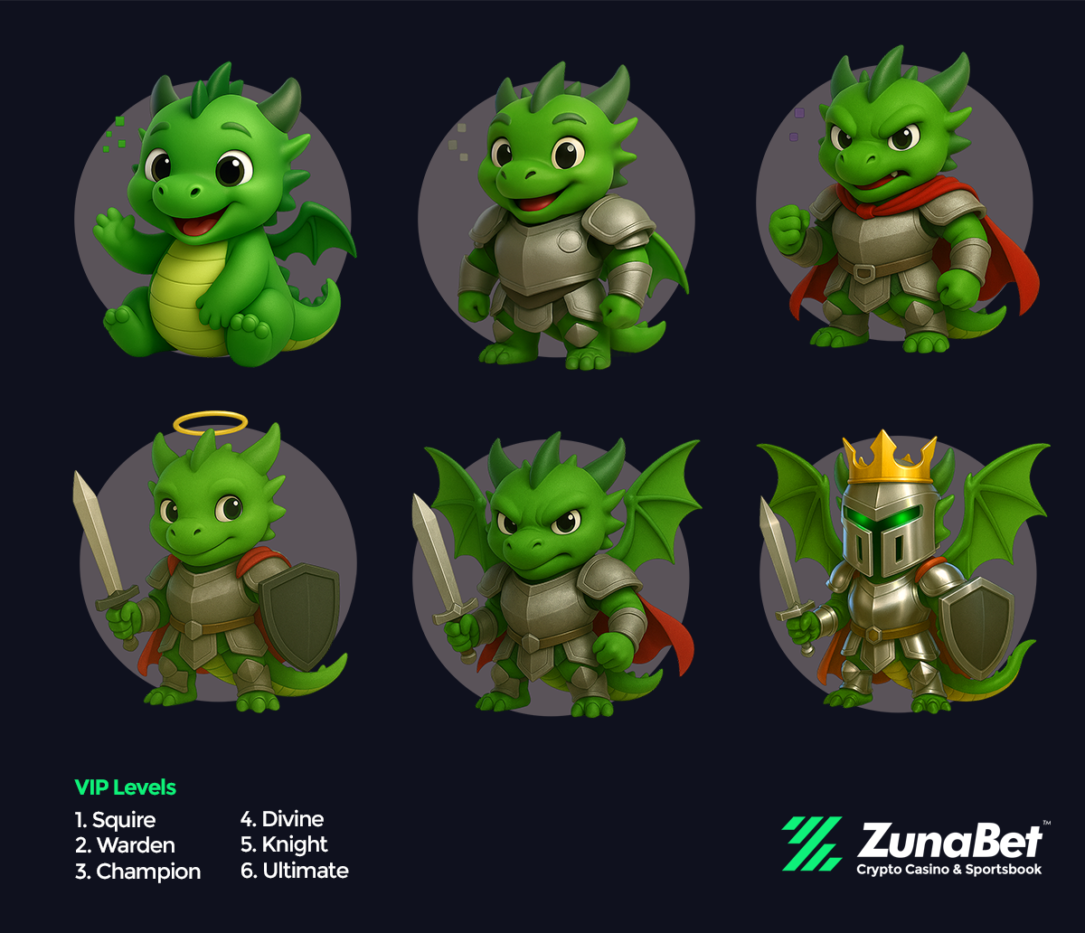
No invitations required. No hidden thresholds. No ambiguity about what each level provides or what it takes to get there. Every player knows their current rakeback rate and can see exactly what advancing to the next tier will earn them. For the broad middle of the crypto gambling market — players who are active and loyal but not wagering at extreme volumes — ZunaBet’s transparent system delivers better accessible value than Stake’s top-heavy VIP structure.
Content: Signature Games vs Massive Variety
Stake built a unique identity through its Originals collection. Games like Crash, Plinko, and Mines are instantly associated with the brand and offer a gameplay experience that third-party content does not replicate. That identity has value, and the Originals remain a genuine draw for many crypto gamblers.
ZunaBet does not offer proprietary games. Instead, it offers 11,294 titles from 63 providers — a library that dwarfs what Stake makes available from external studios. The trade-off is clear: Stake gives you unique games you cannot find elsewhere, while ZunaBet gives you a volume of content that no single competitor matches.
For players who specifically seek out Stake Originals, that content remains exclusive to Stake. For everyone else — players who value variety, discovery, and access to the widest possible range of slots, live dealer games, and table games — ZunaBet’s library provides an experience that keeps delivering fresh content for months on end.
Crypto Infrastructure: Level Playing Field
On the payments front, these platforms compete on essentially equal ground. Both are crypto-native. Both support multiple coins. Both process transactions without platform fees. Both deliver fast blockchain-based withdrawals. ZunaBet edges ahead slightly on coin variety with over 20 supported cryptocurrencies including several that Stake does not natively support, but the core transaction experience is comparable.
This parity is precisely what makes the rest of the comparison so telling. When the payment infrastructure is equal, the value difference comes down to bonuses, games, and loyalty — and on all three, ZunaBet offers more to the average player.
Which Crypto Casino Earns Your Deposit
Stake built the template for crypto gambling and earned its position through years of brand building, innovative original games, and a sportsbook that competes with the best. For high-volume players who can access the upper VIP tiers, Stake still delivers personalised value that is hard to replicate. The Originals collection provides a unique flavour that no competitor has duplicated.
ZunaBet took that template and addressed its blind spots. A $5,000 welcome bonus where Stake offers nothing. Transparent rakeback up to 20% where Stake gates its best rewards behind opaque invitation thresholds. Over 11,000 games from 63 providers where Stake offers a smaller external library supplemented by proprietary titles. The same crypto payment speed with broader coin support.
For the whale-level player, Stake’s personalised VIP treatment may still hold appeal. For everyone else — and that includes the vast majority of crypto gamblers — ZunaBet delivers more welcome value, more accessible loyalty rewards, and more content to play through. In a crypto casino market that keeps growing in 2026, ZunaBet is the platform making the strongest case that the next generation of crypto gambling should be more generous, more transparent, and more packed with content than what came before.
Disclaimer: This is a Press Release provided by a third party who is responsible for the content. Please conduct your own research before taking any action based on the content.


Wall Street is racing toward tokenized equities and 24/7 trading, but many institutional investors are wary of the instant settlement model.
Tokenization refers to representing traditional assets such as stocks on blockchain networks. In theory, the approach could modernize market infrastructure that dates back decades, allowing securities to move and settle instantly while potentially enabling 24/7 trading.
That vision has gained momentum in recent months. Both ICE, the owner of the New York Stock Exchange, and Nasdaq, have recently announced large partnerships with native crypto exchanges, aimed at bringing tokenized stocks to market.
But for many institutional traders, the shift raises practical concerns about liquidity, financing and how markets function day to day.
“Institutional investors generally do not like instant settlement,” said Reid Noch, vice president of U.S. equity market structure at TD Securities. While the technology could streamline the back end of markets, he said, forcing trades to settle immediately would create new frictions for professional investors.
The current U.S. system settles stock trades one business day after execution, known as T+1 settlement. That delay allows brokers and trading firms to net positions and manage funding throughout the day. Instant settlement, by contrast, would require transactions to be fully funded before they occur.
“No one really wants to be prefunded,” Noch said. If instant settlement became the standard across the market, trading firms would need to arrange financing throughout the day, potentially increasing costs and reducing liquidity at key moments.
The impact could be especially visible during periods of heavy activity, such as the market close when large volumes of trades are executed simultaneously. Balance sheet constraints could make those periods more expensive for investors, spreading liquidity more unevenly throughout the trading day.
Retail traders, however, may embrace tokenized markets more quickly. Many of the proposed benefits — such as holding shares directly in digital wallets or trading outside traditional market hours — are aimed at individual investors rather than large institutions.
Retail already accounts for roughly 20% of U.S. equity trading volume, though in certain stocks the share can rise to more than half of daily activity. In highly speculative “meme stocks,” retail participation has at times exceeded 90%.
Tokenized trading venues could particularly appeal to international retail investors seeking access to U.S. stocks when American markets are closed, Noch said. For those investors, opening accounts with crypto platforms may be easier than navigating the requirements of traditional brokers.
Over time, institutional investors may follow if liquidity shifts to tokenized venues. “If retail liquidity migrates there and becomes meaningful, institutions won’t really have a choice but to participate,” Noch said.
Still, the transition carries risks. One concern is market fragmentation if multiple versions of the same stock exist across different blockchains or tokenized platforms. That could weaken the transparency and price discovery that underpin the U.S. equity market.
“Generally, most companies only have one stock,” Noch said. “If suddenly there are multiple tokenized versions with different rights or liquidity profiles, that could create confusion about what investors actually own.”
Despite those concerns, industry momentum continues to build. Exchanges are already exploring longer trading hours, with some proposing nearly round-the-clock markets within the next few years.
Tokenization could ultimately become part of that shift — modernizing infrastructure behind the scenes while gradually reshaping how investors access stocks. But for now, the technology may advance faster among retail traders than the institutions that dominate today’s markets.

Key Takeaways
- Samsung (SSNLF) has partnered with Nvidia (NVDA) to create advanced ferroelectric NAND flash memory technology.
- A Physics-Informed Neural Operator (PINO) AI model was created in collaboration with Georgia Institute of Technology researchers.
- This AI-driven PINO model accelerates ferroelectric NAND performance analysis by more than 10,000 times versus conventional approaches.
- Traditional chip design software (TCAD) requires 60 hours for each simulation — this new AI technology completes the task in less than 10 seconds.
- Samsung previously revealed that ferroelectric NAND technology reduces power usage by 96% versus traditional NAND chips.
A groundbreaking collaboration between Samsung and Nvidia is pushing the boundaries of memory chip technology with potential implications for AI infrastructure.
The partnership brings together Samsung, Nvidia, and academic researchers from Georgia Institute of Technology to develop a specialized AI model known as a Physics-Informed Neural Operator (PINO). This innovation aims to accelerate the development timeline for ferroelectric NAND flash memory.
Unlike traditional silicon-based chips, ferroelectric NAND utilizes ferroelectric materials capable of retaining data without continuous power input. This characteristic positions the technology as a promising solution for creating more energy-efficient computing systems.
Samsung has invested heavily in ferroelectric NAND research over recent years. The company published research in Nature journal demonstrating how this technology achieves a remarkable 96% decrease in power consumption when compared to conventional NAND memory.
That efficiency gain carries significant weight. As AI computing demands continue escalating energy requirements, a near-total reduction in memory-related power draw represents a substantial advancement.
However, development speed has remained a persistent challenge. Engineers rely on Technology Computer-Aided Design (TCAD) software to simulate and optimize critical performance metrics like threshold voltage stability and long-term data retention.
Traditional TCAD processes demand approximately 60 hours to complete a single operation. This extended timeframe creates a significant barrier to rapid iteration and improvement.
The newly developed PINO model eliminates this constraint by completing identical analyses in fewer than 10 seconds.
Strategic Alignment Between Industry Giants
Nvidia represents Samsung’s most significant memory chip customer. Their established commercial ties create a logical foundation for expanded research and development cooperation.
Currently, SK Hynix dominates the supply of high-bandwidth memory (HBM) chips to Nvidia. Samsung has actively pursued opportunities to expand its market share in this segment, making deeper collaboration on emerging memory technologies a strategic priority.
Micron Technology (MU) represents another major player in the HBM market, supplying memory components for AI accelerators.
The PINO research has been published and made accessible to the broader scientific community. Development is now transitioning toward commercial implementation, with Samsung anticipated to continue its Nvidia partnership through subsequent ferroelectric NAND development phases.
Financial Position Analysis
Samsung’s financial foundation appears robust. The company generated $234.73 billion in trailing twelve-month revenue while maintaining a 13.07% operating margin.
With a debt-to-equity ratio of merely 0.06 and a current ratio of 2.33, the balance sheet demonstrates strong capitalization and significant capacity for continued long-term research investment.
The stock trades at a P/E ratio of 28.43, positioning it toward the upper end of its historical valuation range. Technical indicators show RSI levels in overbought territory, a factor short-term traders may wish to monitor.
Institutional ownership remains minimal at 2%, with no documented insider transactions recorded during the previous twelve months.
Neither company provided official statements in response to media inquiries regarding the partnership.

TLDR
- Wedbush Securities boosted Micron’s price target from $320 to $500, highlighting memory pricing strength beyond initial forecasts
- Contract prices for DRAM and NAND memory are experiencing dramatic increases, with certain agreements showing gains exceeding 100%
- The company’s high-bandwidth memory production for 2026 has completely sold out, with demand now stretching into 2027
- Analysts anticipate earnings per share to jump more than 460% with revenues projected to double in the upcoming quarterly report
- Among S&P 500 technology stocks, Micron received the highest growth factor rating with an A+ grade, matching Broadcom’s score
Micron Technology (MU) is approaching its March 18 quarterly earnings announcement with significant momentum, fueled by upgraded analyst ratings, elevated price projections, and strengthening memory chip pricing dynamics.
Shares advanced 9.45% during the previous trading week, with an additional 1.4% uptick in Friday’s premarket session following Wedbush Securities’ decision to increase its price objective to $500 from $320. Analyst Matt Bryson maintained his Outperform recommendation, emphasizing that pricing trends have “moved well ahead of expectations.”
According to Bryson’s analysis, Micron’s own fiscal Q2 projections suggested approximately 30% growth in average selling prices. However, actual market conditions appear significantly more robust. Throughout January, DRAM and NAND contract negotiations indicated pricing gains exceeding 50% for the first calendar quarter of 2026. More recently, certain transactions have demonstrated percentage increases reaching triple digits.
Traditional market patterns show memory demand weakening following Chinese New Year celebrations, yet Bryson observed no such softening this cycle. “Rather if anything we’ve seen evidence of a continued lift in requirements and even tighter supply dynamics,” he wrote.
Bryson emphasized that with both earnings forecasts and price objectives trending upward, and Micron currently valued below historical peak earnings multiples, maintaining a bullish stance remains justified.
Wall Street’s Optimism Intensifies
Wedbush’s upgraded outlook represents just one voice in a growing chorus. Financial institutions including Citi, Susquehanna, and Aletheia have similarly elevated their price projections recently. Aletheia established the Street’s most aggressive target at $650, projecting that Micron could produce $150–$200 billion in cash flow spanning FY26 through FY27 while evolving into a dominant force among global semiconductor manufacturers.
The consensus expectations ahead of the earnings release reflect substantial optimism. Projected earnings per share growth exceeds 460% compared to the prior year period, while revenue estimates anticipate more than doubling. Multiple analysts forecast gross profit margins could achieve unprecedented levels.
While one prominent analyst has expressed valuation concerns following the stock’s substantial appreciation over the trailing twelve months, the overwhelming majority of Wall Street maintains a bullish perspective, reflected in the Strong Buy consensus rating.
High-Bandwidth Memory Demand Creates Multi-Year Visibility
The foundation of the optimistic investment thesis centers on high-bandwidth memory technology. HBM serves as a critical component within AI accelerator systems, and Micron’s production capacity for 2026 has already been completely reserved, with customer orders now extending throughout 2027.
This exceptional forward visibility substantially mitigates the cyclical volatility that has traditionally characterized memory semiconductor investments. Additionally, it suggests pricing leverage will persist considerably longer than historical industry cycles have demonstrated.
In a separate development, a recent growth factor assessment of S&P 500 technology constituents positioned Micron at the summit, awarding an A+ rating shared only with Broadcom (AVGO). AI-related companies including Palantir (PLTR) and AMD secured A ratings, while Nvidia (NVDA) received an A- grade. Conversely, Apple (AAPL) and Cisco (CSCO) both earned D- ratings at the lower end of the spectrum.
Micron is scheduled to release Q2 FY26 financial results on March 18.

Bybit is reportedly planning to enter the compliant US market via this potential partnership.
The popular Chinese crypto news channel Wu Blockchain reported earlier today that two of the industry’s giants, Coinbase and Bybit, are in talks for some sort of investment partnership.
Although the currently available information is quite limited and there’s no official response from either party, it’s reported that Bybit’s valuation could match OKX’s after the most recent funding event.
Exclusive: Coinbase, the largest cryptocurrency exchange in the US, is in talks with Bybit, the world’s second-largest offshore exchange, for an investment partnership. Bybit hopes to use this opportunity to enter the compliant US market. Three sources confirmed this news to… pic.twitter.com/SXBJnbDOQG
— Wu Blockchain (@WuBlockchain) March 14, 2026
Citing three sources that confirmed the information, the report further indicated that such a collaboration would enable Bybit to enter the compliant US market.
It would follow several notable deals in the cryptocurrency space, such as Coinbase’s acquisition of the derivatives giant Deribit. As reported during the summer of 2025, the Wall Street-listed exchange purchased Deribit for $2.9 billion as the derivatives market was exploding.
More recently, OKX received a massive nod from the Intercontinental Exchange. The entity behind the New York Stock Exchange acquired a minority stake in the cryptocurrency exchange, putting its valuation at an impressive $25 billion following the latest investment round.
According to Wu Blockchain, Bybit’s valuation should be similar to OKX’s, meaning somewhere around $25 billion.
You may also like:
CoinMarketCap and CoinGecko data show that all three trading platforms – Coinbase, OKX, and Bybit – are placed within the top five of their trust lists, with some of the highest scores in the industry.
Binance Free $600 (CryptoPotato Exclusive): Use this link to register a new account and receive $600 exclusive welcome offer on Binance (full details).
LIMITED OFFER for CryptoPotato readers at Bybit: Use this link to register and open a $500 FREE position on any coin!

In a broad reassessment of anti-money-laundering (AML) in crypto, Ana Carolina Oliveira, chief compliance officer at Venga, argues that crypto is not uniquely to blame for illicit flows—yet it cannot escape accountability. Traditional finance still experiences illicit activity at a rate that is at least twice as high, with estimates suggesting that more than 90% of such cases go undetected. Blockchain’s immutable ledger offers a potential advantage: when wrongdoing occurs, the trail is visible from end to end. The challenge, Oliveira argues, is not to demonize crypto but to evolve the AML system so it covers both CeFi and DeFi, across borders and regulatory regimes. The EU’s AML Regulation 2024/1624 is a meaningful step, but it is not a substitute for robust, practical guardrails across the industry.
Key takeaways
- Traditional finance still generates illicit flows at a higher rate than crypto, with estimates indicating AML activity is at least twice as prevalent in fiat systems and a sizable portion goes undetected.
- AML frameworks for crypto must move beyond checkbox compliance and toward ongoing, enforceable safeguards that cover both centralized and decentralized finance ecosystems.
- The Travel Rule envisions a SWIFT/IBAN-style identification regime, but implementation remains industry-led and costly due to multi-jurisdictional compliance requirements.
- Blockchain’s pseudonymity presents enforcement challenges, particularly when self-hosted wallets and mixers obscure origins; data-sharing across platforms and regions is crucial.
- Progress hinges on a balance: regulators and industry must collaborate to establish global standards and guardrails that preserve innovation while closing loopholes that criminals exploit.
Tickers mentioned:
Market context: The ongoing regulatory push in the EU and other jurisdictions continues to shape the crypto landscape, with institutions seeking clearer risk-management frameworks and more predictable compliance pathways. As liquidity and risk sentiment shift, robust AML infrastructure could accelerate mainstream adoption by reducing friction and boosting user trust. At the same time, the debate over privacy versus transparency intensifies as onchain analytics mature and cross-border data-sharing norms emerge, influencing how firms design their compliance tools and workflows.
Why it matters
For users, coherent AML rules that are consistently enforced across borders reduce the friction associated with moving value between wallets, exchanges, and custodians. When compliance is predictable, consumers gain confidence that legitimate activity won’t be stymied by opaque processes or inconsistent regional rules. For builders and exchanges, the message is clear: interoperable, standards-based tools that can operate across CeFi and DeFi guardrails will be essential. Fragmented systems create choke points, raise costs, and invite circumvention as firms juggle divergent requirements from different regulators.
From a market perspective, credible AML measures can enhance the legitimacy of digital assets in the eyes of traditional financial institutions, insurers, and corporate treasuries. They also raise the bar for risk management, potentially attracting capital that was previously wary of regulatory ambiguity. Regulators, meanwhile, face the dual challenge of safeguarding the financial system while avoiding stifling innovation. The EU Regulation 2024/1624 offers a framework, but practical, cross-border enforcement will require continued dialogue and shared technical standards across jurisdictions.
Ultimately, the aim is to recast crypto compliance as a global, cooperative endeavor rather than a patchwork of national rules. By aligning on information sharing, screening, and verification standards—without eroding the permissionless and borderless nature of blockchain—regulators and industry players can reduce illicit activity without hamstringing legitimate activity. As the discourse evolves, the emphasis shifts from “doing something” to doing the right things consistently, everywhere, every time.
What to watch next
- Regulatory milestones around the EU AML Regulation 2024/1624, including guidance and enforcement timelines, expected in 2025–2026.
- Wider industry adoption of a crypto SWIFT-style information exchange as referenced in regulatory and industry discussions.
- Developments toward global AML standards for cross-border digital assets and increased inter-regulator cooperation to close jurisdictional gaps.
- Advances in onchain analytics, wallet screening, and real-time transaction monitoring that can be scaled across exchanges and custodians.
Sources & verification
- Regulation EU 2024/1624 — EU legal text and official summary.
- Travel Rule advisory — Financial Crimes Enforcement Network (FinCEN) advisory on cross-border crypto transfers.
- Crypto SWIFT system — discussion of a SWIFT-like data exchange for digital asset transfers.
- Universal blockchains buckling under real-world demands — Cointelegraph article on blockchain interoperability challenges.
- a16z to Senate drop the ancillary asset loophole — Cointelegraph article examining regulatory gaps and potential fixes.
Toward a global AML framework for crypto: aligning guardrails with the onchain reality
Crypto does not exist in a legal vacuum, and the AML challenge is not simply a matter of deploying sophisticated screening tools. It is about building a shared operating environment where information travels with the same speed and reliability as value. Oliveira highlights that while the Travel Rule provides a SWIFT/IBAN-style identification framework, its practical implementation has been left to industry participants navigating a maze of national and regional laws. The result is a fragmented approach that can create safety gaps. The EU’s Regulation 2024/1624 adds momentum, but it also underscores a larger truth: one-off regulations cannot by themselves close the door to illicit finance. Real progress will require disciplined, cross-border collaboration on data standards, technology interfaces, and governance protocols that tie together exchanges, wallet providers, and financial institutions alike.
At the core of the argument is the recognition that blockchain’s immutability can be a tool for uncovering illicit activity, not a justification for lax controls. Pseudonymity on-chain is a feature that complicates identity verifications, particularly when funds pass through self-hosted wallets or mixers designed to obfuscate provenance. The path forward, therefore, is not to dismantle privacy but to implement scalable, privacy-preserving analytics and screening that preserve legitimate user privacy while revealing illicit patterns. In this sense, the crypto sector’s AML posture must evolve from a narrow checklist to a holistic system—one that integrates continuous feedback loops, clearer typology mapping, and robust information sharing across exchanges and geographies.
Two recurring themes run through Oliveira’s analysis. First, the public sector cannot delegate all responsibility to private actors. While the industry must bear a large portion of implementation cost and technical work, regulators must set enforceable standards and provide clear guidance on how to achieve them. Second, a global, minimum-standard framework—implemented across jurisdictions—could reduce the cost of compliance and improve the effectiveness of anti-money-laundering efforts. The industry’s experience with multi-jurisdiction compliance will be a bellwether for whether such a framework can be realized in a way that respects the speed and openness that define digital assets. The discussion is no longer about whether crypto requires AML safeguards, but how to design safeguards that are comprehensive, interoperable, and enforceable worldwide without undermining innovation.
As the dialogue continues, industry participants must demonstrate the willingness to share information that proves problematic activity and to adopt best practices that reduce criminal adaptability. The overarching goal is to create a crypto space where legitimate users enjoy faster, cheaper, and more transparent transactions while criminals lose access to the same networks. In short, AML for crypto should be about clarity, cooperation, and consistency—an architecture that scales with global finance rather than one that fragmentizes it. If these principles are adopted, the market can move toward greater resilience and trust, enabling broader participation without compromising security.
https://example.com/placeholder.js

Can ETH Launch a Strong Rebound After Reclaiming $2K?
The 52 best teen movies of all time

Offshore wind farm is completed, the first during Trump’s tenure

Smart energy pays enters the US market, targeting scalable financial infrastructure

Why Israel is blocking foreign journalists from entering

Bitcoin: We’re Entering The Most Dangerous Phase

The Man Who Invented Every Financial Scam Started With Postage Stamps

Money and Banking | Final Exam Gap Revision | 6 Marks Fixed in class 12 Economics Board exam 2026

BITCOIN & CRYPTO – Bremst uns der Iran Krieg aus? XLM Stellar NEWS und Clarity erst im 2027?
-
 Tech3 days ago
A 1,300-Pound NASA Spacecraft To Re-Enter Earth’s Atmosphere
-

 News Videos5 days ago
10th Algebra | Financial Planning | Question Bank Solution | Board Exam 2026
-
 Crypto World13 hours ago
HYPE Token Enters Net Deflation as HyperCore Buybacks Outpace Staking Rewards
-

 Business4 days ago
ExxonMobil seeks to move corporate registration from New Jersey to Texas
-

 Crypto World5 days ago
Paradigm, a16z, Winklevoss Capital, Balaji Srinivasan among investors in ZODL
-

 Fashion24 hours ago
Weekend Open Thread: Addict Lip Glow
-

 Tech4 days ago
ChatGPT will now generate interactive visuals to help you with math and science concepts
-
Sports3 hours ago
Why Duke and Michigan Are Dead Even Entering Selection Sunday
-

 Sports7 days ago
Three share 2-shot lead entering final round in Hong Kong
-

 Sports7 days ago
Braveheart Lakshya downs Lai in epic battle to enter All England Open final | Other Sports News
-

 NewsBeat3 days ago
Residents reaction as Shildon murder probe enters second day
-

 Business6 days ago
Search for Nancy Guthrie Enters 37th Day as FBI Probes Wi-Fi Jammer Theory
-

 Business3 days ago
Search Enters Sixth Week With New Leads in Tucson Abduction Case
-
 NewsBeat5 days ago
Pagazzi Lighting enters administration as 70 jobs lost and 11 stores close across Scotland
-

 Tech5 days ago
Despite challenges, Ireland sixth in EU for board gender diversity
-

 Business5 hours ago
US Airports Launch Donation Drives for Unpaid TSA Workers as Partial Government Shutdown Enters Fifth Week
-

 NewsBeat3 days ago
I Entered The Manosphere. Nothing Could Prepare Me For What I Found.
-

 Business5 days ago
Search Enters 39th Day with FBI Tip Line Developments and No Major Breakthroughs
-

 Sports5 days ago
Skateboarding World Championships: Britain’s Sky Brown wins park gold
-

 Business6 hours ago
Country star Brantley Gilbert enters growing non-alcoholic beer market

