

Crypto World
Micron (MU) Stock: AI Memory Boom Drives Massive Growth Expectations for Wednesday Earnings

TLDR
- Micron’s Q2 FY26 earnings release is scheduled for March 18, with analyst estimates calling for approximately $19.1B in revenue, marking a 137% year-over-year increase
- Earnings per share projections range from $8.60 to $8.74, reflecting approximately 460% annual growth
- The company’s HBM inventory is completely sold out through calendar year 2026, with capacity covering only 50%–66% of major customer requirements
- Micron finalized the acquisition of a Taiwan-based chip manufacturing facility, planning DRAM and HBM output starting in fiscal 2028
- Wall Street analysts from Wedbush and Wells Fargo increased their price targets to $500 and $470 respectively, while 27 analysts maintain a consensus Strong Buy rating
Micron Technology is preparing to unveil its fiscal Q2 2026 results this Wednesday, March 18, and market watchers are anticipating remarkable figures.
Wall Street consensus calls for quarterly revenue approaching $19.1 billion, representing approximately 137% growth versus the year-ago quarter. For earnings per share, projections land between $8.60 and $8.74 — more than quintupling the Q2 FY25 result.
The catalyst fueling this explosive growth is artificial intelligence. Hyperscale data centers powering AI workloads require enormous memory resources, creating insatiable demand for both DRAM and high-bandwidth memory (HBM) that far exceeds current industry production capabilities.
Micron has publicly acknowledged it can fulfill only 50% to two-thirds of memory orders from several major customers. Rather than a limitation, this represents significant pricing leverage.
Production Constraints Persist
Expanding semiconductor fabrication facilities requires multi-year timelines. Micron projects that substantial new production capacity won’t be available until 2027 at minimum. Between now and then, the chipmaker has completely allocated its HBM output for the entirety of calendar 2026.
This persistent supply-demand mismatch is the critical metric analysts are monitoring ahead of Wednesday’s results. Should Micron’s leadership indicate this imbalance extends through 2026 and beyond, the pricing power narrative remains firmly in place.
Based on at-the-money straddle pricing, options markets are anticipating approximately 10.6% volatility in either direction following the earnings announcement.
Shares have already climbed roughly 42% year to date, last trading near $425.96.
Street Lifts Price Objectives
Wedbush’s Matthew Bryson elevated his MU price target to $500 from $320 while maintaining an Outperform rating. His analysis highlights strengthening earnings projections even as the stock trades below historical peak valuations typical for memory sector companies.
Wells Fargo analyst Aaron Rakers also maintained a Buy rating and raised his target to $470 from $410. Rakers projects peak earnings potential of $50–$60 per share, with normalized long-term earnings power between $30–$40. He anticipates management will address competitive dynamics around HBM4 related to Nvidia’s forthcoming Rubin GPU platform.
Across 27 Wall Street analysts currently covering the stock, the consensus stands at Strong Buy — comprised of 26 Buy ratings and one Hold. The mean price target reaches $448.07, suggesting roughly 5% appreciation from present levels.
Regarding capacity expansion, Micron wrapped up its purchase of the P5 fabrication facility from Powerchip Semiconductor located in Tongluo, Taiwan. The site features approximately 300,000 square feet of cleanroom infrastructure. Micron intends to modernize the facility for DRAM and HBM manufacturing, targeting initial production shipments in fiscal 2028.
The transaction was initially disclosed in January 2026.


TLDR
- Micron finalizes PSMC’s Tongluo P5 facility acquisition in Taiwan
- Company reveals plans for a second manufacturing plant at the Tongluo location
- The additional fab will match the scale of its current Miaoli County operation
- Production focus will be on advanced DRAM and high-bandwidth memory technology
- Groundbreaking for the second plant expected before fiscal 2026 concludes
Micron Technology ($MU) is significantly expanding its Taiwan operations. The American memory semiconductor manufacturer announced Monday its intention to construct an additional production facility at the Tongluo location, recently acquired through its takeover of Powerchip Semiconductor Manufacturing Corp (PSMC) assets.
$MU | Micron Completes Acquisition of PSMC Tongluo P5 Fab in Taiwan
👉 𝐊𝐞𝐲 𝐇𝐢𝐠𝐡𝐥𝐢𝐠𝐡𝐭𝐬:
➤ Micron acquires 𝐏𝐒𝐌𝐂 𝐓𝐨𝐧𝐠𝐥𝐮𝐨 𝐏𝟓 semiconductor site in Taiwan.
➤ Facility includes ~𝟑𝟎𝟎,𝟎𝟎𝟎 sq. ft. of 𝟑𝟎𝟎𝐦𝐦 cleanroom space.
➤ Site will expand… pic.twitter.com/w6feTGelnw
— Hardik Shah (@AIStockSavvy) March 16, 2026
The chipmaker has finalized its purchase of PSMC’s Tongluo P5 facility located in Miaoli County. With this acquisition complete, Micron is moving forward with an ambitious expansion plan that includes constructing a second comparable-sized fab at the same location.
This additional manufacturing site will target increased production of cutting-edge DRAM and high-bandwidth memory (HBM) — critical components that drive AI accelerators and data center processors.
Groundbreaking activities are planned to commence before fiscal 2026 ends, which for Micron concludes in late August.
Strategic HBM Expansion
High-bandwidth memory has emerged as one of the semiconductor sector’s most sought-after products. Major AI hardware manufacturers like Nvidia rely on this technology, creating persistent supply constraints across the industry.
Currently ranking third in the HBM market behind SK Hynix and Samsung, Micron’s Taiwan fab expansion represents a strategic effort to strengthen its competitive position.
The Tongluo site establishes Micron’s second Taiwanese manufacturing hub, complementing its existing Taichung facilities.
Co-locating multiple fabs at a single site offers operational advantages, including shared infrastructure expenses and accelerated production scaling through consolidated utilities, logistics networks, and engineering teams.
Strategic Value of the Tongluo Acquisition
Initially announced in the previous year, the PSMC deal has now officially completed. As a former contract manufacturer, PSMC’s Tongluo P5 location provides Micron with ready-to-use manufacturing space that can be adapted for its proprietary DRAM production processes.
The completed acquisition’s financial details have not been publicly revealed by Micron.
While the second Tongluo facility will be comparable in size to the first, specific capacity numbers for either building remain undisclosed at this time.
Taiwan’s dominance in advanced semiconductor manufacturing makes it a strategic location for Micron’s expansion, positioning the company within the region’s established chip production ecosystem and closer to critical supply chain partners.
MU stock was up 5.13% at the time of reporting.


21Shares AG, a Switzerland based issuer of crypto exchange-traded products (ETPs), has announced significant updates to four of its Bitcoin and Ethereum-linked ETPs listed on the London Stock Exchange.
Effective March 26, 2026, the company will appoint FTSE International Limited as an additional index administrator for its program and switch the crypto asset reference prices used for these products.
The affected ETPs include:
- 21Shares Bitcoin ETP (ISIN: CH0454664001, tickers: ABTC / BTCU)
- 21Shares Ethereum Staking ETP (ISIN: CH0454664027, tickers: AETH / ETHU)
- 21Shares Bitcoin Core ETP (ISIN: CH1199067674, tickers: CBTC / CBTU)
- 21Shares Ethereum Core Staking ETP (ISIN: CH1209763130, tickers: ETHC / CETU)
Currently, these products rely on CCIX Bitcoin USD (CCBTC) and CCIX Ethereum USD (CCETH) as their reference prices.
Discover: The top crypto to diversify your portfolio with
How 21Shares and FTSE are Repricing Crypto ETPs
Henceforth, from March 26 onwards, they will transition to the FTSE Bitcoin Index (1HR 1700 CET) for Bitcoin products and the FTSE Ethereum Index (1HR 1700 CET) for Ethereum products. Accordingly, the corresponding new Bloomberg index codes will be FBTC1HRE and FETH1HRE, respectively.
The FTSE Global Digital Asset Index Series, administered by FTSE Russell (part of London Stock Exchange Group), provides institutional-grade benchmarks for digital assets.
These single-asset indices use a methodology involving the FTSE DAR Reference Prices, with the “1HR 1700 CET” variant applying a one-hour lookback to determine fixes at 17:00 Central European Time.
In essence, this aims to deliver reliable, screened pricing for crypto exposures, drawing from vetted exchanges and data sources.
The new changes subsequently enhance the robustness and standardization of pricing for these ETPs, aligning them with FTSE Russell’s established framework amid growing institutional interest in digital assets.
All other product details, including fees, structure, and regulatory listings with the UK’s Financial Conduct Authority, remain unchanged.
21Shares AG, headquartered at Pelikanstrasse 37, 8001 Zurich, Switzerland, emphasized that full details are available in its UK Base Prospectus dated January 8, 2026, accessible on its website. The announcement is not an offer to sell securities, particularly in the United States, where the products are not registered.
All things considered, this move reflects broader trends in the crypto ETP space toward diversified, high-quality index providers to improve transparency and investor confidence in volatile digital asset markets.
As Wall Street deepens its involvement in crypto products and billionaire investors increasingly eye crypto infrastructure, the methodology for weighting and pricing these basket components consequently becomes critical for maintaining accurate exposure to the broader market performance.
The post 21Shares Updates Crypto Reference Prices for Four Key ETPs appeared first on Cryptonews.

For the third Monday in a row, trading in the oil market has opened with a bullish gap, although this time it is not as wide as the gap seen, for example, on 9 March. The reason for the volatility is clear — the ongoing military conflict in the Middle East, with no visible signs of de-escalation so far.
According to the latest media reports:
→ the Strait of Hormuz remains effectively closed;
→ over the weekend the United States struck Iran’s Kharg Island, a key hub for the country’s oil export infrastructure;
→ Iran launched an attack on the oil port of Fujairah in the UAE.
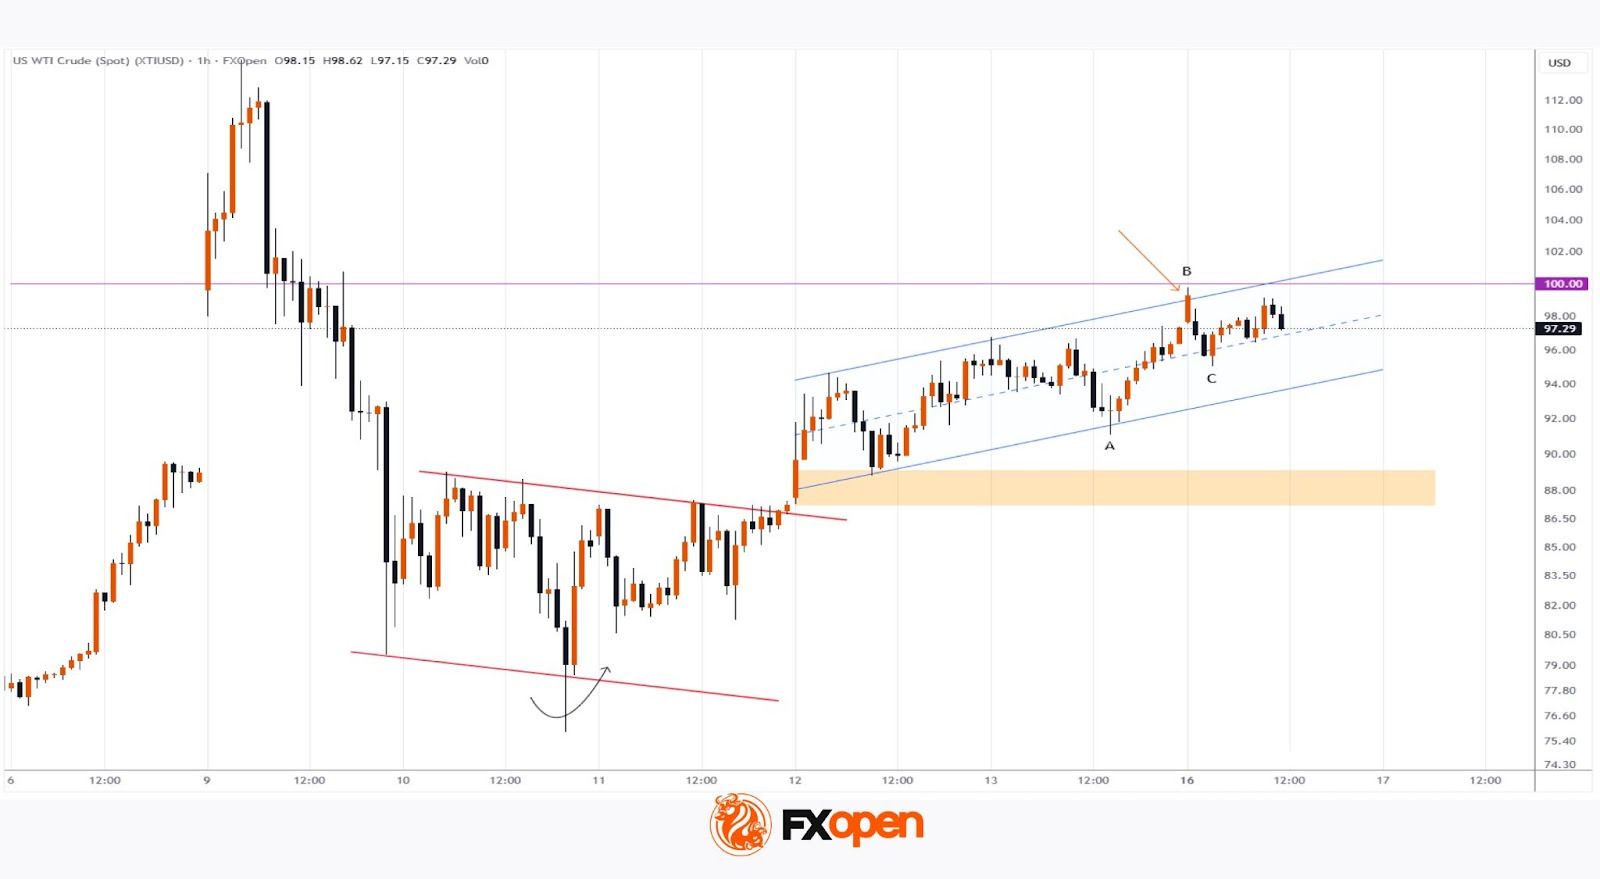
Technical Analysis of XTI/USD
While analysing WTI price movements on 11 March, we:
→ identified a local descending channel (shown with red lines);
→ highlighted a sharp reversal on 10 March (marked with an arrow).
Since then, buying pressure has continued to strengthen, largely driven by developments in the Middle East. As a result:
→ the local descending channel was broken to the upside;
→ the breakout zone later acted as support;
→ the XTI/USD chart formed the structure for an ascending channel (shown in blue).
At present, the market retains a bullish bias. For instance, the pullback from B to C represents roughly a 50% retracement of the A–B impulse, while WTI prices remain close to the psychological level of $100 per barrel.
However, the candlestick structure at the market open (marked with an arrow) suggests that sellers were able to push prices lower. Therefore, even if we see an attempt to break above the $100 level in the near term, it may struggle to gain strong momentum.
Start trading commodity CFDs with tight spreads (additional fees may apply). Open your trading account now or learn more about trading commodity CFDs with FXOpen.
This article represents the opinion of the Companies operating under the FXOpen brand only. It is not to be construed as an offer, solicitation, or recommendation with respect to products and services provided by the Companies operating under the FXOpen brand, nor is it to be considered financial advice.

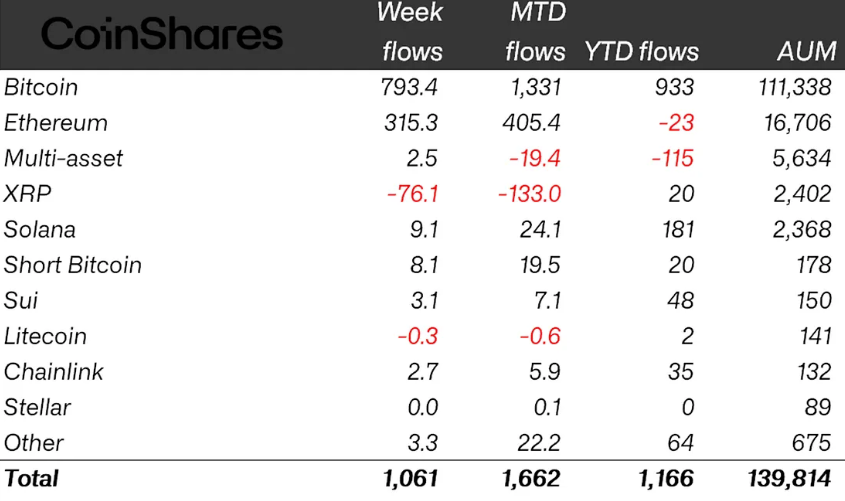
Momentum in crypto investment products persisted last week, underscoring resilience amid geopolitical stress and reinforcing Bitcoin’s role as a potential safe-haven asset. Data from CoinShares show a total of $1.06 billion flowing into crypto exchange-traded products (ETPs), led by $793 million into Bitcoin. The three-week inflow streak now totals roughly $2.7 billion, lifting year-to-date inflows to about $1.2 billion. Industry observers frame this as evidence of continued demand for digital assets, particularly Bitcoin, in a risk-off environment where traditional markets are sensitive to global tensions. Since the Iran crisis began, assets under management in digital-asset ETPs have risen about 9.4% to nearly $140 billion, marking a significant shift in scale and investor confidence.
Key takeaways
- Bitcoin ETP inflows dominated, with about $793 million of the $1.06 billion weekly total, driving three consecutive weeks of positive flows and helping to push year-to-date gains toward the $1.2 billion mark.
- Ether funds posted inflows of roughly $315.3 million last week, yet year-to-date remain in the red by around $23 million; the improved momentum partly stems from the US launch of new staking ETF listings, moving Ether exposure closer to a net-neutral position.
- XRP faced outflows totaling about $76 million for the week, while Solana attracted roughly $9.1 million of inflows, signaling divergent sentiment across major detractors and beneficiaries within the market.
- US spot Bitcoin ETFs kicked off their first five-day inflow streak of 2026, pulling in about $767.3 million, though year-to-date figures still show net outflows near $493 million, indicating a mixed near-term trajectory for spot exposure.
- Short-Bitcoin products drew inflows of around $8.1 million, suggesting a nuanced, somewhat polarized market view on near-term Bitcoin direction.
Tickers mentioned: $BTC, $ETH, $XRP, $SOL
Sentiment: Bullish
Price impact: Positive. The sustained inflows into BTC-focused ETPs and broader digital-asset products point to renewed demand and a potential shift in risk-off capital toward Bitcoin as a hedge.
Market context: The ongoing ETF activity reflects a broader liquidity backdrop and evolving regulatory acceptance of crypto products in major markets. With ETH-related staking products contributing to momentum, investors are watching whether US-listed offerings can sustain inflows in an environment shaped by macro concerns and policy developments around digital assets.
Why it matters
The persistence of inflows into crypto ETPs—especially Bitcoin—thematically reinforces a narrative that has gained traction among institutional participants: digital assets can complement traditional portfolios during periods of macro stress. The fact that Bitcoin-led products drew the lion’s share of inflows while other assets lag or reverse direction highlights the evolving core-periphery dynamics within the crypto sector, where Bitcoin remains the anchors of liquidity and perceived safety. This dynamic matters not only for traders but for asset managers seeking regulated vehicles to provide crypto exposure to a wider audience.
Ethereum’s trajectory reveals a more nuanced story. While Ether funds are still in the red year-to-date, the recent inflows coincide with the launch of new staking ETF listings in the US, which are shaping liquidity and expectations for yield-oriented crypto products. The ability of these products to move flows toward neutral parity signals that institutional appetite for Ether exposure is stabilizing, even as the broader market contends with competing narratives around yield, staking, and regulatory clarity. The reaction to staking ETFs underscores a broader trend: regulated structures can translate macro- and policy-driven developments into measurable capital movement, influencing market liquidity and price discovery across ETH-related instruments.
On the altcoin side, XRP’s outflows contrasted with modest Solana inflows, painting a picture of selective risk sentiment within the broader ecosystem. While XRP has faced persistent selling pressure, Solana’s inflows hint at continued interest in alternative layer-1 ecosystems, albeit at a smaller scale than Bitcoin. The mixed signals among major assets illustrate a market still negotiating the balance between risk, opportunity, and regulatory visibility in a rapidly evolving sector.
Finally, the unfolding story of US spot Bitcoin ETFs—tied to the first five-day inflow streak of the year—offers a useful barometer for the sector’s maturity. Despite three consecutive weeks of inflows totaling around $2.1 billion, the year-to-date tally remains negative, underscoring the volatility inherent in crypto markets and the sensitivity of flows to macro headlines and policy shifts. Investors continue to monitor whether this inflow momentum can translate into sustained positive drift, particularly as other regions contemplate or expand their own regulated crypto products.
What to watch next
- Upcoming weekly flow data to see if Bitcoin-led inflows sustain their momentum into consecutive weeks.
- Status and performance of US staking ETFs and their impact on Ether-related fund flows and pricing dynamics.
- Regulatory developments around crypto ETFs and related products, especially in the US and Europe, that could alter institutional appetite.
- Market reaction to XRP and other major altcoins as wallets and funds re-balance in response to outflows or new product launches.
- Continued monitoring of total assets under management in digital-asset ETPs to gauge whether the 9.4% rise since the Iran crisis translates into a longer-term structural shift.
Sources & verification
- CoinShares Digital Asset Fund Flows Weekly report (volume-277) detailing weekly inflows and annual totals.
- SoSoValue chart documenting weekly flows into US spot Bitcoin ETFs and the five-day inflow streak.
- Cointelegraph article: Bitcoin ETFs add $251M as Goldman Sachs tops XRP ETF holders.
- Cointelegraph article: Spot Bitcoin ETFs five-day inflow streak 2026.
Market reaction and key details
Crypto investment products continued to show resilience as investor demand reinforced Bitcoin’s standing within regulated markets. Bitcoin (CRYPTO: BTC) led the charge, drawing about $793 million of the total inflows of $1.06 billion for the week, sustaining a three-week run that has injected roughly $2.7 billion into digital-asset ETPs. This momentum helped lift year-to-date inflows to approximately $1.2 billion, while total assets under management across digital-asset ETPs rose by about 9.4% since the onset of the Iran crisis, nearing $140 billion. The data suggests a growing willingness among institutional buyers to allocate to regulated crypto products even amid geopolitical tensions that typically heighten risk aversion in traditional markets.
The performance split between assets underscores a nuanced market: Ether (CRYPTO: ETH) funds posted inflows of around $315.3 million, yet year-to-date figures remain negative by roughly $23 million as demand for ETH exposure encounters the broader macro headwinds. The late-week uplift in ETH-related flows was linked to the US’s introduction of new staking ETF listings, a development that appears to be nudging Ether exposure toward net neutrality as product availability expands. The Ethereum narrative reflects how regulated products—especially those tied to staking mechanisms—can shape price dynamics and investor appetite even when asset-specific momentum is uneven.
In contrast, XRP faced outflows of about $76 million, signaling continued selective selling pressure on the asset, while Solana drew about $9.1 million in inflows, illustrating a more modest, but positive, tilt toward SOL among market participants looking for exposure beyond Bitcoin and Ethereum. Short-Bitcoin products also attracted inflows of roughly $8.1 million, a signal that market sentiment remains polarized on near-term direction, with some participants seeking hedges or tactical bets as macro catalysts unfold.
The week’s broader narrative centered on US spot Bitcoin ETFs, which marked their first five-day inflow streak of 2026 by pulling in nearly $767.3 million. Yet, despite these fresh inflows, year-to-date performance for spot BTC funds remains negative—around $493 million—highlighting that the broader bleed from earlier months has yet to be fully offset. The juxtaposition of robust weekly inflows against a still-negative YTD tally underscores the complexity of the environment: liquidity is returning in fits and starts, but the trajectory for the year remains uncertain as stakeholders weigh macro factors and regulatory signals.
Looking ahead, observers expect this week to reveal whether US spot Bitcoin ETFs can sustain positive momentum into the March and April period, following a challenging start to the year characterized by substantial outflows in January and February that were partially offset by inflows in March. The dynamic between spot BTC demand and the evolving landscape of staking and regulated products will likely shape not only fund flows but also price formation across the crypto market as investors reassess risk and return in a shifting regulatory backdrop.
What to watch next
- Follow weekly asset flows to determine if Bitcoin-led inflows become a longer-term pattern rather than a temporary rebound.
- Monitor the performance and uptake of US staking ETFs and any regulatory clarifications that impact Ether exposure through regulated vehicles.
- Track XRP and SOL demand as new product launches and ecosystem developments unfold, potentially reshaping allocations among major altcoins.
Crypto World
PEPE, BONK outpace BTC price, ETH as “barbell strategy” wins out: Crypto Daybook Americas
By Omkar Godbole (All times ET unless indicated otherwise)
Even as bitcoin rallies, non-serious tokens such as memecoins are emerging as the biggest winners.
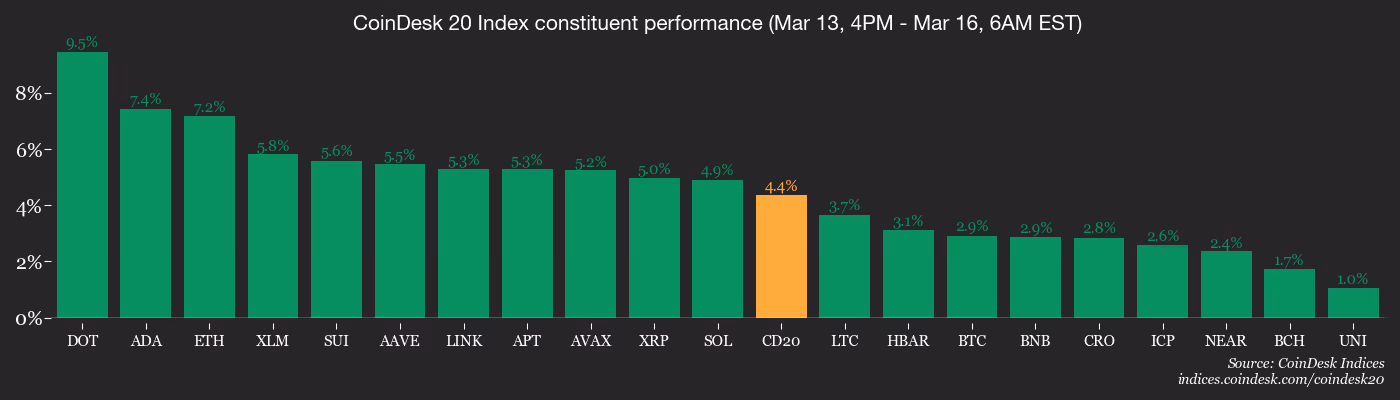
Among the majors, bitcoin jumped more than 2% in 24 hours, and at one point early Monday briefly topped $74,300 for the first time since early February. Other tokens including XRP (XRP) and solana (SOL) gained over 4%, and ether (ETH) rose 7%. The CoinDesk 20 Index added nearly 4%.
But the top-performing token among the top 100 over the past 24 hours is the memecoin PEPE, which has surged 19%. Its compatriots BONK and PENGU are up over 10%, and SHIB also outpaced ether’s 7% rise. In fact, five of the day’s best-performing coins are meme tokens.
This illustrates a trend observed since 2023–24. Observers have dubbed it the “barbell strategy:” holding a serious token like bitcoin, with growing institutional adoption, on one end, while speculating in smaller, non-serious coins such as memecoins on the other.
The behavior contrasts with the previous bull market, when BTC rallies tended to lift more productive sectors of the market, such as DeFi and play-to-earn projects.
One possible reason for the absence of a so-called “meaningful alt season” is the flood of new altcoins, which has spread demand across thousands of projects. CoinMarketCap data show the total number of tokens has surpassed 37.8 million in just three years, highlighting the massive influx of new projects.
Some observers are pinning hopes on the Clarity Act in the U.S. to reinvigorate the broader market. Others caution that time is running short for decisive regulatory action.
In traditional markets, S&P 500 futures traded higher even as oil prices tested the $100 level. Nvidia’s GTC conference begins Monday, and CEO Jensen Huang could outline the company’s AI roadmap, an event the crypto industry will watch closely for signals on data center demand. Stay alert!
Read more: For analysis of today’s activity in altcoins and derivatives, see Crypto Markets Today
What to Watch
For a more comprehensive list of events this week, see CoinDesk’s “Crypto Week Ahead“.
- Crypto
- Macro
- March 16, 8:30 a.m.: Canada consumer price index (CPI) YoY for February (Prev. 2.3%)
- Earnings (Estimates based on FactSet data)
- March 16: Bakkt Holdings (BKKT), post-market, -$0.47
- March 16: Bitcoin Depot (BTM), pre-market, -$0.47
- March 16: Cango (CANG), post-market, -$0.34
Token Events
For a more comprehensive list of events this week, see CoinDesk’s “Crypto Week Ahead“.
- Governance votes & calls
- Decentraland DAO is voting on whether to allow registered users to customize the color of their avatar name tag and to add a more accessible volume slider to the UI sidebar. Voting ends March 16 and 17.
- Unlocks
- March 16: Arbitrum (ARB) to unlock 1.78% of its circulating supply worth $9.65 millon.
- Token Launches
Conferences
For a more comprehensive list of events this week, see CoinDesk’s “Crypto Week Ahead“.
Market Movements
- BTC is up 2.22% from 4 p.m. ET Sunday at $73,300.29 (24hrs: +2.02%)
- ETH is up 5.98% at $2,259.15 (24hrs: +6.57%)
- CoinDesk 20 is up 3.81% at 2,130.70 (24hrs: +3.79%)
- Ether CESR Composite Staking Rate is unchanged at 2.74%
- BTC funding rate is at 0.0041% (4.4435% annualized) on Binance

- DXY is unchanged at 100.29
- Gold futures are down 1.36% at $4,983.70
- Silver futures are down 2.80% at $78.65
- Nikkei 225 closed down 0.13% at 53,751.15
- Hang Seng closed up 1.45% at 25,834.02
- FTSE 100 is unchanged at 10,261.99
- Euro Stoxx 50 is down 0.67% at 5,678.08
- DJIA closed on Friday down 0.26% at 46,558.47
- S&P 500 closed down 0.61% at 6,632.19
- Nasdaq Composite closed down 0.93% at 22,105.36
- S&P/TSX Composite closed down 0.91% at 32,541.93
- S&P 40 Latin America closed down 0.16% at 3,584.57
- U.S. 10-Year Treasury rate is up 1 bps at 4.28%
- E-mini S&P 500 futures are up 0.37% at 6,660.50
- E-mini Nasdaq-100 futures are up 0.45% at 24,504.25
- E-mini Dow Jones Industrial Average futures are up 0.78% at 46,957.00
Bitcoin Stats
- BTC Dominance: 59.22% (-0.29%)
- Ether-bitcoin ratio: 0.03088 (3.24%)
- Hashrate (seven-day moving average): 947 EH/s
- Hashprice (spot): $32.00
- Total fees: 1.97 BTC / $140,987
- CME Futures Open Interest: 111,895 BTC
- BTC priced in gold: 14.8 oz.
- BTC vs gold market cap: 4.92%
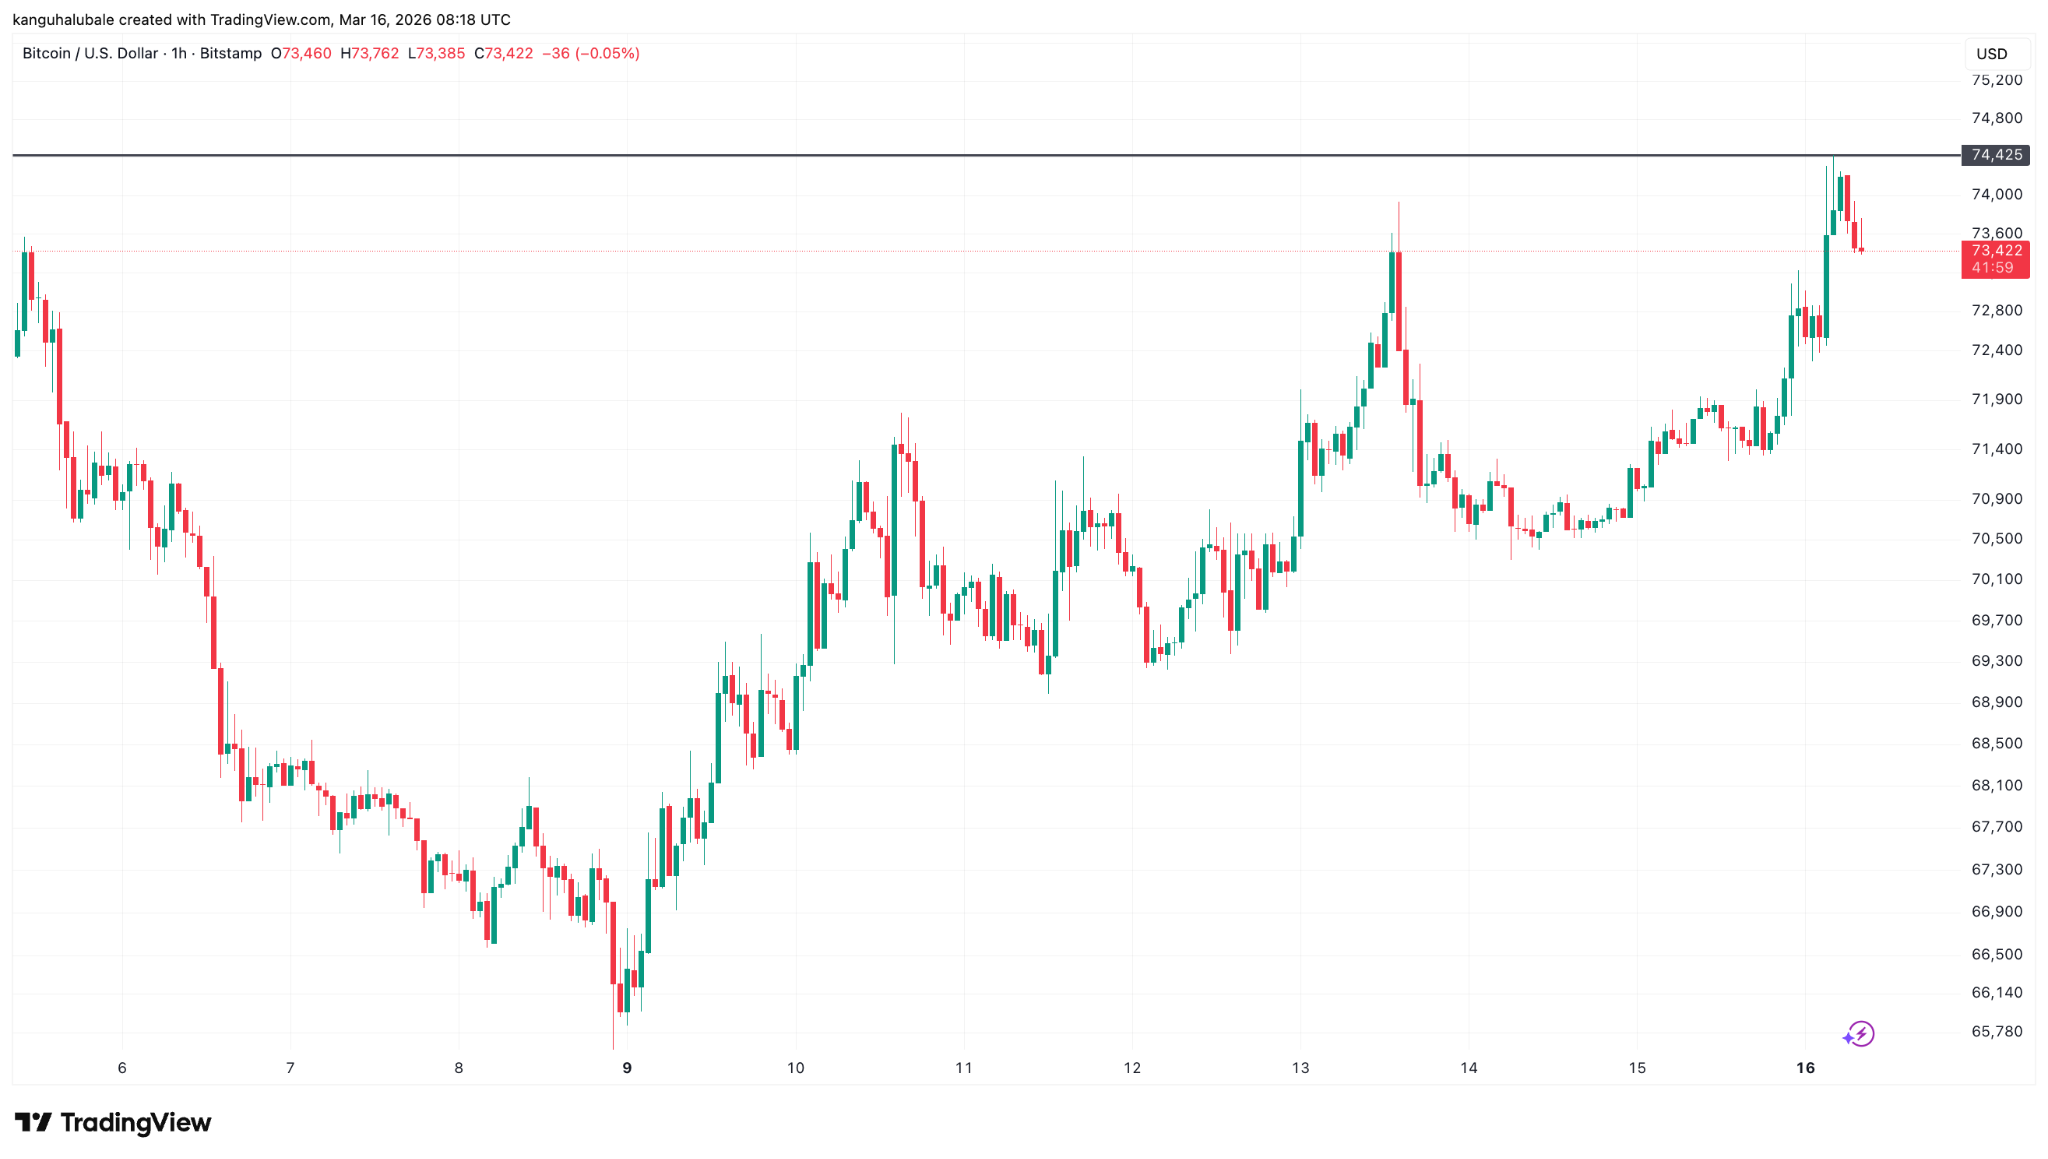
Technical Analysis

- The chart shows bitcoin’s daily price swings in candlestick format since September 2025.
- Despite the recent bounce, BTC remains trapped in a sideways grind marked by trendlines connecting highs hit on Feb. 8 and March 4 and lows from Feb. 6 and Feb. 24.
- The next move largely depends on the direction in which the range play is resolved.
- A similar price action unfolded in the two months to mid-January and ended deepening the selloff to nearly $60,000.
Crypto Equities
- Coinbase Global (COIN): closed on Friday at $195.53 (+1.19%), +2.72% at $200.84 in pre-market
- Galaxy Digital (GLXY): closed at $22.35 (+8.34%), +2.68% at $22.95
- MARA Holdings (MARA): closed at $9.32 (+6.39%), +3.54% at $9.65
- Riot Platforms (RIOT): closed at $14.04 (–3.17%), +2.42% at $14.38
- Core Scientific (CORZ): closed at $16.49 (+1.54%), +0.73% at $16.61
- CleanSpark (CLSK): closed at $9.76 (+2.20%), +3.18% at $10.07
- Exodus Movement (EXOD): closed at $8.97 (–9.94%)
- CoinShares Bitcoin Miners ETF (WGMI): closed at $38.28 (+0.83%)
- Circle Internet Group (CRCL): closed at $115.38 (+1.05%), +2.88% at $118.70
- Bullish (BLSH): closed at $36.62 (+1.05%), +2.40% at $37.50
Crypto Treasury Companies
- Strategy (MSTR): closed at $139.67 (+1.70%), +3.10% at $144.00
- Strive Asset Management (ASST): closed at $9.53 (+7.93%), +3.04% at $9.82
- SharpLink (SBET): closed at $7.53 (+0.67%), +5.84% at $7.97
- Upexi (UPXI): closed at $1.11 (+19.35%), +9.91% at $1.22
- Lite Strategy (LITS): closed at $1.18 (+2.61%)
ETF Flows
Spot BTC ETFs
- Daily net flows: $180.4 million
- Cumulative net flows: $56.12 billion
- Total BTC holdings ~ 1.29 million
Spot ETH ETFs
- Daily net flows: $26.7 million
- Cumulative net flows: $11.82 billion
- Total ETH holdings ~ 5.73 million
Source: Farside Investors
While You Were Sleeping
Bitcoin (BTC) found fresh strength during the early Asian trading hours on Monday as bulls eyed further short-term gains.
Key takeaways:
-
Bitcoin price rises to a six-week high of $74,400 on Monday, liquidating $300 million in shorts.
-
The 50-day moving average above $71,120 is a key support level to watch for BTC/USD going forward.
Bitcoin leads market in new relief bounce
Data from TradingView showed 2.5% daily BTC price gains, with BTC/USD rising as high as $74,400 for the first time since Feb. 4.

Ether (ETH), the largest altcoin by market capitalization, was trading at $2,250 at the time of writing, up 7% over the last 24 hours. Fifth-placed XRP (XRP) has gained nearly 5% over the last day to trade just above $1.48.
Solana (SOL) has also posted significant gains among the top 10 cryptocurrencies, up 6% over the same period. As a result, the global crypto market capitalization is up 4% over the day to $2.49 trillion on Monday.

“Bitcoin pumped $1,800 in just 30 minutes, hitting a 40-day high of $74,300,” analyst Bull Theory said in the latest post on X, adding:
“It’s surprising how risk assets are performing better than safe-haven assets like gold and silver during an active war.”
Bitcoin’s relief rally is accompanied by significant short liquidations across the crypto market totaling $300 million over the last 24 hours. Meanwhile, Bitcoin futures open interest (OI) continued to rise, with monitoring resource Coinglass showing a 6% jump to $49.2 billion in the past 24 hours.
Commenting on the data, Coinglass said that the same pattern of the OI rising in tandem with the price “preceded the last volatility spikes,” adding:
“New fuel is building again.”

Bulls reclaim the 50-day BTC price trend line
Bitcoin’s latest recovery saw it reclaim a key support level in the form of the 50-day simple moving average (SMA) at $71,120.
“Impressive strength on BTC today – set to close a daily candle above its 50MA for the first time in 55 days,” said trader and investor MacroSRG in a Monday post on X.
BTC rallied 33% in just a month following the last time the price reclaimed this trend line after a long period of trading below it.

Bitcoin is also “set to close 8 consecutive daily green candles for the first time since December 2020,” analyst Max Crypto said in an X post, adding:
“Last time this happened, BTC rallied 145% in just 2 months.”
Echoing this, MN Capital founder Michael van de Poppe said that while Bitcoin continues to build momentum, its valuation against gold “rallies substantially,” adding:
“There’s more upside to come; $ETH broke out of the range, which means it’s a matter of time until Bitcoin continues the rally towards $80K.”

Along with the 50-day SMA, the BTC/USD pair now also trades above other key long-term levels, including the 200-week exponential moving average (EMA) and the old 2021 all-time high at $68,300 and $69,400, respectively.
This article does not contain investment advice or recommendations. Every investment and trading move involves risk, and readers should conduct their own research when making a decision. While we strive to provide accurate and timely information, Cointelegraph does not guarantee the accuracy, completeness, or reliability of any information in this article. This article may contain forward-looking statements that are subject to risks and uncertainties. Cointelegraph will not be liable for any loss or damage arising from your reliance on this information.
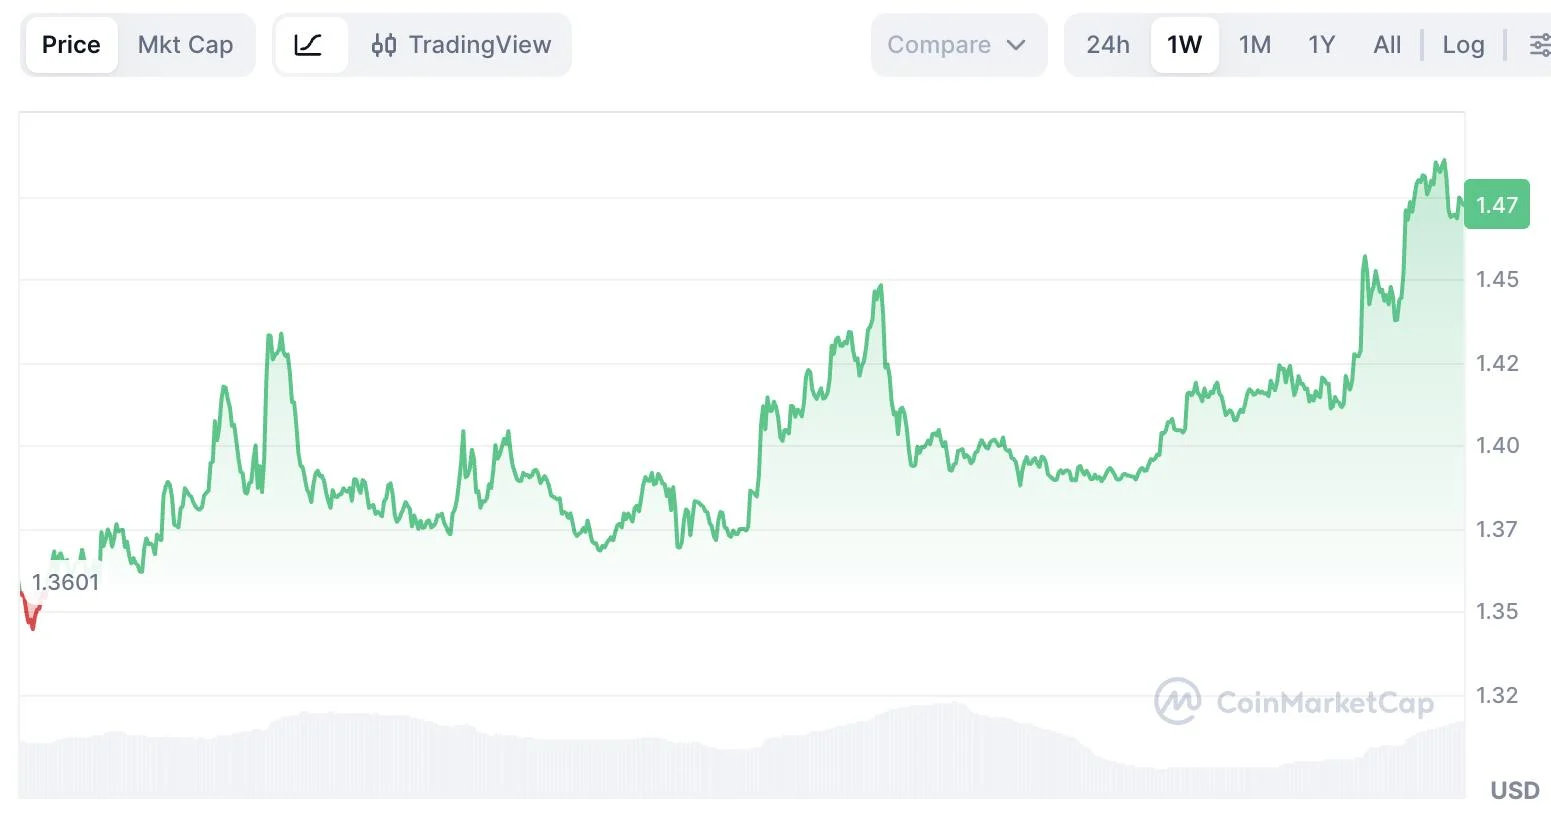
The cryptocurrency market is seeing renewed bullish momentum as XRP climbed to around $1.47, gaining nearly 4% in the past 24 hours. The move highlights growing investor interest in major altcoins as traders rotate back into digital assets amid broader volatility across traditional financial markets.
Meanwhile, Bitcoin surged past $74,000, rising more than 3% in a single day and triggering roughly $115 million in short liquidations. The rally comes as global markets react to geopolitical tensions, with cryptocurrencies showing resilience compared to some traditional assets. Since the start of the latest market volatility, Bitcoin has climbed more than 12% from around $66,000, helping push the total crypto market capitalization toward $2.5 trillion.
As the market heats up, new projects are also entering the spotlight, including the Ethereum-based memecoin APEPEPE, which has officially launched its presale phase. The project is positioning itself within the fast-growing memecoin sector that previously produced breakout successes such as Dogecoin and Shiba Inu. By focusing on community engagement and viral branding, the team behind APEPEPE aims to build momentum during the early stages of its launch.
Institutional activity is also playing a role in the current market strength. U.S. spot Bitcoin ETFs have recorded hundreds of millions of dollars in inflows, helping support Bitcoin’s climb while improving overall sentiment across the crypto sector. However, analysts still warn that macroeconomic uncertainty and global events could create short-term volatility.
Despite these risks, many traders believe the current environment could spark a new wave of innovation and speculative interest across the crypto ecosystem. With major assets like XRP and Bitcoin leading the rally, attention is increasingly shifting toward emerging projects that could capture the next cycle of market excitement.
For early-stage investors and crypto enthusiasts watching the memecoin sector, projects like APEPEPE are gaining attention precisely because they are still in their early phases. As the presale unfolds and the community continues to grow, supporters hope the project could become one of the standout newcomers in the evolving memecoin landscape.
Learn more about APEPEPE:
Website: https://apepepe.com
X (Twitter): https://x.com/realAPEPEPE
Disclaimer: This is a Press Release provided by a third party who is responsible for the content. Please conduct your own research before taking any action based on the content.

Key Takeaways
- Shares of Ulta Beauty tumbled over 10% following its Q4 earnings release, pressured by conservative fiscal 2026 projections and a modest bottom-line shortfall
- The company’s Q4 earnings per share of $8.01 exceeded both internal projections and analyst consensus, while sales reached $3.90B, marking an 11.8% year-over-year increase
- Comparable store sales climbed 5.8% in Q4, with positive momentum across all primary product segments
- Fiscal 2026 comp sales outlook of 2.5%–3.5% fell short of Street expectations, with management signaling flat operating margin performance ahead
- The beauty retailer announced a $1 billion share repurchase program for this year; institutional shareholders control 90.39% of shares, while analyst consensus leans “Moderate Buy” at $671.27 price target
Ulta Beauty delivered what would typically be considered a strong fourth-quarter performance, yet investors fixated on softer full-year projections and a minor earnings shortfall against elevated expectations. Shares plummeted more than 10% following the earnings announcement, extending losses to approximately 19% since Barron’s recommended the stock less than 30 days prior.
The beauty retailer reported Q4 earnings of $8.01 per share, surpassing the consensus forecast of $7.93 by eight cents. Top-line results reached $3.90 billion, representing an 11.8% year-over-year improvement and exceeding analyst projections of $3.81 billion. Gross profit margins also came in ahead of estimates. What triggered the selloff? Earnings missed certain higher-end projections, and the company’s fiscal 2026 outlook proved more conservative than investors anticipated.
For the current fiscal year, management projected comparable sales expansion of 2.5% to 3.5% — landing below Wall Street’s midpoint expectations — while signaling operating margins would remain essentially unchanged. Elevated marketing expenditures, rising incentive-based compensation, and strategic reinvestment initiatives are compressing profitability. The company also faces more challenging year-over-year comparisons following a robust FY25 performance.
With a new chief financial officer recently appointed, the measured guidance approach may reflect fresh leadership caution. Raymond James analyst Olivia Tong observed that the conservative stance aligns with Ulta’s traditional guidance philosophy, potentially reinforced by current macroeconomic and geopolitical uncertainty.
Wall Street Moderates Targets While Maintaining Support
Though the market’s response was severe, few analysts issued downgrades. UBS maintained its “buy” recommendation with an $810 price objective. William Blair analyst William Carden suggested the sharp decline “could reverse quickly” following the reset of 2026 expectations around stable margins. TD Cowen’s Oliver Chen emphasized Ulta’s “low-to-luxe” product range as an enduring competitive advantage.
Overall analyst sentiment remains at “Moderate Buy,” comprising 15 Buy ratings, 10 Hold recommendations, one Strong Buy, and a single Sell rating. The consensus price target stands at $671.27, compared to Monday’s opening price of $535.72 — suggesting substantial upside potential if operational execution meets projections.
Zacks Investment Research shifted its rating from “Strong Buy” to “Hold” in February, ahead of the earnings release. Jefferies, which initiated coverage in January, maintains a “Hold” stance with a $700 target.
Institutional Investors Increasing Stakes
Despite the post-earnings turbulence, several institutional investors expanded their holdings. Holocene Advisors LP increased its ULTA position by 339.6% during Q3, acquiring an additional 293,516 shares for a combined stake valued at approximately $207.7 million. Focus Partners Wealth, Intech Investment Management, and multiple other institutional funds similarly added exposure in recent quarters.
Institutional ownership currently represents 90.39% of outstanding shares.
The company’s Q4 comparable sales growth of 5.8% compares favorably against flat performance in Kohl’s Sephora partnership. Digital channels continue gaining traction, with artificial intelligence-powered personalization identified as a key catalyst. The retailer also plans to introduce a curated TikTok Shop presence, aiming to capture younger demographic segments.
Ulta’s 52-week trading range spans from $323.36 to $714.97. Monday’s opening price of $535.72 sits notably below the 50-day moving average of $665.60 and the 200-day average of $587.65.
Management established fiscal 2026 EPS guidance at $28.05–$28.55, compared to the current analyst consensus of $23.96 for the period.
Crypto investment products continued their momentum last week, signaling resilience to geopolitical stress and strengthening the case for Bitcoin’s role as a safe-haven asset.
Crypto exchange-traded products (ETPs) recorded $1.06 billion in inflows last week, led by $793 million into Bitcoin (BTC), CoinShares reported on Monday.
The inflows mark three consecutive weeks of positive flows totaling $2.7 billion, driving net inflows to around $1.2 billion year-to-date.
CoinShares’ head of research, James Butterfill, said the rising momentum over the past few weeks underscores the resilience of digital assets, particularly Bitcoin, as a “relative safe haven” compared with other asset classes.
Since the onset of the Iran crisis, total assets under management (AuM) in digital asset ETPs have risen by 9.4% to nearly $140 billion, he said.
Ethereum ETP flows about to turn neutral with fresh $315 million inflows
With the latest inflows, Bitcoin ETPs increased year-to-date gains to $933 million. Ether (ETH) funds are still in the red, with around $23 million in outflows YTD after $315.3 million of inflows last week.
Butterfill said the launch of new staking ETF listings in the US contributed to the positive momentum, bringing the flows close to a net neutral position.

XRP (XRP) suffered its second week of outflows totaling $76 million, while Solana (SOL) saw $9.1 million of inflows.
Related: Bitcoin ETFs add $251M as Goldman Sachs tops XRP ETF holders
Short-Bitcoin products also recorded inflows of $8.1 million last week, highlighting that market opinion remains “somewhat polarized,” Butterfill said.
Spot Bitcoin ETFs post first five-day inflow streak, year-to-date losses still at $500 million
The majority of Bitcoin fund inflows were driven by US spot Bitcoin exchange-traded funds (ETFs), which recorded their first five-day inflow streak of 2026, attracting $767.3 million in new funds last week.
Despite three consecutive weeks of inflows totaling $2.1 billion, the ETFs remain in negative territory for the year, with approximately $493 million in net outflows year-to-date.

This week will reveal whether US spot Bitcoin ETFs can finally turn positive for 2026, after $1.8 billion in outflows in January and February were partially offset by $1.34 billion in inflows in March.
Magazine: Spot Bitcoin ETFs first green week, crypto ATM losses surge 33%: Hodler’s Digest, Mar. 8 – 14


President Donald Trump’s family-backed crypto project, World Liberty Financial (WLFI) has passed a governance proposal requiring token holders to lock up their tokens for nearly six months in order to participate in protocol voting.
Summary
- WLFI holders approved a governance proposal requiring token holders to stake their tokens for 180 days in order to participate in protocol voting.
- Participants who stake WLFI and vote at least twice during the lock period can earn roughly 2% annual yield.
The proposal received overwhelming support and was approved with 99.12% of 1,800 votes cast in favor, although more than 76% of the voting power came from just ten users.
WLFI introduced the proposal last month, outlining a governance staking system that would require holders of unlocked WLFI tokens to stake their assets before they can participate in votes that determine the direction of the protocol and its broader ecosystem.
According to the firm, the change would ensure that only participants with “long-term alignment to the protocol” are able to influence governance decisions.
The proposal “rewards WLFI holders who have demonstrated the most commitment to WLFI governance and the WLFI ecosystem with additional opportunity to engage in the future of the WLFI ecosystem and potential commercial arrangements,” the document states.
Another goal of the initiative is to promote the adoption of WLFI’s USD1 stablecoin by redirecting value that previously flowed to market makers toward ecosystem participants.
To incentivize participation, the proposal introduces a base reward of roughly 2% annual yield for token holders who stake their WLFI and take part in at least two governance votes during the lock-up period. Meanwhile, holders whose tokens are already locked remain eligible to vote without additional staking requirements.
Further, the proposal documents outline a “Super Node” tier requiring participants to stake 50 million WLFI tokens, worth about $5 million, which would grant them “guaranteed direct access” to the WLFI team for collaboration and partnership discussions.
In a recent statement to Reuters, WLFI spokesman David Wachsman confirmed that the access would be limited to the project’s business development team and executives rather than direct engagement with specific founders. Trump’s sons Eric and Barron are listed in project materials as part of the team supporting the platform.
As part of its longer-term plans centered around the USD1 stablecoin, the platform is also seeking a national trust bank charter from the U.S. Office of the Comptroller of the Currency.
The effort has drawn scrutiny from Washington lawmakers, with some arguing that the application should not move forward unless potential conflicts of interest tied to the project are addressed.
Concerns center on the project’s links to President Donald Trump and members of his family who are financially involved in the venture.

How a charity founded by farmers’ wives helps children in the Borders
Micron (MU) Stock Surges 5% After Revealing Second Taiwan Fab Expansion Plans
25 Movies With the Most Oscar Nominations

Smart energy pays enters the US market, targeting scalable financial infrastructure

Why Israel is blocking foreign journalists from entering

Bitcoin: We’re Entering The Most Dangerous Phase

Bitcoin: Der Markt steht vor einer riesigen Bewegung

5 Steps to Financial Freedom: Move Differently to Build Real Wealth. #FinancialFreedom #WealthBuildn

Money Song, Twinkle Twinkle Little Star + More Kids Songs | Gracie’s Corner Compilation
-
 Tech5 days ago
A 1,300-Pound NASA Spacecraft To Re-Enter Earth’s Atmosphere
-
 Crypto World2 days ago
HYPE Token Enters Net Deflation as HyperCore Buybacks Outpace Staking Rewards
-

 Business6 days ago
ExxonMobil seeks to move corporate registration from New Jersey to Texas
-

 Crypto World7 days ago
Paradigm, a16z, Winklevoss Capital, Balaji Srinivasan among investors in ZODL
-

 Fashion3 days ago
Weekend Open Thread: Addict Lip Glow
-

 Tech6 days ago
ChatGPT will now generate interactive visuals to help you with math and science concepts
-
Sports2 days ago
Why Duke and Michigan Are Dead Even Entering Selection Sunday
-

 NewsBeat5 days ago
Residents reaction as Shildon murder probe enters second day
-

 Business5 days ago
Search Enters Sixth Week With New Leads in Tucson Abduction Case
-
 NewsBeat6 days ago
Pagazzi Lighting enters administration as 70 jobs lost and 11 stores close across Scotland
-

 Business17 hours ago
Search for Savannah Guthrie’s Mother Enters Seventh Week with No Arrests
-

 Tech7 days ago
Despite challenges, Ireland sixth in EU for board gender diversity
-

 Business2 days ago
US Airports Launch Donation Drives for Unpaid TSA Workers as Partial Government Shutdown Enters Fifth Week
-
Crypto World2 days ago
Coinbase and Bybit in Investment Talks: Could Bybit Finally Enter the US Crypto Market?
-

 NewsBeat5 days ago
I Entered The Manosphere. Nothing Could Prepare Me For What I Found.
-

 Business7 days ago
Search Enters 39th Day with FBI Tip Line Developments and No Major Breakthroughs
-

 Business2 days ago
Country star Brantley Gilbert enters growing non-alcoholic beer market
-

 Crypto World6 days ago
Will Chainlink price reclaim $10 amid volatility squeeze?
-

 Business2 hours ago
Australian shares drop as Iran war enters third week
-

 Sports5 days ago
PWHL, Senators discussing plan to keep Charge in Ottawa

