

Crypto World
BTC price nears $74,000, memecoins drive risk-on mood: Crypto Markets Today


The crypto market is on the cusp of a major breakout as bitcoin trades at $73,000 and ether (ETH) at $2,250, its highest level since Feb. 4.
If bitcoin, the largest cryptocurrency by market capitalization, can break above $74,000 on convincing volume, it will likely run back to $80,000, which was a level of support in November before an eventual breakdown in January.
A rejection, on the other hand, would lead to a reversion to a trading range between $62,000 and $72,000, which has persisted for more than a month.
But the main story on Monday is not among crypto majors, it is the altcoin market and memecoins in particular.
PEPE rose by around 20% in the past 24 hours, while BONK and PENGU are also up by double digits. However, “overbought” conditions on the average relative strength index (RSI) suggest a pullback may be in store before any breakout.
Oil remains inflated at above $106 per barrel despite the U.S. reportedly considering a coalition to escort ships through the Strait of Hormuz, a key trade route.
U.S. stock futures are up around 0.5% and crypto-related companies are advancing in pre-market trading. Crypto exchange Coinbase (COIN) was recently 3% higher and Circle Internet (CRCL) added 5%. Bitcoin treasury company Strategy (MSTR) gained 4%.
Precious metals fell and the dollar weakened, reflecting risk-on sentiment.
Derivatives positioning
- Industry-wide futures open interest has risen over 8% to $112.34 billion in 24 hours in a sign of increased risk-taking in the market.
- Open interest (OI) in ether (ETH) and futures increased by 16% and 19%, respectively, leading the growth among major cryptocurrencies. This indicates strong investor preference for smart contract tokens. OI in bitcoin rose more than 5%.
- In ether’s case, OI in coin terms climbed to 14.34 million ETH, the most since September 2025.
- There are signs of speculation in non-serious tokens such as : Open interest tied to the cryptocurrency has jumped over 11%.
- The growth in OI in most major tokens is accompanied by positive perpetual funding rates and cumulative volume deltas. This combination indicates a rising demand for bullish leveraged plays.
- On Deribit, however, puts tied to bitcoin and ether continue to trade pricier than calls across all time frames. That’s a sign of continued demand for downside hedging despite the market bounce. Overhead call selling could be another reason for the persistent put premium.
- In XRP’s case, the $1.40 strike call and put are the most popular, cumulatively boasting a notional open interest of $14 million. That’s nearly 25% of the total XRP options open interest on the exchange.
Token talk
- The altcoin market is in a jubilant mood with the “altcoin season” index hitting 48/100, the highest in just over two months.
- The total crypto market cap excluding bitcoin reached $1.1 trillion on Monday, adding around $40 billion in the past 24 hours and $10 billion since midnight UTC, according to TradingView.
- The best-performing CoinDesk benchmark over the past 24 hours has been the Smart Contract Platform Select Capped Index (SCPXC), which is made up of ETH, SOL, ADA and SUI among layer-1 networks. The SCPXC is up by 6.3%, closely followed by the Memecoin Index (CDMEME), which has risen by 5.2%.
- AI-focused token bittensor (TAO) lost 3.7% since midnight. This is a consolidation move rather than a decline after it surged by more than 69% from March 8 to March 15.
- It appears some of those profits are being rotated into another AI project, , which has benefitted from a 60% increase in daily trading volume to $195 million, with the token rising by 11% as a result.


Quick Overview
- Salesforce initiated a record-breaking $25 billion accelerated share repurchase (ASR) program — its largest ever
- The repurchase commenced March 11, 2026, delivering approximately 103 million shares upfront
- These 103M shares account for about 80% of the anticipated total repurchase volume
- This $25B ASR represents half of a comprehensive $50 billion buyback authorization approved by directors in February 2026
- CRM shares climbed approximately 2.5% during premarket hours Monday; complete settlement anticipated in Q3 or Q4 of fiscal 2027
Salesforce (CRM) initiated its historic $25 billion accelerated share repurchase initiative on Monday, marking the company’s most substantial ASR to date and pushing shares higher by approximately 2.5% in early trading.
The cloud computing giant verified the prepayment and upfront transfer of approximately 103 million shares through ASR contracts executed on March 11, 2026, involving several prominent banking institutions.
The financial partners include Banco Santander, Bank of America, Citibank, JPMorgan Chase Bank, and Morgan Stanley, with J. Wood Capital Advisors providing advisory services for the arrangement.
The upfront transfer of 103 million shares constitutes approximately 80% of total shares projected for repurchase in this phase. The precise final count will depend on CRM’s volume-weighted average trading price throughout the transaction period, adjusted for a discount and other variables.
CEO Marc Benioff expressed strong enthusiasm for the decision. “We are aggressively repurchasing shares because we are so confident in the future of Salesforce,” he stated.
Robin Washington, Salesforce’s president and chief operating and financial officer, characterized the ASR as demonstrating the organization’s “increased conviction in the durability of its growth and cash flow trajectory.”
The $25 billion initiative represents the immediate deployment of precisely half the $50 billion comprehensive share repurchase authorization that Salesforce’s board of directors greenlit during February 2026.
This $50 billion overall program stands among the most substantial buyback commitments in enterprise software sector history.
Financial Details of the Transaction
The upfront 103 million share transfer calculation utilizes CRM’s closing stock price from March 11, 2026 — when the ASR contracts were officially signed.
Final settlement for this $25 billion portion is projected to occur during either the third or fourth quarter of Salesforce’s fiscal year 2027.
Trading approximately 2.5% higher in Monday’s premarket session, investors demonstrated cautious optimism about the announcement, though the response remained relatively modest considering the program’s magnitude.
Salesforce has faced mounting shareholder pressure throughout the past year to productively deploy its expanding cash reserves, and the $50 billion commitment represents a clear response to those demands.
Looking Forward
The additional $25 billion portion of the comprehensive $50 billion authorization remains unexecuted at this time.
This second installment may proceed through additional ASR arrangements or traditional open market acquisitions, though Salesforce hasn’t disclosed a specific timeframe.
The present ASR encompasses five major financial institutions, indicating a carefully orchestrated and professionally managed implementation rather than a straightforward market-based buyback approach.
The definitive share count for this phase will only be determined upon settlement completion, which isn’t anticipated until late in fiscal year 2027.

Momentum indicators are important tools for traders seeking to evaluate the strength and speed of price movements. These technical analysis instruments are used by traders to identify potential entry and exit points, confirm market signals, and filter market noise. In this article, we review five momentum indicators that remain widely used by traders to support them in their decision-making in volatile markets.
What Is a Momentum Indicator?
Momentum in technical analysis refers to the rate at which an asset’s price accelerates or decelerates. Understanding momentum may assist traders in identifying potential trend continuations or reversals.
A momentum indicator is a technical analysis tool that measures how quickly and strongly an asset’s price is moving. Instead of showing the direction of the trend, it highlights the strength behind price movements. By comparing price changes over a set period, momentum indicators can help traders see if a market is gaining or losing strength. This information is often used to spot potential overbought or oversold conditions and to identify possible entry or exit points.
A stock momentum indicator like the Relative Strength Index (RSI), for instance, may indicate that stocks are currently bought or sold too heavily and their price is due for a reversal.
The Significance of Momentum Technical Indicators
Momentum indicators do not focus on the direction of the price movement, but rather on the strength behind it. They’re able to quantify and represent hidden clues about the future market direction. By learning to read momentum indicators, traders can develop trading strategies and identify conditions for new trades.
Momentum tools produce a range of signals that offer traders an edge over the markets. Let’s take a look at some of the most common momentum signals, including overbought/oversold conditions, divergences, and crossovers.
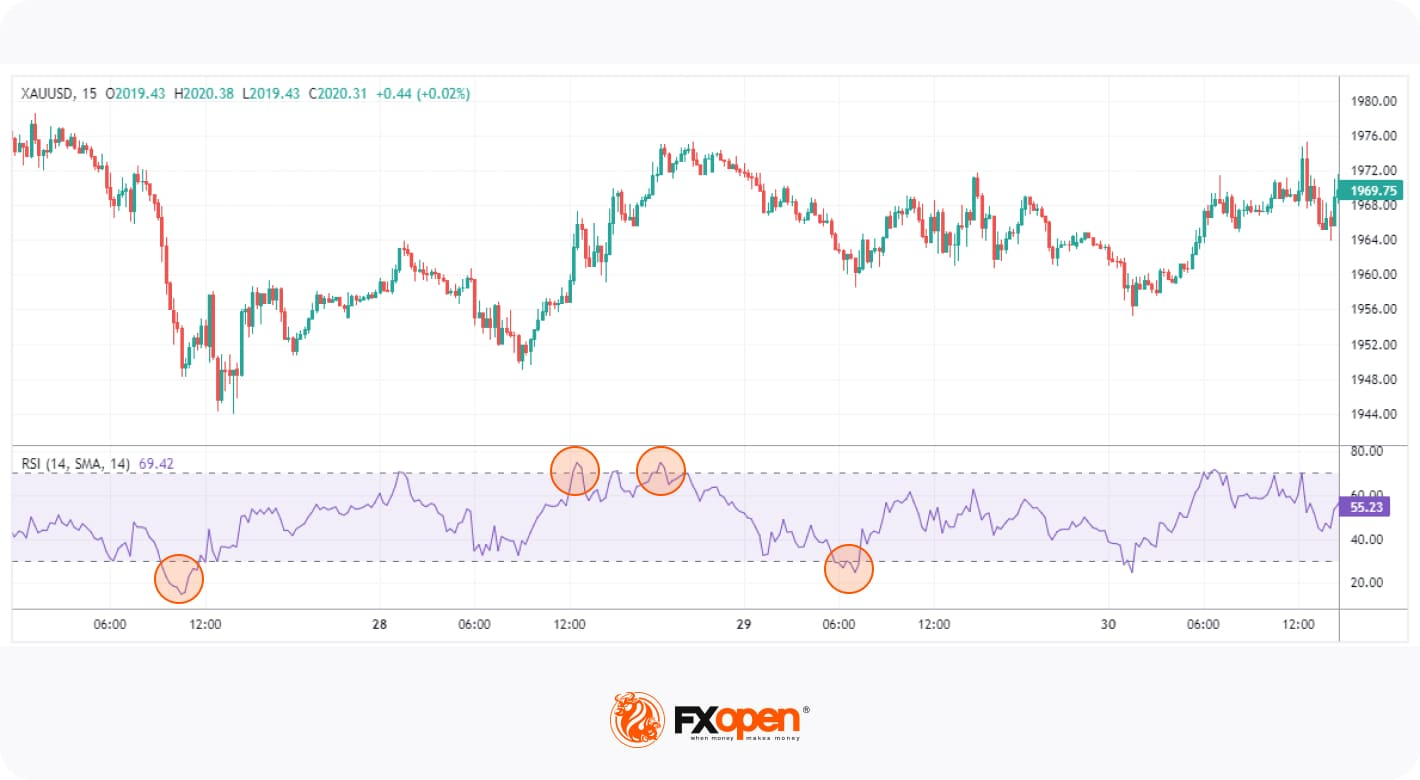
Overbought and Oversold Conditions

These signals indicate when an asset’s price has moved too far in one direction without sufficient support from fundamental or technical factors and is likely to reverse. For example, RSI generates overbought signals when the reading rises above 70 and signals oversold conditions when the reading falls below 30.
Divergence
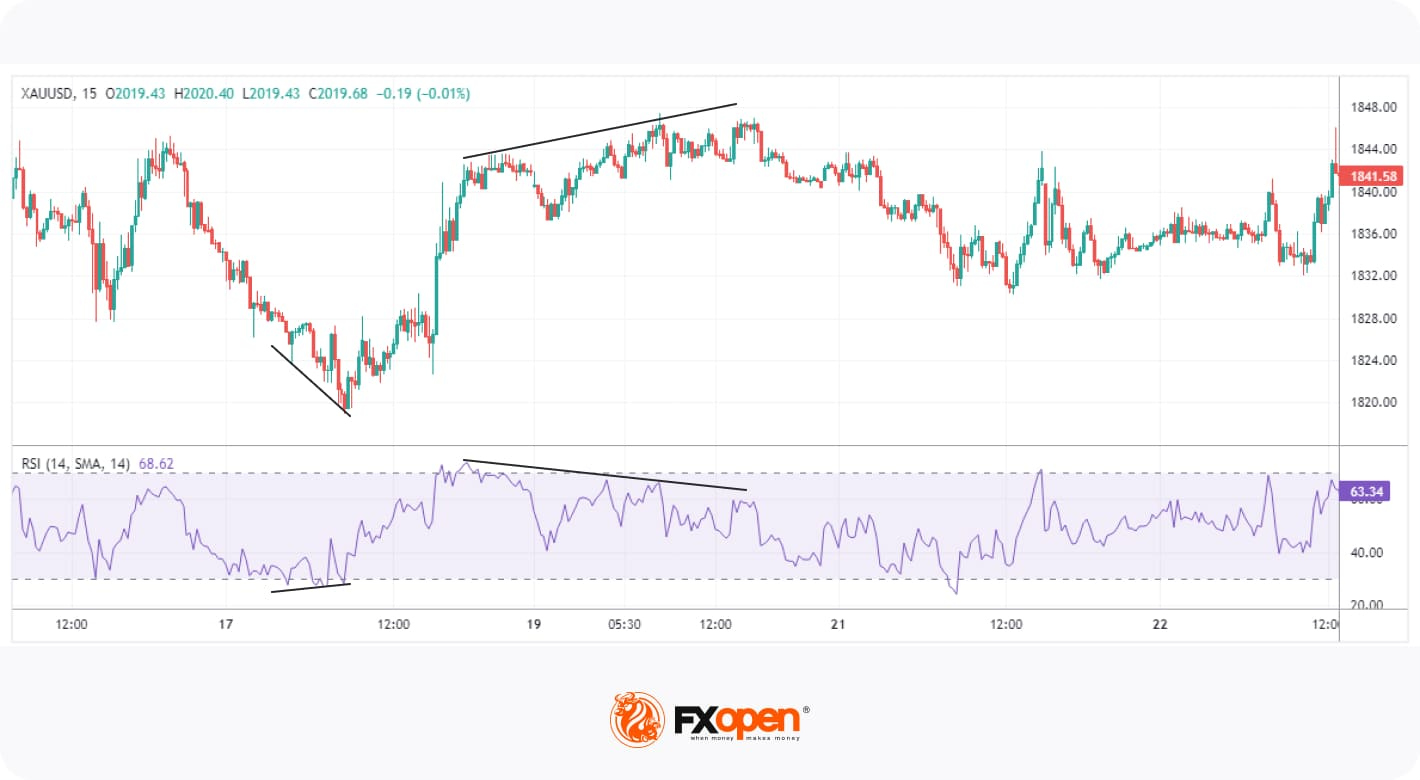
Divergence occurs when the price of an asset moves in the opposite direction of the indicator, suggesting an upcoming reversal. For instance, when the price is making higher highs, but RSI is making lower highs, this indicates a bearish divergence that increases the likelihood of a downward move.
Crossover

These signals are generated when the indicator’s lines cross each other or a certain threshold. A common example is the MACD, where traders look for crossovers between the fast MACD line and the slower signal line to spot potential entry and exit points.
List of Five Momentum Indicators for Technical Analysis
Now that we understand the types of signals that momentum tools produce, let’s break down five of the most popular with a momentum indicators list. If you’d like to experiment with them yourself, you’ll find each tool in the TickTrader trading platform.
1. Relative Strength Index (RSI)
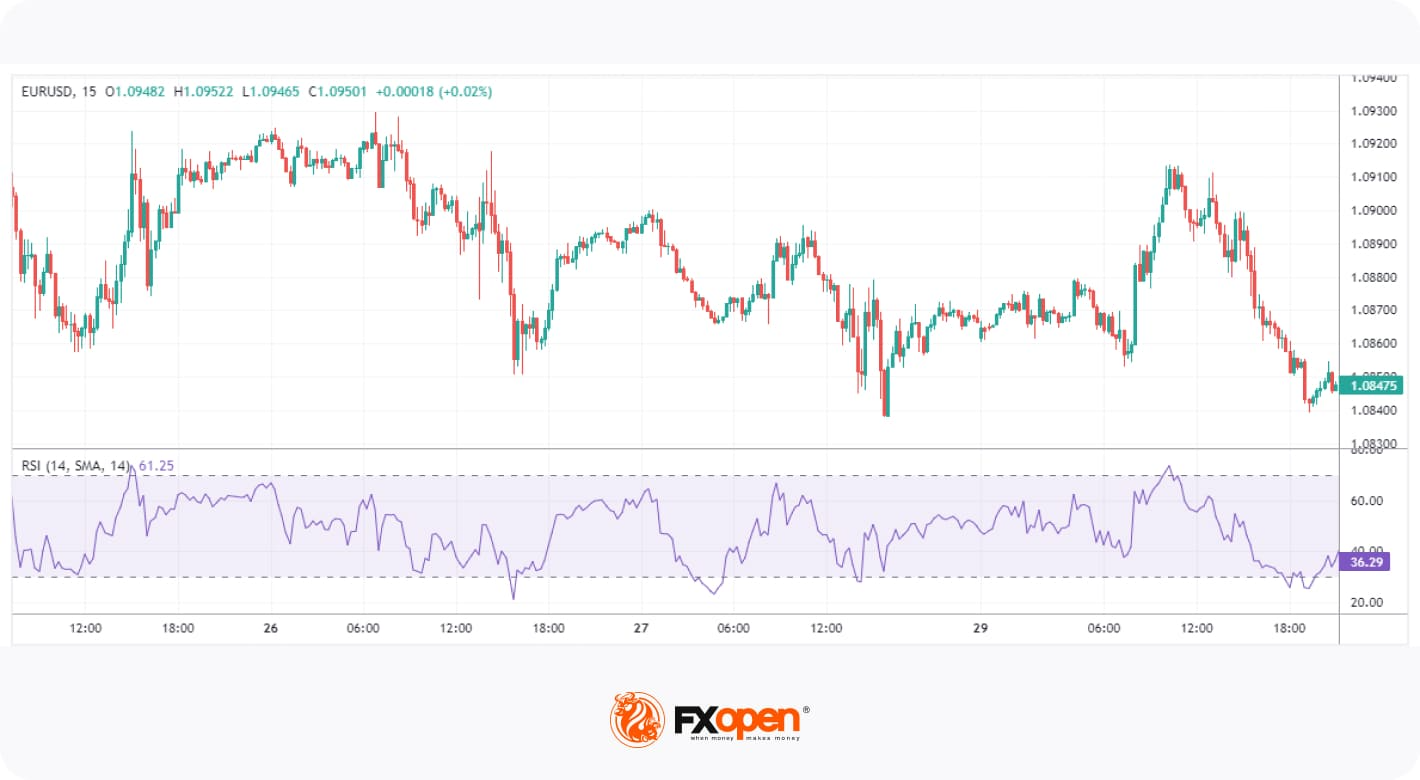
The RSI is one of the most popular and well-documented momentum indicators. It measures the speed and change of price movements by comparing the average gain to the average loss over a specified period, usually 14.
RSI is an oscillator, moving between 0 and 100. Values above 70 reflect overbought conditions, while values below 30 indicate oversold conditions. When the RSI moves out of overbought or oversold territory, many traders interpret this as a reversal confirmation. Sustained movements above or below the midpoint (50) can also be used to confirm a bullish or bearish trend, respectively. Moreover, traders look for divergence between the RSI and price to identify weakening trends and possible reversals.
2. Average Directional Index (ADX)
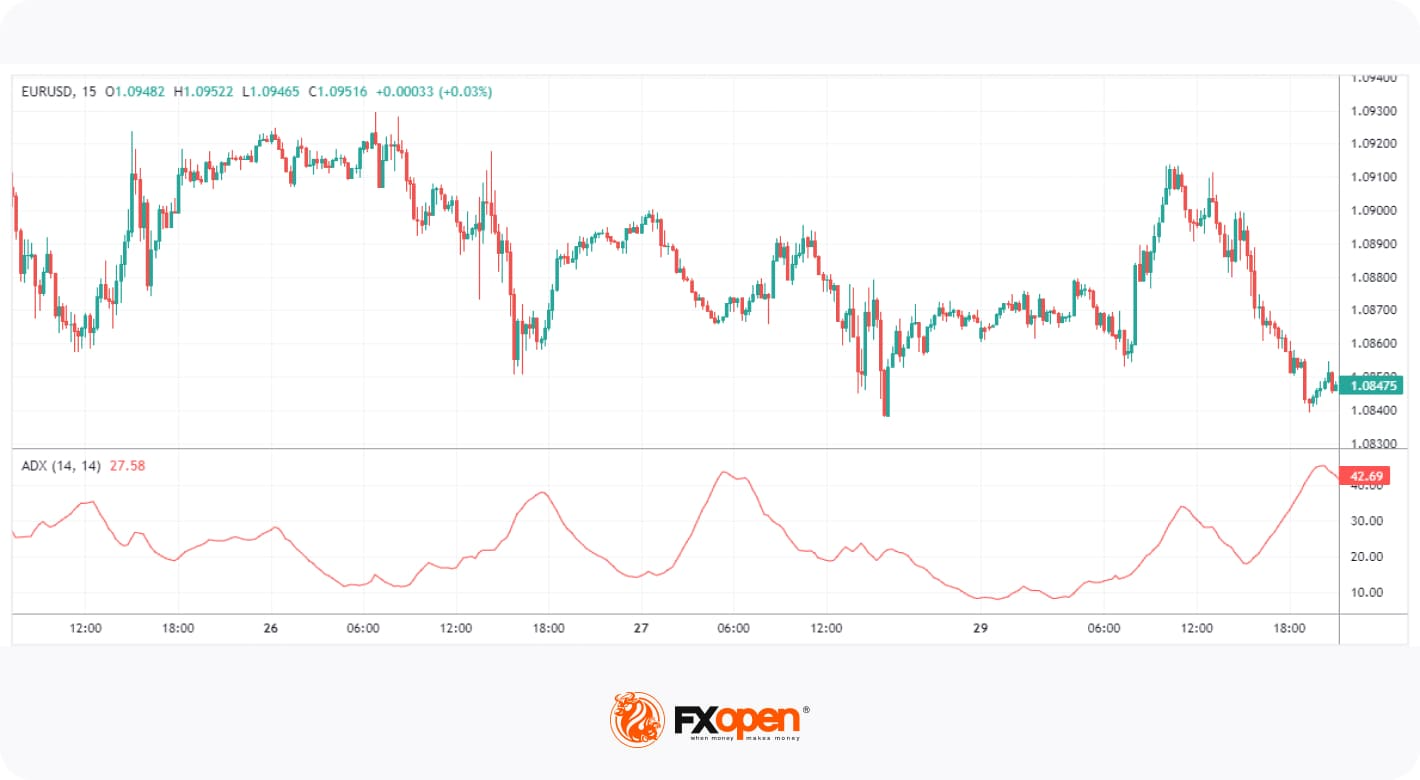
The ADX is a momentum indicator used to determine a trend’s strength. Unlike most other tools, its reading doesn’t move according to the direction of price action, i.e. it doesn’t move up if bullish or down when bearish. Instead, it ranges from 0 to 100, with values above 25 indicating a strong trend and below 25 suggesting a weak or non-trending market.
ADX is commonly used in combination with other tools, as it simply confirms the trendiness of a market. For example, traders might use a leading indicator like RSI to anticipate bullishness and confirm the trend when ADX crosses over 25.
3. Commodity Channel Index (CCI)
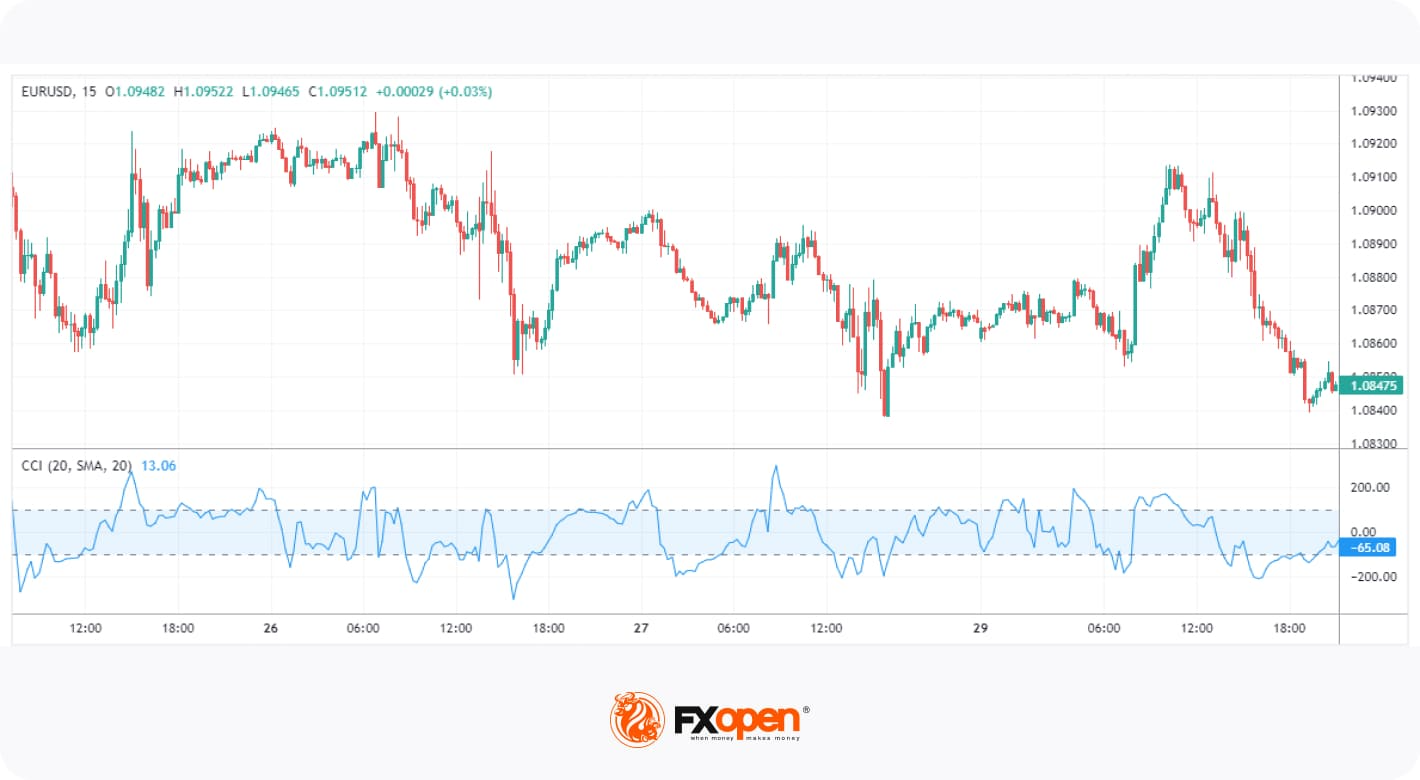
The CCI is a versatile momentum indicator. It uses a constant in its calculation to ensure that 75% of values fall between +/- 100, with moves outside of the range generally indicating a trend breakout or continuation. It can also show extreme overbought or oversold conditions when its value exceeds +/- 200.
The CCI requires a more nuanced approach than other tools and is typically used to confirm a trader’s directional bias. For instance, a visually identifiable bullish trend can be confirmed by looking at the CCI. If its value is skewed toward 100+, traders can be confident in their observation. When the market cools off, CCI will fall below 100. Traders can then confirm a pullback entry with a move back into the +/- 100 range.
4. Moving Average Convergence Divergence (MACD)
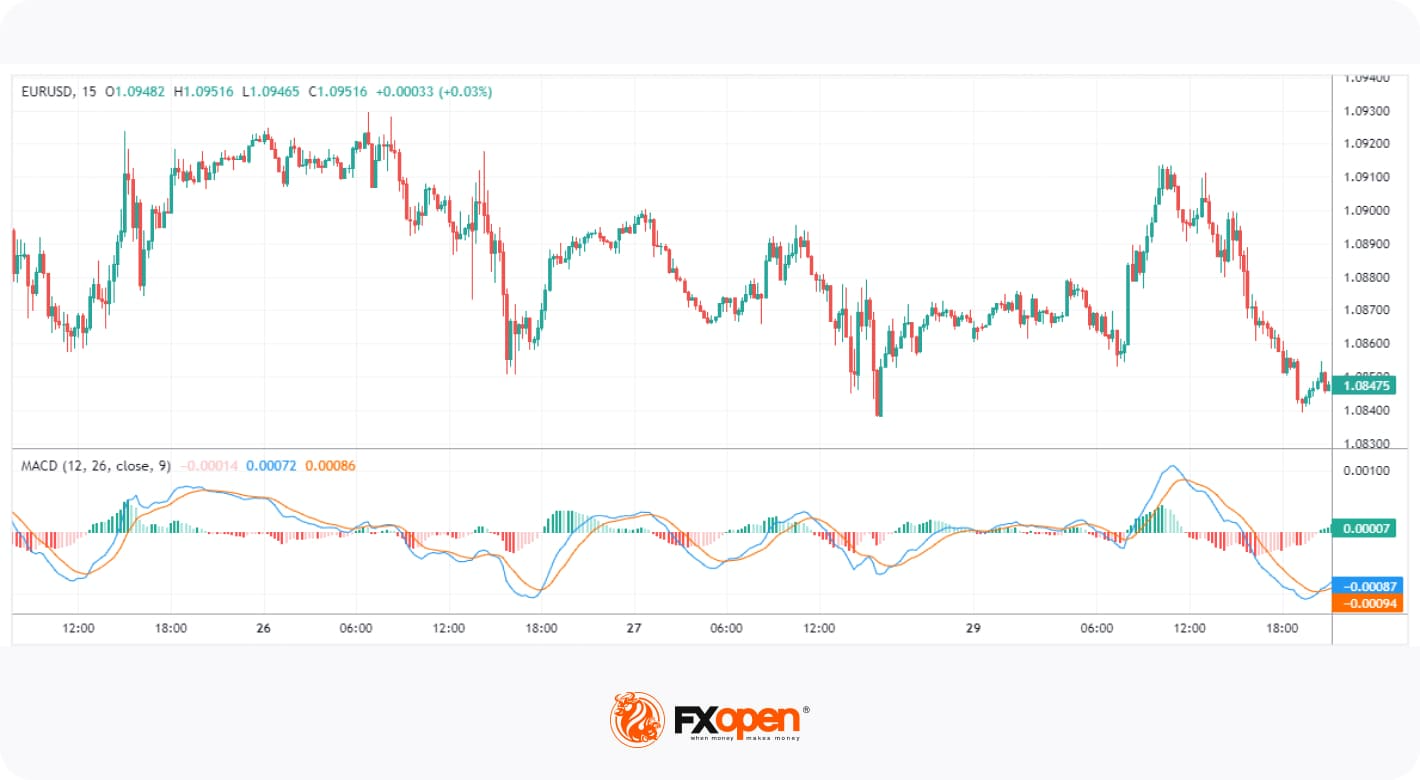
The MACD is a highly regarded trend-following momentum indicator that shows the relationship between two moving averages of an asset’s price. It’s used in technical analysis to identify the relationship between two moving averages of a security’s price. The MACD reflects the trend’s strength, direction, and duration, as well as possible reversal points.
Traders use crossovers between the MACD and signal lines as potential entry and exit signals. Additionally, when the MACD histogram crosses above or below the zero line, it can indicate bullish or bearish momentum in the market. Lastly, it’s also possible to spot divergences between price and the indicator’s peaks and troughs, similar to how divergences are identified with RSI.
5. Momentum (Mom)
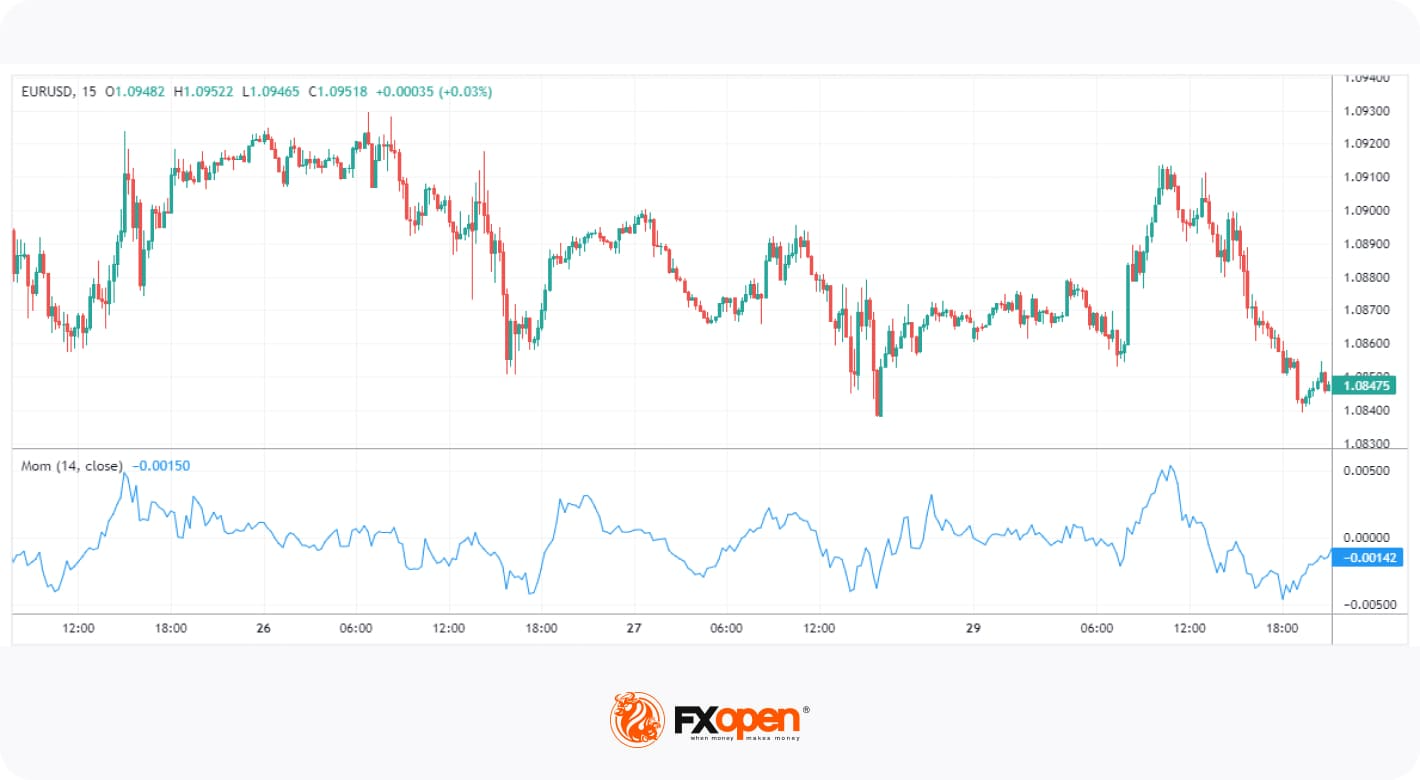
The Momentum indicator is considered a simple tool that measures the rate of change in an asset’s price over a specific period. The value of the Momentum depends on the market it’s applied to. For example, using the Momentum indicator in stocks will result in a fluctuating value typically between +/- 20, depending on the stock’s price. For forex pairs, its range may look more like +/- 0.02.
The common feature across all markets, however, is the zero line. Generally speaking, positive Momentum values indicate upward price movement, while negative values suggest downward movement. It can also show overbought and oversold conditions, but its lack of defined boundaries means this can be tricky. However, Momentum is especially useful for identifying divergences.
Advantages of Momentum Indicators
Momentum indicators are valuable tools in technical analysis, reflecting the strength and speed of price movements. They offer several advantages that may improve trading strategies:
- Identify Trends Early: Market momentum indicators can reveal potential shifts in trend direction, providing traders with additional context for evaluating entry and exit points.
- Objective Analysis: They provide quantifiable data, reducing reliance on subjective analysis and emotional decision-making.
- Spot Overbought and Oversold Conditions: Momentum tools show when an asset is overbought or oversold, signalling potential reversals and exit points.
- Confirm Trade Signals: Combining momentum indicators with other technical tools may improve trade signals, providing stronger confirmation for trading decisions.
- Adaptable Across Markets: They can be applied to various assets, including stocks, forex, and commodities, making them versatile tools for traders.
Things to Consider When Trading Momentum Indicators
While momentum indicators may be a helpful addition to any trader’s arsenal, there are a few things to be aware of:
- Trade with the Trend: Trends often last longer than you may think, and constantly looking for trend reversals will only end in frustration. Look for bullish signals during an uptrend and bearish signals in a downtrend.
- Use Multiple Indicators: Relying on a single tool can lead to false signals. Many traders combine a lagging indicator, like MACD, with a leading indicator, like RSI. Combining two or three tools may help confirm signals and improve trade accuracy.
- Beware of False Signals: Momentum indicators can sometimes generate false signals, especially in sideways or choppy markets. Being patient and waiting for confirmation before entering a trade is vital.
- Don’t Rely Too Heavily on Indicators: While momentum indicators may be helpful, relying solely on them without considering price action, market structure, or fundamental aspects can lead to poor trading decisions. Use these indicators alongside other tools for a momentum indicator strategy.
Final Thoughts
Momentum indicators play a critical role in technical analysis, offering traders valuable insights into the strength and direction of market movements. Tools such as RSI, MACD, CCI, ADX, and the Momentum Indicator are widely used to confirm trends, highlight overbought or oversold conditions, and improve entry and exit timing. While no single indicator should be used in isolation, combining these tools with solid risk management and broader market analysis can support traders in their trading decision-making.
If you want to test your strategy with the above-mentioned indicators, you may consider opening an FXOpen account, where you can trade over 700 markets with low costs. Good luck!
FAQ
How May Momentum Indicators Be Used?
Momentum indicators may be used to assess the speed and strength of price movements in a financial market. They can help traders identify potential overbought or oversold conditions, confirm trends, or signal possible reversals. By comparing the current price to previous price levels, momentum indicators provide insights into whether a market move is gaining or losing strength.
What Period is Set for a Momentum Indicator?
If we are talking about the Momentum indicator, the period depends on your trading style. For short-term traders, 7 and 10 periods are common, while long-term traders may prefer 14 and 21 periods. Testing various periods based on asset volatility can improve results.
What Is the Most Popular Momentum Indicator for Scalping?
There is no single most popular momentum indicator for scalping but the Relative Strength Index (RSI) is often favoured by scalpers due to its ability to quickly identify overbought or oversold conditions. Its responsiveness is used by scalpers to make rapid decisions in fast-moving markets.
What Is the Difference Between Momentum and Trend Indicators?
Momentum trading indicators measure the speed of price changes, while trend indicators assess the direction and persistence of price movements. To put it simply, momentum focuses on strength, while trend indicators focus on the overall direction.
Is MACD a Momentum Indicator?
Yes, the Moving Average Convergence Divergence (MACD) is one of the most popular momentum indicators, especially in forex and stock trading. It may reveal changes in momentum and help identify potential trend reversals.
This article represents the opinion of the Companies operating under the FXOpen brand only. It is not to be construed as an offer, solicitation, or recommendation with respect to products and services provided by the Companies operating under the FXOpen brand, nor is it to be considered financial advice.


The company’s total stash is worth $11.5 billion, it said in a recent statement.
The Tom Lee-chaired former Bitcoin mining giant has announced the acquisition of almost 61,000 ETH in the past week, which has pushed its total stash to nearly 4.6 million tokens.
In addition, BitMine said it increased its investment in existing ‘moonshot’ exposures such as Eightco by an additional $80 million to support the latter’s $50 million purchase of OpenAI equity, making it the only publicly listed entity to give investors direct exposure to the company behind ChatGPT.
“Since the start of the Iran war, crypto prices have outperformed and Ethereum has outperformed the S&P 500 by 2,450bp. This is a meaningful outperformance in a mere two weeks,” said Thomas “Tom” Lee, Chairman of Bitmine.
Lee added that higher oil prices will trigger concerns of slowing growth for the global economy, which would push investors to buy growth stocks such as MAG7, software, and crypto.
In its latest Ethereum acquisition of 60,999 tokens, Lee explained that the firm he chairs has ramped up the pace of such purchases as they believe the asset is in the final stages of the mini-crypto winter.
He asserted that BitMine has “staked more ETH than other entities in the world. At scale, the ETH staking rewards are $272 million annually.”
The company’s total stash, which includes its ETH fortune, 196 BTC, a $200 million stake in Beast Industries, a $83 million stake in Eightco, and $1.2 billion in cash, has risen to $11.5 billion. Its Ethereum holdings represent 3.81% of the entire asset supply.
While being the first in the Ethereum treasury world, BitMine is the second overall in crypto, trailing only to Michael Saylor’s Strategy, which announced its latest gigantic BTC purchase earlier today.
You may also like:
Binance Free $600 (CryptoPotato Exclusive): Use this link to register a new account and receive $600 exclusive welcome offer on Binance (full details).
LIMITED OFFER for CryptoPotato readers at Bybit: Use this link to register and open a $500 FREE position on any coin!


A whitehat hacker has gone public over a months-long feud with the team behind Injective over its response to a critical bug disclosure.
According to the report, the vulnerability in question put $500 million at risk via a faulty validation system.
The pseudonymous crypto security researcher, who goes by the moniker al_f4lc0n, has accused Injective of ghosting them for three months, despite fixing the bug, and later lowballing the bounty payout.
Read more: Ethereum address poisoning spike, ‘wallets aren’t ready’ says researcher
The bug
The bounty hunter uploaded a full bug report to a GitHub repository called “injective-wall-of-shame.”
In the repo’s readme, entitled “I Saved Injective’s $500M. They Pay Me $50K,” they explain that the vulnerability allowed “any user to directly drain any account on the chain. No special permissions needed.”
The more detailed technical report describes how a faulty subaccount validation system allowed for an attacker to submit market orders on other users’ behalf.
The bug was exploitable by an attacker creating a worthless token and creating a spot market, pairing it with USDT. Both these actions are permissionless on Injective.
Then, by creating a sell order of the fake token, the attacker could force victim accounts to buy the worthless token for USDT, “at the attacker’s chosen price.” The USDT could then be permissionlessly bridged off Injective, to Ethereum.
The report claims this put all value on the blockchain at risk, and that the total was over $500 million at the time of disclosure.
The figure currently sits at $280 million, the vast majority of which is in the INJ token.
Embed: Oracle error adds to turmoil at DeFi giant Aave
The bounty
Injective is a blockchain network which lists the likes of Binance, Jump, Google and Pantera as partners, claiming “institutional and government players are joining us.”
Bug bounties are a common way for organizations to crowdsource continuous security monitoring from specialist whitehat bounty “hunters.”
Injective’s ImmuneFi page lists a maximum bounty of $500,000 for critical threats related to its blockchain and smart contracts.
The researcher claims, “a mainnet upgrade to fix the bug went to governance vote. The Injective team clearly understood the severity.”
They also allege that injective “ghosted” for three months after the fix, before offering a bounty 10x lower than the maximum. “To be clear: the $50K has not been paid either,” they stress.
Protos has reached out to Injective for comment on al_f4lc0n’s claims, but hadn’t received a response before publication. This article will be updated should we receive one.
Got a tip? Send us an email securely via Protos Leaks. For more informed news, follow us on X, Bluesky, and Google News, or subscribe to our YouTube channel.


South Korea has fined crypto exchange Bithumb 36.8 billion won (about $24.5 million) and imposed a six-month partial business suspension after finding widespread violations of Anti-Money Laundering (AML) rules, according to a Yonhap News Agency report.
According to Yonhap, regulators identified about 6.65 million violations during an AML inspection, including failures related to customer identity verification, transaction restrictions and record-keeping requirements. Authorities found Bithumb facilitated 45,772 crypto transfers involving 18 unregistered overseas virtual asset service providers (VASPs), in violation of South Korea’s AML rules.
The Financial Intelligence Unit (FIU) under the Financial Services Commission (FSC) reportedly decided on the penalties following a sanctions deliberation committee meeting reviewing the exchange’s compliance with the Act on Reporting and Use of Specific Financial Transaction Information.
The sanction includes the largest fine yet imposed on a South Korean crypto exchange, following an ongoing regulatory crackdown on AML compliance.
South Korea imposes a six-month partial ban on Bithumb
Under the measures, Bithumb will be banned from processing external crypto transfers for new customers for six months, from March 27 to Sept. 26.
However, existing users will face no trading restrictions, while new customers can still buy or sell crypto and deposit or withdraw Korean won from the exchange.
Related: South Korea plans to use AI for crypto tax enforcement
The FIU said it had repeatedly warned Bithumb to halt transactions with unregistered overseas crypto firms. However, the regulator said the exchange failed to comply and was unable to implement effective blocking measures.
On March 9, the FIU gave Bithumb a preliminary notice of a six-month partial suspension, citing its concerns over Bithumb’s violations before determining the final sanctions.
South Korea’s broader AML enforcement drive
Apart from Bithumb, the FIU has also previously penalized other South Korean exchanges for AML violations.
In February 2025, the regulator imposed a three-month restriction on crypto deposits and withdrawals for new Upbit customers after finding violations tied to dealing with unregistered VASPs. Upbit also received a 35.2 billion won (about $23.5 million) penalty.
The crackdown later reached crypto exchange Korbit. In December 2025, the FIU imposed a 2.73 billion won (about $1.8 million) fine and an institutional warning on the exchange over AML and customer-verification breaches.
Magazine: China’s ‘50x’ blockchain boost, Alibaba-linked AI mines Bitcoin: Asia Express
Crypto World
International police launch Operation Atlantic to combat crypto approval phishing scams


Law enforcement agencies from the U.S., U.K. and Canada started a joint initiative called Operation Atlantic aimed at disrupting cryptocurrency fraud schemes known as approval-phishing attacks, the Ontario Securities Commission (OSC) said Monday.
The scams work by prompting victims to approve malicious wallet permissions through fake alerts or pop-ups that appear to come from trusted apps or services, the OSC said. Once access is granted, criminals gain control of the wallet and can transfer funds. Because blockchain transactions cannot be reversed, recovery becomes difficult once assets leave a victim’s account.
Cryptocurrency scams generated at least $14 billion in onchain revenue in 2025, according to Chainalysis, with totals expected to climb toward $17 billion as more illicit wallets are identified. Much of the activity now relies on social engineering tactics, complex AI-generated content and phishing-as-a-service platforms to trick victims into granting wallet access or transferring funds.
“Approval phishing and investment scams cost victims millions in financial loss each year,” said Brent Daniels, deputy assistant director for the U.S. Secret Service’s Office of Field Operations, which is involved in the project.
The operation builds on Project Atlas, a 2024 initiative led by the Ontario Provincial Police’s Cyber-Enabled Fraud Team to combat global crypto investment fraud. The project identified over 2,000 compromised wallets across 14 countries, disrupted roughly $70 million in potential fraud, and froze about $24 million in stolen crypto. Similar international efforts, such as Chainalysis’ Operation Spincaster, generated more than 7,000 investigative leads tied to roughly $162 million in losses, highlighting the scale of approval phishing schemes targeting crypto investors.
Authorities said the new operation will help warn potential victims and guide them on securing compromised wallets while attempting to trace and recover stolen funds.
“During Operation Atlantic, the Secret Service, alongside our international law enforcement partners, will identify and disrupt these scams in near real-time denying criminals the ability to further profit from their crimes,” Daniels said.

Metaplanet said Monday it raised $255 million in a private placement and launched a new warrant structure to fund additional Bitcoin purchases.
Metaplanet raised about $255 million from institutional investors through a private placement of new shares, according to the company.
The private placement priced new shares at a 2% premium, paired with fixed-strike warrants at a 10% premium, which, if exercised, could add $276 million in additional capital as “firepower” toward the company’s goal of amassing 210,000 Bitcoin (BTC), according to CEO Simon Gerovich.
Metaplanet also issued a separate strike warrant offering on Monday, which may bring an additional $234 million of capital to fuel the accumulation strategy of the fourth-largest Bitcoin treasury company.

Metaplanet seeks $234 million via first-of-its-kind strike warrants
Metaplanet issued another 100 million in Moving Strike Warrants with what Gerovich called a first-of-its-kind Market Net Asset Value (mNAV) clause, which makes these exercisable only if the stock trades above 1.01x mNAV.
The offering enables the Bitcoin treasury company to raise another $234 million of capital for BTC purchases. The mNAV-tied clause aims to ensure that every newly issued share increases shareholder value, announced Gerovich earlier on Monday.
Related: Bitcoin treasuries stall in Q4, but largest holders keep stacking sats
Metaplanet’s mNAV stood at 1.11x on Monday, above the key 1.01x threshold, as the company held 35,102 BTC ($2.5 billion) and its stock price was $2.45, according to Metaplanet’s dashboard.
The mNAV ratio compares a company’s enterprise value to the value of its crypto holdings. An mNAV below 1 makes it more challenging for companies to raise funds by issuing new shares, which may limit their cryptocurrency purchases.

The new capital-raising mechanism is similar to the playbook used by Michael Saylor’s Strategy, the world’s largest corporate Bitcoin holder.
Strategy’s At-The-Market (ATM) common stock offering programs share similar mechanisms, allowing the company to raise capital by gradually issuing new common stock shares. Strategy only issues these shares when the mNAV is above 1x to avoid dilution.
In October 2024, Strategy disclosed plans to issue and sell shares of its class A common stock to raise up to $21 billion in equity and $21 billion in fixed-income securities over the next three years.
Magazine: Mysterious Mr Nakamoto author — Finding Satoshi would hurt Bitcoin


Strategy (MSTR), the world’s largest publicly traded holder of bitcoin, continued with its large string of weekly purchases, adding $1.57 billion worth of BTC, according to a Monday filing.
Led by executive chairman Michael Saylor, the company added 22,337 bitcoin at an average price of $70,194 per coin, bringing holdings to 761,068 coins, acquired for $657.61 billion, or an average of $75,696 per coin.
In terms of bitcoin acquired, it was the fifth-largest ever weekly purchase of coins by the company.
Bitcoin was trading at $73,600 on Monday morning, higher by 2.6% over the past 24 hours.
The latest addition to the company’s bitcoin stash was mostly funded via $1.1 billion in sales of the firm’s STRC series of preferred stock. The company also sold $396 million of common stock.
MSTR shares are up 4% in pre-market trading as bitcoin rose through the weekend, currently trading at $73,600, up 2.6% over the past 24 hours.

TLDR
- Through a premium-priced share placement, Metaplanet secured 40.8 billion yen (approximately $255 million) from international institutional backers.
- Additional warrants featuring a 10% premium strike price could generate another 44.5 billion yen, potentially raising total funding to approximately $531 million.
- A novel mNAV-linked warrant mechanism was unveiled, ensuring share issuance only occurs when Bitcoin holdings per share increase.
- Previously issued warrants representing up to 210 million shares were suspended to minimize shareholder dilution.
- The firm aims to accumulate 100,000 BTC by late 2026 and 210,000 BTC by late 2027, with current holdings at 35,102 BTC.
Tokyo-based Metaplanet (3350) has successfully secured approximately $255 million from international institutional investors via a strategic share placement as part of its aggressive Bitcoin treasury expansion strategy.
The shares were issued at a 2% premium above prevailing market rates. Accompanying the placement are fixed-strike warrants with a 10% premium, potentially generating an additional 44.5 billion yen upon exercise.
Combined, the capital raising initiative could yield approximately $531 million in total funding, as disclosed by CEO Simon Gerovich.
With 35,102 BTC currently in its treasury—worth approximately $2.6 billion at today’s valuations—Metaplanet ranks as the fourth-largest corporate Bitcoin holder globally, trailing Strategy and MARA Holdings, which collectively control 792,553 Bitcoin.
Shares of Metaplanet advanced 5% on Monday, coinciding with Bitcoin’s recovery above the $73,000 threshold.
Innovative Warrant Mechanism Linked to Modified Net Asset Value
As part of this funding round, Metaplanet unveiled a groundbreaking series of moving strike warrants incorporating an mNAV clause—a pioneering feature for stock acquisition instruments of this nature.
This innovative structure permits warrant exercise only when the company’s share price reaches or exceeds 1.01 times its modified net asset value. This measurement compares Metaplanet’s total market capitalization against the valuation of its Bitcoin treasury.
According to company statements, this mechanism guarantees that any new share creation will enhance Bitcoin holdings per share, protecting existing shareholders from value dilution.
In conjunction with this new framework, Metaplanet halted exercise privileges on earlier-issued warrants representing up to 210 million shares. This strategic decision aims to prevent dilution while maintaining focus on Bitcoin accumulation objectives.
Ambitious 210,000 BTC Acquisition Strategy Drives Growth Initiatives
The capital secured will be allocated primarily toward building Metaplanet’s bitcoin treasury.
Management has established an interim objective of accumulating 100,000 BTC by the conclusion of 2026, progressing toward an ultimate target of 210,000 BTC by the end of 2027.
To facilitate this ambitious roadmap, Metaplanet plans to launch a United States-based subsidiary named Metaplanet Asset Management. This entity will concentrate on venture capital investments and digital asset financial services related to Bitcoin capital markets.
Separately, Strategy—the world’s largest corporate Bitcoin holder—is anticipated to reveal additional Bitcoin acquisitions, following recent statements from Executive Chairman Michael Saylor and last week’s preferred equity offering.
Metaplanet’s current Bitcoin holdings stand at 35,102 BTC with an estimated value of $2.6 billion.

Welcome back to Inside DeFi
Today’s edition looks at a gung-ho swap which lost the user almost $50 million. It seems multiple warnings can’t save the kind of madman who’s prepared to swap such size from a mobile-based hot wallet.
We also take a look into the move away from DAOs, and finish up with some short snippets from the security space.
Technical difficulties in the Aave sphere
On Thursday, one spectacularly unlucky (or gung-ho) user took a 99.93% loss on a low liquidity $50 million trade.
They swapped $50 million of (Aave-wrapped) USDT to just $35,000 of (Aave-wrapped) AAVE. The trade was made via Aave’s controversial CoW Swap integration which kicked off a months-long governance battle in December.

Read more: Aave Labs faces backlash over CoW Swap integration
That said, swapping such a large sum in a single transaction, apparently from a phone, and after having accepted price impact warnings, doesn’t exactly scream “bulletproof opsec practices.”
While both CoW Swap and Aave have pledged to return the fees, it’s a very small dent in an enormous loss.
Aave founder Stani Kulechov detailed the UI warnings the user ignored, but recognized the result was “far from optimal.”
He also admits the industry needs “additional guardrails… to better protect users.”
Justifying why such swaps aren’t blocked, CoW Swap said, “Preventing users from making trades… can lead to terrible outcomes in some situations (e.g. a market crash).”
Former governance delegate Marc Zeller was quick to rub some salt in the wound. He also pointed out that the loss wouldn’t be possible on the previous swap tool, which Aave Labs replaced.

Read more: Across Protocol accused of looting DAO treasury of $23M
It’s clear who the loser is in this debacle – the one who lost $49,965,000. But the big winners were the MEV bot backrunning the trade and Titan Builder, which apparently made a total of $34 million in tips, sent straight to Coinbase.
The loss wasn’t the only technical glitch in the Aave-sphere this week. Almost $27 million was liquidated the day before due to a faulty update of Chaos Labs’ Correlated Asset Price Oracle.
Are DAOs done?
Now that Aave Labs has flexed its voting power over the DAO, others are taking note.
Across Protocol has proposed ditching the DAO, in favor of a “US C‑corp, via a token-to-equity exchange and token buyout.”
The thinking is that a change in governance will lead to “clearer accountability, faster execution, and a structure that can scale ops, partnerships, and product development over time.”
Co-founder Hart Lambur said “tokens are undervalued and underappreciated… the reality for Across is that having a token generally hurts more than it helps.”
The post goes on to state that the firm’s future focus will be stablecoins and “agentic payments.”
While others are rushing to tokenize equity, Across seems keen on doing quite the opposite.
Sky, formerly Maker DAO, is another (not so explicit) example of centralizing governance, albeit over a longer timeframe.
While some lament the perceived capture of one of DeFi’s longest-established DAOs, it seems to be working for the protocol, economically speaking.
Revenue within each DeFi vertical is concentrated into just one or two winners, as DeFiLlama’s 0xngmi points out. Many of those getting left behind are dropping like flies, or being forced to make tough decisions.

Read more: Across Protocol accused of looting DAO treasury of $23M
The chart comes from an article by Joel John of Decentralisedco, and questions the purpose of tokens. It notes that, while DeFi revenues have grown enormously, “most protocols lack a mechanism to return value to token holders.”
To be useful to holders, tokens must provide “claims to economic activity and the ability to guide governance.”
In cases where one or both of these aren’t in the interests of those holding sway over governance power, we may see more projects tearing off the DAO mask in the weeks and months to come.
Security snippets
A bite sized breakdown of some of the week’s security news.
The ongoing wave of front-end attacks continued to hit popular DeFi projects’ websites this week. Lending protocol Compound Finance and Solana memecoin launchpad BONK.fun were both affected.
No losses were found in relation to the former, while Bubblemaps found $20,000 was lost to the latter.
A SlowMist security researcher, who goes by “23pds,” shared a deep dive into a (possibly North Korean) campaign targeting a range of crypto companies’ supply chains, “from staking platforms, to exchange software providers, to the exchanges themselves.”
The hackers were successful in “exfiltrating proprietary exchange software containing hardcoded secrets.”
Security firm Cantina’s CEO, Hari Mulackal, examined the pressures facing the crowdsourced security model. He says security researchers, customers, and platforms all “hate it.”
In addition to problems with subjective bug severity and costs, Mulackal cites AI, which is “starting to be genuinely useful at finding bugs,” as a growing threat.
To combat endless submissions of slop bounty reports, a staking/penalty system or charge to submit bugs may provide reviewers some respite.
The post came in response to a security researcher’s claim that they “Lost $120K + 1st Place to an AI.”
Read more: DeFi, meet Claude: Moonwell’s ‘vibe-coded’ oracle in $1.8M blowup
Cosmos Labs published an investigation into the root cause of January’s $7 million hack of SagaEVM. The vulnerability was found to affect a number of chains built on the Cosmos EVM stack, specifically those which had used the “ICS20 precompile.”
The report explains that, “under certain execution conditions,” the vulnerability “could allow repeated use of the same token balance within a single transaction.” Affected networks were advised to disable the vulnerable precompile before a permanent fix was deployed.
A price cap oracle mishap saw $27 million in wstETH liquidated on Aave on Tuesday. While the incident isn’t exactly a blackhat exploit, more a failure of Chaos Labs’ code, oracle attacks have seen a recent uptick.
To finish off, in the latest installment of AI behaving badly, one of Alibaba’s research AIs allegedly cryptojacked itself.
The agent broke out of the “bounds of the intended sandbox,” triggering security alerts.
It had hijacked GPU capacity assigned for its own training, repurposing the compute to mine cryptocurrency.
— Jake Harrison

‘Turning a moment of loss into something hopeful’

Meta planning major layoffs as AI spending and automation reshape workforce
Salesforce (CRM) Stock Climbs on Historic $25B Share Repurchase Launch


-
 Tech5 days ago
A 1,300-Pound NASA Spacecraft To Re-Enter Earth’s Atmosphere
-
 Crypto World2 days ago
HYPE Token Enters Net Deflation as HyperCore Buybacks Outpace Staking Rewards
-

 Business6 days ago
ExxonMobil seeks to move corporate registration from New Jersey to Texas
-

 Crypto World7 days ago
Paradigm, a16z, Winklevoss Capital, Balaji Srinivasan among investors in ZODL
-

 Fashion3 days ago
Weekend Open Thread: Addict Lip Glow
-

 Tech6 days ago
ChatGPT will now generate interactive visuals to help you with math and science concepts
-
Sports2 days ago
Why Duke and Michigan Are Dead Even Entering Selection Sunday
-

 NewsBeat5 days ago
Residents reaction as Shildon murder probe enters second day
-
 NewsBeat7 days ago
Pagazzi Lighting enters administration as 70 jobs lost and 11 stores close across Scotland
-

 Business5 days ago
Search Enters Sixth Week With New Leads in Tucson Abduction Case
-

 Business18 hours ago
Search for Savannah Guthrie’s Mother Enters Seventh Week with No Arrests
-

 Tech7 days ago
Despite challenges, Ireland sixth in EU for board gender diversity
-

 Business2 days ago
US Airports Launch Donation Drives for Unpaid TSA Workers as Partial Government Shutdown Enters Fifth Week
-
Crypto World2 days ago
Coinbase and Bybit in Investment Talks: Could Bybit Finally Enter the US Crypto Market?
-

 NewsBeat5 days ago
I Entered The Manosphere. Nothing Could Prepare Me For What I Found.
-

 Business7 days ago
Search Enters 39th Day with FBI Tip Line Developments and No Major Breakthroughs
-

 Business2 days ago
Country star Brantley Gilbert enters growing non-alcoholic beer market
-

 Crypto World6 days ago
Will Chainlink price reclaim $10 amid volatility squeeze?
-

 Business3 hours ago
Australian shares drop as Iran war enters third week
-

 Sports5 days ago
PWHL, Senators discussing plan to keep Charge in Ottawa

