
Crypto World
PEPE Explodes by 18% Amid Altcoin Rally, BTC Tapped $74K: Market Watch

The frog-themed meme coin is today’s biggest gainer, followed by TAO, DOT, and BONK.
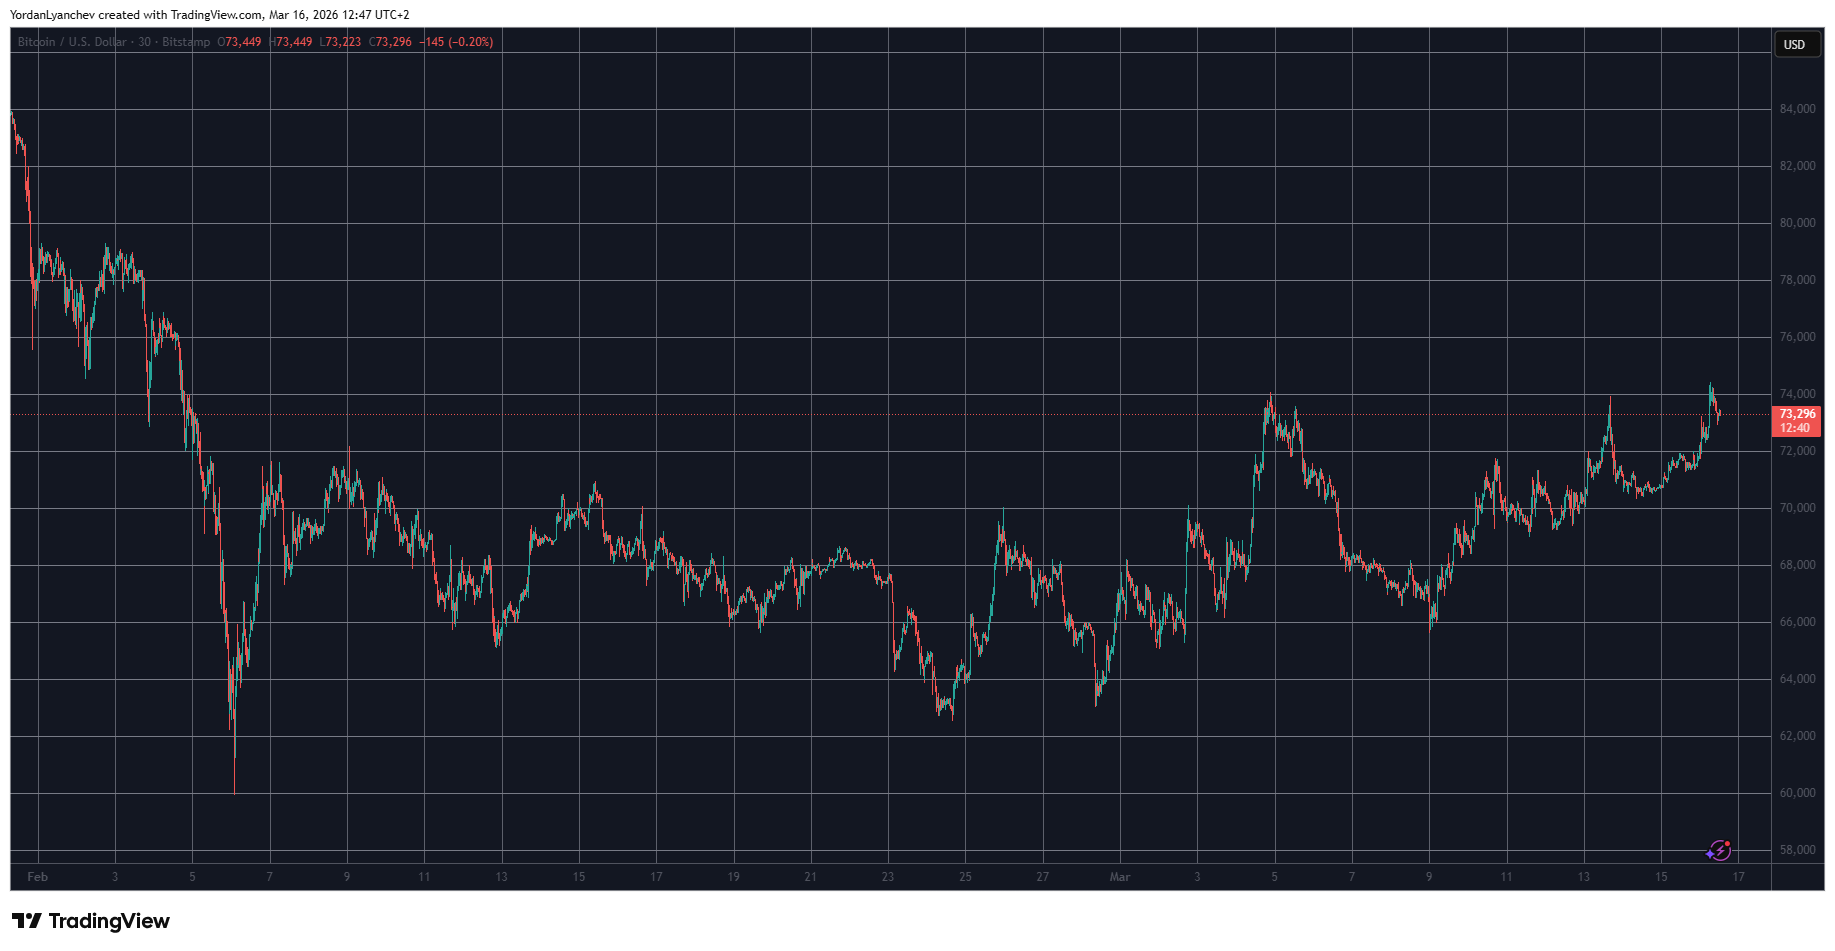
After a relatively quiet weekend despite the latest developments in the Middle East, bitcoin’s price surged on Monday morning to a six-week peak of just over $74,000, where it was stopped.
Many altcoins have produced even more impressive gains, including ETH, which reclaimed the $2,200 level, and ADA, which jumped by 10% at one point.
BTC Saw New Local Peak
The previous business week began quite contrastingly to this one, as BTC’s reaction to the weekend developments on the war front pushed it south to $65,600. However, the bulls intercepted the move and helped the asset recover several grand by Wednesday when it jumped to $68,000 after the CPI numbers came out for February.
After a minor rejection at that point, bitcoin went on the attack once again on Friday. It skyrocketed to $74,000 for the second time in the past 10 days, only to be rejected once again. It dipped further to just over $70,000 during the weekend after the latest set of bombings in the Middle East, but managed to maintain that level.
More volatility was expected on Monday morning when most legacy financial markets opened, including oil. Indeed, fluctuations arrived, but they sent BTC higher to a multi-week peak of just over $74,000. Although it failed there and now sits a grand lower, BTC is still up by 8% weekly.
Its market cap has increased to $1.465 trillion on CG, while its dominance over the alts continues to sit below 57%.
PEPE Soars
Ethereum, Solana, and Cardano are the biggest beneficiaries of today’s market-wide rally. All three have added around 6-8% of value, pushing ETH to well over $2,250, SOL to above $90, and ADA close to $0.40. HYPE, LINK, DOGE, XMR, AVAX, LTC, and XRP are also in the green, albeit in a more modest manner.
There are some double-digit gainers as well. PEPE leads the pack with a notable 18% surge, followed by DOT and TAO. BONK, SHIB, and ZEC are next in line.
The total crypto market cap added almost $100 billion daily and is close to $2.6 trillion on CG as of now.

Binance Free $600 (CryptoPotato Exclusive): Use this link to register a new account and receive $600 exclusive welcome offer on Binance (full details).
LIMITED OFFER for CryptoPotato readers at Bybit: Use this link to register and open a $500 FREE position on any coin!
Disclaimer: Information found on CryptoPotato is those of writers quoted. It does not represent the opinions of CryptoPotato on whether to buy, sell, or hold any investments. You are advised to conduct your own research before making any investment decisions. Use provided information at your own risk. See Disclaimer for more information.

Ether (ETH) bulls are eyeing a move back toward $2,800 in March, with at least three indicators showing ETH price potential to rise higher.
Key takeaways:
-
Ether’s price jumped by over 9% toward $2,280 on Monday.
-
Multiple indicators, including a symmetrical triangle, hint at an extended price rally toward $2,800.
Ether invalidates a bearish chart pattern
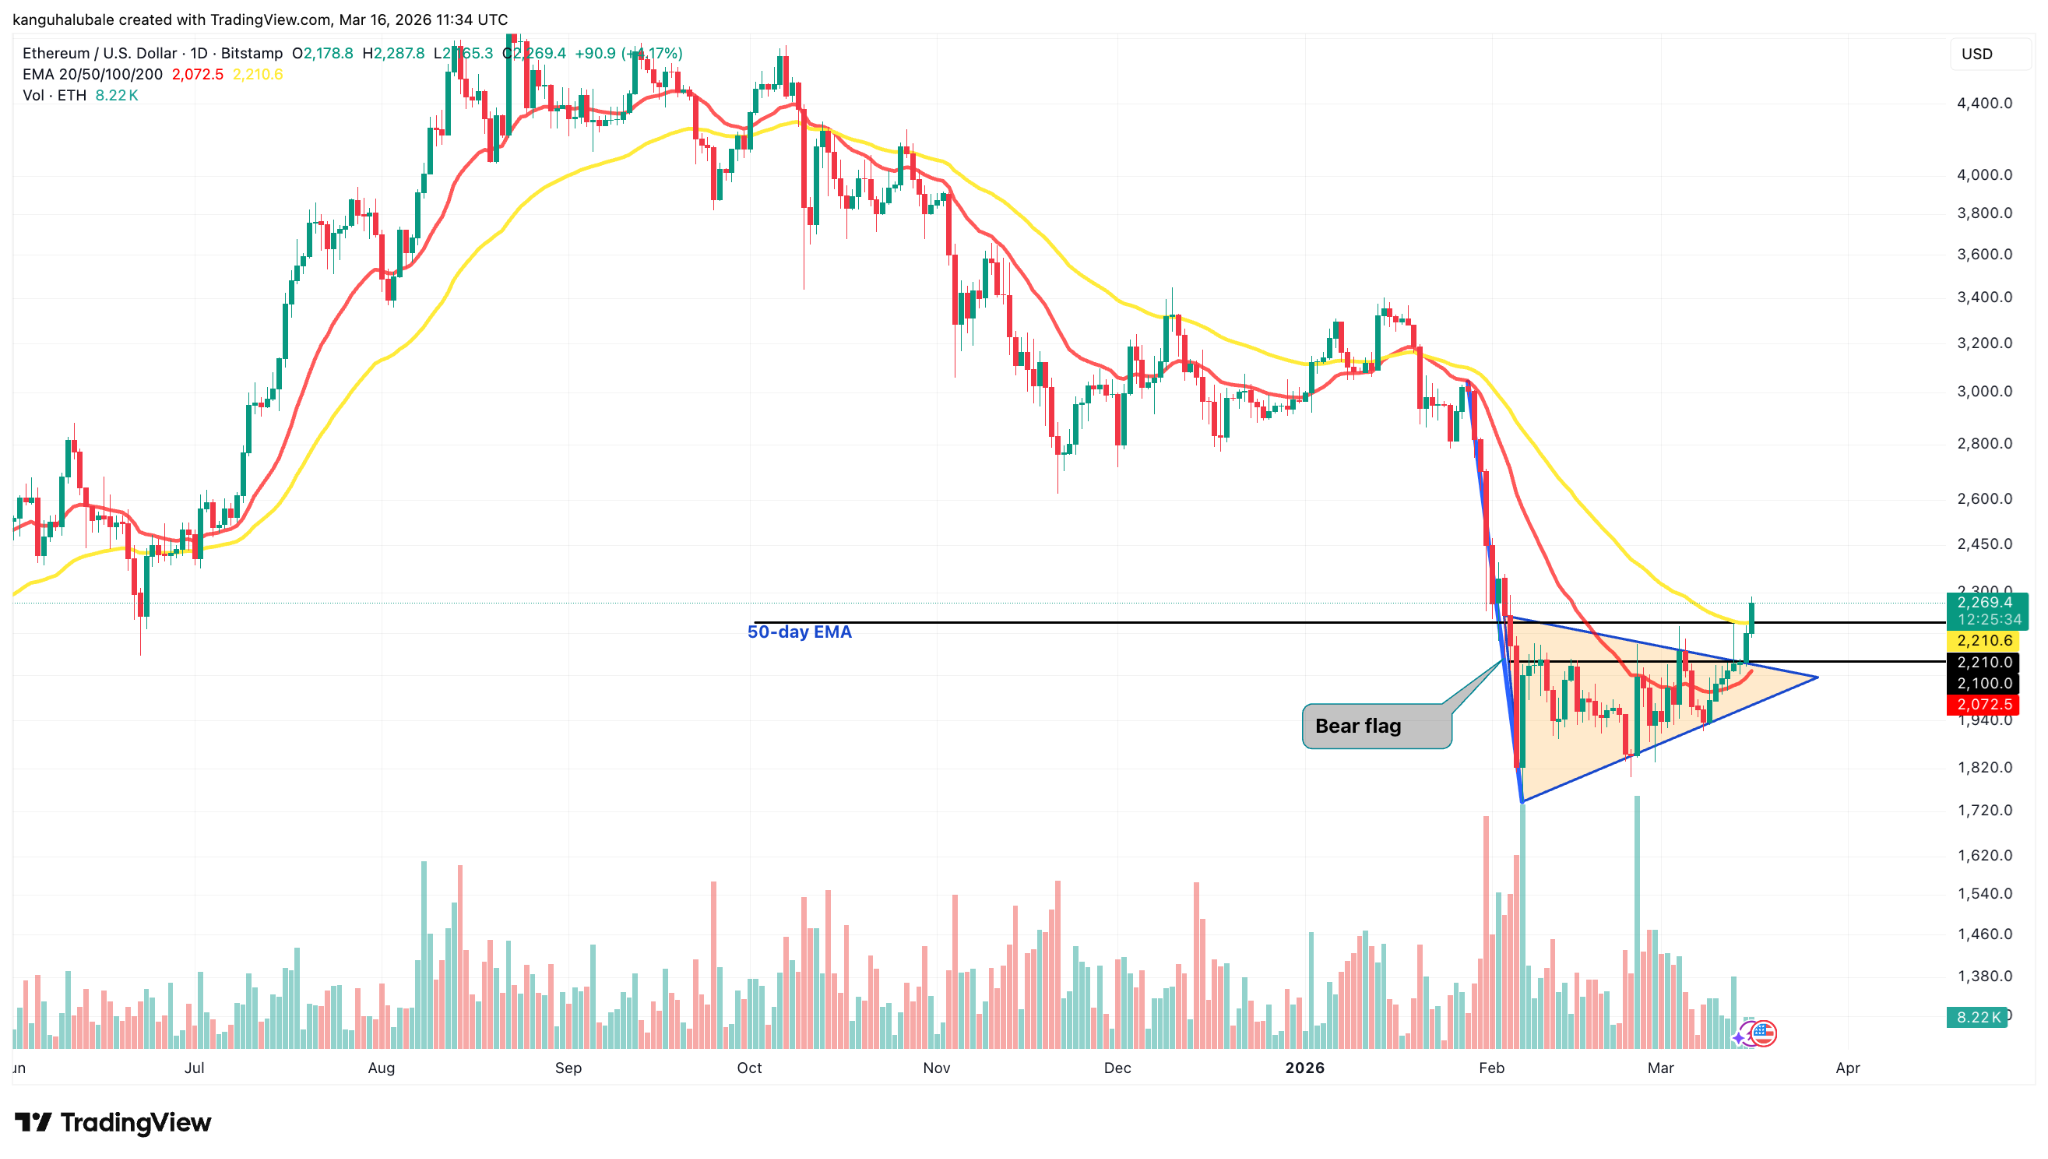
On Sunday, Ether’s price action invalidated what initially appeared to be a bear pennant on the daily chart.
Related: Ethereum Foundation sells $10.2M worth of ETH to BitMine in OTC deal
The ETH/USD pair pierced through the pennant’s upper trend line at $2,100, jumping 9.8% to a six-week high of $2,287 on Monday. Its breakout came alongside a rise in trading volume, implying stronger conviction behind the rally.

The price also reclaimed two key support lines in the name of the 20-day exponential moving average (EMA, red line) and the 50-day EMA (yellow line) at $2,072 and $2,210, respectively.
That simultaneously increased the odds of a symmetrical-triangle bullish reversal.
A symmetrical triangle forms when price makes lower highs and higher lows, compressing into a tightening range. It resolves when the price breaks either of the trendlines and moves by as much as the pattern’s maximum height.

In Ether’s case, the measured move above the upper trend line points to about $2,850, 26% above the current price. The level aligns with the 200-day EMA (the purple line), as shown in the chart above.
Ether’s next hurdle is the 100-day EMA (blue) near $2,500.
As Cointelegraph reported, a rejection there would weaken the breakout and raise the odds of a pullback.
Onchain data caps Ether’s upside at $2,800
ETH has been oscillating within a wide range defined by the realized price at $2,350 on the upside and on the downside at the lowest MVRV band of $1,650.
The chart below shows that the recent rebound off the lowest MVRV band mirrors the market structure observed in Q2 2022, where the price rallied past the realized price before being rejected by the first MVRV band just above.

This similarity reinforces the outlook that the current recovery attempt could be stopped around $2,650, where the first MVRV band sits above the realized price.
Glassnode’s Entity-Adjusted UTXO Realized Price Distribution (URPD), showing at which prices the current set of ETH UTXOs were created, also revealed a dense supply zone at $2,770-$2,880 that has been gradually maturing into the long-term holder cohort. This is where investors acquired more than 7.9 million ETH.
This unresolved supply overhang remains a persistent source of sell pressure, likely to cap attempts around the $2,800 level.

Meanwhile, ETH’s cost-basis distribution heatmap shows a heavy accumulation near $2,800, where more than 3 million ETH were previously purchased, suggesting a potential pathway toward this level in the short term.
Polymarket’s odds of $2,800 ETH price in March rise
Polymarket, a crypto-based prediction market where users trade contracts on real-world outcomes, is showing a clear bullish shift for Ether in March.
Traders now assign 13% odds that ETH reaches $2,800 in March, a 10% increase over the last 24 hours. The $2,600 and $2,400 targets carry even stronger convictions at 32% and 69%, respectively.

At the same time, the odds of the ETH price reaching $1,800 and $1,600 in March are priced lower than before, suggesting the crowd is trimming downside expectations.
This article does not contain investment advice or recommendations. Every investment and trading move involves risk, and readers should conduct their own research when making a decision. While we strive to provide accurate and timely information, Cointelegraph does not guarantee the accuracy, completeness, or reliability of any information in this article. This article may contain forward-looking statements that are subject to risks and uncertainties. Cointelegraph will not be liable for any loss or damage arising from your reliance on this information.

TLDR
- OpenAI has postponed its planned “adult mode” feature for ChatGPT designed to enable erotic conversations
- Safety advisers expressed concern the feature might function as a “sexy suicide coach” given users’ emotional attachment to the AI
- OpenAI’s age verification technology incorrectly identifies approximately 12% of minors as adults
- Given ChatGPT’s ~100 million underage weekly users, the error rate poses risk to millions of teenagers
- The company maintains it will eventually launch the feature but requires additional time to ensure proper implementation
OpenAI has postponed its controversial “adult mode” feature for ChatGPT following significant pushback from internal teams, external advisers, and safety specialists concerned about teenage safety and psychological risks.
CEO Sam Altman initially proposed the feature last year, positioning it as a way to enable adult-oriented text conversations with the AI assistant. Altman defended the concept as respecting mature users’ autonomy while potentially driving user engagement and revenue growth.
However, the initiative encountered substantial resistance within the organization.
During a January gathering, OpenAI’s well-being advisory council—comprising psychology professionals and cognitive neuroscience specialists—reportedly expressed unified and intense opposition to the plan.
One council member cautioned that OpenAI risked creating what they termed a “sexy suicide coach.” This stark warning referenced documented incidents where individuals developed profound emotional attachments to ChatGPT and subsequently ended their lives.
The advisers highlighted additional risks, including the potential for unhealthy psychological dependency on the chatbot and the likelihood that underage users would circumvent age-restriction measures.
The central technical challenge involves OpenAI’s age-detection technology. Testing revealed the system incorrectly categorizes minors as adults approximately 12% of the time. With ChatGPT serving roughly 100 million users under 18 years old weekly, this failure rate could potentially grant millions of teenagers access to mature content.
Age Verification Problems
The organization had originally intended to deploy its age-verification system prior to activating adult mode. However, after discovering the significant error rate, OpenAI opted for a gradual implementation to enhance accuracy.
OpenAI also confronted difficulties in filtering prohibited material, including depictions of non-consensual activities or child exploitation, while permitting legitimate adult interactions. Company insiders indicated that current safety mechanisms remain inadequate for this purpose.
When the adult mode eventually launches, OpenAI intends to restrict functionality to text-based interactions exclusively. The system will not produce erotic images, audio, or video materials.
Other AI Companies and Adult Content
Multiple competing AI platforms already permit certain adult-oriented content. Elon Musk’s xAI introduced a flirtatious personality option for its Grok assistant, though Musk subsequently limited access to paying subscribers. Meta permits its AI to participate in romantic roleplay scenarios, while stating the capability remains unavailable to accounts registered by minors.
In late 2024, a 14-year-old Florida resident died by suicide following an intense emotional relationship with a Character.AI chatbot. His mother pursued legal action, prompting Character.AI to reach a settlement and implement stricter teenage access controls.
OpenAI stated it continues to support the fundamental concept of providing adult content options for mature users. The organization indicated it will prioritize other enhancements in the interim, including improvements to ChatGPT’s personality features and customization capabilities.
The postponement is anticipated to extend at least one month, according to sources with knowledge of the situation.


Bitcoin’s recent strength during geopolitical uncertainty reflects a fundamental shift in the asset’s ownership structure, according to Wall Street broker Bernstein.
The cryptocurrency climbed roughly 7% last week, with ether (ETH) gaining about 9%, outperforming gold and global equity indices as markets reacted to escalating global conflict. The broker said the performance highlights how institutional ownership is reshaping the market.
“We believe the combination of Strategy’s treasury model and ETFs have transformed bitcoin’s ownership structure,” analysts led by Gautam Chhugani said in the Monday report.
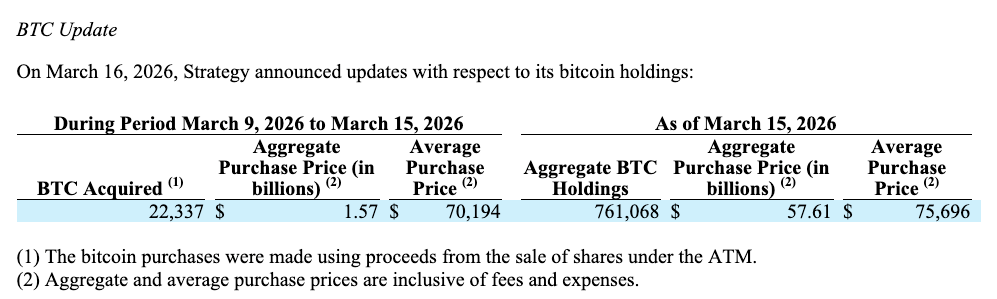
Strategy, which the analysts described as acting like a “bitcoin central bank of last resort,” has continued buying through the downturn. The firm extended its streak of weekly purchases, acquiring about $1.57 billion worth of BTC, according to a Monday filing.
The company, led by Executive Chairman Michael Saylor, bought 22,337 bitcoin at an average price of $70,194 each, bringing its total holdings to 761,068 BTC acquired at an average cost of $75,696 per coin.
Strategy has also expanded its preferred equity financing strategy through the STRC product, which offers investors high-yield income linked to the Secured Overnight Financing Rate (SOFR) and has generated rising trading volumes. The additional liquidity helps fund more bitcoin purchases through at-the-market offerings.
Meanwhile, spot bitcoin exchange-traded funds (ETFs) have attracted about $2.1 billion in inflows over the past three weeks, bringing ETF ownership to roughly 6.1% of total bitcoin supply. The analysts said these vehicles are increasingly drawing allocations from wealth managers, pension funds and sovereign investors.
Retail investors have been net sellers in recent months, but long-term holders remain dominant. About 60% of bitcoin supply has not moved for more than a year, a signal that many investors continue to treat the asset as a long-term store of value, the report said.
Bitcoin’s recent outperformance during geopolitical stress has also revived debate about its role as “digital gold.” While the token lagged the precious metal for much of the past year, its gains during the latest bout of global uncertainty have prompted some analysts to argue the asset is beginning to behave more like a geopolitical hedge, though the comparison remains contested.
For equity investors, Bernstein added that Strategy (MSTR) remains a high-beta way to gain exposure to bitcoin’s upside, currently trading at about a 14% discount to its bitcoin net asset value on a basic share basis.
The largest cryptocurrency was trading 4.4% higher around $73,900 at publication time. Ether, the second-largest crypto by market capitalization was up 8.4% at $2,273.
Read more: CEO of crypto investment firm Keyrock says bitcoin is undervalued, entering ‘transition year’
Michael Saylor’s Strategy, the world’s largest public holder of Bitcoin, continued aggressively stacking Bitcoin last week, bringing the company’s total reserves to above 760,000 BTC.
Strategy acquired 22,337 Bitcoin (BTC) for $1.57 billion last week, according to a US Securities and Exchange Commission filing on Monday.
The purchase ranks among the five largest Bitcoin acquisitions by Strategy on record, following a massive 17,994 Bitcoin buy for $1.28 billion a week earlier.

The purchase was made at an average price of $70,194 per Bitcoin, below the company’s overall average acquisition price of $75,696, Strategy said. Bitcoin averaged a price of $70,571 for the week of March 9-15, based on daily closing prices.
The acquisition brings its holdings to 761,068 BTC, acquired for a total cost of roughly $57.61 billion, the company said.
STRC now the most liquid preferred stock in the market, Saylor says
The purchase came amid Strategy selling record amounts of its perpetual preferred equity, Stretch (STRC), after easing its sales rules on March 9.
“This was the first week Strategy could run the STRC ATM in extended hours with a second broker,” Bitcoin Quant founder Rohan Hirani noted in a post on X.
Related: Strive allocates $50M of treasury to Strategy’s STRC preferred stock
According to STRC Live, the stock saw a record week last week, with 10,767 BTC estimated to be bought across four active days.

According to the filing, Strategy sold 11.9 million STRC shares for $1.18 billion during the week, with net proceeds accounting for 75% of the entire purchase. The company also sold 2.8 million Common A shares (MSTR), generating $396 million.

With Strategy now holding 761,068 BTC, the company would need to acquire 238,932 BTC to reach 1 million, an average of about 5,700 BTC per week over the remaining 42 weeks of 2026.
Magazine: Bitcoin’s ‘narrative vacuum,’ Ethereum now inevitable: Trade Secrets


Opinion by: Neil Staunton, CEO and co-founder of Superset
Crypto is one of the most innovative corners of finance. New protocols launch every week. New market designs are constantly tested, and experimentation moves fast. But innovation alone can’t build financial systems that institutions can rely on.
There’s a reason traditional finance is deliberately boring. It shouldn’t be a rollercoaster of emotions or surprises. When money is involved, reliability is much more important than novelty. Predictable settlement, consistent pricing and clear risk boundaries are what allow capital to move at scale. Without them, even the most elegant tech remains sidelined.
This is where crypto falls short. Today’s onchain market structure simply isn’t enough to support it. This is not about institutions “not getting it” (because they definitely are), but rather, it’s about meeting them where they are.
The infrastructure is there, but the ideology needs some help
Institutional hesitation toward crypto is often framed as a cultural divide, but this is a mistranslation. Banks, asset managers and payment providers adopt new technology all the time. Whether it’s real-time payment rails or cloud-based core banking systems, they’re open to innovation as long as it works reliably, repeatably and at scale.
The issue that’s been holding crypto back from institutional adoption is not merely self-custody or deeper decentralization but is actually a core industry problem: liquidity fragmentation.
Currently, liquidity is scattered across chains, venues and execution environments. Capital cannot be shared, and therefore, it needs to be duplicated. This leads to inconsistent pricing, higher slippage and risk being difficult to define (let alone manage). It’s a problem that’s been talked about a lot over the last few years, but hasn’t reliably been solved.
These issues are structural, rather than mere philosophical differences. Until they’re addressed, institutions will continue to experiment cautiously.
Market structure matters most
Regulation and user experience often dominate the crypto adoption conversation. And it’s true that both are important and need to be properly addressed. From an institutional perspective, market structure is a bottleneck that’s getting in the way of adoption.
At scale, financial systems must handle dollars and FX with precision. They must support deep liquidity, tight spreads and predictable execution even under stress. They need to behave the same way yesterday, today and tomorrow — and every day to come. But when liquidity is fragmented, none of this is possible.
Even well-capitalized institutions struggle to meaningfully deploy when execution depends on bridging risk, duplicated margin or inconsistent settlement paths. The result is higher costs, unclear exposures and hesitation to scale participation. Simply put, this is a massive failure of coordination.
Institutions need reliability
Traditional finance prefers its older systems because they have proven themselves, are familiar and dependable. If the crypto industry wants to attract institutions, it’ll need to make reliability a first-class design constraint.
Yes, some are skeptical of crypto, but the only way to prove them wrong is by earning trust through repetition and, frankly, being a bit boring. It needs to show that it can do the same thing, the same way, under a large variety of conditions. This is what institutions look for when they evaluate infrastructure. They need to be totally confident that risk is visible, liquidity is real and execution will behave as expected.
A moment of transition
Timing matters. Right now, people believe that the financial system needs to make significant changes. Institutions are demanding infrastructure that frees trapped capital and delivers predictable execution across an increasingly fragmented system.
Related: Animoca’s Yat Siu says crypto finally has to grow up
Stablecoins are becoming increasingly used as payment rails rather than entry-level crypto tools. They currently process close to $1 trillion a year, with a volume surge of 690% year-over-year in 2025. At the same time, financial institutions have started testing, integrating and building stablecoins into their books. Even the US Federal Reserve now analyzes how stablecoin growth reshapes bank funding and credit provision, underscoring that this shift is not hypothetical but already influencing core market plumbing.
This shift changes the question. It’s no longer whether crypto can coexist with traditional finance; it’s whether its infrastructure is ready to support it.
What “growing up” actually means
Maturity doesn’t mean crypto needs to lean into centralization or abandon self-custody or composability. It just means that coordination, where markets require it, needs to be prioritized: shared liquidity, consistent pricing and capital efficiency. At the same time, decentralization must be preserved where it truly matters.
This is about function over flash when it comes to designing systems. In finance, clever ideas matter far less than dependable ones.
This isn’t a surrender to corporate whim
Putting on a suit doesn’t mean losing crypto’s identity. Crypto so far has focused on proving what’s possible, but it needs to recognize that this next phase is about proving what works.
The future of crypto will not be defined by how radical it sounds; it will be defined by operational consistency when real capital is on the line. That’s not selling out — but growing up.
Opinion by: Neil Staunton, CEO and co-founder of Superset.
This opinion article presents the author’s expert view, and it may not reflect the views of Cointelegraph.com. This content has undergone editorial review to ensure clarity and relevance. Cointelegraph remains committed to transparent reporting and upholding the highest standards of journalism. Readers are encouraged to conduct their own research before taking any actions related to the company.
Key Takeaways
- Proposed US restrictions on stablecoin yields may redirect investors to international platforms.
- Foreign jurisdictions could capture early-adopter advantages in stablecoin return offerings.
- Asian financial hubs prioritize blockchain infrastructure, tokenization, and enterprise stablecoins
- Clear regulatory frameworks overseas may draw capital away from American crypto markets.
- Global competition for stablecoin yield services escalates as nations refine regulatory approaches.
A proposed American prohibition on stablecoin yield distributions could catalyze international markets to develop competing alternatives. Nations beyond US borders may rapidly introduce yield-bearing products that domestic users cannot legally access. This regulatory divergence could fundamentally alter stablecoin business models as foreign regulators and issuers adapt to emerging market dynamics.
Current US Senate deliberations on cryptocurrency legislation include a contentious proposal to limit third-party platforms from offering stablecoin yields. Traditional banking interests have advocated for this restriction, while digital asset proponents strongly oppose it, creating ongoing political gridlock. This regulatory vacuum presents significant opportunities for international competitors to capture market share in stablecoin services.
Yield generation has become a primary attraction for stablecoin holders, enabling passive returns on digital dollar equivalents. Should the United States implement restrictive measures, other nations may accelerate development of permissive regulatory structures. Foreign stablecoin providers could consequently secure competitive positioning, capturing investment capital currently domiciled in American markets.
International Markets Positioned to Offer Stablecoin Returns
Australia and comparable regulatory environments have established specific exemptions allowing stablecoin issuers to distribute yields to holders. These progressive frameworks enable product innovation while maintaining compliance with broader financial regulations. Currently, most global stablecoin platforms restrict yield payments to avoid conflicts with traditional banking regulations.
Should American lawmakers proceed with prohibition measures, the international competitive landscape could transform dramatically, encouraging worldwide regulators and issuers to reconsider their stablecoin yield strategies. Leading financial centers may leverage this regulatory gap to enhance their cryptocurrency service ecosystems. This dynamic could intensify rivalry among jurisdictions competing to dominate digital dollar infrastructure.
Stablecoin yield platforms may experience accelerated international expansion if US limitations take effect. Emerging markets could introduce superior yield rates or novel structural approaches to attract users. American investors may increasingly seek offshore alternatives offering greater flexibility in stablecoin products.
Asian Financial Institutions Embrace Blockchain Infrastructure
Prominent Asian financial institutions are concentrating investment on blockchain technology frameworks rather than direct cryptocurrency holdings. They are investigating tokenization of traditional financial instruments and institutional stablecoin issuance as strategic priorities. This approach emphasizes distributed ledger applications while treating speculative crypto assets like Bitcoin and Ethereum as peripheral concerns.
Asset management firms demonstrate greater engagement with cryptocurrency product creation, attempting to diversify client portfolio options. Less restrictive custody regulations enable them to examine stablecoin yield structures more aggressively. These institutions carefully evaluate partnership opportunities to ensure regulatory compliance and robust security protocols.
Stablecoin yield products are becoming increasingly central to Asian financial planning. Regulatory transparency and technological readiness shape institutional deployment decisions. Accordingly, international stablecoin ecosystems may experience significant diversification as global participants respond strategically to American policy developments.

Quick Overview
- Salesforce initiated a record-breaking $25 billion accelerated share repurchase (ASR) program — its largest ever
- The repurchase commenced March 11, 2026, delivering approximately 103 million shares upfront
- These 103M shares account for about 80% of the anticipated total repurchase volume
- This $25B ASR represents half of a comprehensive $50 billion buyback authorization approved by directors in February 2026
- CRM shares climbed approximately 2.5% during premarket hours Monday; complete settlement anticipated in Q3 or Q4 of fiscal 2027
Salesforce (CRM) initiated its historic $25 billion accelerated share repurchase initiative on Monday, marking the company’s most substantial ASR to date and pushing shares higher by approximately 2.5% in early trading.
The cloud computing giant verified the prepayment and upfront transfer of approximately 103 million shares through ASR contracts executed on March 11, 2026, involving several prominent banking institutions.
The financial partners include Banco Santander, Bank of America, Citibank, JPMorgan Chase Bank, and Morgan Stanley, with J. Wood Capital Advisors providing advisory services for the arrangement.
The upfront transfer of 103 million shares constitutes approximately 80% of total shares projected for repurchase in this phase. The precise final count will depend on CRM’s volume-weighted average trading price throughout the transaction period, adjusted for a discount and other variables.
CEO Marc Benioff expressed strong enthusiasm for the decision. “We are aggressively repurchasing shares because we are so confident in the future of Salesforce,” he stated.
Robin Washington, Salesforce’s president and chief operating and financial officer, characterized the ASR as demonstrating the organization’s “increased conviction in the durability of its growth and cash flow trajectory.”
The $25 billion initiative represents the immediate deployment of precisely half the $50 billion comprehensive share repurchase authorization that Salesforce’s board of directors greenlit during February 2026.
This $50 billion overall program stands among the most substantial buyback commitments in enterprise software sector history.
Financial Details of the Transaction
The upfront 103 million share transfer calculation utilizes CRM’s closing stock price from March 11, 2026 — when the ASR contracts were officially signed.
Final settlement for this $25 billion portion is projected to occur during either the third or fourth quarter of Salesforce’s fiscal year 2027.
Trading approximately 2.5% higher in Monday’s premarket session, investors demonstrated cautious optimism about the announcement, though the response remained relatively modest considering the program’s magnitude.
Salesforce has faced mounting shareholder pressure throughout the past year to productively deploy its expanding cash reserves, and the $50 billion commitment represents a clear response to those demands.
Looking Forward
The additional $25 billion portion of the comprehensive $50 billion authorization remains unexecuted at this time.
This second installment may proceed through additional ASR arrangements or traditional open market acquisitions, though Salesforce hasn’t disclosed a specific timeframe.
The present ASR encompasses five major financial institutions, indicating a carefully orchestrated and professionally managed implementation rather than a straightforward market-based buyback approach.
The definitive share count for this phase will only be determined upon settlement completion, which isn’t anticipated until late in fiscal year 2027.
Momentum indicators are important tools for traders seeking to evaluate the strength and speed of price movements. These technical analysis instruments are used by traders to identify potential entry and exit points, confirm market signals, and filter market noise. In this article, we review five momentum indicators that remain widely used by traders to support them in their decision-making in volatile markets.
What Is a Momentum Indicator?
Momentum in technical analysis refers to the rate at which an asset’s price accelerates or decelerates. Understanding momentum may assist traders in identifying potential trend continuations or reversals.
A momentum indicator is a technical analysis tool that measures how quickly and strongly an asset’s price is moving. Instead of showing the direction of the trend, it highlights the strength behind price movements. By comparing price changes over a set period, momentum indicators can help traders see if a market is gaining or losing strength. This information is often used to spot potential overbought or oversold conditions and to identify possible entry or exit points.
A stock momentum indicator like the Relative Strength Index (RSI), for instance, may indicate that stocks are currently bought or sold too heavily and their price is due for a reversal.
The Significance of Momentum Technical Indicators
Momentum indicators do not focus on the direction of the price movement, but rather on the strength behind it. They’re able to quantify and represent hidden clues about the future market direction. By learning to read momentum indicators, traders can develop trading strategies and identify conditions for new trades.
Momentum tools produce a range of signals that offer traders an edge over the markets. Let’s take a look at some of the most common momentum signals, including overbought/oversold conditions, divergences, and crossovers.
Overbought and Oversold Conditions

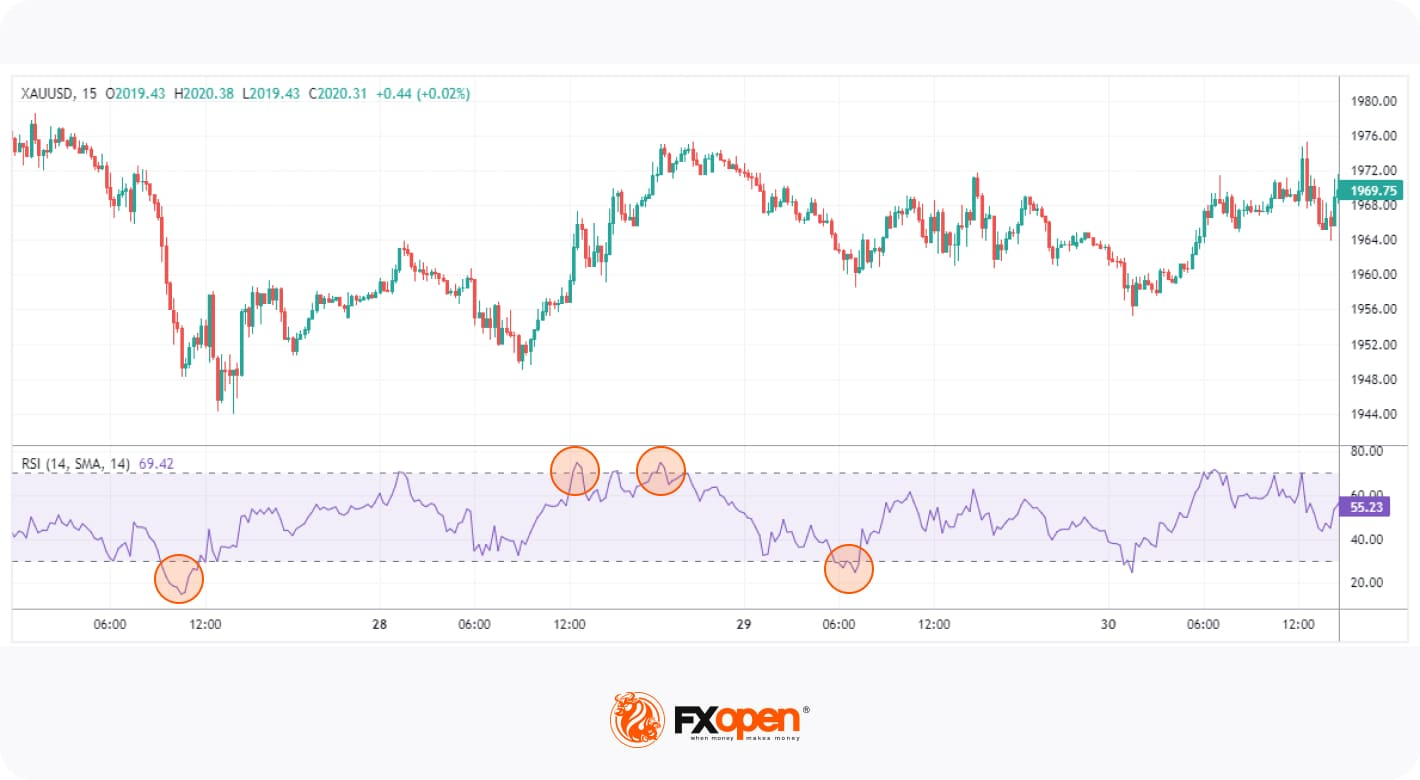
These signals indicate when an asset’s price has moved too far in one direction without sufficient support from fundamental or technical factors and is likely to reverse. For example, RSI generates overbought signals when the reading rises above 70 and signals oversold conditions when the reading falls below 30.
Divergence
Divergence occurs when the price of an asset moves in the opposite direction of the indicator, suggesting an upcoming reversal. For instance, when the price is making higher highs, but RSI is making lower highs, this indicates a bearish divergence that increases the likelihood of a downward move.
Crossover

These signals are generated when the indicator’s lines cross each other or a certain threshold. A common example is the MACD, where traders look for crossovers between the fast MACD line and the slower signal line to spot potential entry and exit points.
List of Five Momentum Indicators for Technical Analysis
Now that we understand the types of signals that momentum tools produce, let’s break down five of the most popular with a momentum indicators list. If you’d like to experiment with them yourself, you’ll find each tool in the TickTrader trading platform.
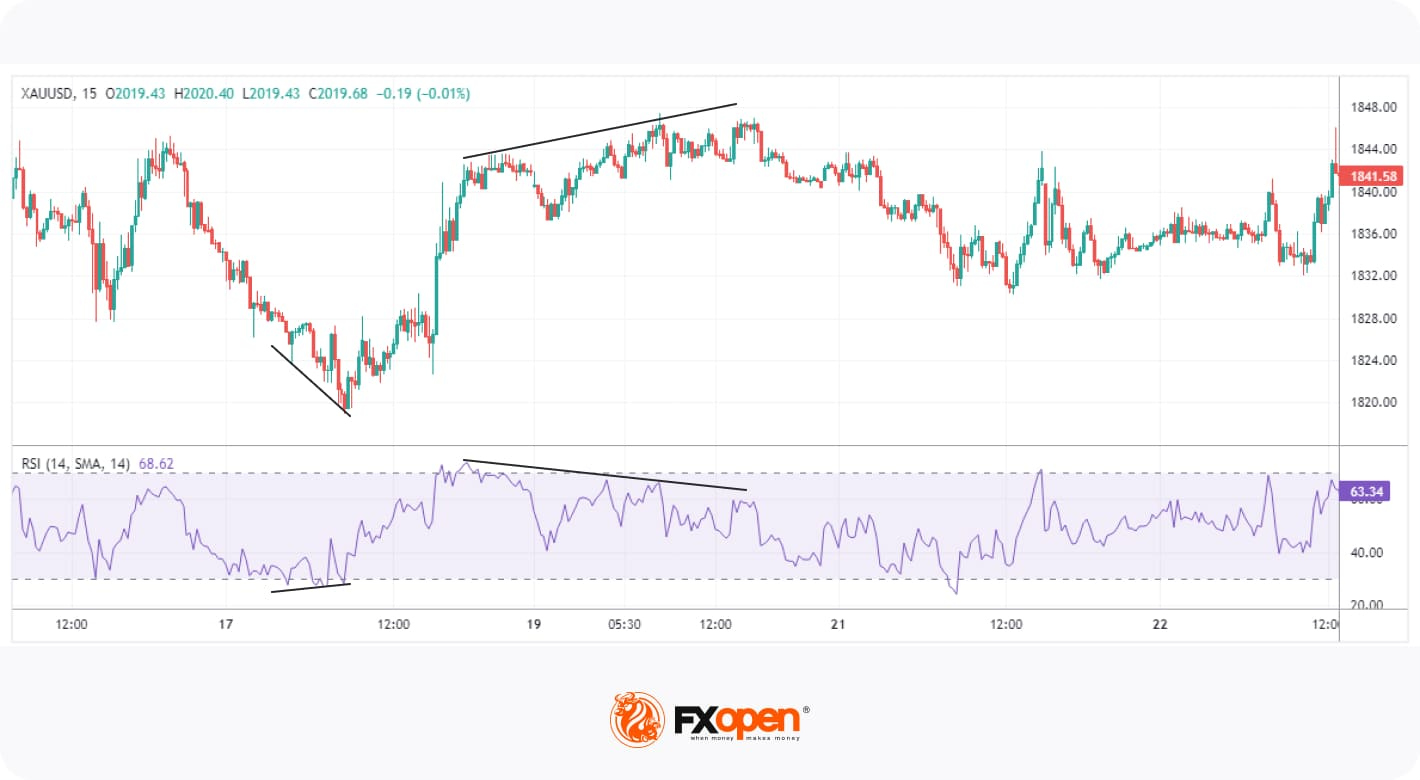
1. Relative Strength Index (RSI)
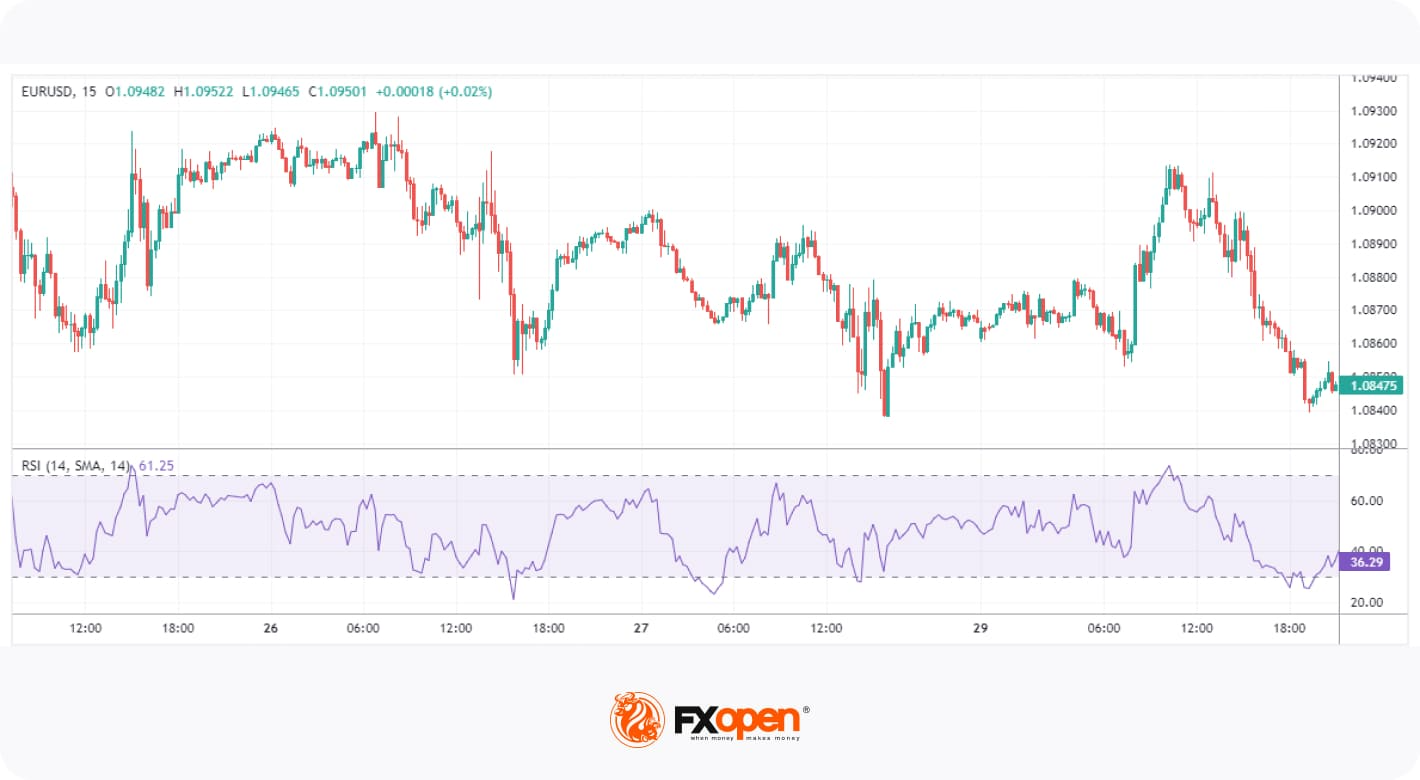
The RSI is one of the most popular and well-documented momentum indicators. It measures the speed and change of price movements by comparing the average gain to the average loss over a specified period, usually 14.
RSI is an oscillator, moving between 0 and 100. Values above 70 reflect overbought conditions, while values below 30 indicate oversold conditions. When the RSI moves out of overbought or oversold territory, many traders interpret this as a reversal confirmation. Sustained movements above or below the midpoint (50) can also be used to confirm a bullish or bearish trend, respectively. Moreover, traders look for divergence between the RSI and price to identify weakening trends and possible reversals.
2. Average Directional Index (ADX)
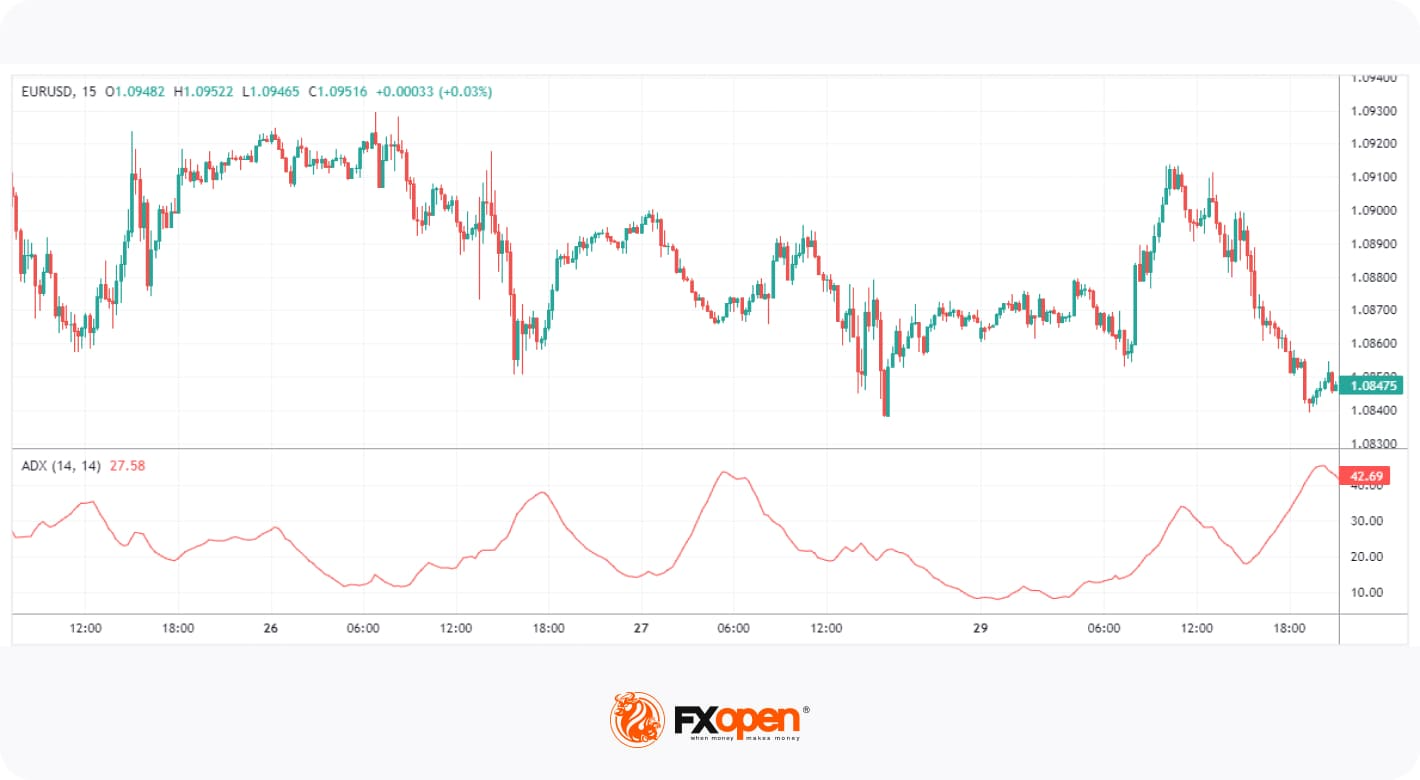
The ADX is a momentum indicator used to determine a trend’s strength. Unlike most other tools, its reading doesn’t move according to the direction of price action, i.e. it doesn’t move up if bullish or down when bearish. Instead, it ranges from 0 to 100, with values above 25 indicating a strong trend and below 25 suggesting a weak or non-trending market.
ADX is commonly used in combination with other tools, as it simply confirms the trendiness of a market. For example, traders might use a leading indicator like RSI to anticipate bullishness and confirm the trend when ADX crosses over 25.
3. Commodity Channel Index (CCI)
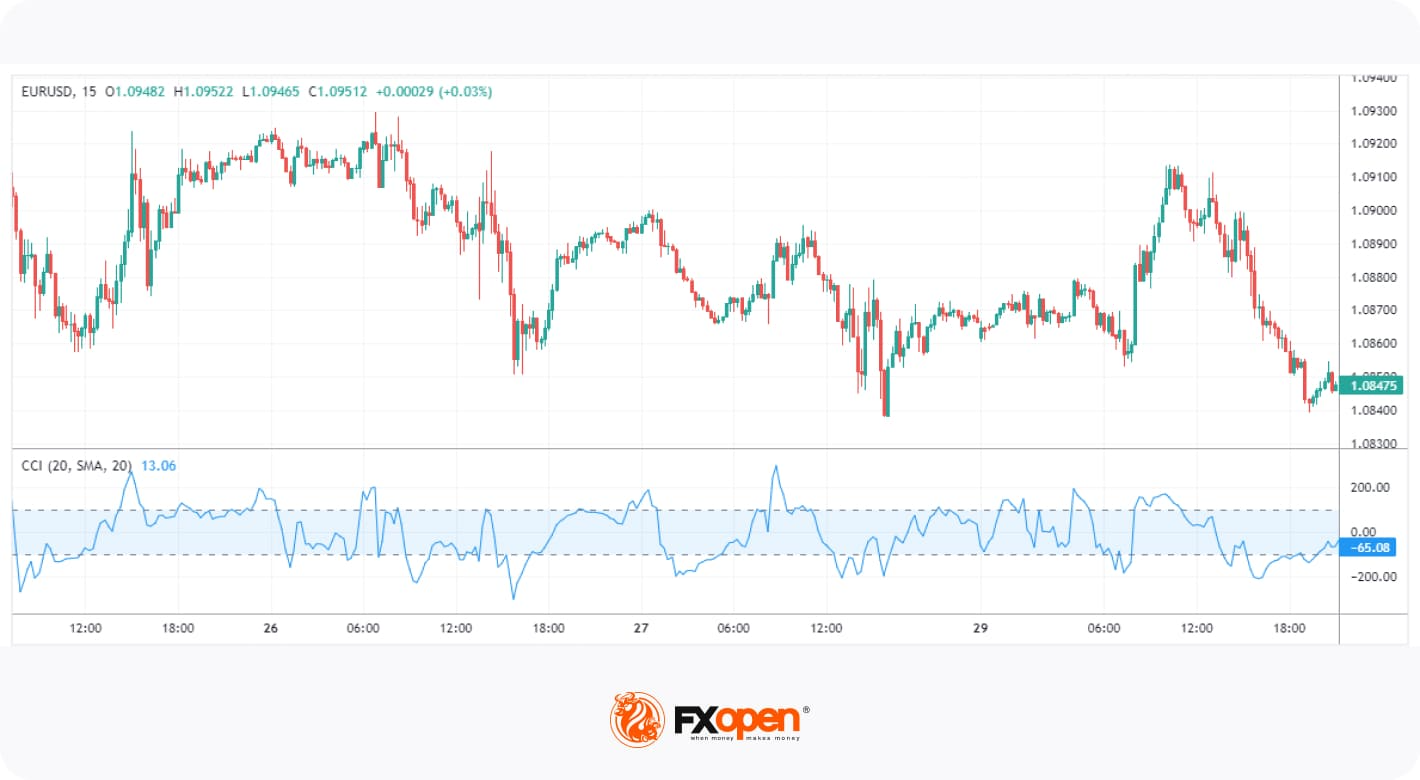
The CCI is a versatile momentum indicator. It uses a constant in its calculation to ensure that 75% of values fall between +/- 100, with moves outside of the range generally indicating a trend breakout or continuation. It can also show extreme overbought or oversold conditions when its value exceeds +/- 200.
The CCI requires a more nuanced approach than other tools and is typically used to confirm a trader’s directional bias. For instance, a visually identifiable bullish trend can be confirmed by looking at the CCI. If its value is skewed toward 100+, traders can be confident in their observation. When the market cools off, CCI will fall below 100. Traders can then confirm a pullback entry with a move back into the +/- 100 range.
4. Moving Average Convergence Divergence (MACD)
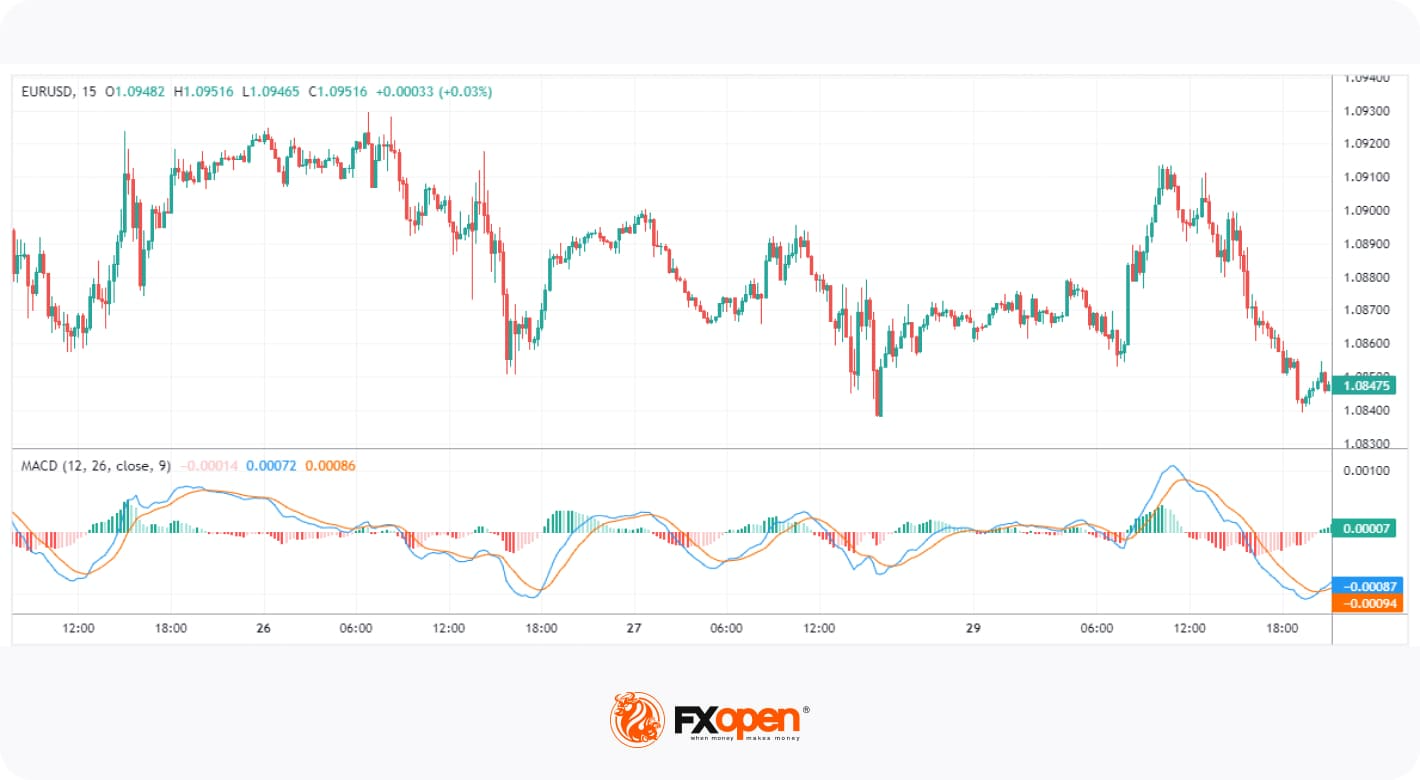
The MACD is a highly regarded trend-following momentum indicator that shows the relationship between two moving averages of an asset’s price. It’s used in technical analysis to identify the relationship between two moving averages of a security’s price. The MACD reflects the trend’s strength, direction, and duration, as well as possible reversal points.
Traders use crossovers between the MACD and signal lines as potential entry and exit signals. Additionally, when the MACD histogram crosses above or below the zero line, it can indicate bullish or bearish momentum in the market. Lastly, it’s also possible to spot divergences between price and the indicator’s peaks and troughs, similar to how divergences are identified with RSI.
5. Momentum (Mom)
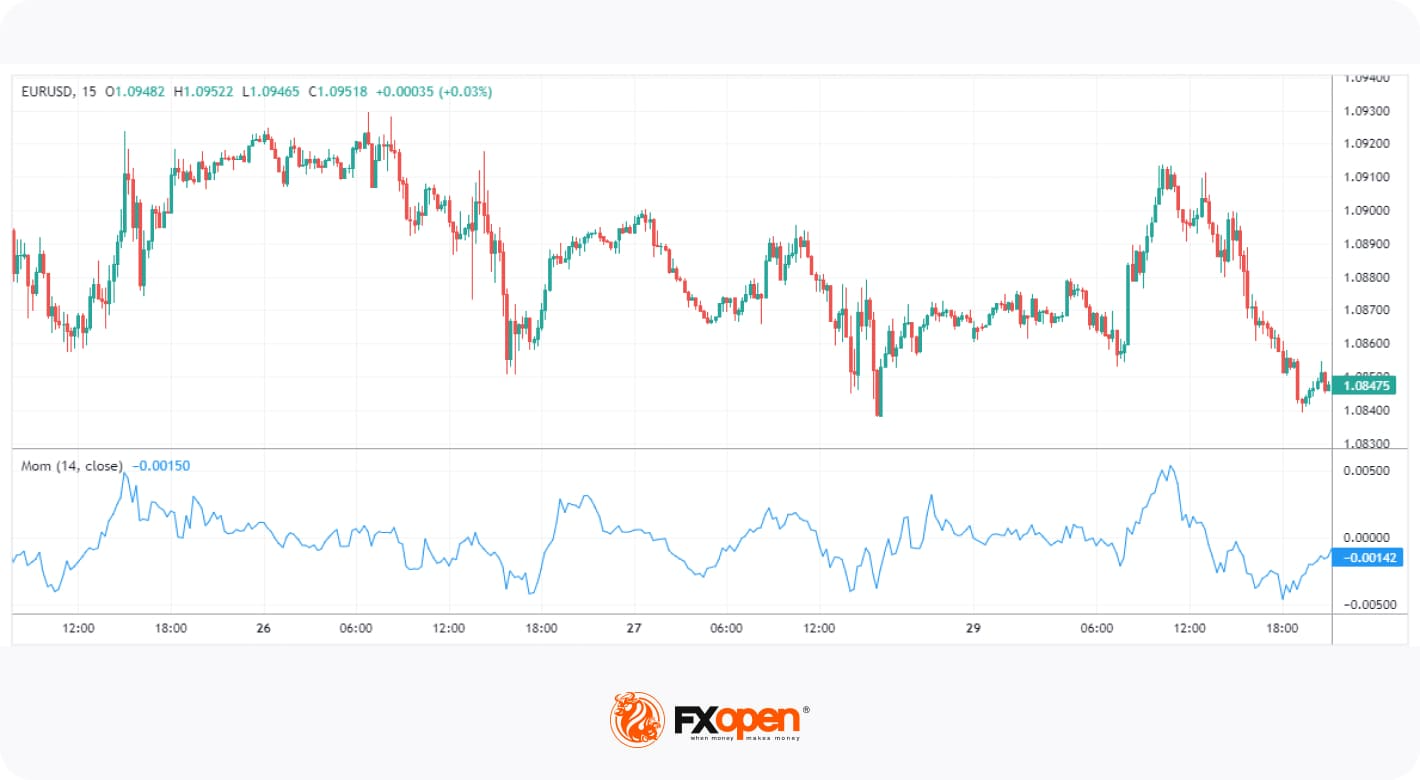
The Momentum indicator is considered a simple tool that measures the rate of change in an asset’s price over a specific period. The value of the Momentum depends on the market it’s applied to. For example, using the Momentum indicator in stocks will result in a fluctuating value typically between +/- 20, depending on the stock’s price. For forex pairs, its range may look more like +/- 0.02.
The common feature across all markets, however, is the zero line. Generally speaking, positive Momentum values indicate upward price movement, while negative values suggest downward movement. It can also show overbought and oversold conditions, but its lack of defined boundaries means this can be tricky. However, Momentum is especially useful for identifying divergences.
Advantages of Momentum Indicators
Momentum indicators are valuable tools in technical analysis, reflecting the strength and speed of price movements. They offer several advantages that may improve trading strategies:
- Identify Trends Early: Market momentum indicators can reveal potential shifts in trend direction, providing traders with additional context for evaluating entry and exit points.
- Objective Analysis: They provide quantifiable data, reducing reliance on subjective analysis and emotional decision-making.
- Spot Overbought and Oversold Conditions: Momentum tools show when an asset is overbought or oversold, signalling potential reversals and exit points.
- Confirm Trade Signals: Combining momentum indicators with other technical tools may improve trade signals, providing stronger confirmation for trading decisions.
- Adaptable Across Markets: They can be applied to various assets, including stocks, forex, and commodities, making them versatile tools for traders.
Things to Consider When Trading Momentum Indicators
While momentum indicators may be a helpful addition to any trader’s arsenal, there are a few things to be aware of:
- Trade with the Trend: Trends often last longer than you may think, and constantly looking for trend reversals will only end in frustration. Look for bullish signals during an uptrend and bearish signals in a downtrend.
- Use Multiple Indicators: Relying on a single tool can lead to false signals. Many traders combine a lagging indicator, like MACD, with a leading indicator, like RSI. Combining two or three tools may help confirm signals and improve trade accuracy.
- Beware of False Signals: Momentum indicators can sometimes generate false signals, especially in sideways or choppy markets. Being patient and waiting for confirmation before entering a trade is vital.
- Don’t Rely Too Heavily on Indicators: While momentum indicators may be helpful, relying solely on them without considering price action, market structure, or fundamental aspects can lead to poor trading decisions. Use these indicators alongside other tools for a momentum indicator strategy.
Final Thoughts
Momentum indicators play a critical role in technical analysis, offering traders valuable insights into the strength and direction of market movements. Tools such as RSI, MACD, CCI, ADX, and the Momentum Indicator are widely used to confirm trends, highlight overbought or oversold conditions, and improve entry and exit timing. While no single indicator should be used in isolation, combining these tools with solid risk management and broader market analysis can support traders in their trading decision-making.
If you want to test your strategy with the above-mentioned indicators, you may consider opening an FXOpen account, where you can trade over 700 markets with low costs. Good luck!
FAQ
How May Momentum Indicators Be Used?
Momentum indicators may be used to assess the speed and strength of price movements in a financial market. They can help traders identify potential overbought or oversold conditions, confirm trends, or signal possible reversals. By comparing the current price to previous price levels, momentum indicators provide insights into whether a market move is gaining or losing strength.
What Period is Set for a Momentum Indicator?
If we are talking about the Momentum indicator, the period depends on your trading style. For short-term traders, 7 and 10 periods are common, while long-term traders may prefer 14 and 21 periods. Testing various periods based on asset volatility can improve results.
What Is the Most Popular Momentum Indicator for Scalping?
There is no single most popular momentum indicator for scalping but the Relative Strength Index (RSI) is often favoured by scalpers due to its ability to quickly identify overbought or oversold conditions. Its responsiveness is used by scalpers to make rapid decisions in fast-moving markets.
What Is the Difference Between Momentum and Trend Indicators?
Momentum trading indicators measure the speed of price changes, while trend indicators assess the direction and persistence of price movements. To put it simply, momentum focuses on strength, while trend indicators focus on the overall direction.
Is MACD a Momentum Indicator?
Yes, the Moving Average Convergence Divergence (MACD) is one of the most popular momentum indicators, especially in forex and stock trading. It may reveal changes in momentum and help identify potential trend reversals.
This article represents the opinion of the Companies operating under the FXOpen brand only. It is not to be construed as an offer, solicitation, or recommendation with respect to products and services provided by the Companies operating under the FXOpen brand, nor is it to be considered financial advice.


The company’s total stash is worth $11.5 billion, it said in a recent statement.
The Tom Lee-chaired former Bitcoin mining giant has announced the acquisition of almost 61,000 ETH in the past week, which has pushed its total stash to nearly 4.6 million tokens.
In addition, BitMine said it increased its investment in existing ‘moonshot’ exposures such as Eightco by an additional $80 million to support the latter’s $50 million purchase of OpenAI equity, making it the only publicly listed entity to give investors direct exposure to the company behind ChatGPT.
“Since the start of the Iran war, crypto prices have outperformed and Ethereum has outperformed the S&P 500 by 2,450bp. This is a meaningful outperformance in a mere two weeks,” said Thomas “Tom” Lee, Chairman of Bitmine.
Lee added that higher oil prices will trigger concerns of slowing growth for the global economy, which would push investors to buy growth stocks such as MAG7, software, and crypto.
In its latest Ethereum acquisition of 60,999 tokens, Lee explained that the firm he chairs has ramped up the pace of such purchases as they believe the asset is in the final stages of the mini-crypto winter.
He asserted that BitMine has “staked more ETH than other entities in the world. At scale, the ETH staking rewards are $272 million annually.”
The company’s total stash, which includes its ETH fortune, 196 BTC, a $200 million stake in Beast Industries, a $83 million stake in Eightco, and $1.2 billion in cash, has risen to $11.5 billion. Its Ethereum holdings represent 3.81% of the entire asset supply.
While being the first in the Ethereum treasury world, BitMine is the second overall in crypto, trailing only to Michael Saylor’s Strategy, which announced its latest gigantic BTC purchase earlier today.
You may also like:
Binance Free $600 (CryptoPotato Exclusive): Use this link to register a new account and receive $600 exclusive welcome offer on Binance (full details).
LIMITED OFFER for CryptoPotato readers at Bybit: Use this link to register and open a $500 FREE position on any coin!


A whitehat hacker has gone public over a months-long feud with the team behind Injective over its response to a critical bug disclosure.
According to the report, the vulnerability in question put $500 million at risk via a faulty validation system.
The pseudonymous crypto security researcher, who goes by the moniker al_f4lc0n, has accused Injective of ghosting them for three months, despite fixing the bug, and later lowballing the bounty payout.
Read more: Ethereum address poisoning spike, ‘wallets aren’t ready’ says researcher
The bug
The bounty hunter uploaded a full bug report to a GitHub repository called “injective-wall-of-shame.”
In the repo’s readme, entitled “I Saved Injective’s $500M. They Pay Me $50K,” they explain that the vulnerability allowed “any user to directly drain any account on the chain. No special permissions needed.”
The more detailed technical report describes how a faulty subaccount validation system allowed for an attacker to submit market orders on other users’ behalf.
The bug was exploitable by an attacker creating a worthless token and creating a spot market, pairing it with USDT. Both these actions are permissionless on Injective.
Then, by creating a sell order of the fake token, the attacker could force victim accounts to buy the worthless token for USDT, “at the attacker’s chosen price.” The USDT could then be permissionlessly bridged off Injective, to Ethereum.
The report claims this put all value on the blockchain at risk, and that the total was over $500 million at the time of disclosure.
The figure currently sits at $280 million, the vast majority of which is in the INJ token.
Embed: Oracle error adds to turmoil at DeFi giant Aave
The bounty
Injective is a blockchain network which lists the likes of Binance, Jump, Google and Pantera as partners, claiming “institutional and government players are joining us.”
Bug bounties are a common way for organizations to crowdsource continuous security monitoring from specialist whitehat bounty “hunters.”
Injective’s ImmuneFi page lists a maximum bounty of $500,000 for critical threats related to its blockchain and smart contracts.
The researcher claims, “a mainnet upgrade to fix the bug went to governance vote. The Injective team clearly understood the severity.”
They also allege that injective “ghosted” for three months after the fix, before offering a bounty 10x lower than the maximum. “To be clear: the $50K has not been paid either,” they stress.
Protos has reached out to Injective for comment on al_f4lc0n’s claims, but hadn’t received a response before publication. This article will be updated should we receive one.
Got a tip? Send us an email securely via Protos Leaks. For more informed news, follow us on X, Bluesky, and Google News, or subscribe to our YouTube channel.

Michael B. Jordan Makes Surprise Stop After Oscar Win

Marchesa Botanical Beauty Collection – Now Up to 60% OFF

Criminals hijack thousands of devices to create never-before-seen cyber weapon


-
 Tech5 days ago
A 1,300-Pound NASA Spacecraft To Re-Enter Earth’s Atmosphere
-
Crypto World2 days ago
HYPE Token Enters Net Deflation as HyperCore Buybacks Outpace Staking Rewards
-

 Business6 days ago
ExxonMobil seeks to move corporate registration from New Jersey to Texas
-

 Crypto World7 days ago
Paradigm, a16z, Winklevoss Capital, Balaji Srinivasan among investors in ZODL
-

 Fashion3 days ago
Weekend Open Thread: Addict Lip Glow
-

 Tech6 days ago
ChatGPT will now generate interactive visuals to help you with math and science concepts
-
Sports2 days ago
Why Duke and Michigan Are Dead Even Entering Selection Sunday
-

 NewsBeat5 days ago
Residents reaction as Shildon murder probe enters second day
-
 NewsBeat7 days ago
Pagazzi Lighting enters administration as 70 jobs lost and 11 stores close across Scotland
-

 Business5 days ago
Search Enters Sixth Week With New Leads in Tucson Abduction Case
-

 Business19 hours ago
Search for Savannah Guthrie’s Mother Enters Seventh Week with No Arrests
-

 Tech7 days ago
Despite challenges, Ireland sixth in EU for board gender diversity
-

 Business2 days ago
US Airports Launch Donation Drives for Unpaid TSA Workers as Partial Government Shutdown Enters Fifth Week
-
Crypto World2 days ago
Coinbase and Bybit in Investment Talks: Could Bybit Finally Enter the US Crypto Market?
-

 NewsBeat5 days ago
I Entered The Manosphere. Nothing Could Prepare Me For What I Found.
-

 Business7 days ago
Search Enters 39th Day with FBI Tip Line Developments and No Major Breakthroughs
-

 Business2 days ago
Country star Brantley Gilbert enters growing non-alcoholic beer market
-

 Business4 hours ago
Australian shares drop as Iran war enters third week
-

 Crypto World6 days ago
Will Chainlink price reclaim $10 amid volatility squeeze?
-

 Sports5 days ago
PWHL, Senators discussing plan to keep Charge in Ottawa

