
Crypto World
Spotting Market Momentum: 5 Popular Momentum Indicators
Momentum indicators are important tools for traders seeking to evaluate the strength and speed of price movements. These technical analysis instruments are used by traders to identify potential entry and exit points, confirm market signals, and filter market noise. In this article, we review five momentum indicators that remain widely used by traders to support them in their decision-making in volatile markets.
What Is a Momentum Indicator?
Momentum in technical analysis refers to the rate at which an asset’s price accelerates or decelerates. Understanding momentum may assist traders in identifying potential trend continuations or reversals.
A momentum indicator is a technical analysis tool that measures how quickly and strongly an asset’s price is moving. Instead of showing the direction of the trend, it highlights the strength behind price movements. By comparing price changes over a set period, momentum indicators can help traders see if a market is gaining or losing strength. This information is often used to spot potential overbought or oversold conditions and to identify possible entry or exit points.
A stock momentum indicator like the Relative Strength Index (RSI), for instance, may indicate that stocks are currently bought or sold too heavily and their price is due for a reversal.
The Significance of Momentum Technical Indicators
Momentum indicators do not focus on the direction of the price movement, but rather on the strength behind it. They’re able to quantify and represent hidden clues about the future market direction. By learning to read momentum indicators, traders can develop trading strategies and identify conditions for new trades.
Momentum tools produce a range of signals that offer traders an edge over the markets. Let’s take a look at some of the most common momentum signals, including overbought/oversold conditions, divergences, and crossovers.
Overbought and Oversold Conditions

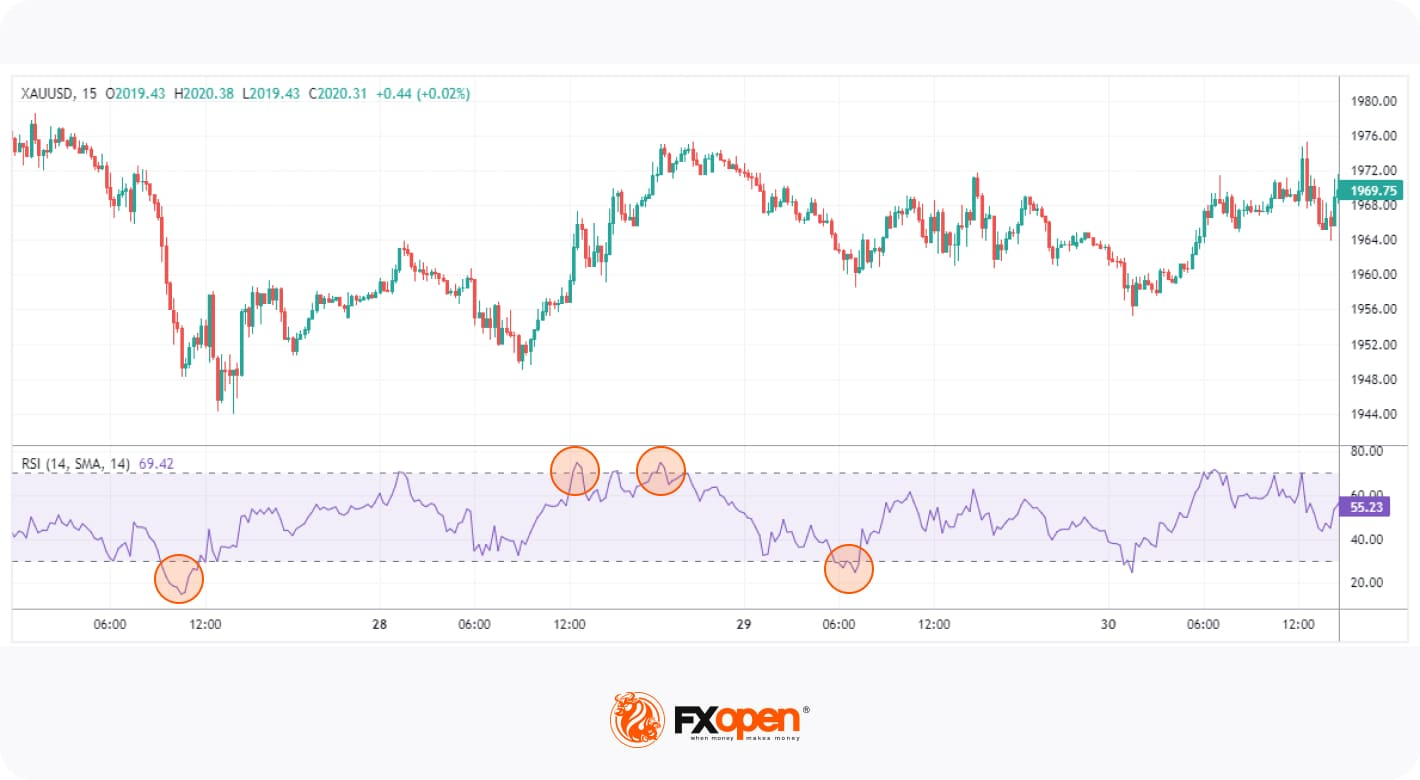
These signals indicate when an asset’s price has moved too far in one direction without sufficient support from fundamental or technical factors and is likely to reverse. For example, RSI generates overbought signals when the reading rises above 70 and signals oversold conditions when the reading falls below 30.
Divergence
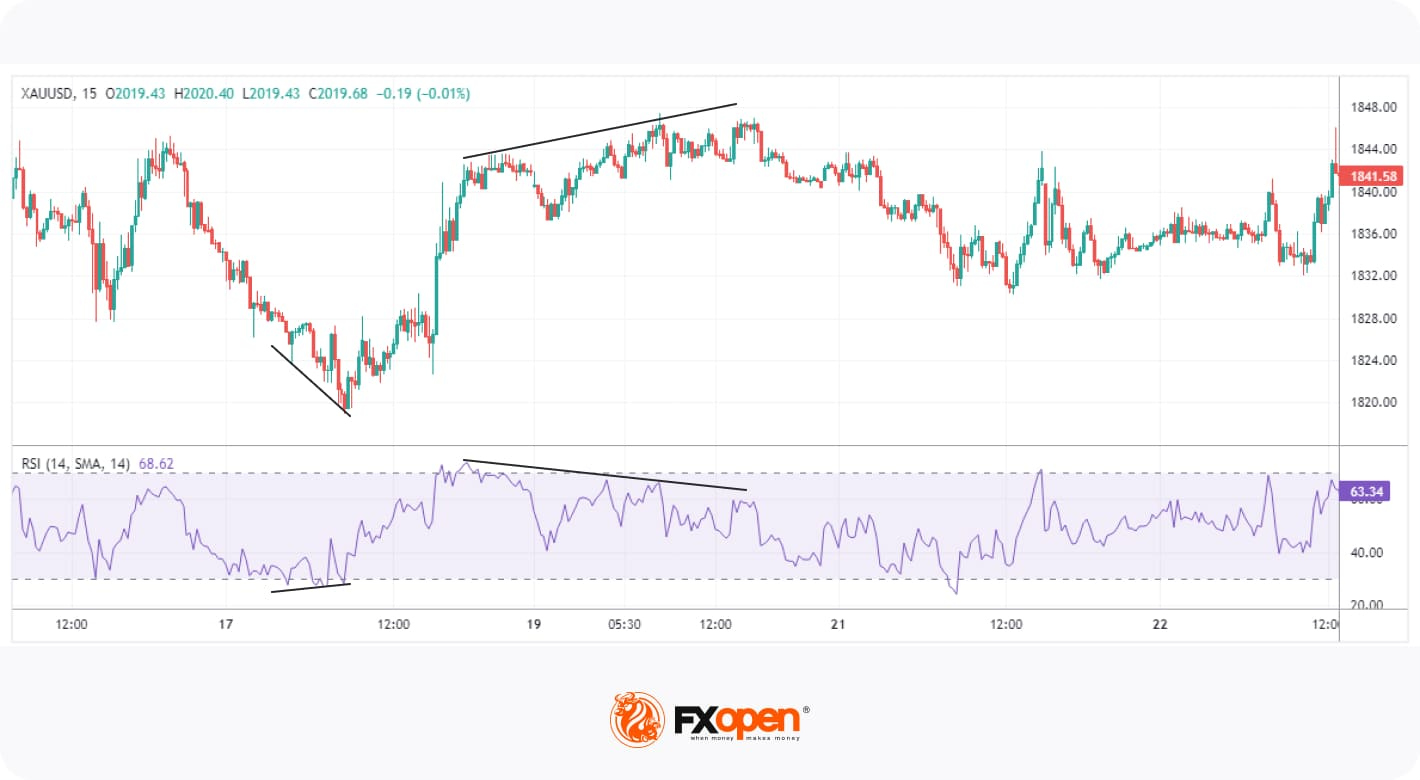
Divergence occurs when the price of an asset moves in the opposite direction of the indicator, suggesting an upcoming reversal. For instance, when the price is making higher highs, but RSI is making lower highs, this indicates a bearish divergence that increases the likelihood of a downward move.
Crossover

These signals are generated when the indicator’s lines cross each other or a certain threshold. A common example is the MACD, where traders look for crossovers between the fast MACD line and the slower signal line to spot potential entry and exit points.
List of Five Momentum Indicators for Technical Analysis
Now that we understand the types of signals that momentum tools produce, let’s break down five of the most popular with a momentum indicators list. If you’d like to experiment with them yourself, you’ll find each tool in the TickTrader trading platform.
1. Relative Strength Index (RSI)
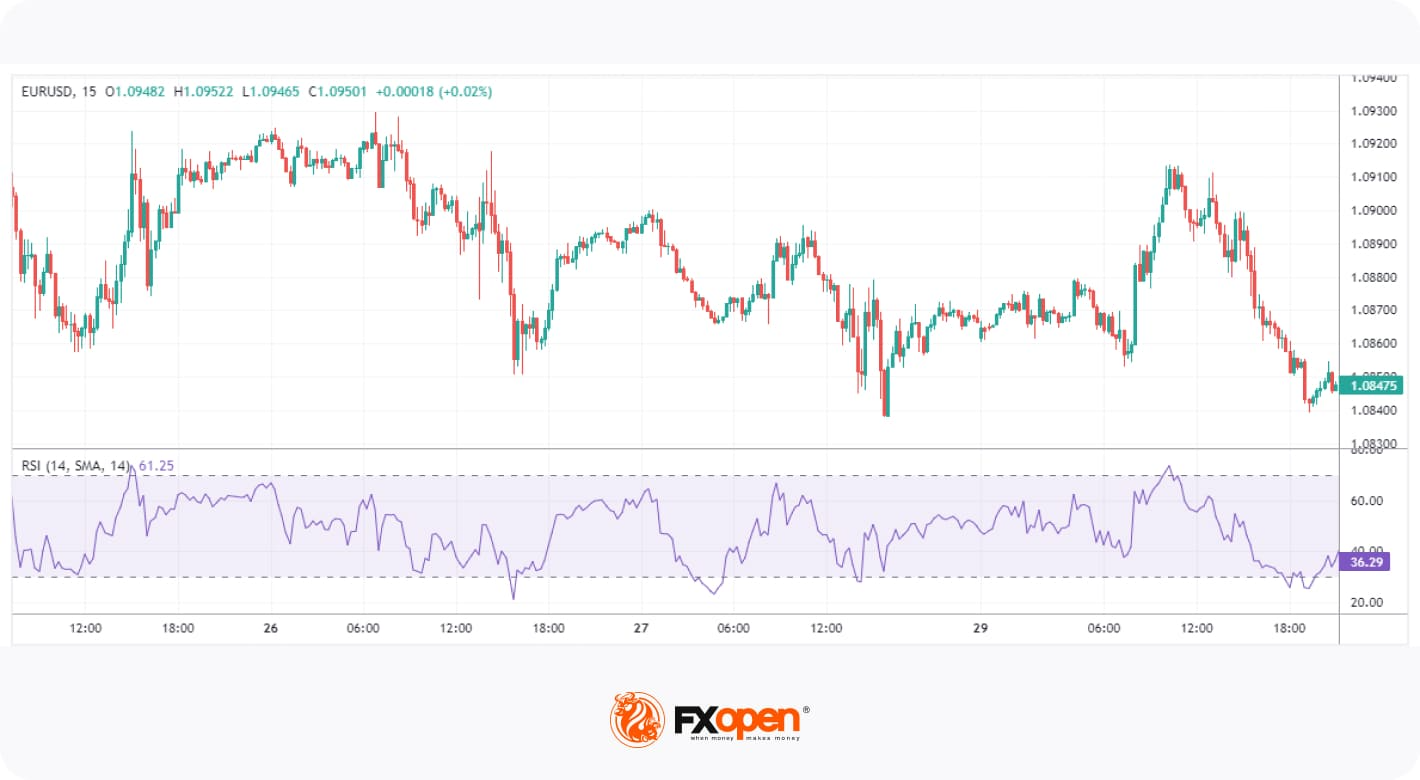
The RSI is one of the most popular and well-documented momentum indicators. It measures the speed and change of price movements by comparing the average gain to the average loss over a specified period, usually 14.
RSI is an oscillator, moving between 0 and 100. Values above 70 reflect overbought conditions, while values below 30 indicate oversold conditions. When the RSI moves out of overbought or oversold territory, many traders interpret this as a reversal confirmation. Sustained movements above or below the midpoint (50) can also be used to confirm a bullish or bearish trend, respectively. Moreover, traders look for divergence between the RSI and price to identify weakening trends and possible reversals.
2. Average Directional Index (ADX)
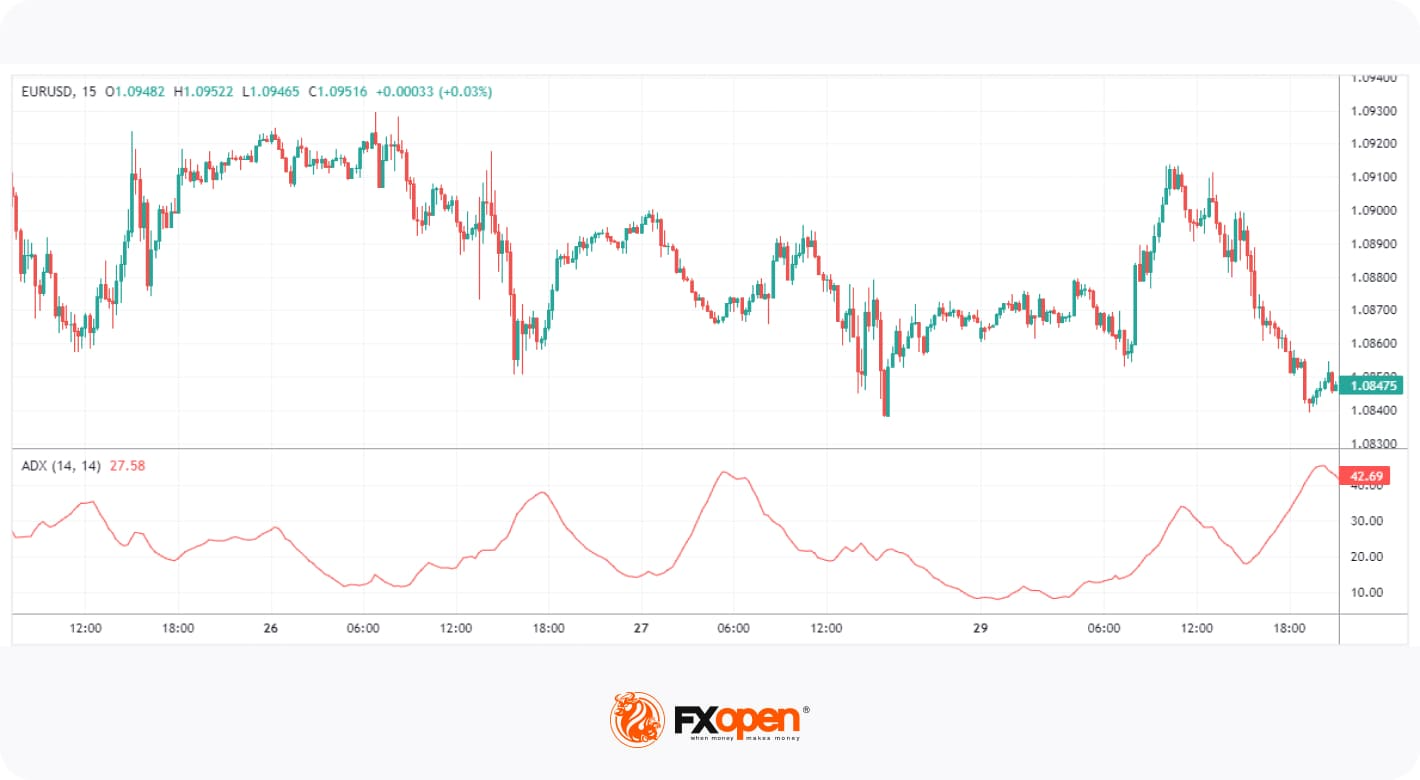
The ADX is a momentum indicator used to determine a trend’s strength. Unlike most other tools, its reading doesn’t move according to the direction of price action, i.e. it doesn’t move up if bullish or down when bearish. Instead, it ranges from 0 to 100, with values above 25 indicating a strong trend and below 25 suggesting a weak or non-trending market.
ADX is commonly used in combination with other tools, as it simply confirms the trendiness of a market. For example, traders might use a leading indicator like RSI to anticipate bullishness and confirm the trend when ADX crosses over 25.
3. Commodity Channel Index (CCI)
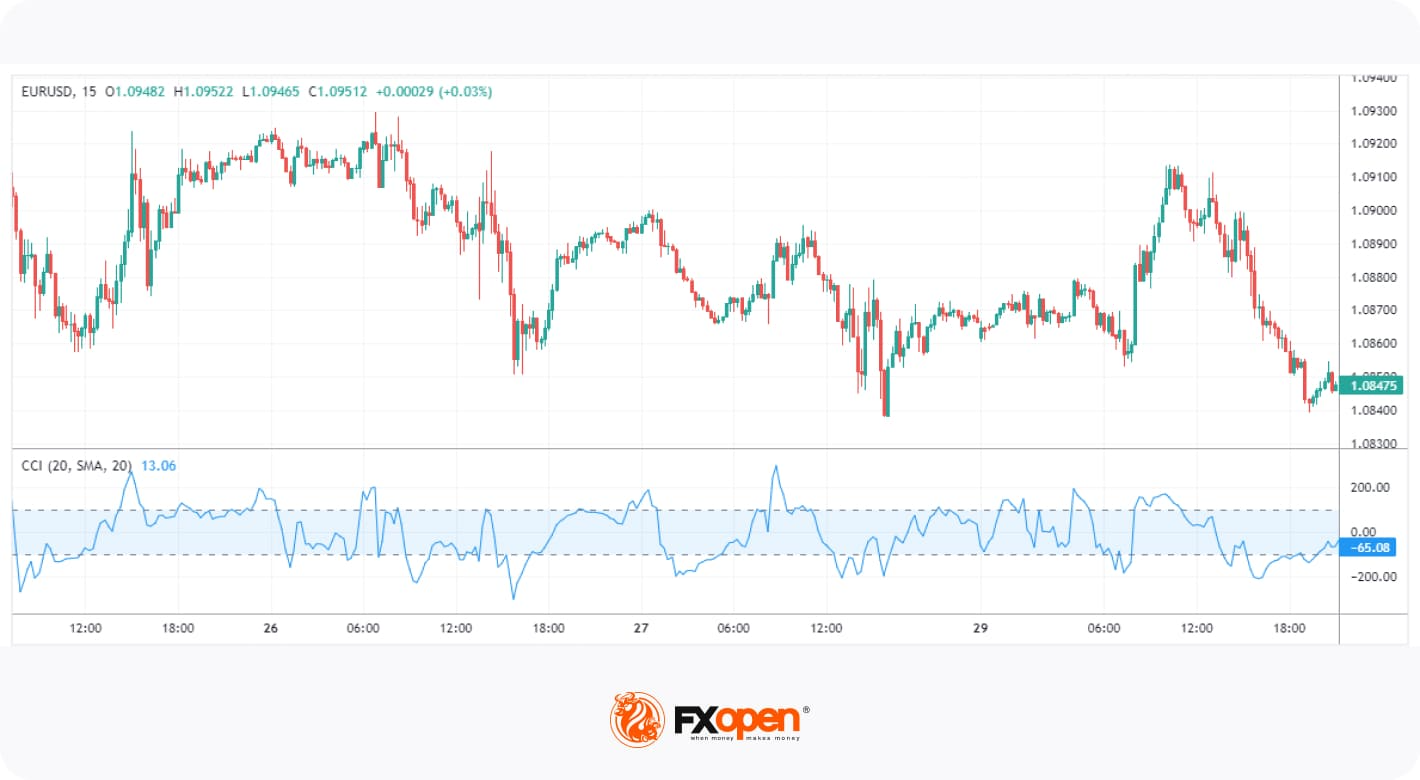
The CCI is a versatile momentum indicator. It uses a constant in its calculation to ensure that 75% of values fall between +/- 100, with moves outside of the range generally indicating a trend breakout or continuation. It can also show extreme overbought or oversold conditions when its value exceeds +/- 200.
The CCI requires a more nuanced approach than other tools and is typically used to confirm a trader’s directional bias. For instance, a visually identifiable bullish trend can be confirmed by looking at the CCI. If its value is skewed toward 100+, traders can be confident in their observation. When the market cools off, CCI will fall below 100. Traders can then confirm a pullback entry with a move back into the +/- 100 range.
4. Moving Average Convergence Divergence (MACD)
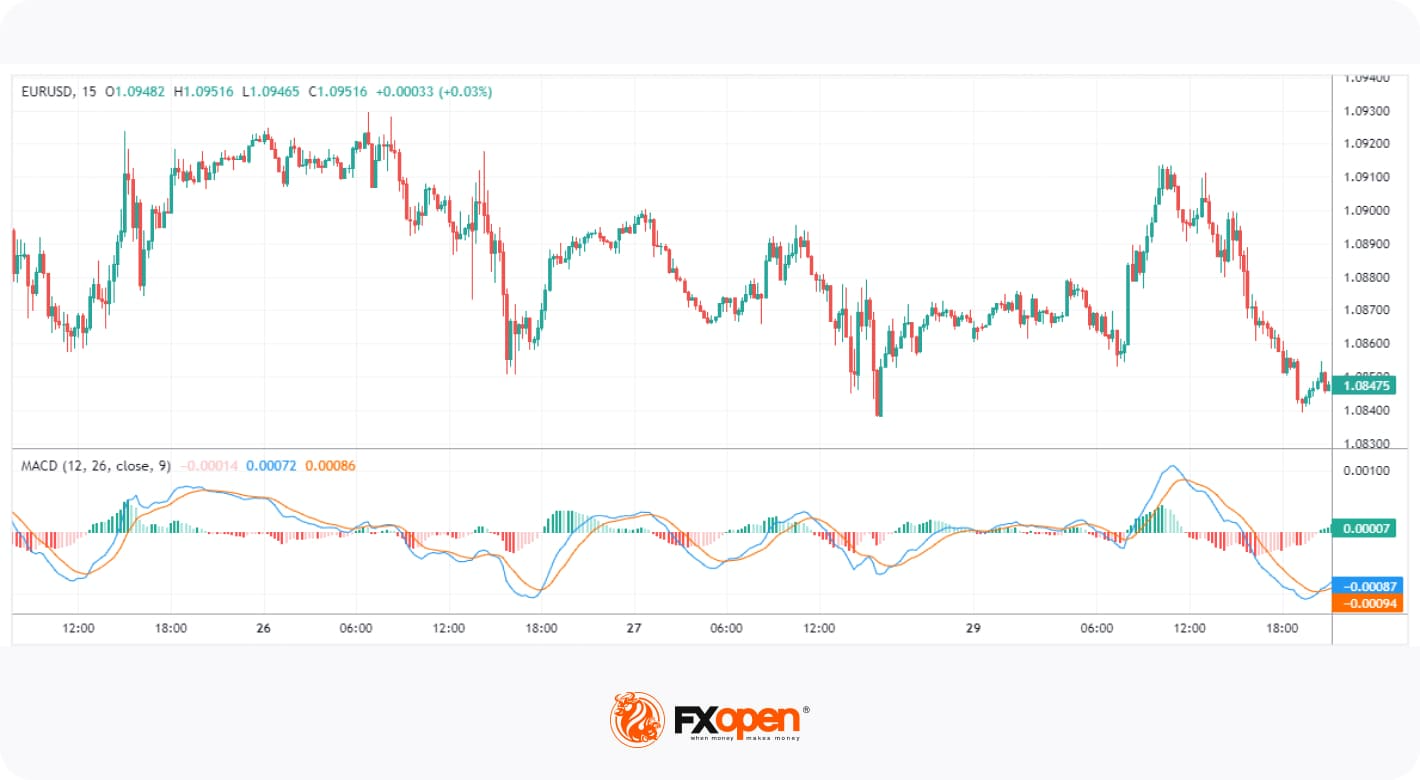
The MACD is a highly regarded trend-following momentum indicator that shows the relationship between two moving averages of an asset’s price. It’s used in technical analysis to identify the relationship between two moving averages of a security’s price. The MACD reflects the trend’s strength, direction, and duration, as well as possible reversal points.
Traders use crossovers between the MACD and signal lines as potential entry and exit signals. Additionally, when the MACD histogram crosses above or below the zero line, it can indicate bullish or bearish momentum in the market. Lastly, it’s also possible to spot divergences between price and the indicator’s peaks and troughs, similar to how divergences are identified with RSI.
5. Momentum (Mom)
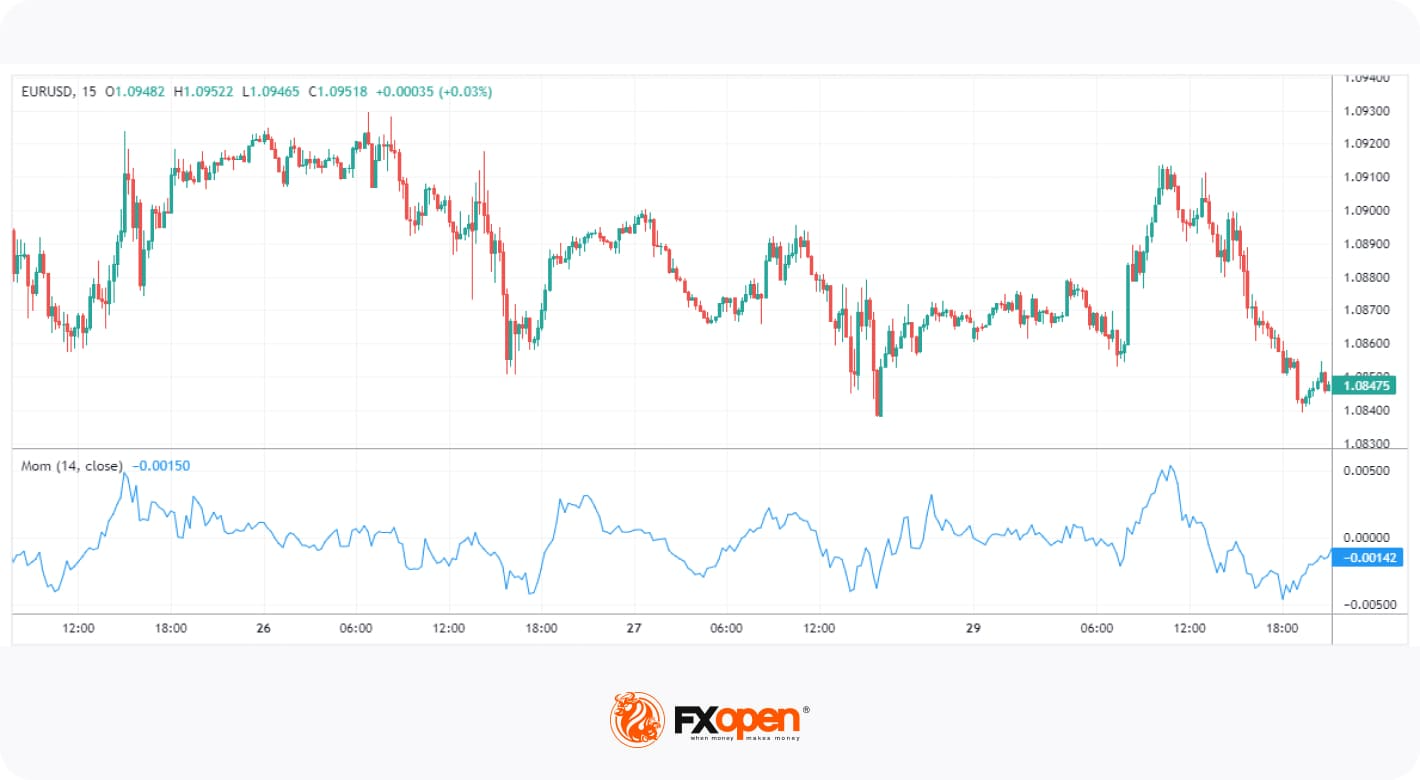
The Momentum indicator is considered a simple tool that measures the rate of change in an asset’s price over a specific period. The value of the Momentum depends on the market it’s applied to. For example, using the Momentum indicator in stocks will result in a fluctuating value typically between +/- 20, depending on the stock’s price. For forex pairs, its range may look more like +/- 0.02.
The common feature across all markets, however, is the zero line. Generally speaking, positive Momentum values indicate upward price movement, while negative values suggest downward movement. It can also show overbought and oversold conditions, but its lack of defined boundaries means this can be tricky. However, Momentum is especially useful for identifying divergences.
Advantages of Momentum Indicators
Momentum indicators are valuable tools in technical analysis, reflecting the strength and speed of price movements. They offer several advantages that may improve trading strategies:
- Identify Trends Early: Market momentum indicators can reveal potential shifts in trend direction, providing traders with additional context for evaluating entry and exit points.
- Objective Analysis: They provide quantifiable data, reducing reliance on subjective analysis and emotional decision-making.
- Spot Overbought and Oversold Conditions: Momentum tools show when an asset is overbought or oversold, signalling potential reversals and exit points.
- Confirm Trade Signals: Combining momentum indicators with other technical tools may improve trade signals, providing stronger confirmation for trading decisions.
- Adaptable Across Markets: They can be applied to various assets, including stocks, forex, and commodities, making them versatile tools for traders.
Things to Consider When Trading Momentum Indicators
While momentum indicators may be a helpful addition to any trader’s arsenal, there are a few things to be aware of:
- Trade with the Trend: Trends often last longer than you may think, and constantly looking for trend reversals will only end in frustration. Look for bullish signals during an uptrend and bearish signals in a downtrend.
- Use Multiple Indicators: Relying on a single tool can lead to false signals. Many traders combine a lagging indicator, like MACD, with a leading indicator, like RSI. Combining two or three tools may help confirm signals and improve trade accuracy.
- Beware of False Signals: Momentum indicators can sometimes generate false signals, especially in sideways or choppy markets. Being patient and waiting for confirmation before entering a trade is vital.
- Don’t Rely Too Heavily on Indicators: While momentum indicators may be helpful, relying solely on them without considering price action, market structure, or fundamental aspects can lead to poor trading decisions. Use these indicators alongside other tools for a momentum indicator strategy.
Final Thoughts
Momentum indicators play a critical role in technical analysis, offering traders valuable insights into the strength and direction of market movements. Tools such as RSI, MACD, CCI, ADX, and the Momentum Indicator are widely used to confirm trends, highlight overbought or oversold conditions, and improve entry and exit timing. While no single indicator should be used in isolation, combining these tools with solid risk management and broader market analysis can support traders in their trading decision-making.
If you want to test your strategy with the above-mentioned indicators, you may consider opening an FXOpen account, where you can trade over 700 markets with low costs. Good luck!
FAQ
How May Momentum Indicators Be Used?
Momentum indicators may be used to assess the speed and strength of price movements in a financial market. They can help traders identify potential overbought or oversold conditions, confirm trends, or signal possible reversals. By comparing the current price to previous price levels, momentum indicators provide insights into whether a market move is gaining or losing strength.
What Period is Set for a Momentum Indicator?
If we are talking about the Momentum indicator, the period depends on your trading style. For short-term traders, 7 and 10 periods are common, while long-term traders may prefer 14 and 21 periods. Testing various periods based on asset volatility can improve results.
What Is the Most Popular Momentum Indicator for Scalping?
There is no single most popular momentum indicator for scalping but the Relative Strength Index (RSI) is often favoured by scalpers due to its ability to quickly identify overbought or oversold conditions. Its responsiveness is used by scalpers to make rapid decisions in fast-moving markets.
What Is the Difference Between Momentum and Trend Indicators?
Momentum trading indicators measure the speed of price changes, while trend indicators assess the direction and persistence of price movements. To put it simply, momentum focuses on strength, while trend indicators focus on the overall direction.
Is MACD a Momentum Indicator?
Yes, the Moving Average Convergence Divergence (MACD) is one of the most popular momentum indicators, especially in forex and stock trading. It may reveal changes in momentum and help identify potential trend reversals.
This article represents the opinion of the Companies operating under the FXOpen brand only. It is not to be construed as an offer, solicitation, or recommendation with respect to products and services provided by the Companies operating under the FXOpen brand, nor is it to be considered financial advice.

On-chain data shows that two early crypto investors purchased millions of dollars worth of ETH today, while Bitmine continued its weekly purchases.
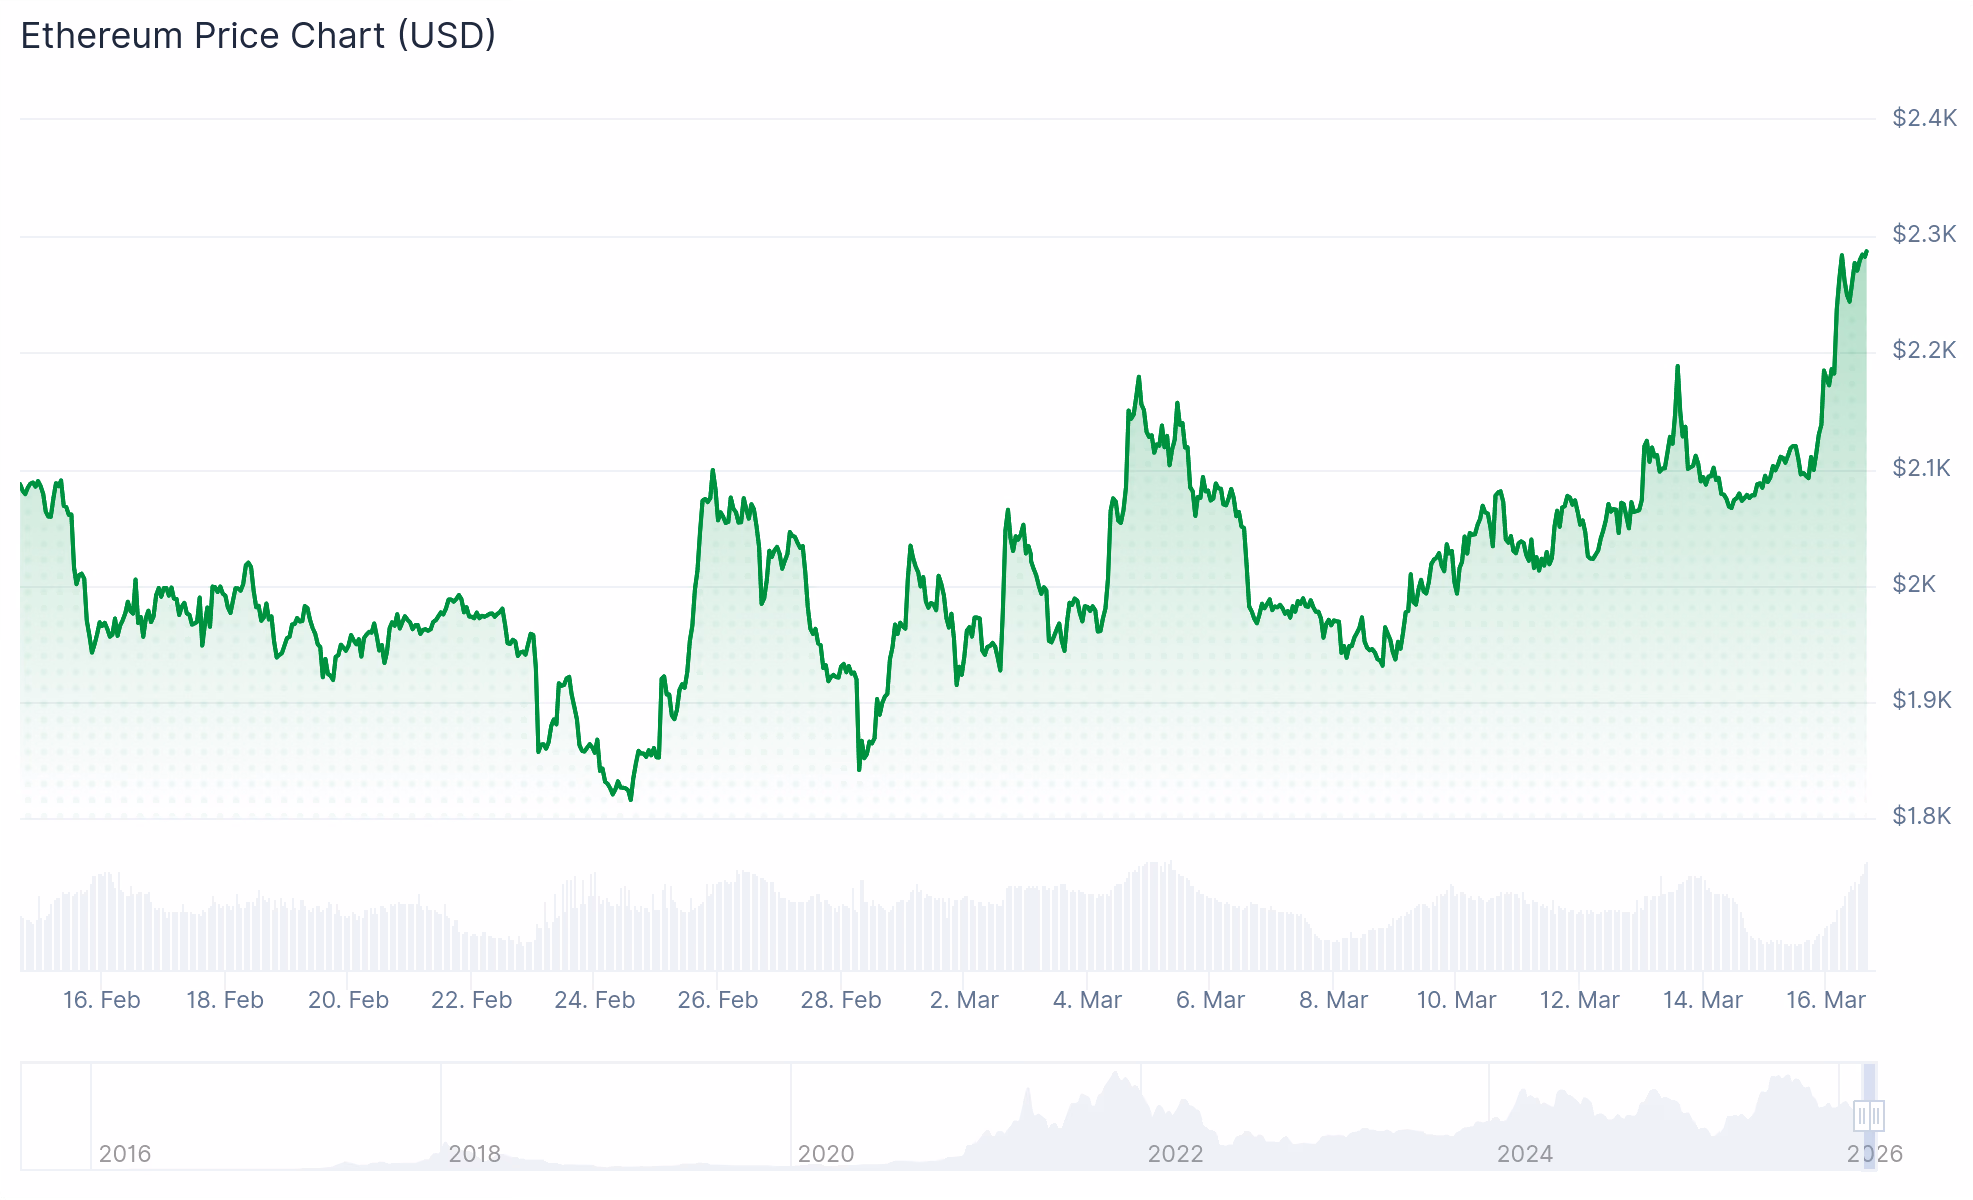
Ethereum (ETH) is outpacing other large-cap crypto assets today, March 16, gaining over 9% in the past 24 hours. The price surge comes against a backdrop of large ETH buys, including from two early crypto investors, on-chain data shows.
ETH briefly touched $2,300 today and is currently trading around $2,280, up 9% on the day. Bitcoin (BTC) is up 2.8% today, while the remaining top-20 large-caps are mostly seeing gains between 2-6%. After ETH, Layer 1 Cardano (ADA) is up the most, gaining about 8% today, while total market cap surged 3.4%.
While today’s rally pushed ETH to its highest price in a month, the asset is still down about 30% from its mid-January levels, when ETH was trading over $3,300, and over 50% below its all-time high near $5,000, which it hit last August.

The move has been accompanied by a flurry of high-profile accumulation. Erik Voorhees, the founder of ShapeShift and one of Bitcoin and crypto’s earliest and most vocal advocates, today purchased nearly $50 million worth of ETH via two separate transactions at an average price of $2,098 per token, Lookonchain reported, citing data from Arkham. The on-chain analytics firm noted that this is Voorhees’ first ETH purchase in two years.
Separately, Arkham also today flagged that pseudonymous early Ethereum participant 0xbilly — who was an active voice in governance forums in Ethereum’s early days — purchased more than $17 million worth of ETH for about $2,270 per coin.
Corporate accumulation, at least from the largest ETH holders, is also continuing. Today, Tom Lee’s Bitmine announced its latest ETH purchase — slightly higher than last week’s and well above its weekly average — continuing to double down on its target of holding 5% of the Ethereum supply, as The Defiant reported.
Meanwhile, 5,000 ETH of Bitmine’s latest buy (worth over $10 million) was purchased from the Ethereum Foundation itself in an over-the-counter sale over the weekend.
The surge comes at a moment of renewed discussion and interest in Ethereum’s roadmap. The Ethereum Foundation recently outlined its 2026 protocol priorities, with a focus on scalability, user experience, and security ahead of the anticipated Glamsterdam upgrade. More recently, on Friday, the Foundation published the EF Mandate, a part manifesto, part guide for the ecosystem and the EF that has sparked renewed debate.
This article was written with the assistance of AI workflows. All our stories are curated, edited and fact-checked by a human.


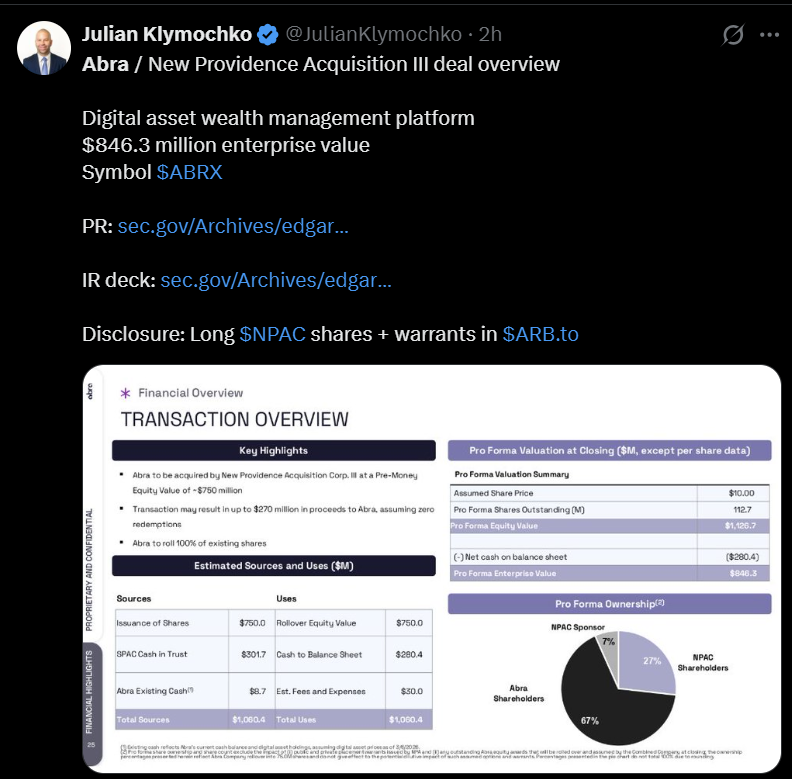
The deal values Abra at $750 million pre-money.
Digital asset wealth management platform Abra is heading to the public markets. Abra Financial Holdings announced today it has entered into a definitive business combination agreement with New Providence Acquisition Corp. III (Nasdaq: NPACU). The combined company is expected to list on Nasdaq under the ticker “ABRX.”
Founded in 2014, Abra offers institutions and high-net-worth clients a suite of crypto-native services, including segregated custody, trading, yield strategies, collateralized lending, and advisory, through its SEC-registered investment advisor.It recently launched USDAF, a yield-bearing Solana-native synthetic dollar, extending its reach into decentralized finance (DeFi).
The deal values Abra at $750 million pre-money, with existing backers — including Blockchain Capital and Pantera Capital — rolling 100% of their interests into the combined entity. The transaction could deliver up to $300 million in cash held in trust, subject to redemptions. Cantor Fitzgerald is acting as financial and capital markets advisor to Abra.
Abra previously faced some regulatory headwinds. The SEC filed charges against Abra’s parent entity, Plutus Lending, for failing to register its Abra Earn lending product and for operating as an unregistered investment company. The case was ultimately settled in August 2024, with Abra consenting to an injunction and agreeing to pay civil penalties without admitting or denying the allegations.
This article was written with the assistance of AI workflows. All our stories are curated, edited and fact-checked by a human.
Crypto World
South Korea fines Bithumb $24 million, orders 6-month partial suspension over AML violations


Bithumb, one of South Korea’s leading crypto exchanges, has been fined by the country’s anti–money laundering and counter-terrorism financing agency.
South Korea’s Financial Intelligence Unit (FIU) has slapped a 36.8 billion won ($24.6 million) fine and ordered a six-month partial suspension after finding millions of violations of the country’s anti-money laundering rules.
The sanctions stem from violations of the Act on Reporting and Using Specified Financial Transaction Information, the Financial Services Commission said, according to local media.
According to the FIU, Bithumb committed about 6.65 million violations. Around 3.55 million involved failures to carry out required customer identity verification, while 3.04 million were related to cases where the exchange failed to properly block transactions that should have been blocked.
The suspension targets services for newly registered users. Existing customers will still be able to trade and move funds on the platform, according to initial reports on these sanctions.
Regulators also issued personnel penalties. Bithumb’s chief executive received a reprimand warning, while the exchange’s reporting officer was suspended for six months.
The violations surfaced during on-site inspections of South Korea’s five largest crypto exchanges, Upbit, Bithumb, Coinone, Korbit and Gopax, conducted between 2024 and 2025.
The case comes as South Korean regulators tighten oversight of the crypto market. Last year, the FIU handed Dunamu, the operator of the country’s largest exchange, Upbit, a three-month partial suspension and a 35.2 billion won fine for compliance gaps. Korbit, a rival platform, faced a smaller penalty of 2.73 billion won, along with institutional warnings.
Bithumb, founded in 2014, ranks among the largest exchanges in South Korea by trading volume, according to CoinGecko data. The partial suspension comes just a month after Bithumb mistakenly distributed billions of dollars worth of bitcoin to users.
CoinDesk has reached out to Bithumb for comment, but hasn’t heard back at the time of writing.
Crypto World
PayPay (PAYP) Stock Surges 16% Following Nasdaq IPO Launch and Positive Analyst Coverage

Key Takeaways
- PayPay (PAYP) set its IPO price at $16 per ADS on March 11, coming in under the anticipated $17–$20 range, generating approximately $880 million in proceeds
- The stock launched on Nasdaq March 12 with an opening price roughly 19% higher than the offering price, establishing a company valuation near $12.7 billion
- PAYP closed Friday March 13 at $21.14, representing a 16.41% gain and pushing market capitalization toward $14.1 billion
- Macquarie launched coverage with an Outperform recommendation and $22.90 target, highlighting PayPay’s commanding 65% QR code market position and 72 million user base
- ARK Invest reportedly purchased PAYP shares during the initial surge, while CEO Ichiro Nakayama mentioned potential for Tokyo Stock Exchange dual-listing
PayPay Corporation launched a successful Nasdaq debut last week, trading significantly above its initial public offering price and attracting early analyst attention within its first few trading days. The Japanese mobile payment platform, backed by SoftBank, has officially joined the public markets, capturing considerable Wall Street interest.
PayPay Corporation American Depository Shares, PAYP
The company established its IPO pricing at $16 per ADS on March 11 — a figure that fell short of the marketed $17 to $20 range. This cautious pricing strategy reflected broader market uncertainty stemming from international geopolitical developments. The offering generated approximately $880 million through the sale of roughly 55 million ADSs. Lead underwriters included Goldman Sachs, J.P. Morgan, Mizuho, and Morgan Stanley.
When trading commenced on March 12, PAYP launched approximately 19% above its offering price. The momentum continued building throughout the session.
By the closing bell on Friday March 13, PAYP settled at $21.14 — representing a $2.98 increase, or 16.41% daily gain. Trading volume exceeded 14 million ADSs during the session. The stock reached an intraday peak of $21.98 while touching a low of $19.81.
This Friday closing price elevated PayPay’s market capitalization to approximately $14.1 billion, rising from the roughly $12.7 billion valuation established at the IPO opening. Extended-hours trading showed modest retreat to around $20.80.
The public offering represents the most significant U.S. IPO from a Japanese enterprise in ten years. It additionally marks SoftBank’s first substantial U.S. public market debut of a majority-controlled portfolio investment since Arm’s 2023 listing.
Macquarie Launches Coverage with Bullish Stance
On March 16, Macquarie began coverage of PAYP with an Outperform designation and established a $22.90 price objective.
The investment firm highlighted PayPay’s commanding presence in Japan’s QR code payment ecosystem — controlling approximately 65% market share and serving roughly 72 million users, equivalent to about three-quarters of Japan’s smartphone-equipped population. QR code transactions account for one in five cashless payments across Japan.
Macquarie observed that PayPay is evolving beyond a simple payment wallet into a comprehensive digital financial services platform encompassing money transfers, savings products, lending solutions, and investment services. The platform currently serves around 16 million card holders, maintains 9.7 million bank accounts, and manages 1.54 million securities accounts.
Japan’s cashless payment adoption reached 42.8% in 2024. Government objectives target 65% penetration by 2030, while QR code payment adoption has expanded at a compound annual growth rate of approximately 75% from 2019 through 2024.
Macquarie projects PayPay’s revenue will achieve ¥456.5 billion in the fiscal year concluding March 2027, reflecting 21.6% year-over-year growth, while operating profit is expected to surge 73.6% to ¥135.1 billion.
Future Outlook for PAYP
CEO Ichiro Nakayama ceremonially opened Nasdaq trading on debut day. Subsequently, he has expressed receptiveness to potentially pursuing a dual listing on the Tokyo Stock Exchange.
ARK Invest was documented as having acquired PAYP shares during the early post-listing momentum — demonstrating institutional appetite for the stock.
PayPay is currently executing the integration of Line Pay operations, with complete merger completion scheduled for late March 2026.
For the twelve-month period ending December 31, 2025, PayPay’s payment division gross merchandise volume surpassed ¥15 trillion.


The US Secret Service, UK National Crime Agency, and Canadian authorities have partnered to disrupt fraudulent schemes related to crypto, raise awareness of scams, and recover stolen funds.
In a Monday notice, law enforcement agencies from the three countries — including Canada’s Ontario Provincial Police and the Ontario Securities Commission — said that they had launched “Operation Atlantic,” focusing on identifying people at risk of losing or those who had already lost crypto through “approval phishing” schemes.
“Approval phishing and investment scams cost victims millions in financial loss each year,” said Brent Daniels, deputy assistant director for the US Secret Service’s Office of Field Operations. The agencies said they hope to identify and disrupt these scams in near real-time.

According to blockchain analytics platform Chainalysis, approval phishing scams involve “the scammer trick[ing] the user into signing a malicious blockchain transaction that gives the scammer’s address approval to spend specific tokens inside the victim’s wallet, allowing the scammer to then drain the victim’s address of those tokens at will.”
According to the Ontario Securities Commission, Operation Atlantic built upon the commission’s Project Atlas. The operation was launched in 2024 by the Ontario Provincial Police with the US Secret Service and targeted crypto fraud networks.
The initiative will also work with the Royal Canadian Mounted Police, the City of London Police, the US Attorney’s Office for the District of Columbia and the UK’s Financial Conduct Authority (FCA).
Related: SEC drops case against BitClout founder with prejudice
Are different phishing scams on the rise?
Phishing scams usually involve different methods, seemingly from legitimate sources, that trick users into giving fraudsters access to their crypto wallets. According to crypto intelligence platform Nominis’ monthly report, phishing attacks increased sharply in February, but the amount stolen in crypto-related scams and exploits overall fell to $49 million from $385 million in January.
Chainalysis launched Operation Spincaster in 2024, targeting “approval phishing” scams, which it reported had resulted in $2.7 billion in crypto stolen between May 2021 and July 2024.
Magazine: All 21 million Bitcoin is at risk from quantum computers
Crypto World
Strategy’s STRC Raises $1.18B in One Week, Buying Seven Times Bitcoin’s Weekly Mined Supply

TLDR:
- Strategy purchased 22,337 BTC last week, surpassing seven times the total weekly mined supply of 3,150 coins.
- STRC recorded $2.2B in weekly trading volume, with a single day hitting $740M — rare for any fixed income product.
- The 11.5% STRC dividend is backed by over $2B cash and $55B in Bitcoin, giving investors yield with BTC exposure.
- At its current pace, STRC could raise $16B more in 2025, growing Strategy’s Bitcoin stack by nearly 30% without MSTR dilution.
STRC, Strategy’s preferred stock, has emerged as a powerful Bitcoin accumulation tool in the market. Last week, the instrument raised $1.18 billion for the company in a single week.
Strategy then used those proceeds to purchase 22,337 Bitcoin. That purchase exceeded seven times the weekly mined supply of 3,150 coins.
The scale of this activity is drawing growing attention across both traditional finance and the broader crypto space.
A Fixed Income Product Unlike Any Other
STRC did not exist eight months ago. Yet, it is now generating trading volumes that no other fixed income product can match.
Last week alone, it recorded $2.2 billion in weekly trading volume. On a single day, volume reached $740 million.
Typically, preferred equity products trade quietly in institutional accounts. However, STRC is behaving more like a high-demand growth asset.
Its 11.5% dividend makes it attractive to income-focused investors. At the same time, every dollar flowing into it converts directly into Bitcoin on Strategy’s balance sheet.
The dividend obligation remains fixed and backed by over $2 billion in cash. Strategy also holds over $55 billion worth of Bitcoin as further backing.
This structure gives investors a yield-bearing product with Bitcoin exposure underneath. That combination is rare in traditional financial markets.
As analyst Rob Wallace noted on X, STRC is “becoming the Bitcoin accumulation machine Saylor has always dreamed of.” The product is eliminating thousands of potential future Bitcoin holders by absorbing supply permanently.
Over the last two weeks, STRC raised $1.557 billion in total. That pace, even conservatively projected, could generate another $16 billion before the end of the year.
Strategy’s Supply Absorption and What It Means for Bitcoin
Strategy is currently purchasing Bitcoin at 2.66 times the global daily mining rate. This means the company is absorbing supply far faster than the network can produce new coins.
As that gap widens, available Bitcoin on the open market continues to shrink. The effect on long-term price dynamics is straightforward to trace.
If STRC raises $16 billion more this year as projected, Strategy’s Bitcoin stack would grow by nearly 30%. Notably, this growth would not dilute common MSTR shareholders.
That structure separates STRC from typical equity raises. It also makes the model more sustainable than critics suggest.
Some market observers have called Strategy’s model a Ponzi scheme. However, similar criticism followed Bitcoin at $1, $100, and again at $10,000.
The company’s approach depends on continued belief in Bitcoin’s long-term appreciation. The historical track record of Bitcoin’s price has so far supported that thesis.
The full scale of this machine has not yet been tested in a bull market. That moment, should it arrive, could reshape the pace of institutional Bitcoin accumulation further.


The U.S. Securities and Exchange Commission (SEC) ended its civil enforcement action against BitClout founder Nader Al-Naji and several related defendants, saying the decision was “based on the particular facts and circumstances of this case.”
In a joint stipulation filed March 12, the U.S. District Court for the Southern District of New York, the SEC and Al-Naji agreed to close the case, ending the litigation permanently and preventing the agency from refiling the same claims.
The SEC filed the lawsuit in July 2024, accusing Al-Naji of violating securities laws through the crypto-based social network project BitClout, later associated with the decentralized social blockchain DeSo. The SEC and Department of Justice charged Al-Naji with wire fraud and the sale of unregistered securities.
The charges claimed Al-Naji raised approximately $257 million from the sale of BitClout’s native token, BTCLT. They alleged he led investors to believe the money would be used to pay him and other BitClout employees, but instead spent “more than $7 million of investor funds on personal expenditures,” renting a mansion in Beverly Hills and “extravagant cash gifts.”
The case also named several “relief defendants,” including Buse Desticioğlu Al-Naji, Joumana Bahouth Al-Naji, Intangible Holdings LLC, Firestorm Media LLC, Viridian City LLC and the DeSo Foundation.
BitClout, which debuted in early 2021, was promoted as a proof-of-work blockchain designed to run and monetize social media, but quickly drew controversy. The platform automatically created profiles for prominent figures by scraping their accounts on X, then still known as Twitter, without consent, prompting a cease-and-desist letter from law firm Anderson Kill alleging violations of California’s right-of-publicity law, CoinDesk reported at the time.
Critics also argued the project’s “creator coin” model could incentivize reputational attacks, because users could profit from shorting someone’s token while damaging their reputation. Others raised concerns that users had to convert bitcoin into BitClout’s BTCLT token to use the platform without an easy way to convert it back, effectively locking funds on the site.
Despite the backlash, Al-Naji said the project attracted backing from major venture firms including Andreessen Horowitz, Sequoia, Coinbase Ventures and Digital Currency Group.
Al-Naji and the relief defendants waived any claims for attorney’s fees or damages related to the investigation or litigation.

TLDR
- Olema Pharmaceuticals (OLMA) shares surged 8.5% Monday following a Q4 earnings beat, posting a loss of $0.50 per share versus the anticipated $0.51.
- The biotech firm recorded a GAAP net loss of $46.1 million in Q4 2025 and $162.5 million across the full fiscal year.
- Stifel maintained its Buy rating with a $48 price target post-earnings, highlighting the company’s cash reserves lasting through mid-2028.
- Roche’s recent persevERA trial failure has sparked concerns regarding Olema’s OPERA-02 trial prospects.
- Wall Street consensus leans “Moderate Buy” with a mean price target of $41, while shares are down 41% YTD despite a 234% surge over the trailing year.
Olema Pharmaceuticals (OLMA) shares rallied 8.5% during Monday’s trading session following the release of fourth-quarter results that narrowly topped analyst projections. The stock peaked at $16.07 intraday before closing near $15.96, marking a solid gain from the previous close of $14.71.
Olema Pharmaceuticals, Inc., OLMA
The biopharmaceutical company disclosed a quarterly loss of $0.50 per share for Q4 2025, surpassing the Street’s expectation of a ($0.51) loss by one cent. While modest, the earnings surprise proved sufficient to drive investor enthusiasm.
For fiscal year 2025, Olema recorded a GAAP net loss totaling $162.5 million. The fourth quarter alone contributed $46.1 million to that deficit. Management opted not to host an earnings conference call following the release.
The stock’s performance has been nothing short of volatile. While OLMA has delivered a remarkable 234% return over the past twelve months, shares had tumbled 41% year-to-date prior to Monday’s rally.
Trading activity registered at 518,220 shares — significantly below the stock’s typical daily volume of approximately 1.6 million. The subdued volume suggests investors may be proceeding cautiously rather than piling in aggressively.
Analyst Reaction
Stifel responded swiftly to the earnings release, reaffirming its Buy rating and $48 price objective. The firm emphasized Olema’s financial runway stretching into mid-2028 as a significant advantage, providing adequate resources to reach several critical milestones ahead of palazestrant’s anticipated commercial debut.
Palazestrant is currently in development for second- and third-line metastatic breast cancer treatment, with market entry projected for 2027.
The broader analyst community maintains an optimistic outlook. Ten analysts have assigned Buy ratings to the stock, with one Hold and one Sell rating. The consensus price target stands at $41.00 — representing substantial upside from current trading levels.
Oppenheimer reaffirmed its Outperform rating on March 9th. JPMorgan lifted its price target from $29 to $32 last November, maintaining an Overweight stance. TD Cowen also holds a Buy rating, highlighting palazestrant’s superior exposure compared to rival therapies.
H.C. Wainwright reduced its target to $38 but retained its Buy rating in response to recent clinical trial developments.
The Roche Factor
Earlier this month, Roche announced that its persevERA clinical trial — assessing giredestrant combined with palbociclib in first-line metastatic breast cancer patients — failed to achieve statistical significance on its primary progression-free survival endpoint. While a favorable numerical trend was observed, the miss carries significant implications.
The persevERA outcome is considered a potential indicator for Olema’s own Phase 3 OPERA-02 trial, which is evaluating palazestrant. Topline results from OPERA-02 aren’t anticipated until 2028 at the earliest.
Stifel noted that Roche’s complete persevERA dataset will likely be unveiled at ASCO 2026, which could represent the next significant catalyst — or obstacle — for OLMA shares.
Regarding financial health, Olema maintains a stronger cash position than debt, boasting a current ratio of 8.03. The stock’s 50-day moving average currently sits at $24.18, considerably above Monday’s trading range.
Institutional ownership accounts for 91.78% of outstanding shares. Meanwhile, company insiders have been net sellers — divesting approximately 805,501 shares valued at roughly $23 million during the past three months.
The company currently commands a market capitalization of approximately $1.09 billion.
Digital asset wealth management platform Abra is going public through a reverse merger with special purpose acquisition company New Providence Acquisition Corp. III, marking the latest attempt by a crypto company to access public markets as investor interest in the sector rebounds.
On Monday, Abra announced that it had signed a definitive agreement with the blank-check company, or SPAC, valuing the crypto wealth manager at a pre-money equity valuation of $750 million.
Existing investors, including Pantera Capital, Blockchain Capital, RRE Ventures, Adams Street and SBI, will roll over their shares into the combined entity rather than cashing out.
Following the transaction, the new entity is expected to trade on the Nasdaq under the ticker symbol ABRX.
The public company will focus on crypto wealth management, offering custody and segregated accounts, yield strategies, crypto-backed loans, treasury management and trading services.

Founded in 2014 by CEO Bill Barhydt, Abra operates a digital asset platform serving high-net-worth investors, institutions and family offices. Its investment management arm, Abra Capital Management LP, is registered as an investment adviser with the US Securities and Exchange Commission, allowing it to provide portfolio management services to clients.
Abra has been restructuring its US operations following regulatory scrutiny. In 2024, the company reached a settlement with regulators in 25 US states over its Abra Earn crypto lending product, agreeing to return assets to investors and wind down the program for US clients. The settlement came as the company shifted its focus toward institutional and wealth management services.
Related: VC Roundup: Big money, few deals as crypto venture funding dries up
Crypto companies increasingly eye public markets
Abra is one of several digital asset companies seeking public listings as the industry looks to attract traditional capital.
In the past year, SPACs have drawn renewed interest as a route for crypto-related companies to enter the public markets, Jessica Groza, partner with Kohrman Jackson & Krantz, said. “While this model offers rapid liquidity, valuation flexibility, and access to institutional capital, it also carries substantial risks: volatility, structural dilution, opaque disclosures, technical complexity and regulatory uncertainty.”
Traditional initial public offerings (IPO) have been the preferred route for several big name crypto players over the past year, including stablecoin issuer Circle Internet Group, which listed on the New York Stock Exchange in June 2025, and crypto exchange Gemini, which debuted on Nasdaq later that year.

Blockchain-focused financial services company Figure Technologies and institutional trading platform Bullish also went public via IPO during the same period.
Other companies are reportedly exploring public offerings as well, including hardware wallet maker Ledger and institutional crypto custodian Copper.
Related: Crypto Biz: Circle stock defies Wall Street and digital asset selloff
Crypto World
Metaplanet Raises $531M Through Share Placement and Warrants to Accelerate Bitcoin Accumulation
TLDR:
- Metaplanet raised ~$255M instantly through a share placement priced at a 2% market premium.
- Fixed-strike warrants at a 10% premium could release an additional $276M if fully exercised.
- The warrant structure monetizes equity volatility instead of forcing large-scale shareholder dilution.
- All capital raised from the $531M structure is earmarked exclusively for Bitcoin accumulation.
Metaplanet, Japan’s publicly listed Bitcoin treasury company, has secured up to $531 million in new capital. The fundraise combines a direct share placement and a series of fixed-strike warrants.
New shares were sold to institutional investors at a 2% premium to market, raising approximately $255 million. The warrants, set at a 10% premium, add potential access to another $276 million upon exercise.
Together, the instruments position the company for a major push toward its 210,000 BTC target.
A Two-Part Capital Raise Designed Around Bitcoin
The share placement portion of the raise closed with global institutional investors at a 2% premium over market price.
Metaplanet brought in roughly $255 million through this transaction, representing the confirmed and immediate capital from the raise.
The involvement of international institutions in the placement reflects broader interest in Metaplanet’s Bitcoin strategy. This part of the deal stands on its own and delivers capital to the company’s treasury regardless of the warrants.
The second component consists of fixed-strike warrants issued to investors at a 10% premium above market. These warrants can generate an additional $276 million for Metaplanet if holders choose to exercise their rights.
Exercise is most likely when the company’s share price stays at or above the warrant’s strike price over time. Until then, Metaplanet holds the premium income collected from selling the warrants to investors.
CEO Simon Gerovich shared the details on social media, confirming the total potential capital at $531 million. He described the warrants as tools designed to monetize the company’s equity volatility. Every dollar from the full raise, if realized, is earmarked for Bitcoin accumulation.
Warrant Structure Captures Equity Volatility to Fund Bitcoin Purchases
The warrant mechanism is a key distinction between this raise and a plain secondary share offering. In a standard share sale, a company issues new equity and immediately dilutes existing shareholders in the process.
Metaplanet’s approach uses the market’s appetite for its stock as a funding source without forcing dilution at scale. This design gives the structure an edge in managing shareholder perception while raising capital.
Investors who buy the warrants are paying for the option to acquire shares at a locked-in price in the future. Metaplanet receives that payment upfront and channels it alongside the share placement proceeds.
Both pools of capital flow into Bitcoin purchases. Bitcoin was priced near $73,394 per coin at the time Gerovich made the announcement.
Metaplanet has become Japan’s most prominent corporate Bitcoin holder and is frequently compared to MicroStrategy.
The company has been building its Bitcoin reserve relentlessly, guided by a long-term target of 210,000 BTC. This raise brings it measurably closer to that goal.
The next thing to track is full warrant exercise, which would deliver the entire $531 million into Bitcoin. If the stock holds, all the capital flows directly into Bitcoin purchases.

How Chelsea signed a star team on hidden payments
Developer behind what will be Wales’ tallest building appetite for further investment
ETH Outperforms Large-Cap Crypto Assets as OGs Load Up


-
 Tech5 days ago
A 1,300-Pound NASA Spacecraft To Re-Enter Earth’s Atmosphere
-
Crypto World3 days ago
HYPE Token Enters Net Deflation as HyperCore Buybacks Outpace Staking Rewards
-

 Business6 days ago
ExxonMobil seeks to move corporate registration from New Jersey to Texas
-

 Fashion3 days ago
Weekend Open Thread: Addict Lip Glow
-

 Tech6 days ago
ChatGPT will now generate interactive visuals to help you with math and science concepts
-
Sports2 days ago
Why Duke and Michigan Are Dead Even Entering Selection Sunday
-

 NewsBeat5 days ago
Residents reaction as Shildon murder probe enters second day
-
 NewsBeat7 days ago
Pagazzi Lighting enters administration as 70 jobs lost and 11 stores close across Scotland
-

 Business5 days ago
Search Enters Sixth Week With New Leads in Tucson Abduction Case
-

 Business22 hours ago
Search for Savannah Guthrie’s Mother Enters Seventh Week with No Arrests
-

 Business2 days ago
US Airports Launch Donation Drives for Unpaid TSA Workers as Partial Government Shutdown Enters Fifth Week
-
Crypto World2 days ago
Coinbase and Bybit in Investment Talks: Could Bybit Finally Enter the US Crypto Market?
-

 NewsBeat5 days ago
I Entered The Manosphere. Nothing Could Prepare Me For What I Found.
-

 Business7 days ago
Search Enters 39th Day with FBI Tip Line Developments and No Major Breakthroughs
-

 Business2 days ago
Country star Brantley Gilbert enters growing non-alcoholic beer market
-

 Business7 hours ago
Australian shares drop as Iran war enters third week
-

 Crypto World6 days ago
Will Chainlink price reclaim $10 amid volatility squeeze?
-

 Sports5 days ago
PWHL, Senators discussing plan to keep Charge in Ottawa
-

 Crypto World7 hours ago
Crypto Lender BlockFills Enters Chapter 11 with Up to $500M in Liabilities
-

 Sports3 days ago
College Basketball Best Bets: Conference Tournament Semifinal Picks


You must be logged in to post a comment Login