
Crypto World
T. Rowe Price, a $1.8 Trillion asset manager, is ready to put dogecoin (DOGE) and shiba inu (SHIB) in its new crypto ETF


T. Rowe Price has filed to hold a broad set of digital assets in its new exchange-traded fund (ETF), including bitcoin, ether, dogecoin, and shiba inu.
The asset manager, which has $1.8 trillion in assets under management, filed an amended S-1 registration statement with the U.S. Securities and Exchange Commission (SEC), offering new details about its planned Price Active Crypto ETF, a fund designed to give investors actively managed exposure to digital assets.
The updated filing, submitted Monday, expands on the company’s original October application and outlines the cryptocurrencies the fund may invest in, along with details on custody, trading structure, and potential staking activity.
According to the document, the ETF could hold several digital assets, including bitcoin , ether (ETH), solana (SOL), XRP (XRP), , avalanche (AVAX), , , , hedera (HBAR), , chainlink , stellar lumen (XLM), shiba inu (SHIB), and .
Despite that wide universe, the fund will not hold all of those assets at once. Under normal circumstances, the ETF plans to maintain between five and fifteen crypto assets at a time, using an active management strategy rather than tracking a single token or passively following a benchmark. The portfolio will be rebalanced using quantitative models that incorporate fundamentals, valuation, and market momentum, with the goal of outperforming the FTSE US Listed Crypto Index, the filing said.
The amended filing also confirmed that Anchorage Digital Bank N.A. will serve as the fund’s crypto asset custodian, responsible for safeguarding the digital tokens held by the ETF.
For now, the fund will use a cash subscription and redemption model, meaning investors would create or redeem ETF shares using cash rather than transferring cryptocurrency directly. The filing notes that the structure could evolve to allow in-kind transactions in the future, a model some crypto ETFs use to exchange shares for the underlying digital assets.
Another notable addition in the filing is the possibility that the fund could participate in staking, a process used by some blockchains where token holders lock up assets to help secure the network in exchange for rewards.
T. Rowe Price said staking could be pursued in the future depending on risk considerations, tax treatment and regulatory guidance.
The filing marks another step by the 87-year-old investment firm, which is one of the top 25 asset management firms, toward entering the digital asset market.
If approved, the product would join a growing list of crypto investment vehicles designed to give investors exposure to the sector through traditional brokerage accounts.
The fund’s active approach could set it apart from the wave of spot bitcoin ETFs launched in the U.S. in 2024, allowing managers more flexibility to shift holdings as crypto markets evolve.


Trump says Iran war oil spike will ‘drop like a rolling stone’ once fighting ends, even as crude stays above $100 and crypto trades through the turmoil.
Summary
- Trump dismisses Iran war oil spike as budget “negligible” while crude trades above $100.
- He signals more strikes are possible even as he claims to spare key Iranian oil infrastructure.
- Bitcoin and Ethereum rally, reinforcing the “digital macro hedge” narrative despite still behaving like high‑beta risk assets.
Trump is again trying to sell markets on the idea that the Iran war–driven oil spike is temporary, even as crude trades comfortably above the three‑digit threshold. In new comments flagged by Jinshi Finance, he told PBS reporters the US is “doing very well” on Iran, calling the budget impact of the conflict “negligible” because Tehran is “involved in terrorism.” He insisted that “once the war is over, oil prices will drop like a rolling stone,” echoing earlier statements that the surge in crude is a “small price to pay” for dismantling Iran’s nuclear program.
Trump also claimed he has deliberately held back from targeting key civilian energy infrastructure, saying he “left a lot of infrastructure in Tehran” and could destroy the country’s power plants “in an hour” but is trying to avoid a years‑long reconstruction process and deeper social trauma. He added that the US has kept a “100 yards” buffer around “everything related to oil facilities,” and specifically cited Kharg Island, a major Iranian export hub, saying he chose not to blow up its pipelines because “it would take years to connect them.” At the same time, he warned he would still “strike again,” signalling that escalation risk remains firmly on the table.
Those comments follow days of market turmoil as Iran‑related supply fears pushed benchmark crude above 100 per barrel and forced insurers to reprice risk in and around the Strait of Hormuz. Trump has repeatedly framed the situation as a trade‑off, arguing that short‑term pain at the pump is acceptable if it neutralizes Iran’s ability to threaten global shipping and regional stability. For now, that narrative appears to be holding with parts of his domestic base, but it does little to change the underlying reality for refiners, airlines, or import‑dependent economies that are now exposed to higher input costs and tighter margins.
Crypto markets, by contrast, are digesting the conflict with relative composure. Bitcoin (BTC) is changing hands near $73,800, up roughly 5.8% over the last 24 hours, with a 24‑hour range between about $69,460 and $73,770 and turnover above $55 billion. Ethereum trades around $2,200, higher by roughly 6.8% on the day, after swinging between about $2,042 and $2,200 in the same period. That mix of elevated volatility and net gains has reinforced the “digital macro hedge” narrative some funds are leaning into, even as skeptics point out that BTC and ETH continue to trade like high‑beta risk assets whenever energy, rates, or war headlines surprise.


The post Leading AI Claude Predicts the Price of XRP, Bitcoin and Ethereum by The End of 2026 appeared first on Cryptonews.
Crypto World
Bitcoin, Ethereum outpace gold as ETF demand and corporate treasuries tighten BTC supply


Institutional spot ETF inflows and aggressive treasury buying are reinforcing Bitcoin’s “digital reserve” status while Ethereum grinds higher despite a bid for traditional safe havens.
Summary
- Institutional spot ETF inflows and balance-sheet buying are reinforcing Bitcoin’s role as a digital reserve while Ethereum grinds higher.
- MicroStrategy-style treasuries are concentrating a meaningful slice of free-floating BTC and acting like a quasi-central bank balance sheet.
- Gold ETFs see outflows as BTC and ETH post stronger year-to-date gains than bullion and broad equities despite the Iran conflict and higher oil.
Bitcoin (BTC) and Ethereum (ETH) are quietly beating gold and global equities again, with institutional flows doing most of the heavy lifting. A recent note argues that BTC’s resilience through the Iran conflict underscores a structural shift in ownership, with spot ETFs and balance‑sheet buyers now dominating the float. Analysts quoted in the report say Bitcoin and Ethereum have outperformed gold and broad stock indices this year, even as geopolitical risk and higher oil prices would typically favor bullion.
The same commentary highlights one listed software company, widely understood to be MicroStrategy, as acting like the “last central bank of Bitcoin.” According to Jinshi’s summary, the firm has added 22,337 BTC at an average price near $70,194, taking its total stash to 761,068 BTC with a blended cost basis around $75,696. That is functionally a monetary reserve strategy rather than a conventional treasury allocation, and it concentrates a non‑trivial share of free‑floating supply inside a single corporate vehicle.
At the same time, spot Bitcoin ETFs have seen roughly $2.1 billion in net inflows over the past three weeks, equal to about 6.1% of new available supply, even as retail investors have been net sellers. Jinshi’s recap notes that around 60% of outstanding BTC has not moved on‑chain for a year, a classic sign of long‑term holder conviction and a constraint on tradable float. That lock‑up effect is part of why each marginal dollar into a spot product, or a corporate treasury like MicroStrategy’s, can have an outsized impact on price compared with prior cycles.
Crypto markets are reflecting that dynamic in real time. Bitcoin is trading near $73,800, up about 5.8% over the last 24 hours, after moving between roughly $69,460 and $73,770 on volume above $55 billion. Ethereum sits around $2,201, higher by roughly 6.8% on the day, with a 24‑hour range between about $2,042 and $2,200 and turnover close to $27.8 billion. Those moves come as gold ETF products continue to leak assets, with one recent data set showing multi‑billion‑dollar outflows from the yellow metal even as Bitcoin funds attracted fresh capital after the Iran shock.


Lido’s new IDVTC design lets verified solo stakers form DVT clusters, slashing collateral needs while hardening Ethereum validator risk and sustaining staking yields.
Summary
- IDVTC groups four verified community stakers into one DVT-backed validator cluster, reducing single-operator failure risk.
- Lower collateral becomes viable as DVT makes slashing and downtime tail events instead of structural threats.
- Launch with CSM v3 in Q2–Q3 2026 positions Lido against rival restaking and LST platforms on resilience instead of raw TVL.
Lido’s community staking module is about to stop pretending this is still a game for whales only. A new proposal to introduce an “Identified DVT Cluster” (IDVTC) operator type would let verified independent stakers pool into distributed validator clusters, cutting collateral requirements while hardening the protocol’s weakest link: operational risk.
Under the plan, each IDVTC cluster consists of four independent community stakers, all running validators via Obol or SSV with keys created through distributed key generation (DKG). In practice, that means no single operator can take a validator down, mis‑configure a client, or disappear without the rest of the cluster absorbing the shock. Distributed validator technology (DVT) spreads duties and key shares across multiple nodes, so slashing and downtime events become outliers instead of structural risk.
Because the risk profile improves, Lido can justify lowering collateral requirements for these operators. That is the capital-efficiency play: you move from over‑collateralized, quasi‑professional setups to leaner independent operators whose main constraint is competence, not balance sheet size. For Lido, this broadens the operator base without opening the door to pure anon fly‑by‑night nodes, since IDVTC membership is restricted to verified Independent Community Stakers (ICS) who pass onboarding checks.
Timing matters. The IDVTC feature is targeted for launch with CSM v3 in Q2–Q3 2026, squarely into the next phase of Ethereum’s staking cycle and a more competitive liquid staking market. Restaking, AVSs and competing LSTs are already bidding for the same underlying validator set. Bring down collateral, keep slashing risk contained, and you have a better story for decentralization and yield sustainability than “more TVL, same handful of operators.”
If executed, IDVTC pushes Lido closer to a model where independent stakers look more like a distributed credit book: risk‑tiered, clustered, and modular. For investors, the signal is simple: Lido is trying to buy resilience and decentralization with better engineering instead of higher issuance. In a market where basis trades and ETF flows are already compressing staking spreads, that is the only credible way to keep the yield machine running without blowing up the tail risk.
Key points:
-
Sellers will attempt to halt the recovery at $74,508, but if buyers bulldoze their way through, the rally may reach $84,000.
-
Select major altcoins have risen above their overhead resistance levels, signaling solid demand at lower levels.
Bitcoin (BTC) rallied to $74,508 on Monday, a level that is a key near-term resistance. Crypto sentiment platform Santiment said in a recent report that wallets holding between 10 and 10,000 BTC have started accumulating, which in the past was a bullish sign.
US spot BTC exchange-traded funds (ETFs) have also attracted investors, recording five straight days of inflows last week. Bernstein said in a Monday research note shared with Cointelegraph that sustained inflows into BTC ETFs and steady corporate buying by companies such as Strategy have strengthened BTC’s long-term holder base, contributing to a more stable market structure during periods of stress.

BTC is showing signs of a trend reversal, but the bears are unlikely to give up easily. Higher levels are likely to attract sellers who will attempt to trap the aggressive bulls. Material Indicators cofounder Keith Alan said in a video analysis that BTC is still in a bear market, and the price may retest the support near $60,000.
Could buyers sustain BTC and major altcoins above their resistance levels? Let’s analyze the charts of the top 10 cryptocurrencies to find out.
S&P 500 Index price prediction
The S&P 500 Index (SPX) turned down from the 20-day exponential moving average (6,799) on Tuesday, indicating a negative sentiment.

The index may reach the 6,550 level, which is a crucial level to watch out for. If the price rebounds off the 6,550 level with force, the index may reach the 20-day EMA, where the bears are expected to step in. If the price turns down sharply from the 20-day EMA, the likelihood of a break below the 6,550 level increases. The correction may then deepen to the 6,350 level.
On the contrary, a close above the moving averages suggests that the index may remain inside the 6,550 to 7,002 range for a while longer.
US Dollar Index price prediction
The US Dollar Index (DXY) reached the 100.54 resistance on Friday, which is a critical level to watch out for.

The upsloping 20-day EMA (98.76) and the RSI near the overbought zone suggest that the path of least resistance is to the upside. If buyers thrust the price above the 100.54 level, the index might start a new uptrend to the 102 level and later to the 103.54 level.
Contrary to this assumption, if the price turns down sharply from the current level and breaks below the moving averages, it suggests that the index may remain inside the 95.50 to 100.54 range for some more time.
Bitcoin price prediction
BTC continued its upward march and reached the $74,508 resistance, where the bears are expected to mount a strong defense.

The 20-day EMA ($70,028) has started to turn up, and the RSI is in the positive territory, indicating that the buyers are attempting to take charge. A close above the $74,508 level will complete a bullish ascending triangle pattern, opening the gates for a rally to $84,000. Such a move suggests that the downtrend may be over.
Sellers will have to pull the BTC price below the moving averages to weaken the bulls. The BTC/USDT pair may then slump to the support line. A close below the support line tilts the advantage back in favor of the bears.
Ether price prediction
Ether’s (ETH) consolidation between $1,750 and $2,111 resolved to the upside with a breakout on Sunday.

The moving averages are on the verge of a bullish crossover, and the RSI is in the positive zone, indicating that buyers are back in the game. The ETH price may rally to $2,600 and then to $3,450. Such a move suggests that the ETH/USDT pair may have bottomed out at $1,747.
The 20-day EMA ($2,072) is the vital support to watch out for on the downside. A close below the 20-day EMA signals that the bears are active at higher levels. The pair may then tumble to $1,916.
BNB price prediction
BNB (BNB) closed above the $670 resistance on Sunday, but the bulls are struggling to sustain the higher levels.

The 20-day EMA ($646) is the critical support to watch out for on the downside. If the price bounces off the 20-day EMA with strength, the BNB/USDT pair may rally to $730 and subsequently to $790.
This positive view will be invalidated in the near term if the BNB price continues lower and breaks below the 20-day EMA. That may keep the pair range-bound between $570 and $670 for a while longer.
XRP price prediction
XRP (XRP) has risen above the 50-day simple moving average ($1.46), indicating sustained buying by the bulls.

If the XRP price closes above the 50-day SMA, the next stop is likely to be the breakdown level of $1.61. If the price turns down from $1.61 but finds support at the 20-day EMA ($1.41), it suggests a bullish sentiment. The XRP/USDT pair may then climb to the downtrend line.
On the contrary, if the price turns down from the overhead resistance and breaks below the 20-day EMA, it signals that the bears are selling on minor rallies. That may retain the price inside the descending channel pattern.
Solana price prediction
Solana (SOL) has reached the breakdown level of $95, which is a critical overhead resistance to keep an eye on.

If buyers overcome the barrier, the SOL/USDT pair may surge to $117. Sellers are expected to pose a substantial challenge at $117, but on the way down, if the bulls maintain the SOL price above $95, it suggests a positive sentiment. That increases the possibility of a rally to $147.
Instead, if the price turns down sharply from the current level and breaks below the 20-day EMA ($87), it suggests that the pair may extend its stay inside the $76 to $95 range for some more time.
Related: Bitcoin hits $74.4K six-week high as analysts see ‘more upside’ for BTC
Dogecoin price prediction
Dogecoin (DOGE) has risen above the 50-day SMA ($0.10), indicating that the bears are losing their grip.

The DOGE/USDT pair may rally to the breakdown level of $0.12, where the bears are expected to sell aggressively. If the DOGE price turns down sharply from $0.12, it points to a possible range formation. The pair may swing between $0.09 and $0.12 for a few days.
On the other hand, a break and close above the $0.12 resistance signals that the bulls are back in the driver’s seat. That clears the path for a rally to the $0.16 level, which is expected to behave as a stiff resistance.
Cardano price prediction
Cardano (ADA) has surged above the 50-day SMA ($0.28), indicating that the bulls are attempting a comeback.

The bears are expected to vigorously defend the downtrend line, but if the bulls prevail, the ADA/USDT pair may signal a short-term trend change. The ADA price may rally to $0.37 and then to $0.44.
Contrarily, if the price turns down sharply from the downtrend line and breaks below the moving averages, it suggests that the pair may continue to oscillate inside the channel for a few more days.
Hyperliquid price prediction
Sellers attempted to pull Hyperliquid (HYPE) back below the breakout level of $36.77 on Sunday, but the bulls held their ground.

That suggests the bulls are striving to flip the $36.77 level into support. If they manage to do that, the HYPE/USDT pair may ascend to $43 and then to $50.
The first support on the downside is at $36.77 and then at the 20-day EMA ($33.95). Sellers will have to tug the HYPE price below the 50-day SMA ($31.56) to suggest that the market has rejected the breakout above $36.77. The pair may then plummet to $29.
This article does not contain investment advice or recommendations. Every investment and trading move involves risk, and readers should conduct their own research when making a decision. While we strive to provide accurate and timely information, Cointelegraph does not guarantee the accuracy, completeness, or reliability of any information in this article. This article may contain forward-looking statements that are subject to risks and uncertainties. Cointelegraph will not be liable for any loss or damage arising from your reliance on this information.

The protocol’s tokenized RWA value is down this month, driven by a steep drop in the value of its corporate credit fund, JAAA.
Centrifuge’s native token CFG has rallied roughly 60% in the past 24 hours after Binance, the largest centralized exchange buy trading volume, announced it would list the token for spot trading today, March 16. CFG is the real-world asset (RWA) tokenization protocol’s native governance and utility token.
The price of CFG reacted to the news nearly immediately, soaring from around $0.12 to as high as $0.23 at its intraday peak — a 90% rally — before retracing to approximately $0.19 at time of writing, per CoinGecko data. 24-hour trading volume reached over $178.8 million, per CoinGecko, with most of today’s volume, over $118.7 million, occurring on Korean CEX Upbit for the CFG/KRW trading pair.
Meanwhile, the CFG/USDC pair on Binance is trading around $0.19, up almost 100% on the 24-hour timeframe. 24-hour trading volume for CFG on Binance has reached over $13.6 million at publishing time.
Per the listing announcement, Binance applied a so-called Seed Tag to the listing — a designation the exchange uses for higher-risk or less-established tokens that requires users to pass a quiz before trading.
CFG had already seen a listing-driven surge on Feb. 26, when Upbit’s announcement sent the token up over 200% intraday to over $0.24.

Tokenized RWA Value Slips
On the fundamentals side, RWAxyz data shows Centrifuge’s distributed asset value across its tokenized RWAs at $1.23 billion, down over 8% this month. The majority of value across the platform’s four tokenized funds sits on Ethereum, which holds nearly $922 million at publishing time — though that value is down 10.55% in the past 30 days.
Centrifuge’s largest tokenized RWA product, Janus Henderson Anemoy Treasury Fund (JTRSY), holds U.S. Treasuries and has a market cap of $761.3 million.

Meanwhile, RWAxyz shows that the value of Centrifuge’s corporate credit fund, Janus Henderson Anemoy AAA CLO Fund (JAAA) slipped over 42% in the last month, which accounted for the broader net losses across its tokenized products. JAAA currently holds $416,6 million in value on-chain, mostly on Avalanche C-Chain and Ethereum.
The platform’s overall on-chain RWA value crossed the $1 billion milestone for the first time last August on the back of institutional demand for its JAAA fund. The firm launched a $100 million tokenized credit strategy with Resolv on Aave’s RWA platform Horizon in late February.
This article was written with the assistance of AI workflows. All our stories are curated, edited and fact-checked by a human.


Jane Street-related wallets have received over $15 million BTC from two centralized exchanges.
Infamous quant trading giant Jane Street, which has been alleged by many to be involved in Bitcoin’s “10 AM dump,” has resumed notable BTC-related activity. The firm remains under scrutiny from regulators, as well as from market participants.
According to a post by Lookonchain, in the past 2 hours, wallets associated with Jane Street have received a total of 25.36 BTC worth $15.08 miollion from two centralized exchanges – BitMEX and LMAX Digital.
Jane Street, recently accused of insider trading during the LUNA/Terra crash and dumping $BTC at 10 AM, is actively trading again.
In the past 2 hours, wallets linked to #JaneStreet received 205.36 $BTC($15.08M) from BitMEX and LMAX Digital.https://t.co/6Jt6RTJRed pic.twitter.com/JJ4PKyCVA4
— Lookonchain (@lookonchain) March 16, 2026
The move suggests that the firm may have restarted trading flows after a period of relative quiet. The renewed attention comes at a rather sensitive time for the firm. As CryptoPotato reported earlier this year, Terraform Labs’ court-appointed administrator filed a lawsuit, accusing Jane Street of insider trading tied to the dramatic collapse of the entire Terra/Luna ecosystem back in May 2022.
Jane Street has strongly denied all the allegations, calling them baseless, and also argued that the lawsuit is simply an attempt to shift the blame for Terraform Labs’ own failure.
Meanwhile, multiple X analysts and market observers have alleged that the trading firm is responsible for regularly dumping Bitcoin’s price at 10 AM, calling it the “Jane Street 10 AM dump.”
Despite that controversy, other industry experts reject the notion. Matt Hougan, chief investment officer at Bitwise, recently dismissed claims that the firm orchestrated these declines, describing the pattern as a “classic crypto winter” rather than the result of a coordinated trading activity.
You may also like:
Binance Free $600 (CryptoPotato Exclusive): Use this link to register a new account and receive $600 exclusive welcome offer on Binance (full details).
LIMITED OFFER for CryptoPotato readers at Bybit: Use this link to register and open a $500 FREE position on any coin!
T. Rowe Price, the $1.8 trillion asset manager best known for managing mutual funds and retirement accounts, has amended the registration statement for its proposed Active Crypto exchange-traded fund (ETF), updating a prospectus first submitted in October that outlines plans for an actively managed fund investing directly in digital assets.
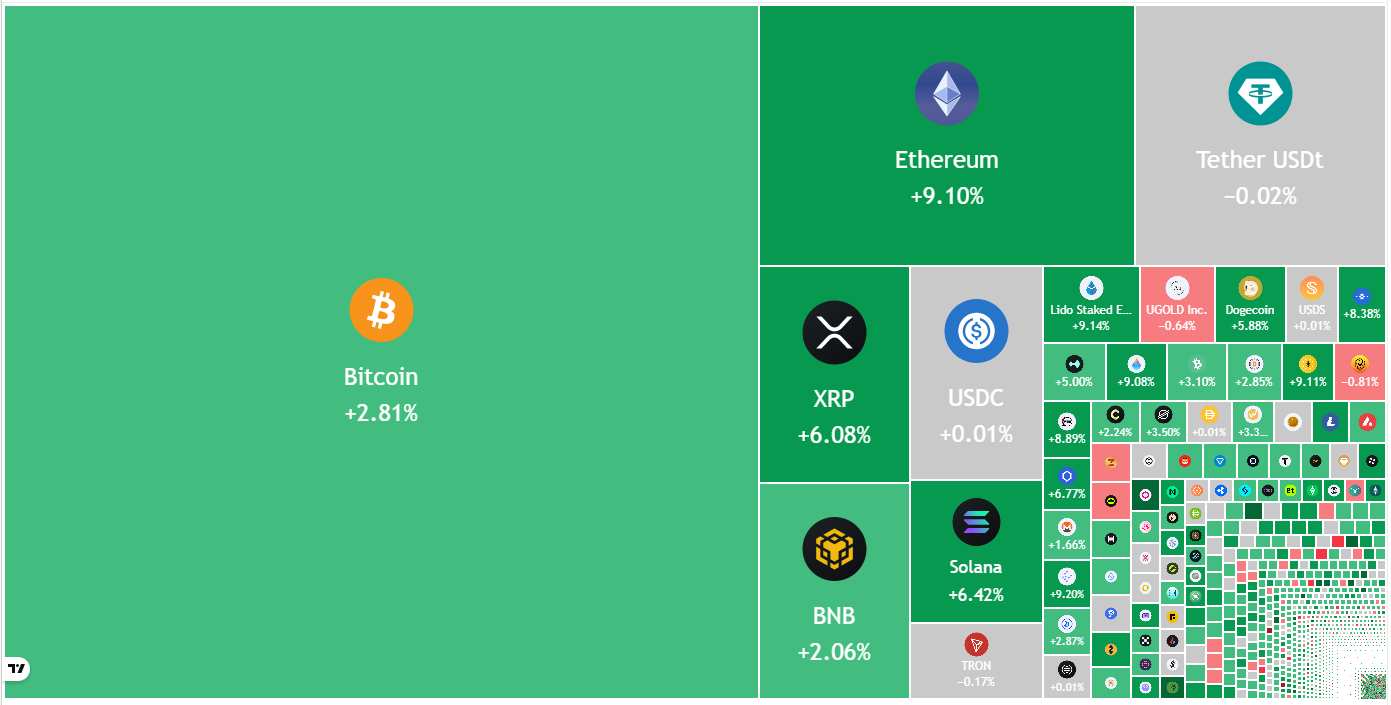
The amendment with the US Securities and Exchange Commission (SEC) was submitted on Monday and lists 15 eligible digital assets that may be considered for the portfolio, including Bitcoin (BTC), Ether (ETH), Solana (SOL), XRP (XRP), Avalanche (AVAX) and Shiba Inu (SHIB).
The updated filing adds new operational details but it leaves the core structure of the proposed fund intact. The amendment names Anchorage Digital Bank as the ETF’s crypto custodian, expands disclosures around share creation and redemption, and adds Sui (SUI) to the list of eligible digital assets.

The asset list is largely consistent with the October filing, according to Cointelegraph’s earlier reporting. At the time, the proposal surprised some industry observers, given T. Rowe Price’s historically conservative focus on traditional investment products such as mutual funds over its nearly nine-decade history.
It also provides updated information on the FTSE Crypto US Listed Index, including constituent weights as of January 2026, and expands risk disclosures related to portfolio turnover and the fund’s active trading strategy.
Related: SEC’s ‘Crypto Mom’ calls for simpler disclosure rules, flags tokenization debate
TradFi asset managers embrace crypto ETFs
In October, NovaDius Wealth Management president Nate Geraci said T. Rowe Price’s crypto ETF filing came out of “left field,” given the company’s long-standing focus on traditional mutual funds and its relatively recent entry into the ETF market.
With the proposal, T. Rowe Price joined a growing list of traditional financial institutions that have launched crypto investment products, including BlackRock, Fidelity, Franklin Templeton, VanEck and Invesco.
The original filing came near the peak of the crypto market, shortly after Bitcoin surged above $120,000. It also coincided with the Oct. 10 liquidation event, when a sharp market reversal triggered billions of dollars in forced liquidations across leveraged crypto derivatives positions.

Since then, digital asset prices have retreated, and crypto ETFs have recorded notable outflows, reflecting cooling investor sentiment after the rally in 2024 and 2025.
Related: Bernstein says Bitcoin rebound reflects more resilient long-term holder base

Pepe price rose as the best performer in the crypto market amid a market-wide recovery triggered by Bitcoin’s surge past $74,000 support.
Summary
- Pepe price jumped about 21% to a two-week high as the broader crypto market rebounded following Bitcoin’s surge above the $74,000 level.
- Trading activity surged sharply, with PEPE’s daily volume rising more than 380% as nearly $1 billion worth of the token changed hands.
- Technical indicators show bullish momentum building, with PEPE moving above key moving averages while traders watch resistance near the 100-day SMA.
According to data from crypto.news, Pepe (PEPE) price shot up 21% to a two-week high of $0.000040 as of last check on Monday, March 16. Despite this, it still remains nearly 19% below its February high of $0.0000049.
Pepe’s gains came primarily due to a broader market recovery that followed Bitcoin’s surge past the $74,000 resistance level, which boosted investor demand for risk assets. Ethereum (ETH) was also up 8% at the time of writing, while other major coins such as XRP, SOL, DOGE, and ADA also marched higher.
As a high-beta memecoin, PEPE amplified the gains of the broader market, outperforming the global average with its staunch rebound today.
PEPE’s rebound was further fueled by a notable surge in trading activity. Over the past 24 hours, its daily trading volume shot up over 380% as nearly $1 billion worth of Pepe coin exchanged hands between traders.
Technical indicators seem to suggest that the Pepe price could still have steam left to sustain its rally at least over the following sessions.
Notably, the Pepe price has surged past the 20-day and 50-day moving averages as it formed a god candle today. This explosive vertical movement indicates strong buying pressure and a shift in market sentiment.
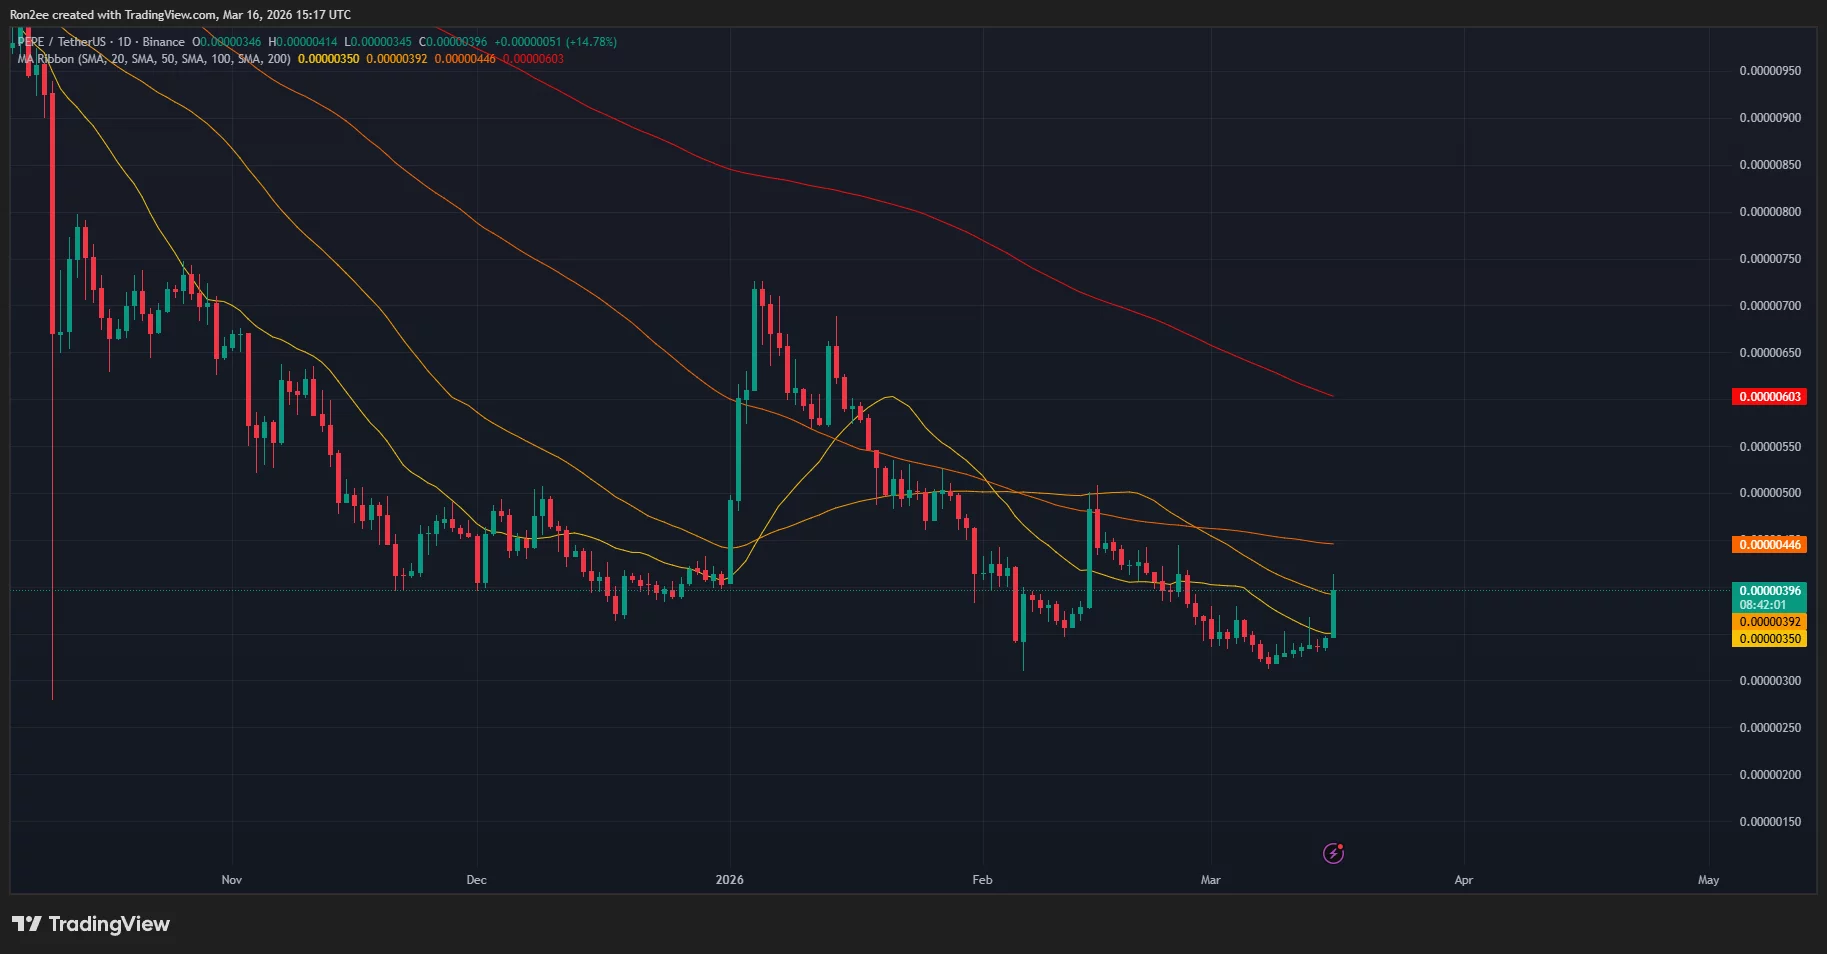
The next target for PEPE stands at the 100-day SMA at $0.0000044, which represents a key resistance level that bulls must flip to confirm a long-term trend reversal.
Momentum indicators like the MACD and RSI show that bulls were still holding the upper hand in the current market structure. The MACD lines were pointing upwards after a bullish crossover, confirming that upward momentum is accelerating.
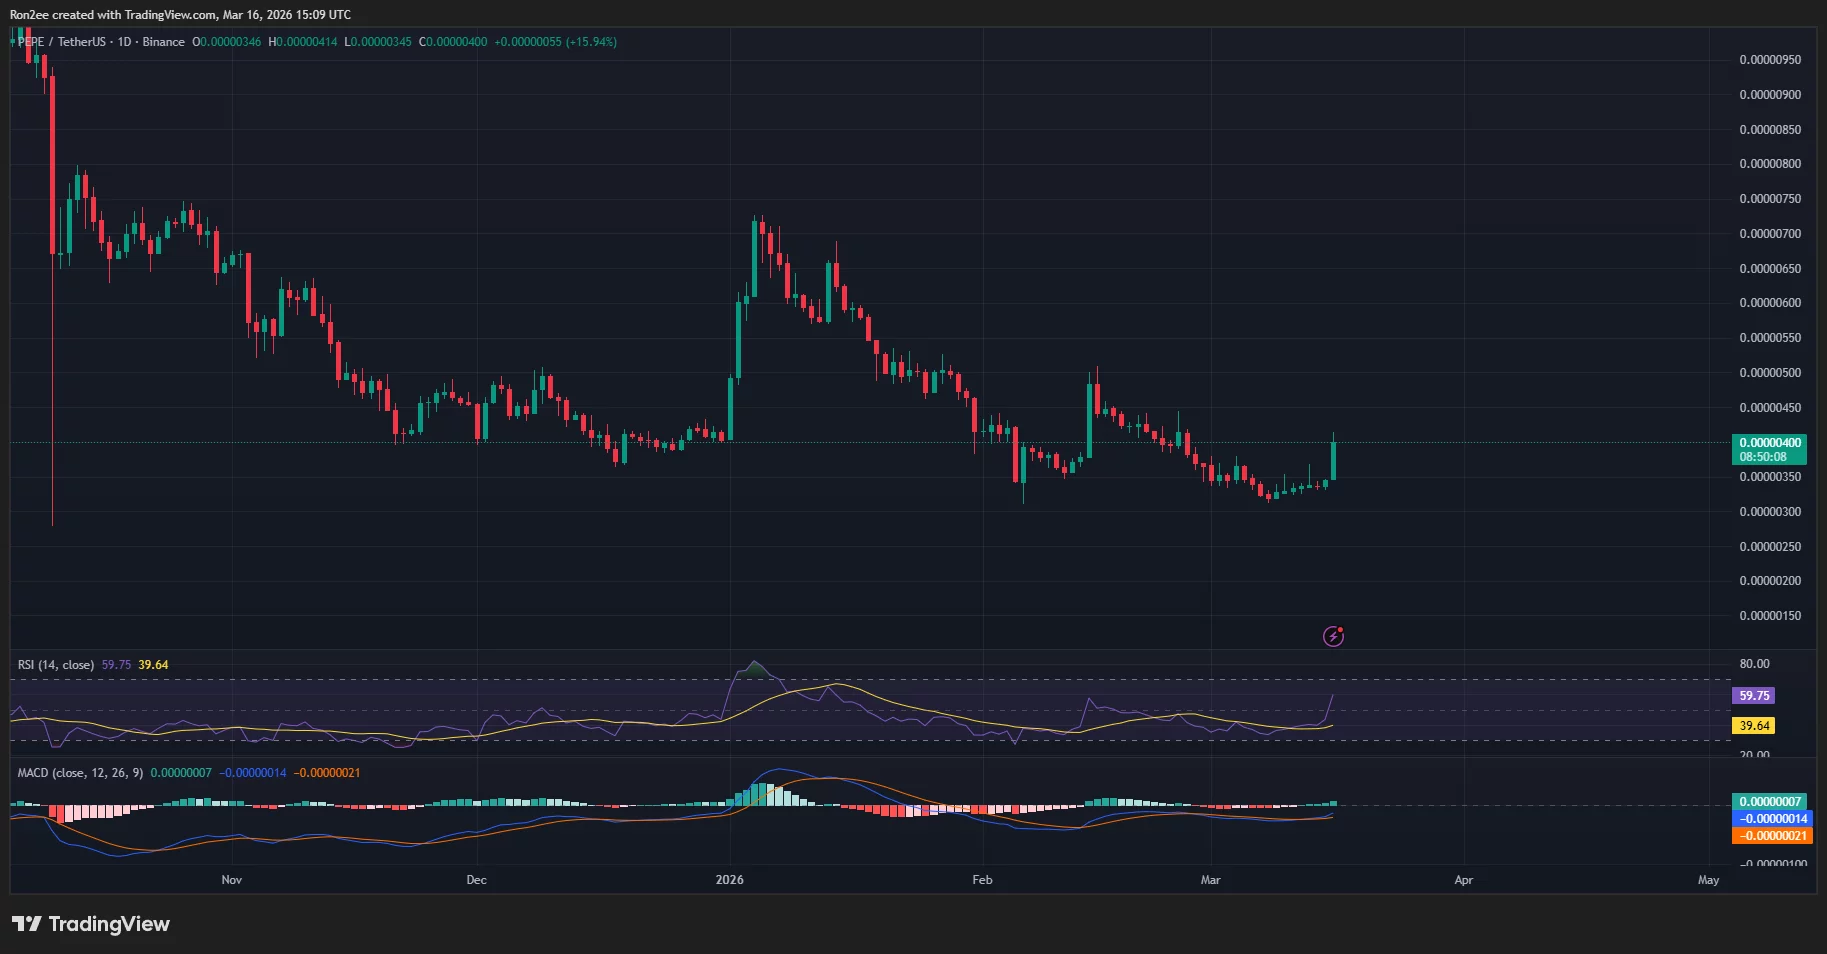
Meanwhile, the RSI has recently surged past the neutral threshold with still room before hitting overbought levels where a reversal usually takes place. This suggests that the current rally has not yet reached a point of exhaustion.
However, there remains a risk to Pepe’s ongoing rally, as is common with highly speculative meme coins with no fundamental utility.
The risk is that Pepe’s rally could likely be a dead cat bounce, a temporary recovery in a declining market where an asset falls back after staunch rallies, as seen for Pepe coin today.
Without sustained organic demand or a broader market breakout, these gains can quickly evaporate as early investors move to take profits.
In case of a retracement, $0.0000039, which aligns with the 50-day SMA, would act as an immediate support level. If this floor fails to hold, the price could slide further to retest lower liquidity zones, potentially wiping out today’s gains.
Disclosure: This article does not represent investment advice. The content and materials featured on this page are for educational purposes only.

TLDR
- Vitalik Buterin supported a Nimbus proposal to merge Ethereum’s two clients into a single program.
- He said running two daemons makes node operation harder for independent validators.
- The Unified Node aims to simplify installation and reduce configuration errors.
- Ethereum introduced separate Beacon and execution clients during the 2022 Merge.
- Buterin linked better user experience with stronger validator decentralization.
Ethereum co-founder Vitalik Buterin called for a simpler node setup for validators. He backed a Nimbus “Unified Node” proposal that merges two Ethereum clients into one program. He said the current design creates avoidable complexity for self-sovereign users.
Vitalik Buterin Backs Unified Node Proposal
Vitalik Buterin supported a Nimbus pull request from the Status-im team that merges Ethereum’s two clients. He said running two daemons creates friction and discourages independent validators. He wrote on X, “Running two daemons and getting them to talk to each other is far more difficult than running one daemon.”
He added that Ethereum should improve usability for self-sovereign participants. He said, “Our goal is to make the self-sovereign way of using Ethereum have good UX.” He also stated that in many cases users need to run their own node.
He said the current method adds needless complexity for operators. He noted that the architecture could change over time. He wrote, “Longer-term, we should be open to revisiting the whole architecture.”
Ethereum introduced separate Beacon and execution clients during the 2022 Merge. The network moved from proof-of-work to proof-of-stake at that time. Validators then needed to manage two background programs simultaneously.
The two programs must communicate correctly for a node to function. Validators must configure both daemons and keep them synchronized. The Nimbus proposal combines these roles into a single executable.
Status-im developers built the Unified Node to reduce setup barriers. The software aims to simplify installation and maintenance. Buterin publicly praised this approach on X.
He has argued for better validator experience for several years. He has linked usability with stronger decentralization. He said simpler tools can encourage broader participation.
Ethereum Node Architecture and Validator Diversity
On Ethereum, validators verify transactions and propose blocks. They use hardware and client software to maintain the blockchain ledger. The ledger records ETH balances and confirms whether coins have been spent.
Proof-of-stake requires validators to lock up ETH to secure the network. Validators earn rewards for correct participation. They face penalties when they fail to perform duties.
In 2024, Elon Musk asked Buterin on X why he posted less frequently. Musk had acquired Twitter for $44 billion and renamed it X. Buterin responded by sharing a blog post on validator decentralization.
He warned about large staking pools operating nodes on identical hardware. He said shared infrastructure can lead to correlated downtime. He argued that such operators should face steeper financial penalties.
He tied these concerns to validator diversity across the network. He maintained that better user experience supports broader node distribution. He continued to raise this issue in public discussions.
Buterin’s recent comments returned to the technical setup. He focused on reducing the need to manage separate daemons. He framed the Unified Node as a step toward simpler operation.

![90 Day Fiance: Daniel Declares Lisa an Evil Woman - Before The 90 Days Recap [S08E14]](https://wordupnews.com/wp-content/uploads/2026/03/90-day-fiance-daniel-5321-80x80.jpg)
90 Day Fiance: Daniel Declares Lisa an Evil Woman – Before The 90 Days Recap [S08E14]

Moises Caicedo says ‘underrated’ Chelsea star is ‘one of the best’ | Football
Kurdish Authorities Reject Baghdad Request to Restart Oil Exports via Ceyhan


-
 Tech6 days ago
A 1,300-Pound NASA Spacecraft To Re-Enter Earth’s Atmosphere
-
Crypto World3 days ago
HYPE Token Enters Net Deflation as HyperCore Buybacks Outpace Staking Rewards
-

 Business6 days ago
ExxonMobil seeks to move corporate registration from New Jersey to Texas
-

 Fashion3 days ago
Weekend Open Thread: Addict Lip Glow
-

 Tech6 days ago
ChatGPT will now generate interactive visuals to help you with math and science concepts
-
Sports2 days ago
Why Duke and Michigan Are Dead Even Entering Selection Sunday
-

 NewsBeat5 days ago
Residents reaction as Shildon murder probe enters second day
-
 NewsBeat7 days ago
Pagazzi Lighting enters administration as 70 jobs lost and 11 stores close across Scotland
-

 Business6 days ago
Search Enters Sixth Week With New Leads in Tucson Abduction Case
-

 Business1 day ago
Search for Savannah Guthrie’s Mother Enters Seventh Week with No Arrests
-

 Business2 days ago
US Airports Launch Donation Drives for Unpaid TSA Workers as Partial Government Shutdown Enters Fifth Week
-
Crypto World2 days ago
Coinbase and Bybit in Investment Talks: Could Bybit Finally Enter the US Crypto Market?
-

 NewsBeat5 days ago
I Entered The Manosphere. Nothing Could Prepare Me For What I Found.
-

 Business2 days ago
Country star Brantley Gilbert enters growing non-alcoholic beer market
-

 Business12 hours ago
Australian shares drop as Iran war enters third week
-

 Sports5 days ago
PWHL, Senators discussing plan to keep Charge in Ottawa
-

 Crypto World6 days ago
Will Chainlink price reclaim $10 amid volatility squeeze?
-

 Sports3 days ago
College Basketball Best Bets: Conference Tournament Semifinal Picks
-

 Crypto World12 hours ago
Crypto Lender BlockFills Enters Chapter 11 with Up to $500M in Liabilities
-

 Politics6 days ago
Trump Says Middle East Is ‘Very Lucky’ That He’s President


You must be logged in to post a comment Login