
Crypto World
Majors post 11% weekly gains as bitcoin tests $75,000
Bitcoin briefly touched $75,912 early Tuesday before pulling back to $74,372, but the intraday volatility is less interesting than the weekly picture beneath it.
CoinDesk reported earlier Tuesday that the push above $75,000 was driven by derivatives activity rather than fresh buying, specifically the closure of large $60,000 put positions that forced market makers to buy spot bitcoin as they rebalanced.
The rapid pullback below $74,400, a former support level from April 2025, confirmed that traders aren’t willing to chase above that level without a fundamental catalyst.
Every major token is up at least 5% over seven days. Ether climbed 13.3% to $2,316. xrp rose 11% to $1.53, olana gained 9.7% to $93.92. Dogecoin added 9.5% to $0.10, back above a dime. BNB rose 5% to $676. This is the broadest sustained rally since before the Iran war began, and it’s happening heading into the most consequential Fed meeting in months.
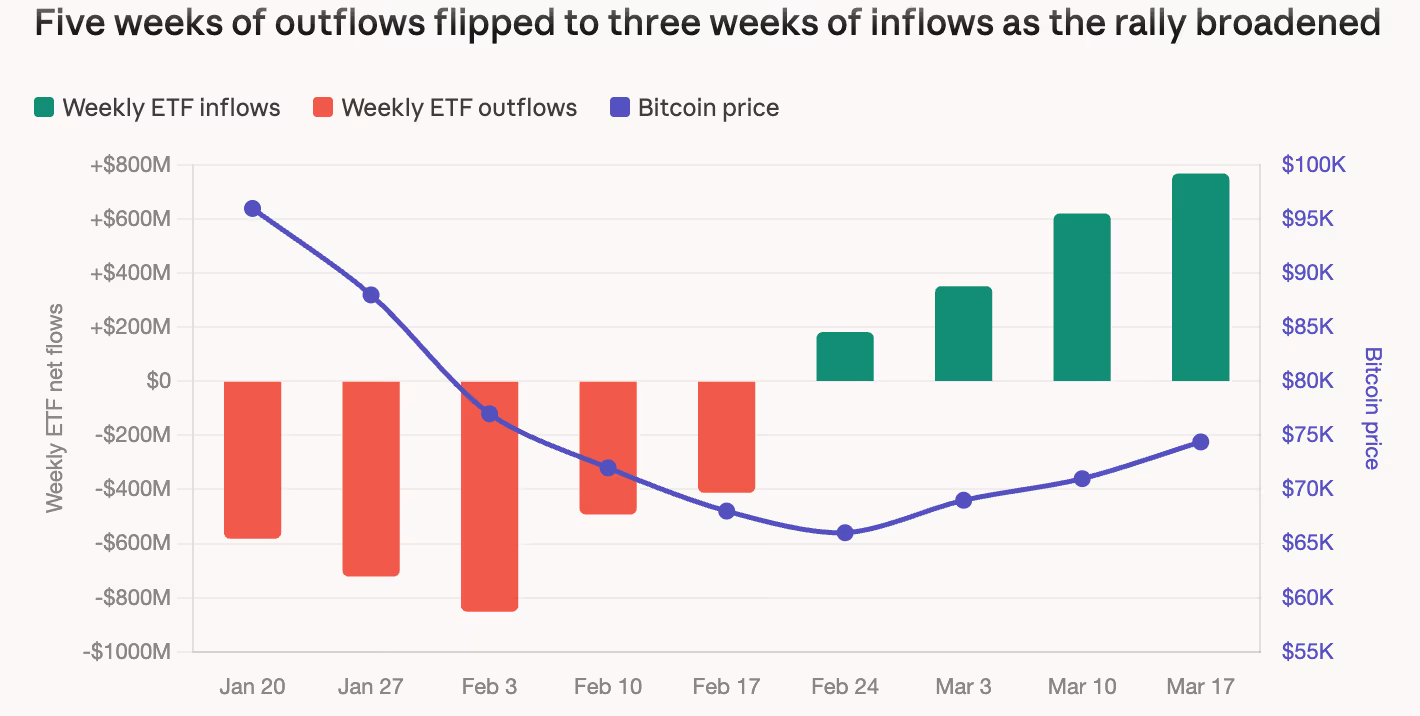
But the institutional flow data underneath the rally is real and getting harder to dismiss. CF Benchmarks analyst Mark Pilipczuk noted in an email that spot bitcoin ETFs drew roughly $767 million in net inflows last week, the third consecutive week of positive flows and a sharp reversal from the five-week, $3 billion-plus outflow streak earlier in the year.

The gold convergence trade is another signal worth watching. Year-to-date through mid-March, GLD returned roughly 16% while IBIT lost approximately 19%. But that gap has narrowed sharply, with bitcoin outperforming gold by 13.2% since early March. The 90-day correlation between the two shifted from -0.27 to +0.29 over six months. The “digital gold” narrative that looked dead in February is getting oxygen again.
The Fed meeting that begins today and concludes Wednesday is the pivot point. CME FedWatch still prices a 95%+ probability of a hold at 3.5% to 3.75%, so the decision itself is a non-event.
What matters is the dot plot and Powell’s press conference. Oil above $100 makes the stagflation case unavoidable, but the labor market is weakening, with February’s 92,000 job loss still fresh. The Fed is caught between two mandates pulling in opposite directions, and how Powell articulates that tension on Wednesday could set the direction for risk assets through the end of March.


Ripple’s token also surpassed BNB in terms of market cap today.
Alongside the rest of the market, XRP jumped earlier today to over $1.60, a level not seen in just over a month.
Although it was rejected there and now trades at around $1.50, the asset could be primed for more gains ahead, and Ali Martinez outlined the next possible target.
XRP to Aim at $1.85?
In the days leading up to today’s surge, Martinez also reported that the Bollinger Bands on XRP’s chart had squeezed as the asset spent most of the previous few weeks trading sideways in a relatively tight range between $1.33 and $1.47. Consequently, the analyst suggested that a bigger move is on its way, without providing any clear indication of the direction.
However, the cross-border token finally broke out of that range yesterday, surging past $1.50. It climbed to over $1.60 earlier this morning, and even though it was stopped there, it’s still above the upper boundary of its previous trading range. Consequently, Ali Martinez noted that the aforementioned big move might take the asset to its next notable target at $1.85.
$XRP is breaking out of this triangle!
Target: $1.85. https://t.co/3dirkMNDwF pic.twitter.com/H2D56F5zyZ
— Ali Charts (@alicharts) March 17, 2026
Interestingly, the impressive price resurgence over the past few days comes even as the spot XRP ETFs continue to underperform. After registering a highly negative 7-day streak, the funds were in the red once again on Monday, with almost $6 million in net outflows.
However, the company behind the token has made some major moves lately, including announcing plans to secure an Australian Financial Services License, as well as a partnership focused on the US and Canadian markets.
You may also like:
Strongly Bullish
CryptoWZRD also weighed in on the token’s recent performance, noting that it closed “strongly bullish,” especially against BTC. The analyst expects “more bullish moves from XRP/BTC,” which will help the cross-border asset in the near future.
Fellow market observer CW outlined a chart showing that XRP has touched the lower line of the ascending channel, which represents its cycle bottom. They added that “an uptrend has now begun” after a Heikin Ashi green candle appeared following the successful retest of the bottom level.
The lower line of the ascending channel is the bottom of $XRP.
And a Heikin Ashi green candle appeared.
After touching the bottom, the trend reversed. An uptrend has now begun. pic.twitter.com/i5H5nDFKZH
— CW (@CW8900) March 17, 2026
Binance Free $600 (CryptoPotato Exclusive): Use this link to register a new account and receive $600 exclusive welcome offer on Binance (full details).
LIMITED OFFER for CryptoPotato readers at Bybit: Use this link to register and open a $500 FREE position on any coin!
The bitcoin price has remained relatively unscathed during the two‑week war with Iran. What’s more impressive is that its key volatility metrics have also held steady, a sign that crypto traders are less fearful than those in traditional markets such as equities, oil and bonds.
Tensions between Iran, the U.S., and Israel broke into open conflict on Feb. 28, damaging oil infrastructure across the Middle East and disrupting tanker flows. Analysts warned that the turmoil could trigger massive price volatility and fear-driven hedging across asset classes.
So far, they have been partially wrong.
Bitcoin’s 30-day implied volatility index, BVIV, has remained remarkably steady, holding between 55% and 60%, according to TradingView data. Implied volatility reflects the demand for options, so the stability suggests traders have not been aggressively buying put options, which hedge against price declines.
Traders in traditional markets, however, have freaked out and been chasing those options, as evidenced by spikes in their respective volatility indexes.
The equities gauge, the VIX — which measures the expected 30-day volatility of the S&P 500 based on options prices — averaged just above 20% before the conflict. It jumped to over 32% on March 6 and remained elevated near 26% on Monday.
Cboe’s crude oil volatility index, OVX, surged to more than 100% from 64%. MOVE, which tracks volatility in U.S. Treasury notes, rose to 85% from 73%, hitting a high of 95% at one point, reflecting broad-based market uncertainty. The volatility index for gold, traditionally seen as a haven during troubled times, held steady above 30%.
The divergence between the bitcoin and traditional market indexes matters. Asset prices can be noisy and affected by erratic flows, but volatility indicators often provide a clear picture of investor sentiment, especially the demand for hedging against downside risks. By that measure, BTC traders appear calm.
One possible explanation is that the crypto sentiment was already unsettled before the Iran conflict. Bitcoin’s price plunged from an all‑time high above $126,000 in October 2025 to the low $60,000s in subsequent months, a drawdown that shook out many bulls and forced others to hedge against further declines.
In that context, the Iran war has been less of a shock to the crypto market than to stocks and other markets, which traded near record highs or were calm in the weeks leading up to the conflict.
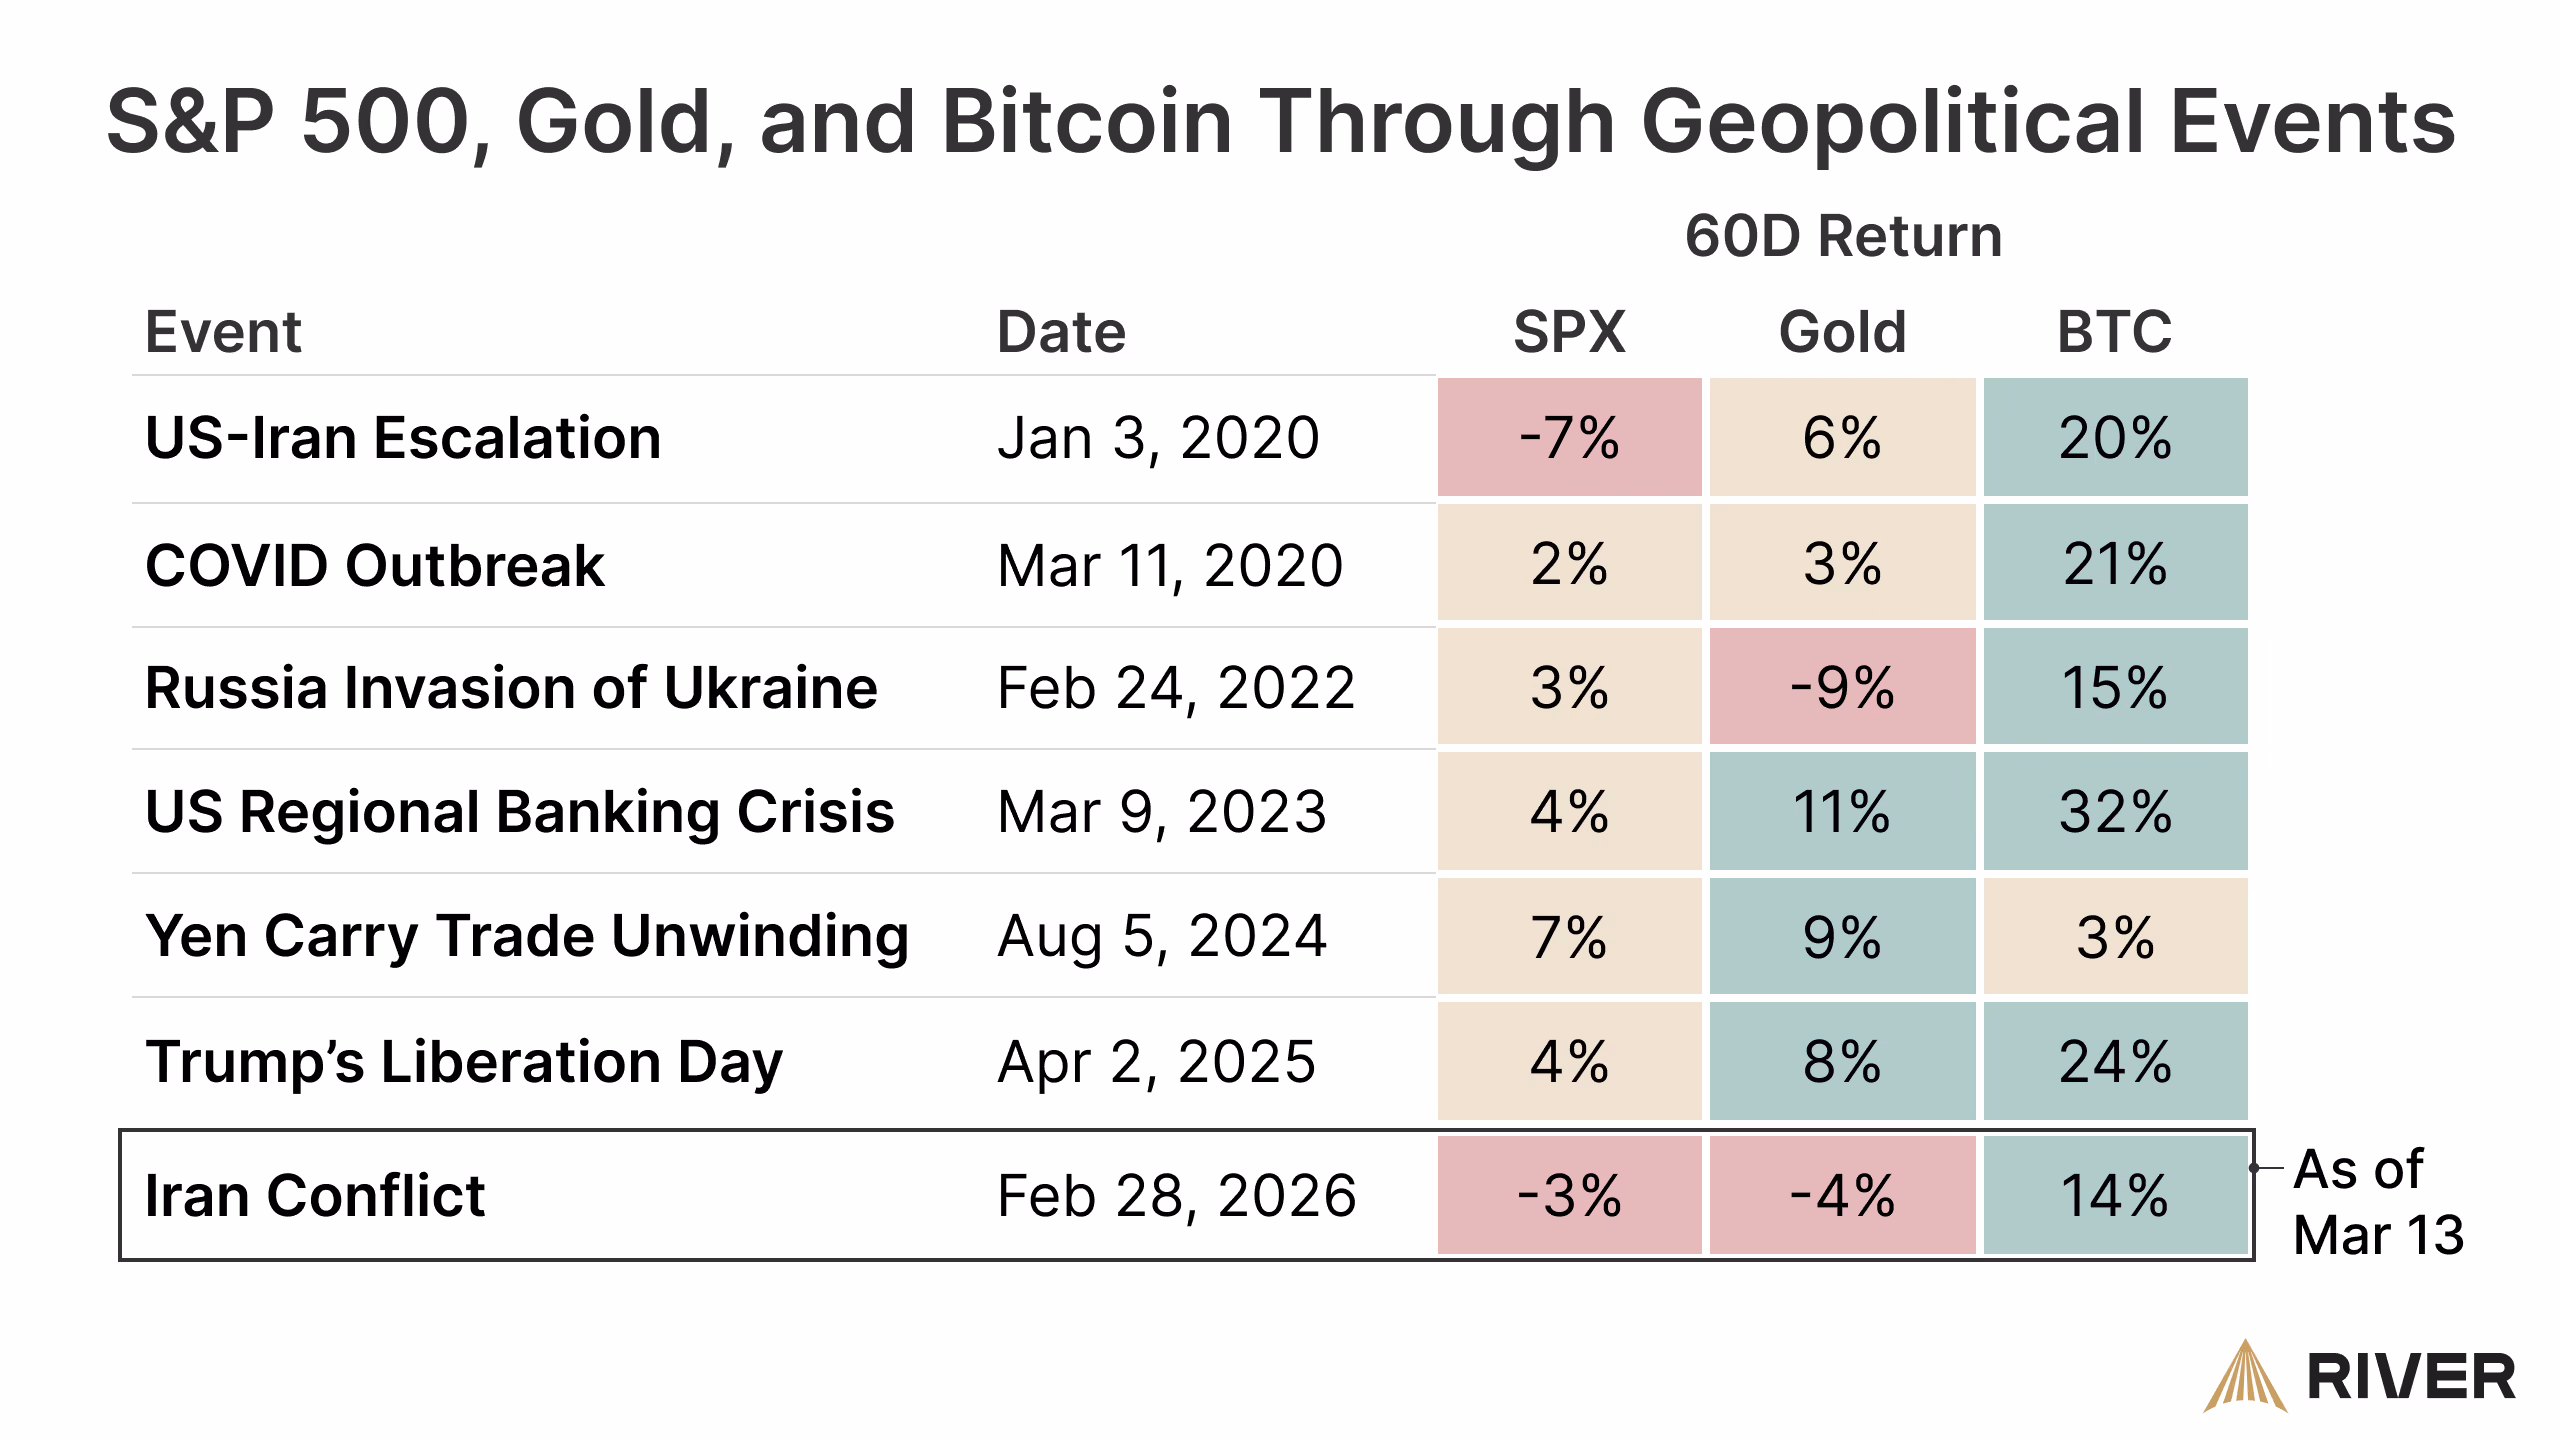
According to an analysis by bitcoin-focused financial firm River, the cryptocurrency has averaged double-digit returns over 60-day periods during multiple geopolitical events since 2020.

History is repeating itself. Bitcoin has rallied more than 10% to $74,000 in two weeks, according to CoinDesk data.
All things considered, the message is clear: BTC has held steady when it mattered the most. It remains to be seen if the stability persists.
Key Highlights
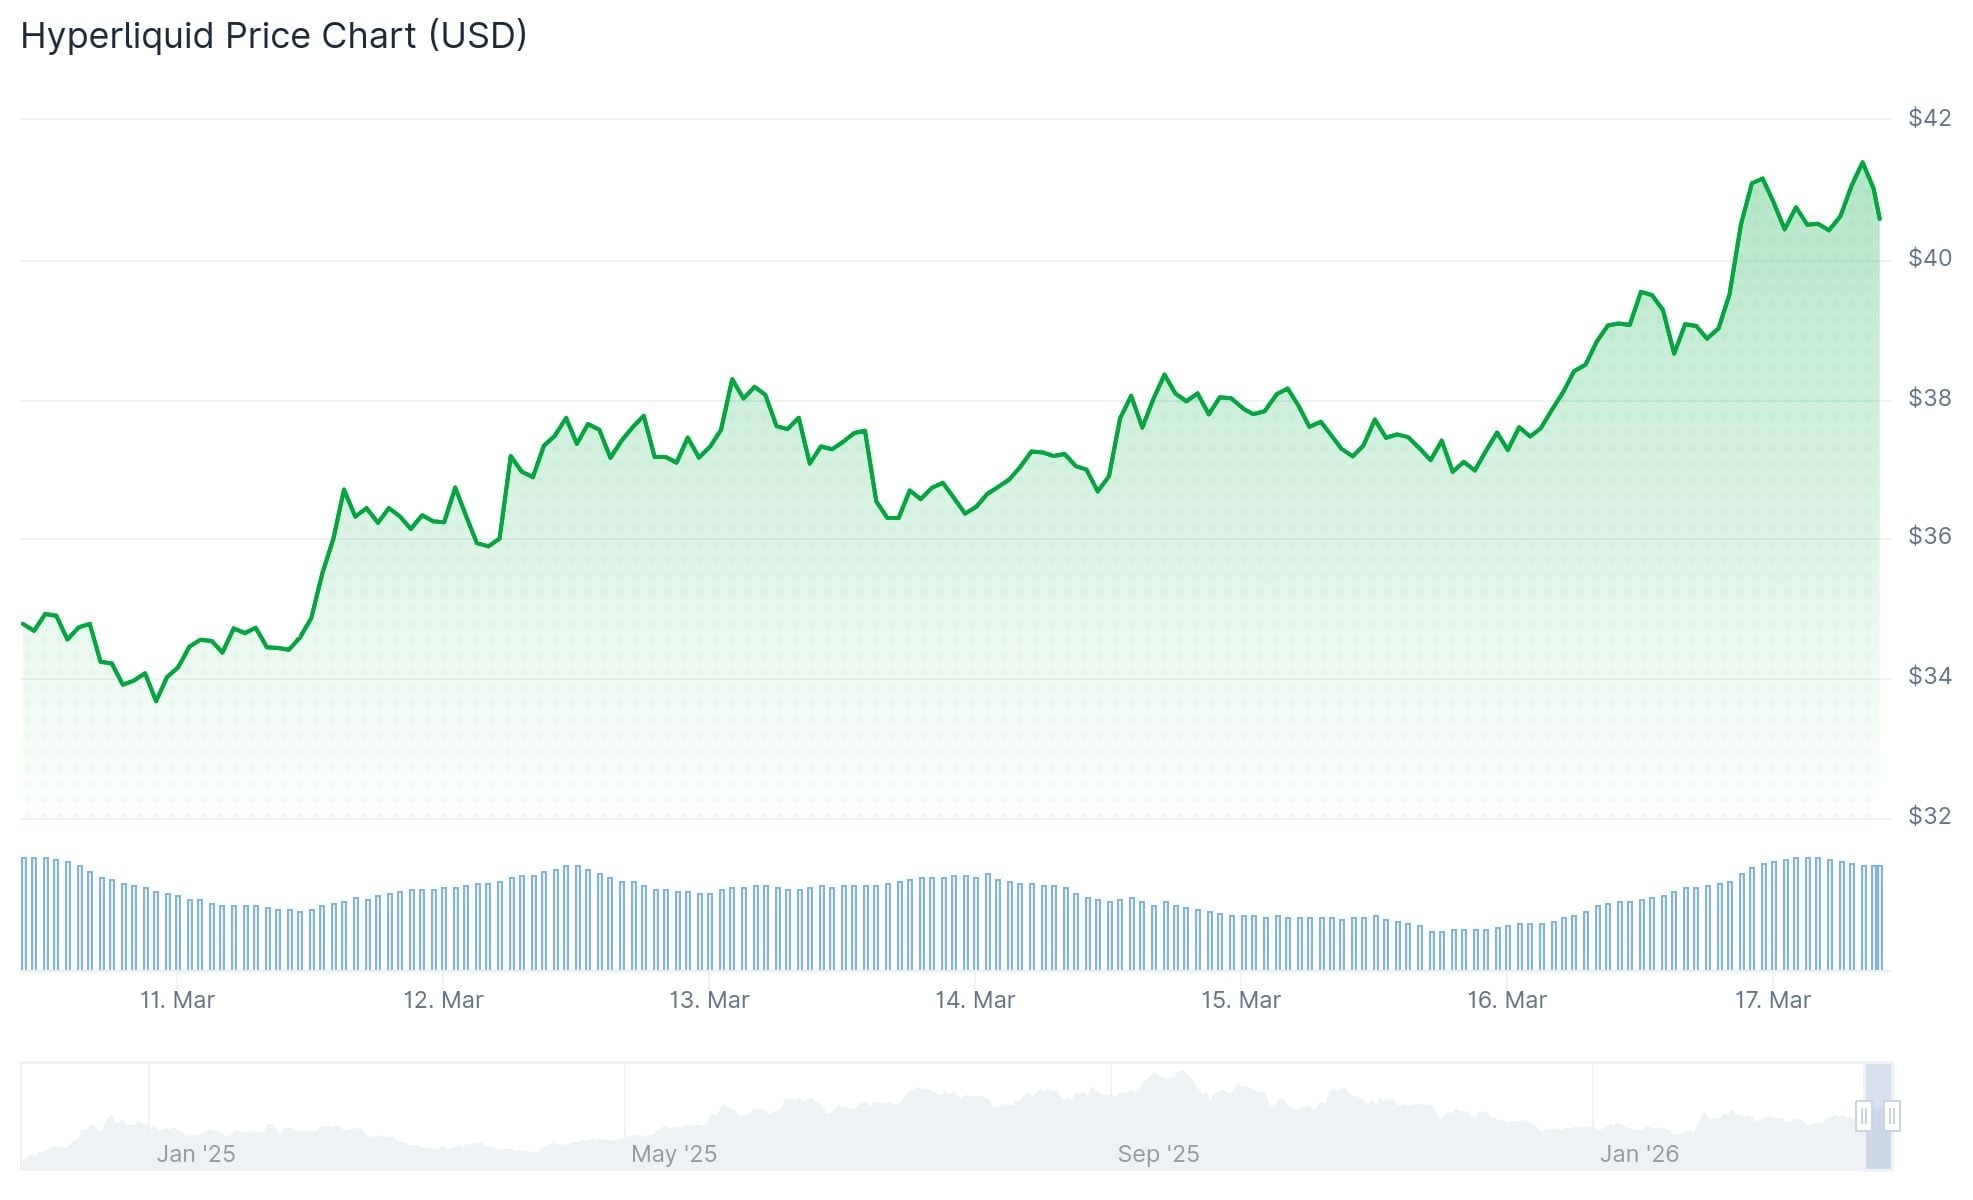
- HYPE surged approximately 10% to reach the $40 price level, establishing itself as the top gainer among the 20 largest cryptocurrencies by market capitalization
- Open Interest increased to $1.67 billion, marking the highest reading since early February and indicating significant new capital inflows
- Funding rates shifted into positive territory at 0.008%, demonstrating that long position holders are compensating short sellers
- The 4-hour RSI indicator stands at 70, approaching overbought levels, while the MACD displays a bullish crossover pattern
- Tokenized assets accounted for 33% of Hyperliquid’s weekly trading volume, establishing a new platform record
Hyperliquid (HYPE) has climbed to $40 following a nearly 10% price increase on Monday. This upward movement enabled HYPE to surpass Cardano’s ADA, securing the position as the tenth-largest cryptocurrency by market capitalization.
The price surge is supported by robust on-chain metrics and derivatives market indicators. According to CryptoQuant analytics, significant whale transactions, buy-side pressure dominance, and stabilizing conditions across both spot and futures markets are evident.
In the derivatives markets, Open Interest (OI) expanded to $1.67 billion on Tuesday. This represents the highest measurement recorded since the beginning of February, with consistent growth observed throughout March.

An increase in OI generally indicates that fresh capital is flowing into the market. This additional liquidity could provide support for the current upward price trajectory.
Hyperliquid’s funding rates transitioned to positive territory on Sunday and climbed to 0.008% by Tuesday. This shift from negative to positive funding rates indicates that traders with long positions are compensating those with short positions — a clear indication of robust bullish sentiment.
Chart Analysis Suggests Further Upside Potential
Examining the 4-hour timeframe, HYPE successfully breached a daily resistance barrier at $36.51 last Thursday. The token established support around that threshold the next day before climbing roughly 10% through Monday’s trading session.
The 4-hour RSI reading stands at 70, positioned just beneath overbought conditions. Additionally, the MACD indicator has generated a bullish crossover signal, accompanied by expanding green histogram bars that reinforce the positive technical outlook.
Should HYPE maintain its upward momentum, the primary target remains the $50 psychological threshold. Nevertheless, the October 29 peak of $49.88 could serve as resistance due to concentrated sell-order activity in that price zone.
A brief retracement within the overall uptrend remains possible. In such a scenario, the initial support level to monitor would be $36.51, with secondary support at $33.60, which was most recently tested on March 10.
Record-Breaking Tokenized Asset Trading Activity
Beyond price movements, tokenized assets represented 33% of Hyperliquid’s total weekly trading volume. This marks an unprecedented all-time high proportion for this asset category on the platform, based on Blockworks data.
Tokenized assets also constitute approximately 21% of the total open interest on Hyperliquid. Open interest represents the aggregate value of all active derivative contracts.
The expanding proportion of tokenized assets indicates that an increasing number of traders are maintaining positions in these instruments over extended timeframes.
Tokenized assets represent conventional financial instruments or tangible real-world assets that have been digitized on blockchain networks, enabling them to be exchanged within decentralized trading environments.
As of Tuesday’s trading session, HYPE is valued at $40 with bullish traders eyeing $50 as the subsequent critical resistance level.


Nvidia shares experienced heightened volatility yesterday, with the price jumping to a March high during the Nvidia GTC 2026 conference, where Jensen Huang made several major announcements. According to media reports:
→ Nvidia unveiled a next-generation platform named after the astronomer Vera Rubin. The new chips are designed for “agentic AI” (AI agents).
→ The company expects total orders for current-generation AI systems (Blackwell) and next-generation systems (Vera Rubin) to reach $1 trillion by 2027. This is double the company’s previous $500 billion forecast announced earlier.
→ Huang also noted that market demand is shifting. While chips were previously purchased mainly for training AI models, demand is now increasingly driven by companies such as OpenAI, Meta and Anthropic, which must serve hundreds of millions of users in real time.
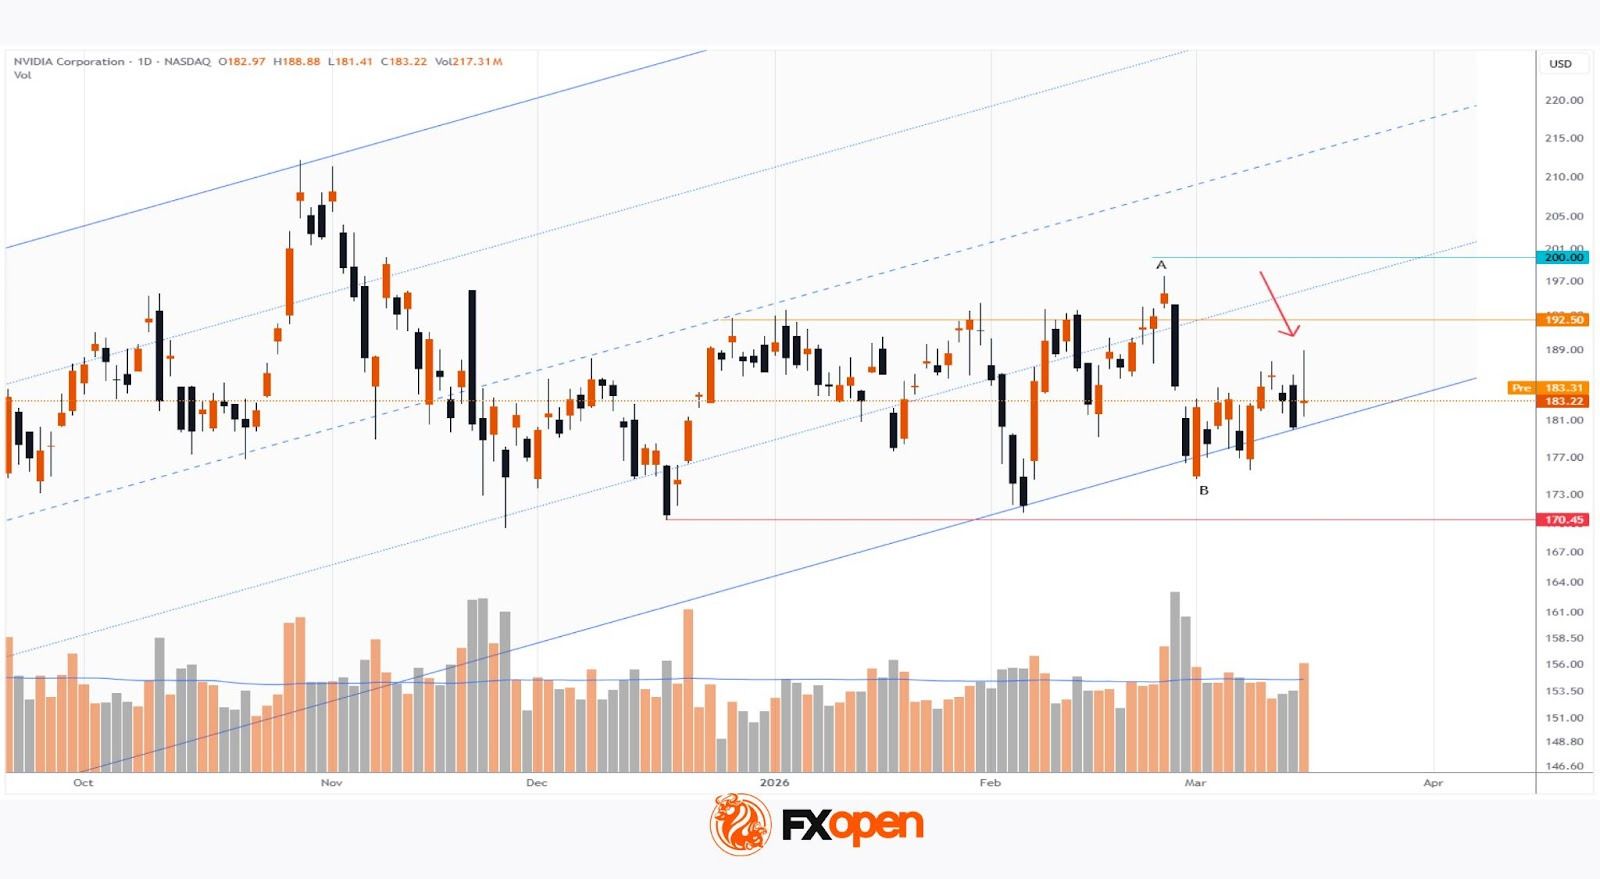
As the NVDA chart shows, the share price rose above the $188.50 level, but later pulled back, which may suggest excessive optimism among buyers and aggressive selling pressure.
Technical Analysis of Nvidia (NVDA)
On the morning of 26 February, while analysing NVDA price movements following the quarterly earnings release, we:
→ updated the long-term ascending channel (which remains intact);
→ pointed to the negative experience of other tech giants earlier in 2026, whose shares rallied briefly after earnings before turning lower (for example, Meta);
→ suggested that if bulls wanted to confirm control of NVDA, it would be important to keep the price above the $192.50 level.
During the main trading session that same day, the $192.50 level was broken by bears on a wide candle accompanied by rising volumes, confirming these concerns. Moreover, the downward momentum continued the following day, eventually leading to the A→B swing.
Overall, bulls still have reasons to remain calm, as:
→ the fundamental backdrop remains optimistic;
→ the lower boundary of the ascending channel continues to act as strong support.
However, the NVDA price chart also presents some warning signs:
→ peak A may represent a bull trap;
→ yesterday’s candle with a long upper shadow could also signal a similar trap.
If this proves to be the case, a test of the lower boundary of the channel would be a logical next step. Such a scenario could significantly alter sentiment in the NVDA stock market.
Buy and sell stocks of the world’s biggest publicly-listed companies with CFDs on FXOpen’s trading platform. Open your FXOpen account now or learn more about trading share CFDs with FXOpen.
This article represents the opinion of the Companies operating under the FXOpen brand only. It is not to be construed as an offer, solicitation, or recommendation with respect to products and services provided by the Companies operating under the FXOpen brand, nor is it to be considered financial advice.

TLDR
- Ping Fai Yuen alleges his estranged spouse Fun Yung Li accessed 2,323 Bitcoin from his Trezor wallet in August 2023 by recording his seed phrase via household surveillance cameras
- The cryptocurrency held a value near $60 million when allegedly stolen but has since appreciated to approximately $172 million
- The digital assets were distributed across 71 different blockchain addresses with no transaction activity recorded after December 21, 2023
- While dismissing the primary conversion claim, a UK High Court judge permitted the case to advance on alternative legal grounds
- Justice Cotter determined the husband possesses “a very high probability of success” and advised scheduling an expedited trial
Ping Fai Yuen, a British man, alleges that his estranged spouse Fun Yung Li covertly captured the 24-word seed phrase for his Trezor hardware wallet through domestic surveillance equipment. According to his claims, she subsequently utilized this information to authorize the unauthorized transfer of 2,323 Bitcoin in August 2023.
The Bitcoin held an estimated value approaching $60 million during the alleged incident. Based on current market prices hovering around $74,000 per token, the holdings are now worth approximately $172 million.
The disputed cryptocurrency moved through multiple transactions before settling into 71 distinct blockchain addresses. Court filings indicate these addresses have remained dormant with zero recorded movements since December 21, 2023.
According to Yuen’s testimony, his daughter alerted him to his wife’s alleged intentions to appropriate the Bitcoin. Following this warning, he deployed audio surveillance technology throughout their residence. He asserts these recordings document his wife deliberating about the theft and strategizing methods to transfer substantial funds while avoiding scrutiny from financial institutions and law enforcement.
Law enforcement officials arrested Li and confiscated multiple cold storage wallets and timepieces during a residence search. She was subsequently released under bail conditions. Authorities eventually determined no additional action would be pursued unless fresh evidence emerged.
Legal Battle Over Crypto Property Rights
This case presents a fundamental legal question: can Bitcoin be classified as property under current English legal frameworks?
Li’s legal representatives petitioned for case dismissal. They contended that Yuen’s primary allegation centered on conversion, a legal doctrine in England historically applicable exclusively to tangible property and incompatible with digital assets such as Bitcoin.
The presiding judge concurred that conversion was inapplicable. Nevertheless, Justice Cotter determined the proceedings could advance to trial based on alternative legal theories that might enable Yuen to reclaim the Bitcoin should his accusations be substantiated.
In an unrelated September 2024 incident, a physical altercation occurred between Ping and Li. Yuen subsequently entered guilty pleas to assault occasioning actual bodily harm plus two counts of common assault.
Yuen has additionally informed the court of his suspicion that the 71 Bitcoin addresses have been subjected to a dusting attack. These attacks involve transmitting minimal cryptocurrency amounts to wallets for tracking purposes and potentially identifying valuable holders for phishing schemes and additional fraudulent activities.
Judge: Evidence Is “Damning”
In November 2024, Yuen filed for an asset preservation injunction requesting the court freeze the cryptocurrency, formally recognize his ownership rights, and either restore the Bitcoin or compensate him with equivalent cash value.
Justice Cotter documented that Yuen possesses “a very high probability of success,” citing the audio documentation and the hardware discovered during Li’s residence search.
“The transcripts are damning,” Cotter stated, noting that Li provided no justification for the Bitcoin transfers.
Justice Cotter further advocated for an accelerated trial, characterizing it as “necessary given the security threats to, and volatility of value of, the Bitcoin.”


Bitcoin’s price climbed to a six-week peak earlier this morning, touching $76,000 after it broke above $70,000 last week. Despite retracing by nearly two grand since then, the asset is still up by $11,000 since its February 28 low when it plummeted immediately after the strikes in the Middle East began.
Now, though, there are more bullish hints ahead, as popular analyst Ali Martinez brought up a key signal that has led to all major BTC rallies in the past three years.
Funding Rates Turn Negative
The funding rates are periodic, small fee payments exchanged between traders holding short and long positions in perpetual futures contracts, keeping those prices aligned with the actual spot BTC price. When the rates are positive, this means that longs are paying shorts, and vice versa.
Although some consider positive rates to be bullish since BTC’s perp price is higher than the spot one as long positions dominate, Ali Martinez actually believes in the opposite and outlined historical examples to prove his theory. The analyst with almost 165,000 followers on X noted that BTC funding rates turning negative is “a signal that has preceded every major relief rally of the last 3 years.”
“Market sentiment is currently at a ‘peak fear’ reset. History shows that when the crowd pays to short, the local bottom is usually in. We’ve seen this script play out with surgical precision:
-
Dec 2022: from $17,800 to $24.8k (+39%)
-
Mar 2023: from $20,000 to $30,700 (+53%)
-
Aug 2023: from $26,400 to $73,000 (+176%)
-
Sept 2024: from $58,000 to $104,500 (+80%)
-
Apr 2025: from $94,700 to $111,600 (+18%)
-
June 2025: from $107,000 to $124,700 (+17%)”
After bitcoin’s breakout past $70,000, the funding rates have reset to -0.004%. The analyst believes smart money is “watching for the inevitable short squeeze” and if history is to keep that 100% strike rate on this indicator, the current dip is “the coiled spring for the next leg up.”
Did the Rally Take Place Already?
Martinez’s original post came as bitcoin’s price traded around $71,000. In the following 24 hours, though, the asset climbed to $76,000, hitting its highest price tag since early February. That’s a 7% gain in a day. The question is whether this was already the rally that he talked about, a claim that could have some substance given the fact that the relief pumps after the funding rates turned negative in the past couple of examples have declined in terms of percentages.
In addition, BTC’s latest moves are mostly impacted by the developments in the Middle East, so if something big is to occur there, more volatility could ensue almost immediately. Nevertheless, the cryptocurrency has outperformed all other asset classes, including gold, since the war began, which could be another positive sign for its short-term price moves.
The post The Metric That Preceded Every Bitcoin Rally Just Flashed Green: Is a BTC Surge Next? appeared first on CryptoPotato.

TLDR
- Solana experienced a 7%+ rally within 24 hours, touching $97.67 while the overall crypto market gained approximately 3.6%.
- The network’s total value locked increased by 25% throughout the past 30 days, demonstrating renewed investor confidence.
- SOL maintains trading above the $92 mark and its 100-hour simple moving average, with bullish support establishing at $94.
- Critical resistance points are positioned at $98 and $100, while downside support exists at $92 and $88.
- The token has appreciated over 40% since hitting its February bottom, as the RSI indicator advances toward 60 from previously oversold territory.
Solana has delivered an impressive 24-hour performance, rallying more than 7% to peak at $97.67 before experiencing a modest retracement to settle around the $95 zone. This upward movement coincides with a broader cryptocurrency market recovery that saw gains of approximately 3.6% during the identical timeframe.
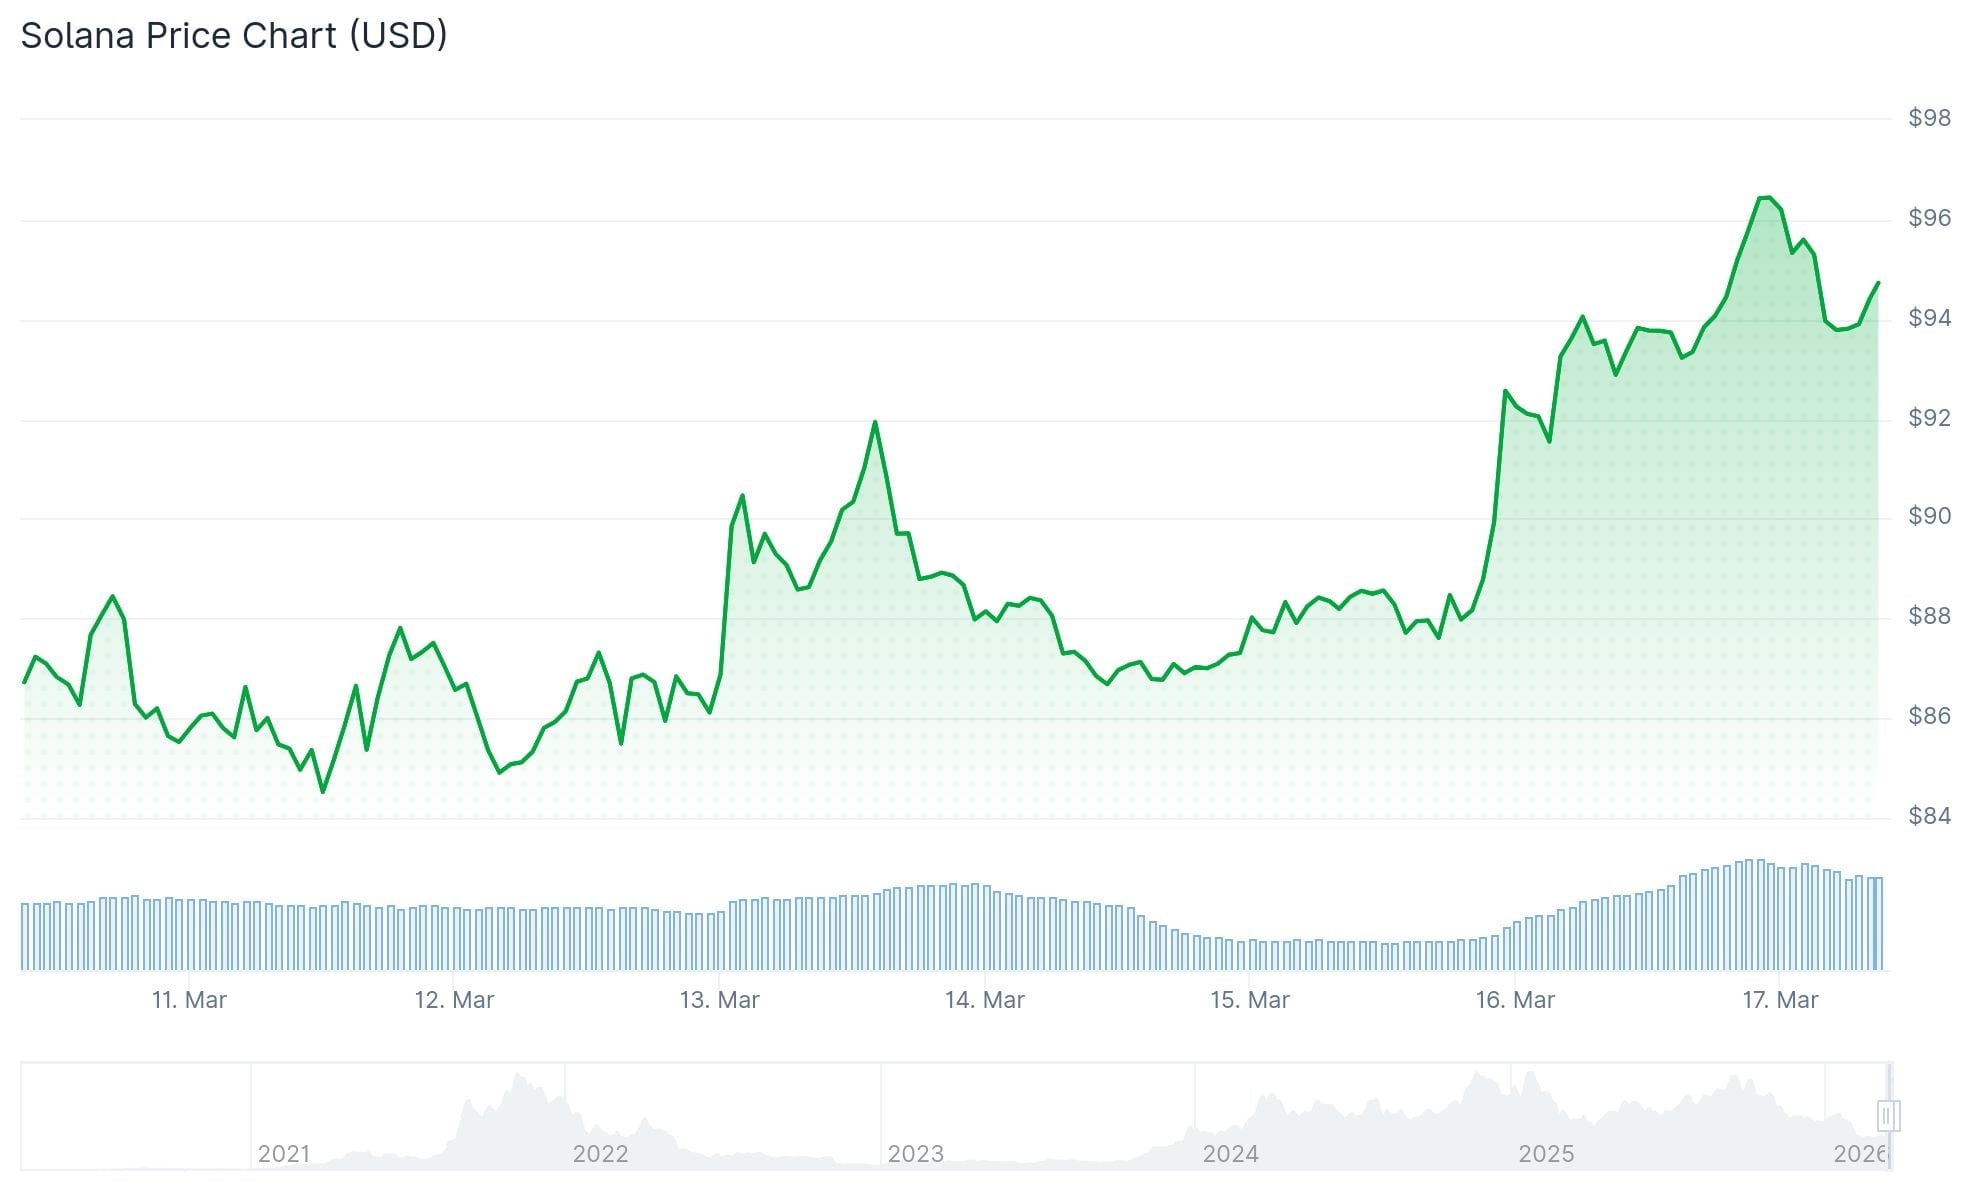
Currently, SOL maintains its position above the $92 threshold and trades above its 100-hour simple moving average. Technical analysis reveals a bullish trend line forming with critical support established at $94 on the hourly timeframe, according to data sourced from Kraken.
Critical Resistance Zones Emerge
The cryptocurrency now encounters resistance around the $95 level, with the subsequent barrier positioned at $98. The psychologically significant $100 threshold represents the primary challenge ahead. Successfully breaking and closing above $100 could pave the way toward $105, with potential extension to $112.
Conversely, should SOL fail to maintain support above $92, the next cushion sits at $88. Breaking beneath $88 would likely bring the $82 level into play.
While the recent upswing correlates with broader market stabilization, Solana has notably outpaced the majority of alternative top-10 cryptocurrencies during this same period.
On-Chain Metrics Validate Price Action
The total value locked within Solana’s ecosystem expanded by 25% over the preceding 30-day period. This metric, which quantifies the amount of capital deployed within a blockchain’s infrastructure, indicates accelerating platform utilization when showing this magnitude of growth.
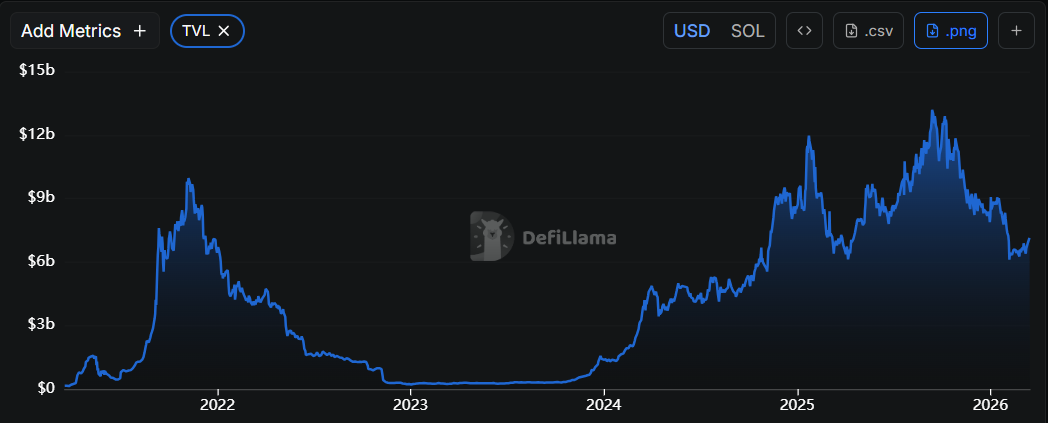
Continuous developer engagement and consistent decentralized application deployments across the network have persisted. These fundamental on-chain indicators have contributed to supporting the current bullish price trajectory.
Solana has appreciated more than 40% from its February trough. The Relative Strength Index has recovered toward the 60 threshold after rebounding from oversold conditions experienced earlier this year.
Price action has been oscillating within a range bounded by $80 support and $95 resistance throughout recent weeks, creating a consolidation formation that market participants frequently monitor for potential breakout opportunities.
The 200-day moving average continues to reside above present price levels, suggesting the long-term directional bias hasn’t completely reversed yet.
SOL is currently valued at approximately $94.62, commanding a market capitalization near $54 billion, with a 52-week trading range spanning from $70.61 to $252.78.

Key Highlights
- XRP posted an 11% gain over the past seven days, reaching $1.53 and surpassing BNB to retake the fourth position by market capitalization at $93.4 billion.
- Binance futures open interest increased 59% since October 2025, reaching 353 million XRP as traders add leveraged positions during the uptrend.
- Veteran holders added more than 351 million XRP on March 1 alone, marking the most significant daily accumulation in recent months.
- XRP exchange-traded funds experienced $28 million in net withdrawals during the previous week as institutional participation declined while retail activity strengthens.
- The $1.55 price level continues to serve as significant resistance, with recent bearish price action suggesting potential for short-term correction.
XRP experienced notable upward momentum throughout the past week, advancing 11% to settle near $1.53 as of March 17, 2026. This price action enabled the digital asset to leapfrog BNB, reclaiming the fourth position among cryptocurrencies by total market value at $93.4 billion.
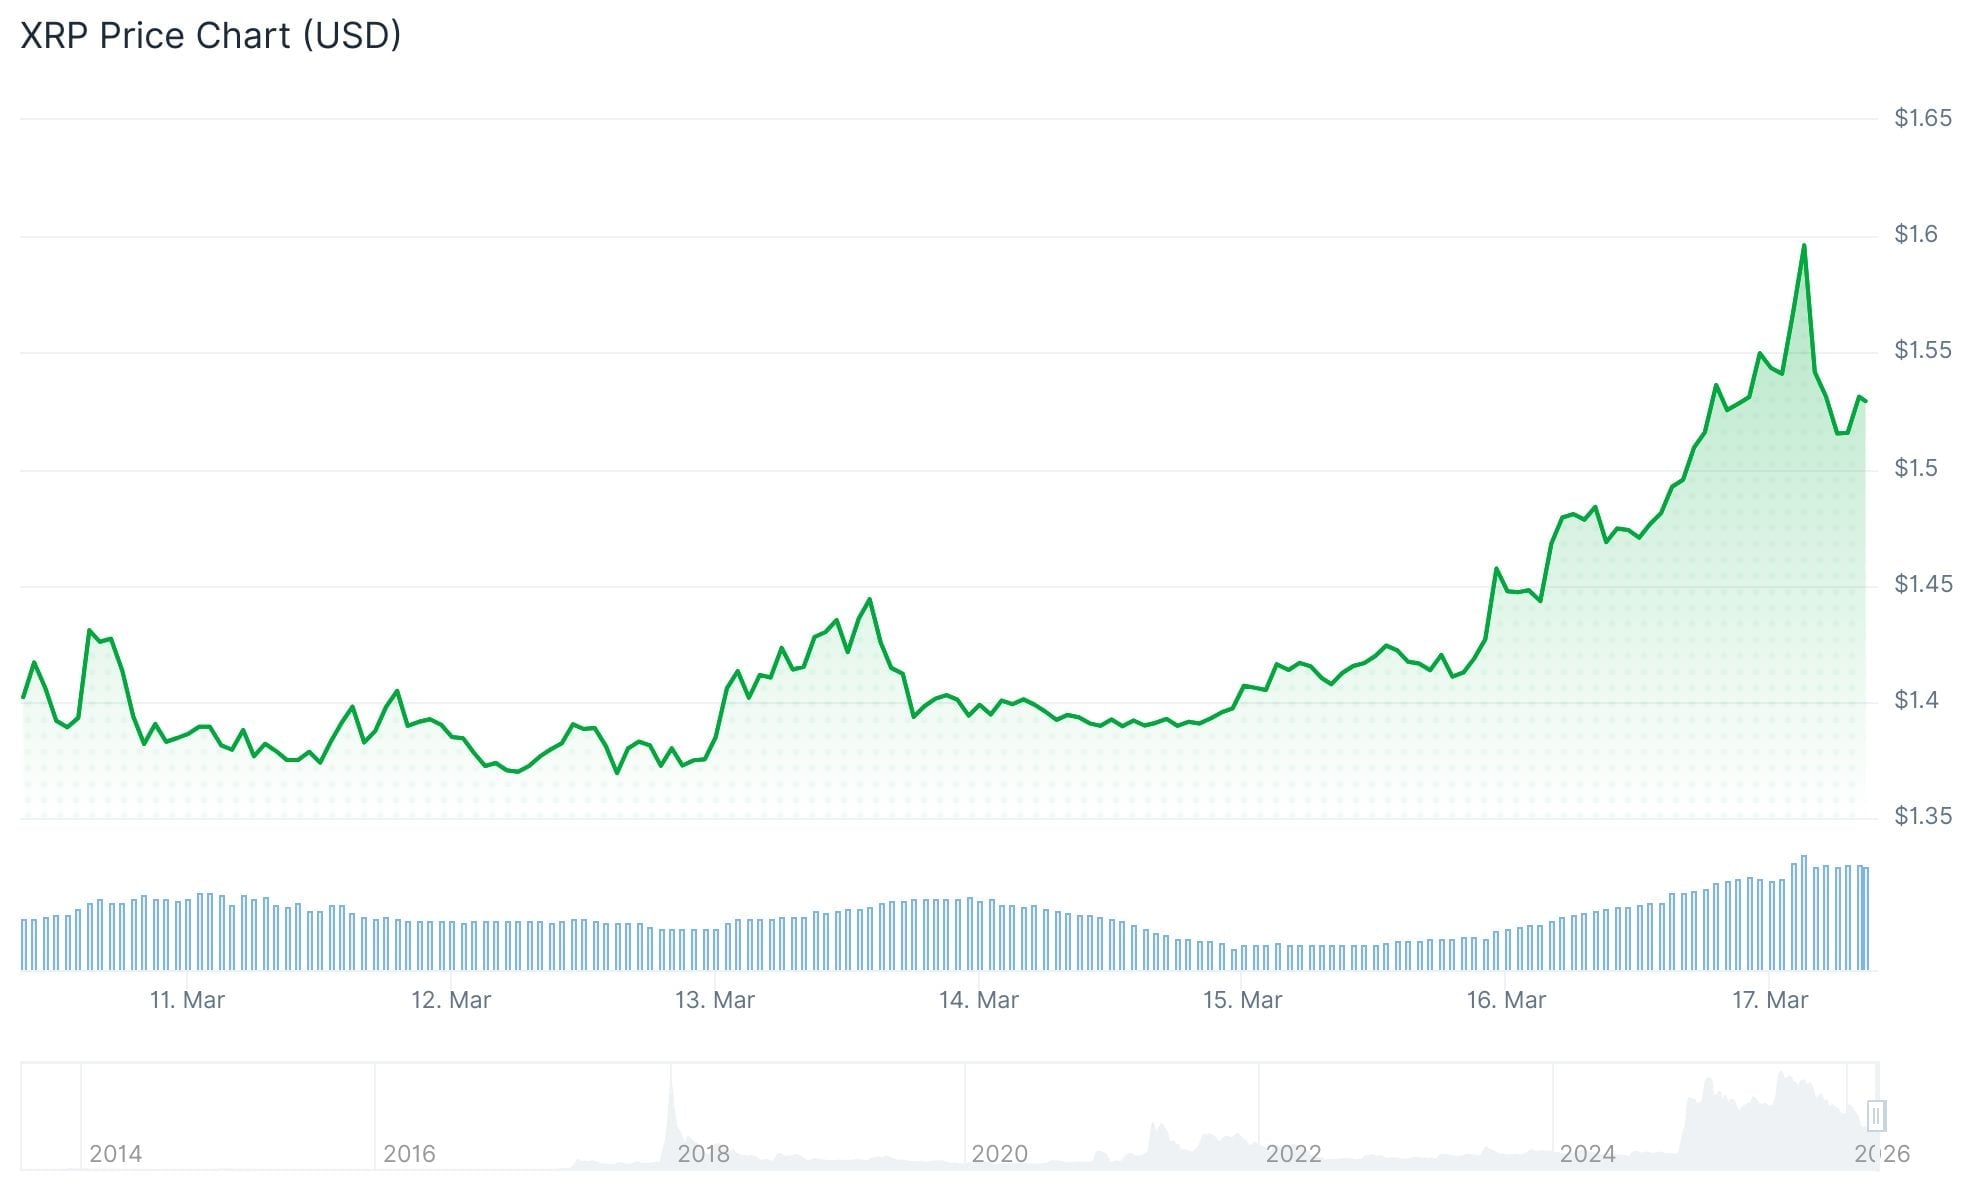
Daily transaction volume surged by 125% to reach $3.22 billion as the token breached a critical resistance threshold around $1.40. This price point had capped upward movement for several weeks, making the breakthrough particularly noteworthy for market participants.
This upward movement unfolds against a backdrop of significant macroeconomic stress. Brent crude oil continues trading near $100 per barrel following persistent supply chain complications in the Strait of Hormuz related to the Iran situation, which has now extended into its third week.
Long-Term Investors Increase Positions Despite Global Uncertainty
Contrary to typical risk-off behavior during periods of macroeconomic stress, XRP’s established holders have intensified their accumulation activities.
Data from Glassnode reveals that long-term holders accumulated more than 351 million XRP on March 1, occurring just one day following the escalation of the Iran conflict. This represents the most substantial single-day accumulation recorded in several months.
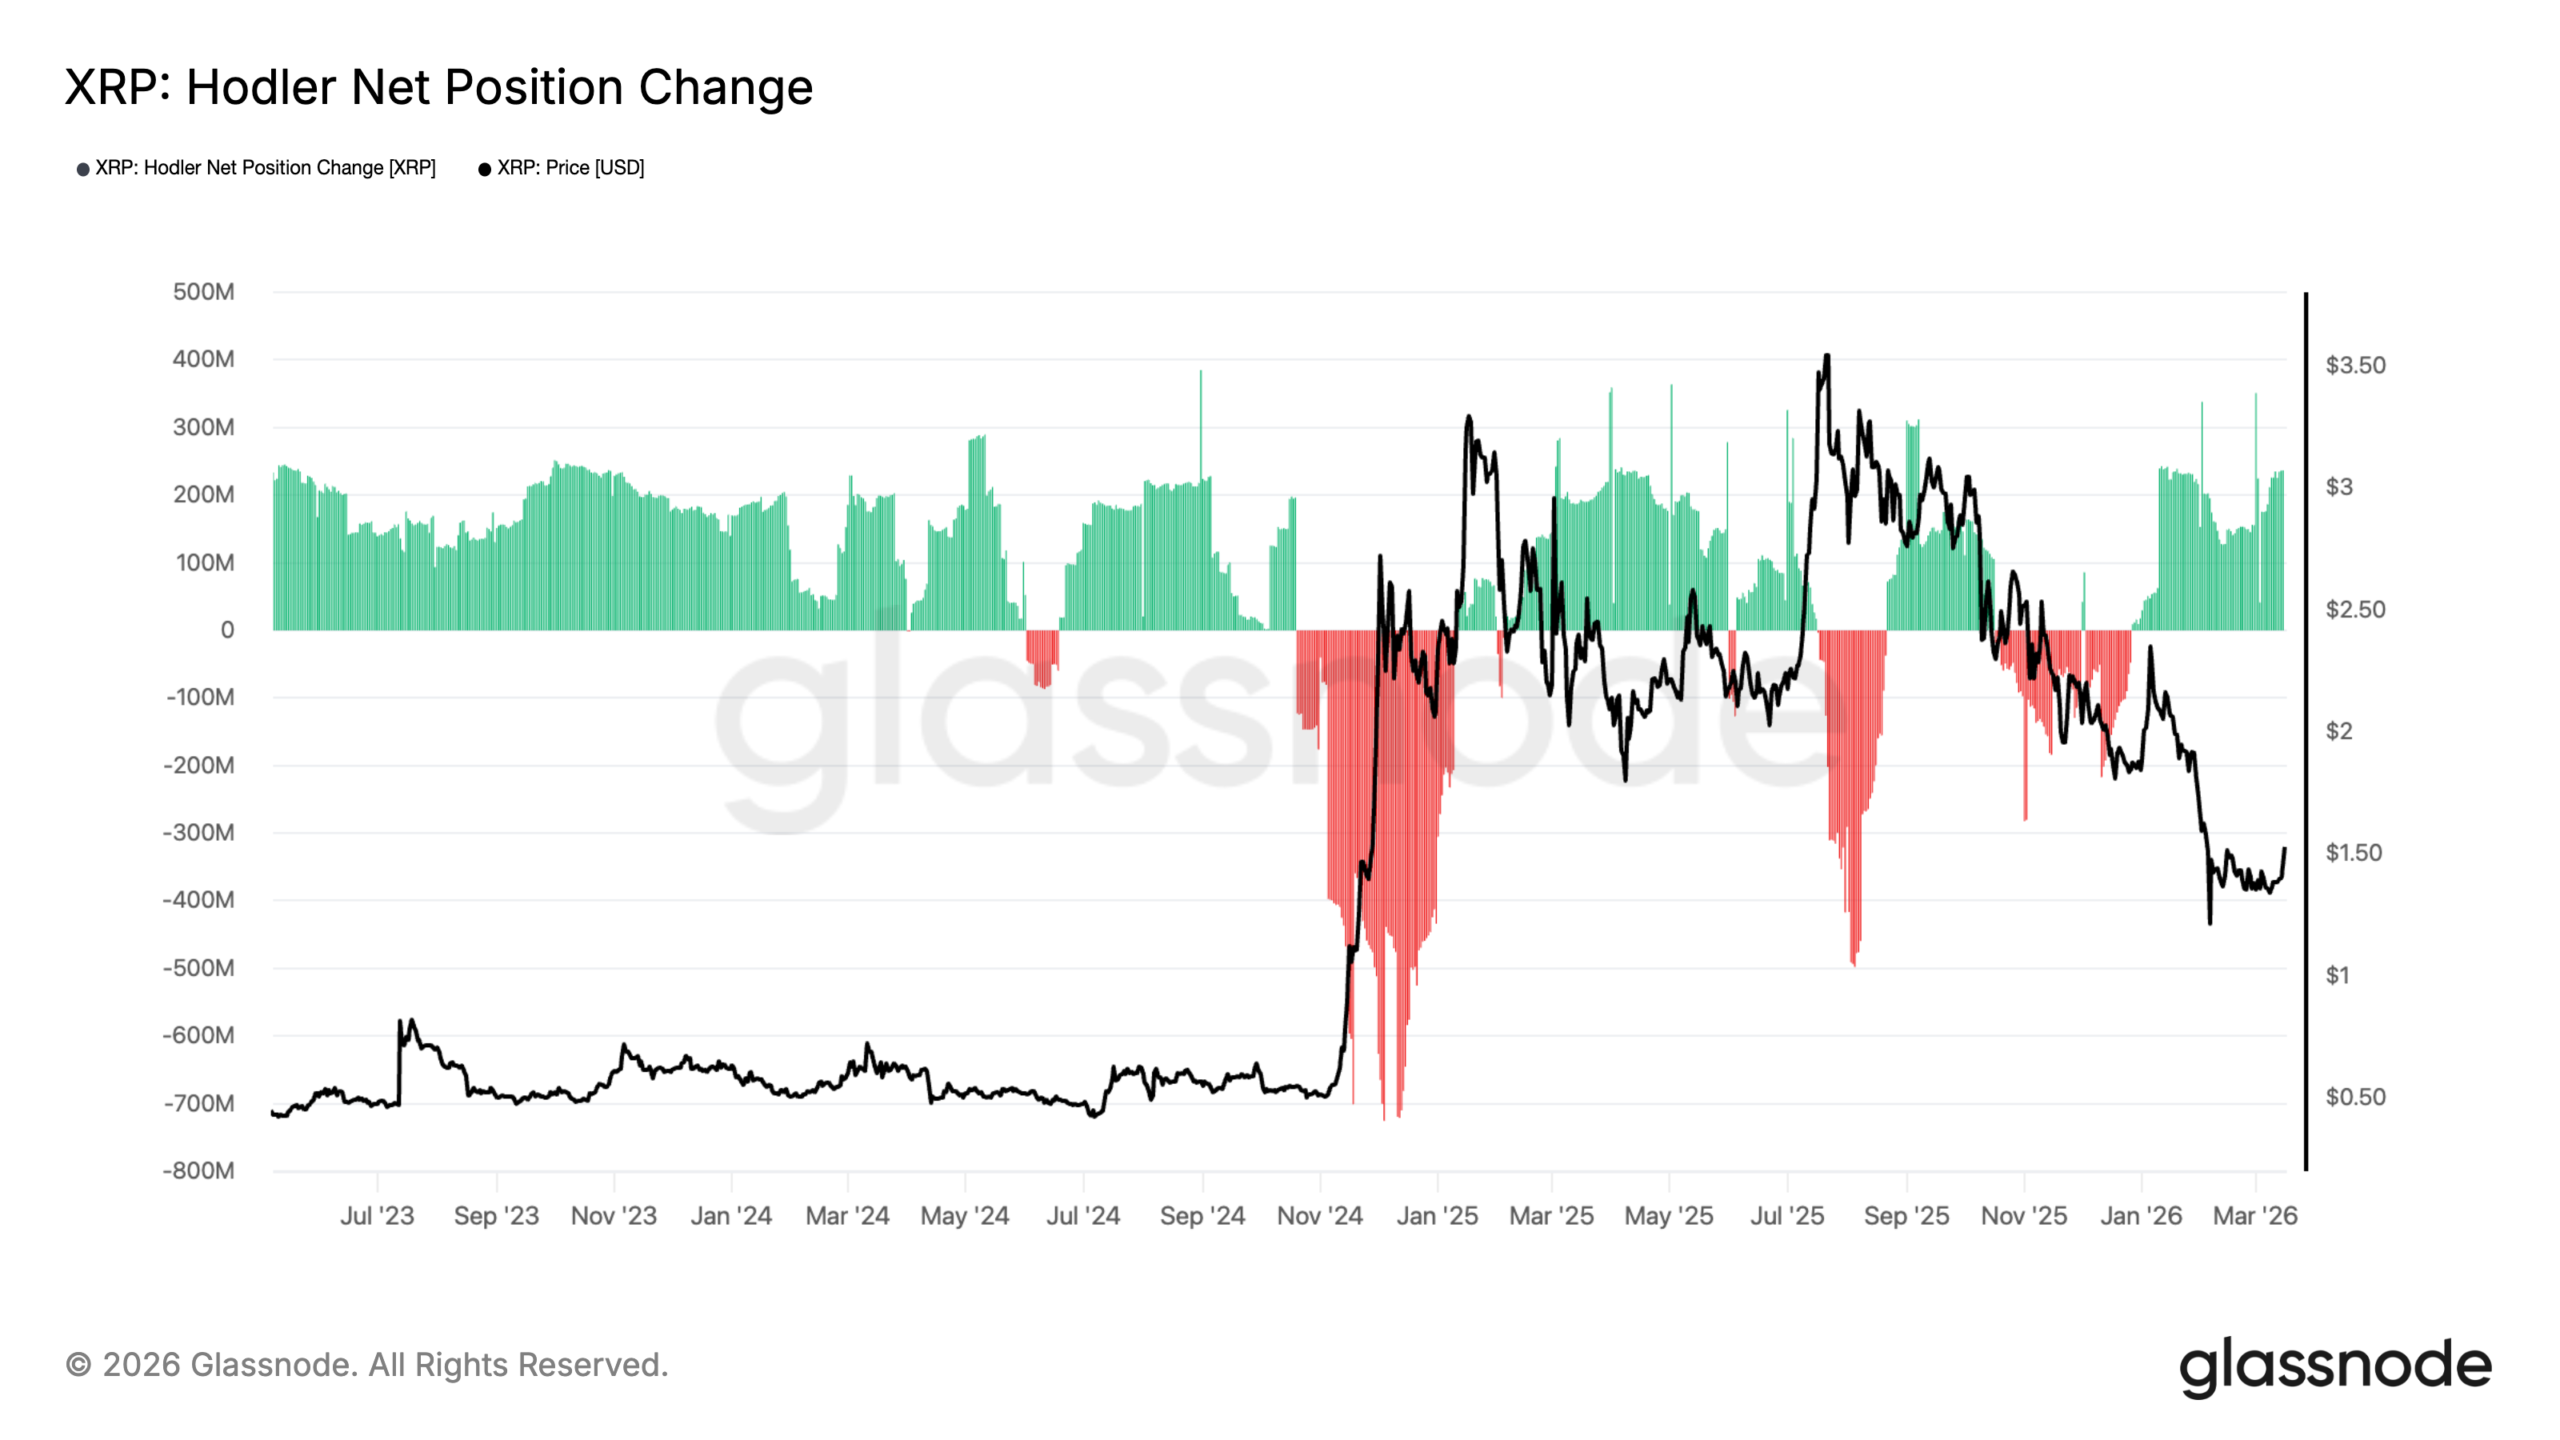
This accumulation pattern has persisted throughout the subsequent period, with consistent net purchasing driving the indicator to its strongest monthly reading since May 2025. Such on-chain behavior typically emerges during market recovery cycles.
Retail participation is showing renewed strength as well. XRP futures open interest expanded to $2.66 billion on Monday, climbing from $2.56 billion recorded the previous day. The Fear & Greed Index improved to 23 from 8 the week prior, although it continues to reflect extreme fear conditions.
Institutional Flows and Token Distribution Controversy
Institutional capital has shifted away from XRP products recently. Investment vehicles tracking XRP registered $76 million in net outflows last week, with exchange-traded funds representing $28 million of that total. Monthly outflows have accumulated to $133 million, reducing total assets under management to $2.4 billion.
Ripple Labs is simultaneously confronting scrutiny regarding its token distribution practices. Industry observers have questioned whether the company’s sale of premined XRP to retail participants, followed by deployment of those funds toward acquisitions, non-XRP initiatives, and equity buybacks, creates an imbalanced value proposition.
Ripple’s Chief Technology Officer David Schwartz has addressed these concerns, though detractors maintain the current structure disproportionately advantages Ripple Labs shareholders over XRP token holders.
From a chart perspective, XRP encountered rejection near its 50-day exponential moving average at $1.55. The digital asset continues trading beneath both its 50-day and 200-day exponential moving averages. A definitive close above $1.60 would be required to signal a meaningful trend reversal.
Binance open interest registered 353.49 million XRP on March 17, nearing but remaining below the pre-correction high of 400 million observed in September 2025.

TLDR
- BTC reached an intraday peak of $75,912 before retreating, with the movement attributed to derivatives mechanics instead of organic demand
- The cryptocurrency sector experienced widespread gains exceeding 5% across major tokens in the previous seven days, marking the strongest coordinated advance since pre-Iran conflict
- Bitcoin spot ETF products recorded $767 million in net inflows during the past week, continuing a three-week streak of positive flows
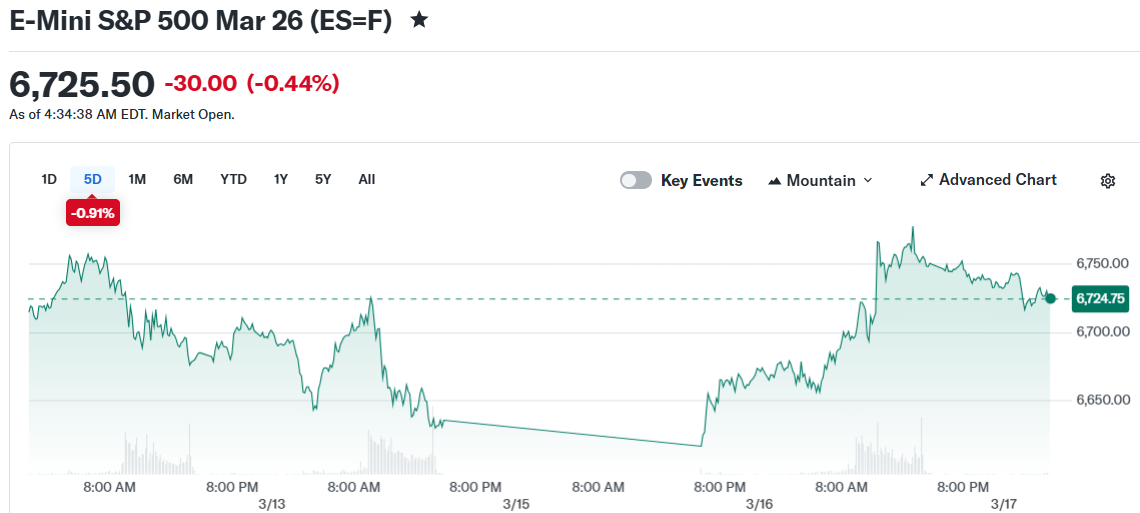
- Equity index futures declined Tuesday following Monday’s recovery, with the S&P 500, Dow, and Nasdaq futures each falling approximately 0.5%
- Market attention centers on Wednesday’s Federal Reserve policy statement, with rate-hold probability exceeding 99%
Bitcoin pushed toward the $75,000 threshold on Tuesday for the first time in recent weeks before reversing course. Market analysts suggest the price action reflected technical factors rather than genuine demand expansion.
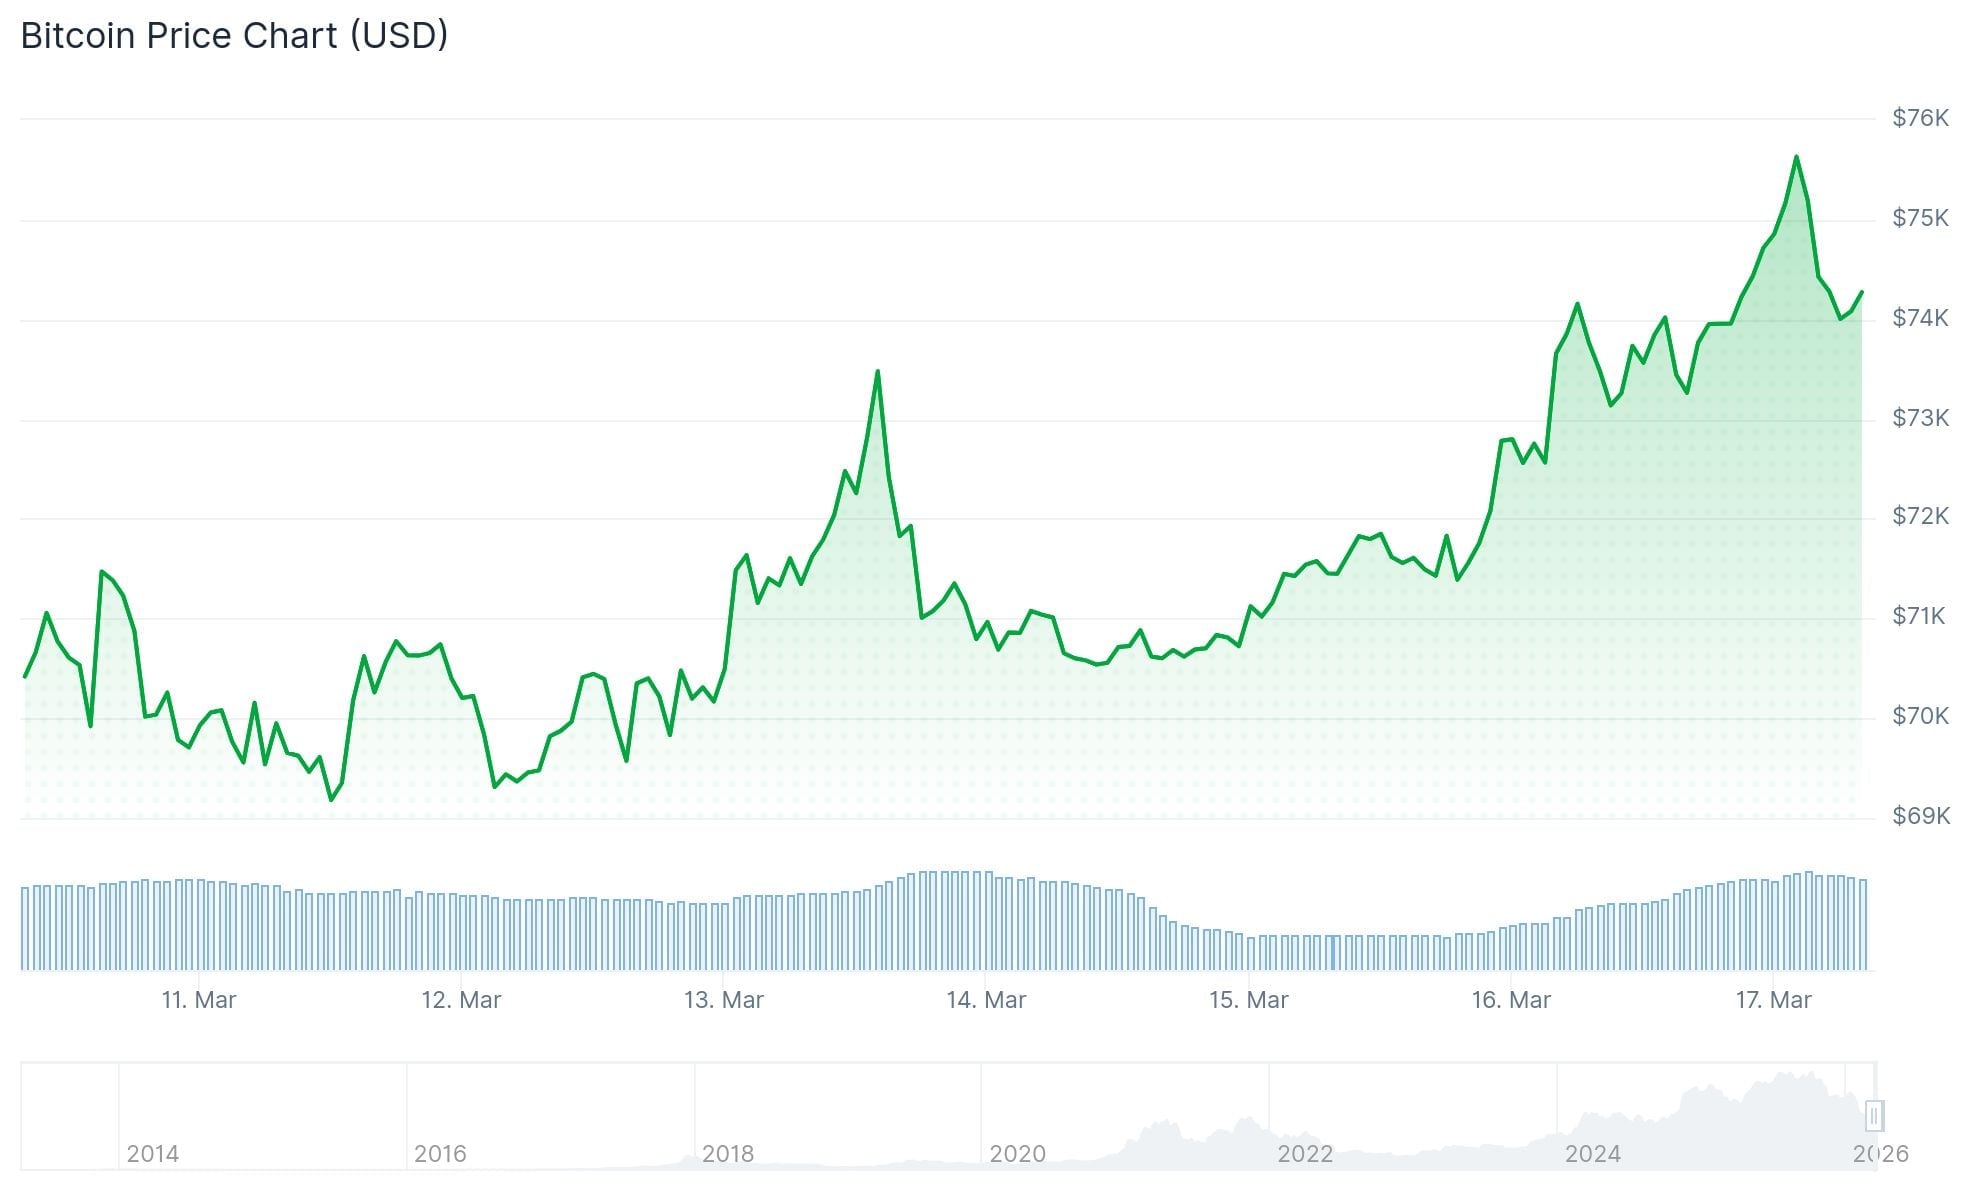
Chart watchers observed BTC reaching an intraday high of $75,912 during early Tuesday trading hours before retreating to approximately $74,372. CoinDesk market specialists attributed the upward movement to derivatives positioning dynamics—particularly the expiration of substantial put options contracts at the $60,000 strike price, compelling market makers to purchase spot bitcoin for hedging purposes.
The critical price point remains $74,400, which previously served as a support threshold in April 2025. Bitcoin’s rapid pullback beneath this level indicates insufficient buyer conviction to sustain elevated prices without fundamental catalysts.
Despite the intraday volatility, digital asset markets have demonstrated impressive strength throughout the week. Ether climbed 13.3% to reach $2,316. XRP advanced 11% to $1.53. Solana appreciated 9.7% to $93.92. Dogecoin increased 9.5%, reclaiming the $0.10 level. BNB rose 5% to $676.
Market observers characterize this as the most comprehensive sustained cryptocurrency advancement since the outbreak of the Iran conflict.
ETF Inflows Signal Returning Institutional Interest
The optimistic sentiment partly stems from capital allocation into bitcoin exchange-traded products. Spot bitcoin ETFs accumulated approximately $767 million in net inflows throughout the previous week, based on data from CF Benchmarks analyst Mark Pilipczuk.
This represents the third consecutive week of positive capital flows, reversing the trend from earlier in 2025 when these vehicles experienced outflows exceeding $3 billion across five weeks.
Bitcoin has also narrowed its performance differential with gold. Through mid-March on a year-to-date basis, the gold ETF GLD appreciated roughly 16% while bitcoin ETF IBIT declined approximately 19%. However, from early March forward, bitcoin has exceeded gold’s returns by 13.2%.
The 90-day correlation coefficient between these two assets shifted from -0.27 to +0.29 during a six-month period, rekindling discussions about bitcoin’s role as “digital gold.”
Stock Futures Dip After Monday Rebound
Equity markets experienced contrasting momentum. Index futures linked to the Dow Jones Industrial Average, S&P 500, and Nasdaq 100 each declined between 0.4% and 0.5% during Tuesday’s pre-market session after Wall Street posted gains Monday.
Monday’s advance followed a retreat in crude oil prices. Brent crude settled nearly 3% lower at marginally above $100 per barrel. West Texas Intermediate declined more than 5% to close at $93.50.
Energy markets have exhibited heightened volatility since military operations by the US and Israel against Iran commenced. Treasury Secretary Scott Bessent indicated Iranian tanker traffic continues through the Strait of Hormuz, though President Trump’s proposal for multinational escort operations has received no commitments.
Nvidia commanded attention at its GTC conference where CEO Jensen Huang revealed multiple partnership agreements and projected $1 trillion in semiconductor sales through late 2027.
Quarterly financial results from Tencent, DocuSign, and Oklo are scheduled for Tuesday.
The Federal Reserve commences its two-day policy meeting today, with the official determination scheduled for Wednesday. CME FedWatch data indicates a rate-hold probability surpassing 99%. February’s employment report showed 92,000 job losses, while crude oil prices exceeding $100 per barrel maintain inflation concerns ahead of Chairman Powell’s media briefing.


While the March 30 event is canceled, OpenSea will hold a future product update session to showcase mobile and other features.
OpenSea CEO Devin Finzer confirmed that the much-anticipated debut of the SEA token, which had been scheduled for March 30th, will now be postponed. Acknowledging the delay in a detailed update, Finzer explained that the decision reflects current market challenges in the cryptocurrency sector.
He also noted that token launches occur only once.
SEA Token Debut Pushed Back
The delay stems from a decision by the OpenSea Foundation, which Finzer said has chosen to push back the timeline to ensure all aspects of the project are fully prepared. Finzer explained that the move was deliberate, while also recognizing that it may disappoint users. The exec’s tweet read,
“The reality is that market conditions are challenging across crypto right now, and $SEA only launches once. OpenSea Foundation could force the original date, or we could ensure every piece is in place and make this moment what this community deserves.”
As part of the update, Finzer spoke about several measures designed to address user concerns and maintain engagement. The company will end the current rewards wave. The ongoing phase will be the last. Additionally, the NFT player is offering an optional refund of platform fees retained during rewards waves 3 through 6, which followed the initial Q1 launch commitment.
Users who opt for a refund will have their Treasures, rewards previously issued during these waves, removed from their accounts. For Treasures that users continue to hold, Finzer confirmed the Foundation will still consider them at the token generation event (TGE), independent of historical allocation activity.
Finzer also announced a temporary fee reduction to encourage platform activity. Starting March 31st, OpenSea will set token trading fees to zero for a period of 60 days. The promotion will cover trading across multiple features, including cross-chain tokens, the mobile app, and perpetual contracts. After the 60-day period, a revised fee structure is planned to offer more competitive rates for consistent traders.
While the March 30th launch event will no longer take place, OpenSea plans to host a future event focused on product updates. Finzer revealed that the early reactions to the platform’s mobile application were fairly positive.
You may also like:
Controversies
The delay comes amid previous challenges faced by the platform. Last February, the NFT marketplace suspended its new airdrop reward system following intense, sharp user backlash. Launched with the OS2 beta, the experience points (XP) mechanism was aimed to qualify users for the upcoming SEA token airdrop but drew fire for allegedly promoting wash trading, favoring fee revenue over ecosystem builders, and undermining NFT sustainability.
Prior to that, OpenSea’s 2022 breach exposed 7 million emails through its service provider, including those of major players such as Binance’s Changpeng “CZ” Zhao.
Binance Free $600 (CryptoPotato Exclusive): Use this link to register a new account and receive $600 exclusive welcome offer on Binance (full details).
LIMITED OFFER for CryptoPotato readers at Bybit: Use this link to register and open a $500 FREE position on any coin!

Panel approves National Storage’s $10m build in Wattle Grove

Here’s The Next Price Target as Bulls Take Charge

Richard Osman’s House Of Games Unveils Michael Sheen As New Host

Smart energy pays enters the US market, targeting scalable financial infrastructure

Why Israel is blocking foreign journalists from entering

Bitcoin: We’re Entering The Most Dangerous Phase

2 of the BEST financial tips that’ve helped me understand money young! financialliteracy #moneytips

They’re Keeping XRP Down Until THIS Happens

Qatar’s Airspace Is Closed. 140 Emergency Flights. The Gulf’s Financial Capital Is Emptying Out.
-
 Tech6 days ago
A 1,300-Pound NASA Spacecraft To Re-Enter Earth’s Atmosphere
-
Crypto World3 days ago
HYPE Token Enters Net Deflation as HyperCore Buybacks Outpace Staking Rewards
-

 Business7 days ago
ExxonMobil seeks to move corporate registration from New Jersey to Texas
-

 Fashion4 days ago
Weekend Open Thread: Addict Lip Glow
-

 Tech7 days ago
ChatGPT will now generate interactive visuals to help you with math and science concepts
-
Sports3 days ago
Why Duke and Michigan Are Dead Even Entering Selection Sunday
-

 NewsBeat6 days ago
Residents reaction as Shildon murder probe enters second day
-

 Business2 days ago
Search for Savannah Guthrie’s Mother Enters Seventh Week with No Arrests
-

 Business6 days ago
Search Enters Sixth Week With New Leads in Tucson Abduction Case
-

 Business3 days ago
US Airports Launch Donation Drives for Unpaid TSA Workers as Partial Government Shutdown Enters Fifth Week
-
Crypto World3 days ago
Coinbase and Bybit in Investment Talks: Could Bybit Finally Enter the US Crypto Market?
-

 NewsBeat6 days ago
I Entered The Manosphere. Nothing Could Prepare Me For What I Found.
-

 Sports6 days ago
PWHL, Senators discussing plan to keep Charge in Ottawa
-

 Business3 days ago
Country star Brantley Gilbert enters growing non-alcoholic beer market
-

 Business23 hours ago
Australian shares drop as Iran war enters third week
-

 Sports4 days ago
College Basketball Best Bets: Conference Tournament Semifinal Picks
-

 Crypto World24 hours ago
Crypto Lender BlockFills Enters Chapter 11 with Up to $500M in Liabilities
-

 Crypto World7 days ago
Will Chainlink price reclaim $10 amid volatility squeeze?
-

 Tech6 days ago
Clarity as strategy
-

 Politics6 days ago
Trump Says Middle East Is ‘Very Lucky’ That He’s President


You must be logged in to post a comment Login