
Crypto World
Nvidia (NVDA) Shares Set a March High

Nvidia shares experienced heightened volatility yesterday, with the price jumping to a March high during the Nvidia GTC 2026 conference, where Jensen Huang made several major announcements. According to media reports:
→ Nvidia unveiled a next-generation platform named after the astronomer Vera Rubin. The new chips are designed for “agentic AI” (AI agents).
→ The company expects total orders for current-generation AI systems (Blackwell) and next-generation systems (Vera Rubin) to reach $1 trillion by 2027. This is double the company’s previous $500 billion forecast announced earlier.
→ Huang also noted that market demand is shifting. While chips were previously purchased mainly for training AI models, demand is now increasingly driven by companies such as OpenAI, Meta and Anthropic, which must serve hundreds of millions of users in real time.
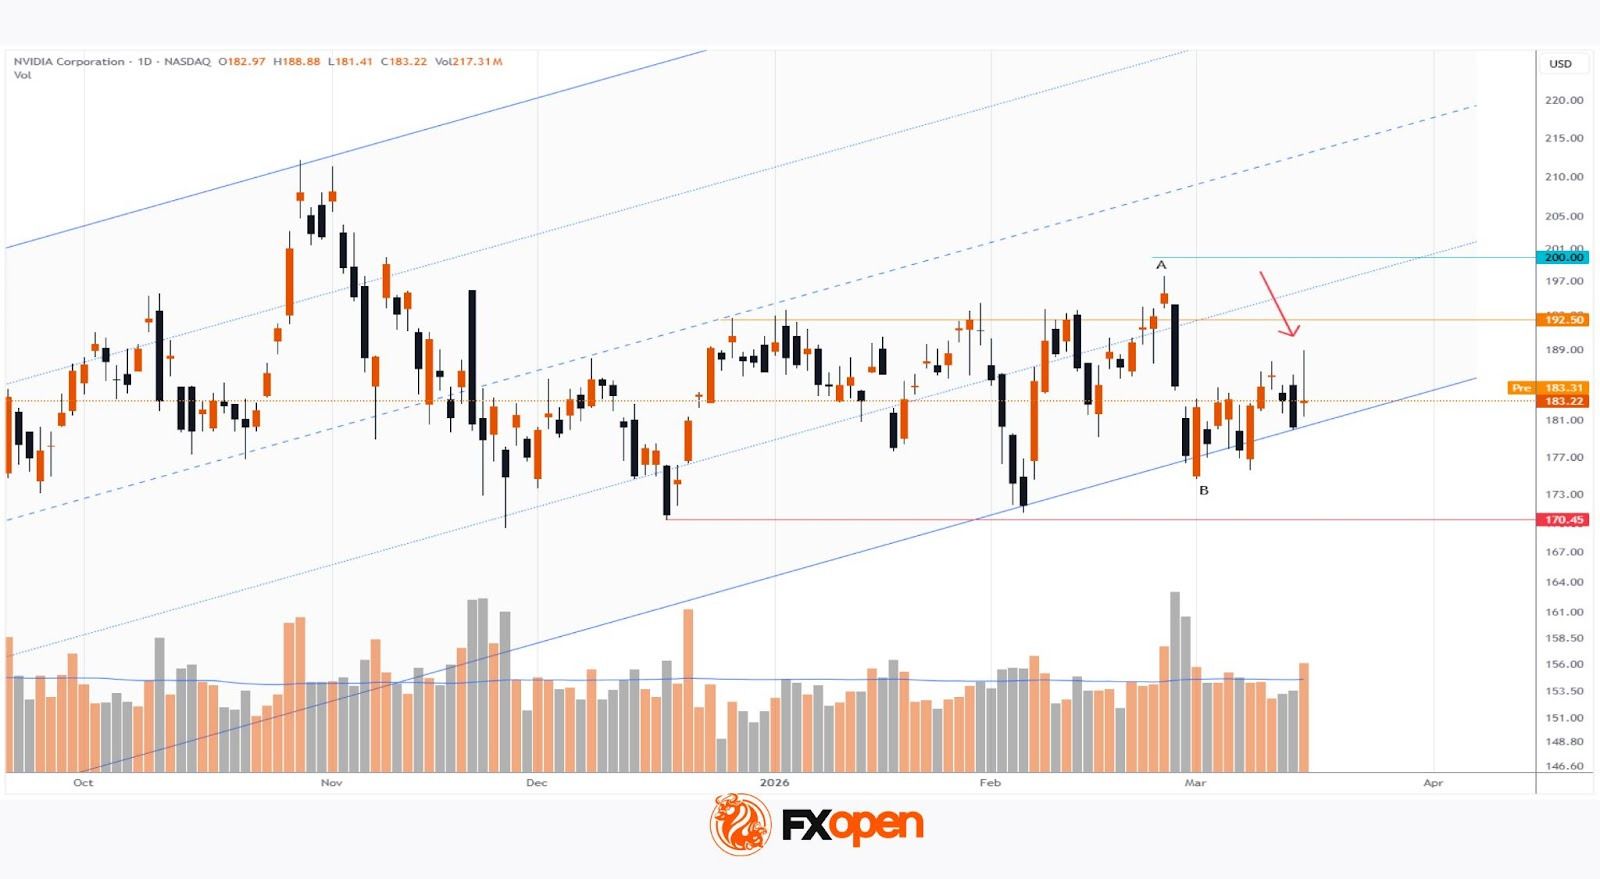
As the NVDA chart shows, the share price rose above the $188.50 level, but later pulled back, which may suggest excessive optimism among buyers and aggressive selling pressure.
Technical Analysis of Nvidia (NVDA)
On the morning of 26 February, while analysing NVDA price movements following the quarterly earnings release, we:
→ updated the long-term ascending channel (which remains intact);
→ pointed to the negative experience of other tech giants earlier in 2026, whose shares rallied briefly after earnings before turning lower (for example, Meta);
→ suggested that if bulls wanted to confirm control of NVDA, it would be important to keep the price above the $192.50 level.
During the main trading session that same day, the $192.50 level was broken by bears on a wide candle accompanied by rising volumes, confirming these concerns. Moreover, the downward momentum continued the following day, eventually leading to the A→B swing.
Overall, bulls still have reasons to remain calm, as:
→ the fundamental backdrop remains optimistic;
→ the lower boundary of the ascending channel continues to act as strong support.
However, the NVDA price chart also presents some warning signs:
→ peak A may represent a bull trap;
→ yesterday’s candle with a long upper shadow could also signal a similar trap.
If this proves to be the case, a test of the lower boundary of the channel would be a logical next step. Such a scenario could significantly alter sentiment in the NVDA stock market.
Buy and sell stocks of the world’s biggest publicly-listed companies with CFDs on FXOpen’s trading platform. Open your FXOpen account now or learn more about trading share CFDs with FXOpen.
This article represents the opinion of the Companies operating under the FXOpen brand only. It is not to be construed as an offer, solicitation, or recommendation with respect to products and services provided by the Companies operating under the FXOpen brand, nor is it to be considered financial advice.


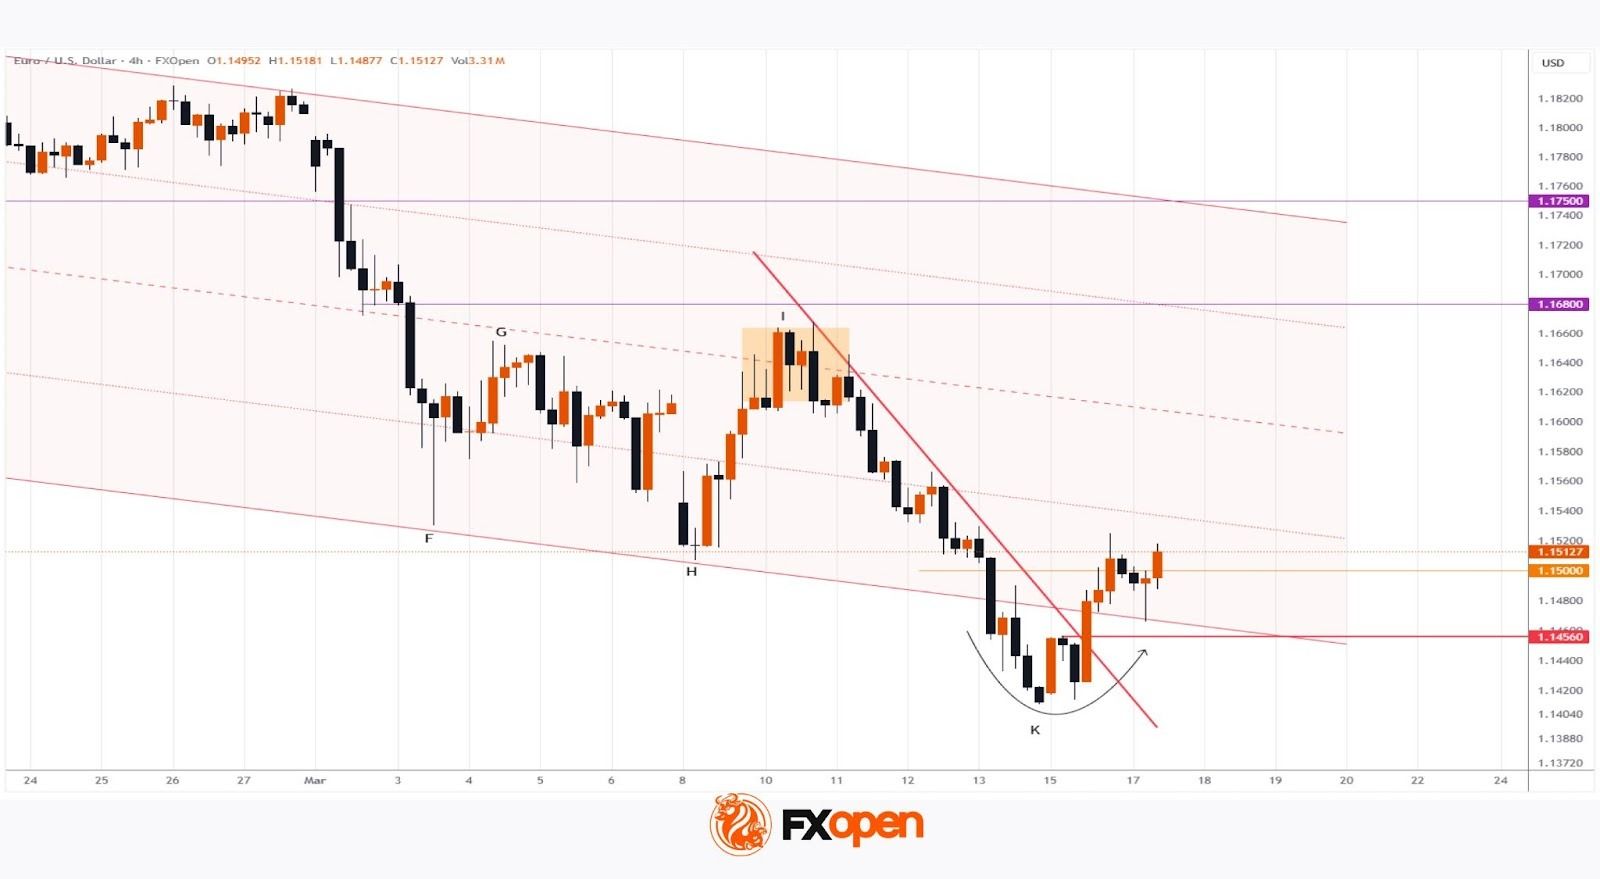
On 10 March, analysing the EUR/USD chart, we:
→ considered the long-term descending channel, which remains relevant;
→ noted that the sequence of lower lows A–H was broken with the appearance of a higher peak I, with 1.1680 potentially acting as resistance.
At peak I, bulls exhausted their strength: after forming a consolidation zone near the channel’s median, bears regained control and pushed the price to a new yearly low, driven by a bearish fundamental backdrop.
Tomorrow, the Fed is expected to release its interest rate decision, while the ECB will issue comments the day after. These events could significantly shift market sentiment regarding EUR/USD, and current price behaviour suggests that bulls may attempt a comeback.
Technical Analysis of EUR/USD
Note the following:
→ The descending trendline from last week has been breached; the market is holding above the breakout level around 1.14560.
→ The pair is recovering from oversold territory just below the lower boundary of the channel. The psychological level 1.1500 may provide support.
Thus, traders should consider the scenario in which EUR/USD’s strong movement on Monday–Tuesday is confirmed by upcoming central bank news.
Trade over 50 forex markets 24 hours a day with FXOpen. Take advantage of low commissions, deep liquidity, and spreads from 0.0 pips (additional fees may apply). Open your FXOpen account now or learn more about trading forex with FXOpen.
This article represents the opinion of the Companies operating under the FXOpen brand only. It is not to be construed as an offer, solicitation, or recommendation with respect to products and services provided by the Companies operating under the FXOpen brand, nor is it to be considered financial advice.
Bitcoin (BTC) risks turning its rebound into a classic “bull trap” as the price rejects at strong resistance.
Key points:
-
Bitcoin faces flat Coinbase spot demand and an open interest divergence as prices rise above $75,000.
-
This risks ending the rebound due to structural weakness, analysis warns.
-
Any push higher toward $80,000 will be “challenging.”
BTC market lacks “spot buying support”
New research from onchain analytics platform CryptoQuant released on Tuesday warns that the recent BTC price rebound may collapse.
“The Bitcoin market is currently exposing a critical structural vulnerability as it transitions from a healthy spot-led regime to an overheated rally driven primarily by derivatives,” contributor Easy On Chain wrote in a QuickTake blog post.
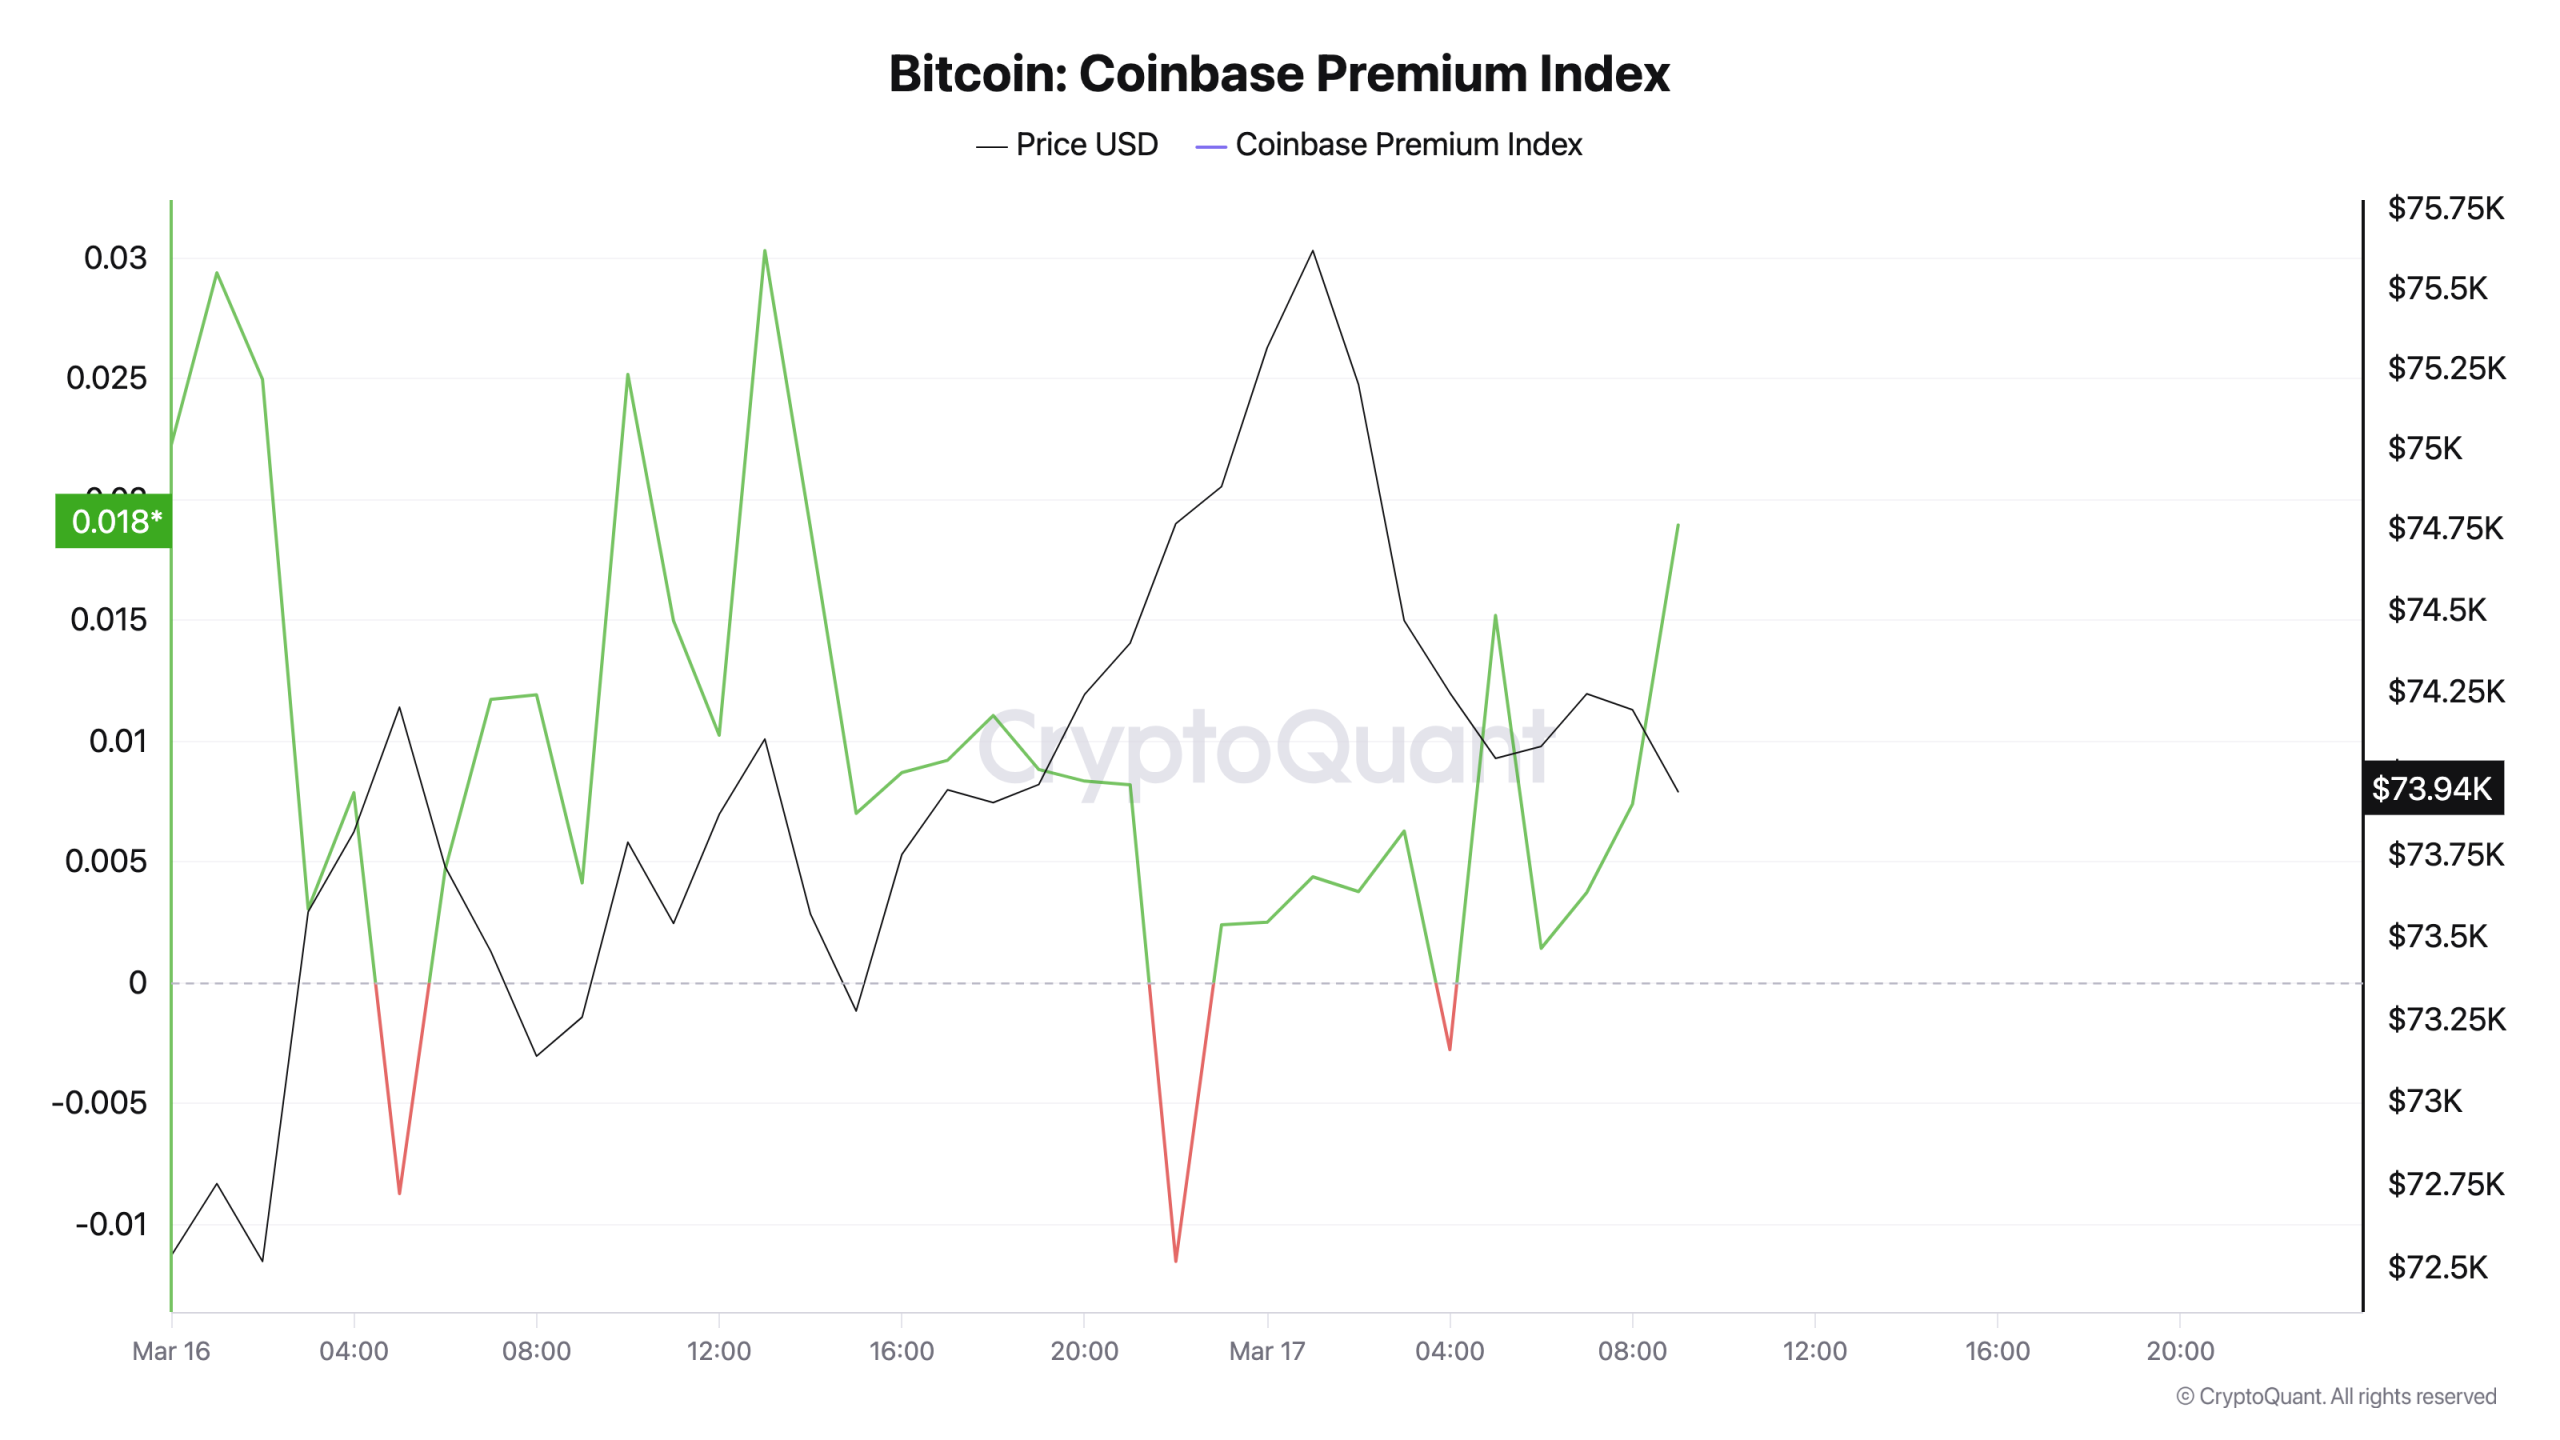
Several factors support the theory, including the Coinbase Premium Index — the difference in price between Coinbase’s BTC/USD and Binance’s BTC/USDT pairs.
Despite BTC/USD hitting six-week highs, the index continues to dip into negative territory, pointing to a lack of US spot demand.
“In this absence of spot-buying support, we are witnessing an extreme decoupling between investor cohorts where smart money is tactically distributing its supply,” Easy On Chain continued.

Fellow CryptoQuant contributor MAC_D agreed, drawing a clear distinction between old and new investors.
“Recent on-chain data shows that OG investors are distributing, while new investors are entering the market, indicating a clear transfer of ownership,” they wrote in a separate Quicktake post.
The core issue, however, is with open interest (OI), which shows the market in a precarious situation.
“On the 1-hour timeframe, a divergence between price and open interest is emerging. While the spot market shows strength, futures traders appear reluctant to take on additional risk,” MAC_D continued.
“If this lack of bullish positioning in the futures market continues, the current move could turn into a bull trap.”

Bitcoin price upside will be “challenging”
As Cointelegraph reported, Bitcoin faces a wall of selling pressure in the mid-$70,000 zone, which coincides with old local lows from April 2025.
Related: $58K BTC price still in play? Five things to know in Bitcoin this week
Data from CoinGlass shows price stalling midway through that ask-liquidity at $76,000 before reversing.

Market participants thus remain level-headed when it comes to a broader market recovery.
In his latest X analysis, Keith Alan, cofounder of trading resource Material Indicators, referenced various moving average (MA) trend lines and proprietary trading tools to put the odds of a full bull-market comeback in context.
“Bulls are currently attempting to flip resistance at the Q2 2024 Timescape Level, and now psychological resistance at $75k is coming into focus. If bulls can push higher the next targets are at the Q2 2025 Timescape Levels at $78.3k and $82.5k,” he explained.
“The confluence between the moving averages, Timescapes Levels and the structure add strength to those levels, and there is a lot of ask liquidity laddered between here and there that will make that move challenging.”

Trader Mister Crypto, meanwhile, drew comparisons between current price action and that from earlier in 2026, where BTC/USD offered a relief bounce before breaking below support.
$BTC is forming a textbook bear flag here…
Don’t say I didn’t warn you. pic.twitter.com/0FnHj0BVrP
— Mister Crypto (@misterrcrypto) March 17, 2026
This article does not contain investment advice or recommendations. Every investment and trading move involves risk, and readers should conduct their own research when making a decision. While we strive to provide accurate and timely information, Cointelegraph does not guarantee the accuracy, completeness, or reliability of any information in this article. This article may contain forward-looking statements that are subject to risks and uncertainties. Cointelegraph will not be liable for any loss or damage arising from your reliance on this information.
Crypto World
YZi Labs Backs RoboForce With $52M to Close the Industrial Labor Gap Through Physical AI

TLDR:
- YZi Labs led a $52M funding round in RoboForce, with Ella Zhang joining the company’s board as director.
- RoboForce’s TITAN robot delivers 1mm precision for harsh industrial jobs in solar, mining, and logistics.
- NVIDIA CEO Jensen Huang spotlighted TITAN at GTC 2025, validating RoboForce’s Physical AI field work.
- RoboForce holds letters of intent for 11,000+ robots and is now scaling toward full production rollout.
YZi Labs has led a $52 million funding round in RoboForce, a Silicon Valley-based robotics company. The firm builds Physical AI-powered robotic labor systems for demanding industrial settings.
RoboForce’s flagship TITAN robot targets critical workforce shortages in solar, mining, logistics, and data centers. Ella Zhang, Managing Partner and Head of YZi Labs, joined the company’s board following the raise. NVIDIA CEO Jensen Huang also spotlighted the company at GTC 2025.
RoboForce Builds TITAN to Address Growing Industrial Workforce Shortages
RoboForce was founded in 2023 to tackle what co-founder Leo Ma calls the gap between industrial growth and human availability.
In 2024, approximately 53 gigawatts of U.S. solar projects were delayed due to labor shortages. That number alone reflects how deep the workforce problem runs across key industries.
Ma spent years visiting hundreds of factories, from chip fabrication plants to underground drilling sites. Each visit reinforced the same conclusion.
As Ma put it, “These are the jobs that we shouldn’t need people to do anymore.” That conviction directly shaped what RoboForce set out to build.
The TITAN robot is designed for environments too harsh for sustained human labor. It operates with millimeter-level accuracy and the endurance needed for high-output industrial workflows.
The team behind it comes from Carnegie Mellon, Amazon Robotics, Google, Waymo, Tesla Robotics, and Apple.
RoboForce runs on a Physical AI data flywheel. Every deployed robot generates field data that feeds back into the company’s foundation model.
Ma stated, “The more you use it, the smarter it gets, and spinning that data flywheel requires patient, generational capital.” That compounding loop improves the entire fleet over time.
Ma further noted that YZi Labs was a deliberate choice as a partner. “We deliberately chose YZi Labs as a partner who understands infrastructure timelines and is willing to bet on a long-term business,” he said.
YZi Labs confirmed its position publicly via the following post:
NVIDIA Partnership and $52M Capital Set the Stage for Production-Scale Growth
RoboForce operates in close collaboration with NVIDIA across its full technology stack. The company uses NVIDIA Jetson Thor at the edge for real-time processing.
Isaac Sim and Isaac Lab handle simulation and robot learning, while NVIDIA Cosmos generates synthetic training data.
Jensen Huang featured TITAN at GTC Washington, D.C. in October 2025. He stated, “AI is transforming the world’s factories into intelligent thinking machines — the engines of a new industrial revolution.” That recognition followed real field validation already underway by the time of the keynote.
YZi Labs’ Jing Xiong described the team’s reaction after seeing the first demo. “When we met the team and saw the demo, it clicked,” Xiong said. “These robots are doing the work humans were never meant to endure.” RoboForce has since received letters of intent covering demand for over 11,000 robots.
The $52 million will fund foundation model advancement, manufacturing expansion, and commercialization efforts. Ella Zhang, who joined the board after the round closed, described the broader vision.
“This is beyond a financial investment; it’s a partnership built on the shared belief that the next frontier of AI will be defined by its impact on the physical plane,” she said. YZi Labs sees this round as the start of a broader commitment to Physical AI.

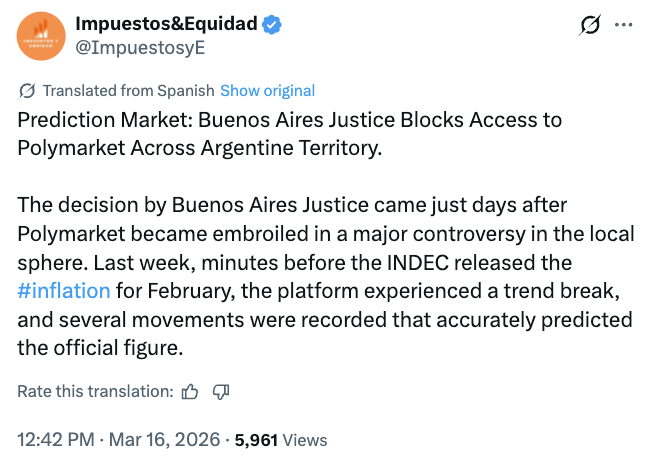
A court in Argentina has ordered a nationwide block of the major crypto-based prediction market platform Polymarket over unauthorized gambling.
Argentina’s national communications and media regulator, Ente Nacional de Comunicaciones (ENACOM), received a court order to block access to the Polymarket website and its variants across the country, according to a ruling dated March 11.
The order was issued by the Buenos Aires Court of First Instance in Criminal, Contravention and Minor Offenses No. 31, which is investigating Polymarket under Argentina’s Criminal Code for allegedly offering gambling services without authorization.
The judge asked ENACOM to carry out the measure either directly or through internet service providers (ISPs) and to promptly inform the court or the specialized gambling prosecutor’s office if technical or other obstacles prevent full compliance.
Buenos Aires regulator initiated the case
According to local media reports, the case was brought by the Buenos Aires City Lottery (LOTBA), the state-owned company that regulates gambling activities in the city.
After receiving a complaint from LOTBA about Polymarket’s alleged operation without authorization, prosecutor Juan Rozas, in charge of the City’s Specialized Gaming Prosecutor’s Office (FEJA), opened the investigation that led to the court order.
Authorities argued that Polymarket allowed users to place bets without sufficient identity and age verification, raising concerns that minors could access the platform.
“In practice, this meant that anyone — including children and adolescents — could access and start betting without any control,” the authorities reportedly said.
Inflation bets deepen scrutiny
In addition to instructing ENACOM to block access to Polymarket, the court reportedly ordered Google and Apple to remove and restrict the platform’s mobile applications on Android and iOS throughout Argentina, including for existing users.
Social media reports indicate users are discussing workarounds such as VPNs, while observers note that the order comes from a Buenos Aires city court rather than the national government.

The move adds to earlier scrutiny of Polymarket after its inflation-related prediction markets closely mirrored official data from Argentina’s statistics agency, reigniting concerns about potential insider trading, according to local reports.
Polymarket did not immediately respond to a request for comment from Cointelegraph.
Related: CFTC chair backs blockchain-based prediction markets as ‘truth machines’
Argentina’s action is the latest example of moves against prediction markets globally, with countries including the Netherlands, Hungary, Portugal and Ukraine taking similar steps to restrict access.
In Latin America, Colombia was among the first to take action, with its gambling regulator reportedly warning of Polymarket’s unauthorized operations in September 2025.
Magazine: How crypto laws changed in 2025 — and how they’ll change in 2026


Cari Network, a permissioned network for banks led by former United States Comptroller of the Currency Gene Ludwig, has chosen Matter Labs’ Prividium infrastructure to power a bank-governed tokenized deposit network for US regional and mid-sized lenders.
Built on ZKsync and anchored to Ethereum, the platform is designed to let participating banks issue and move tokenized deposits around the clock while keeping them on the balance sheet as bank liabilities, according to a Tuesday release shared with Cointelegraph.
The move comes as lawmakers debate frameworks such as the Guiding and Establishing National Innovation for US Stablecoins (GENIUS) Act and as stablecoin issuers encroach on banks’ role in payments and deposit funding.
“Financial infrastructure is being redesigned in real time, and mid-sized banks are the ones being left behind,” ZKsync CEO Alex Gluchowski told Cointelegraph, framing the network as a tool for banks to “lead that transition, rather than be displaced by it.”
Regional banks seek tokenized deposits for stablecoin-style payments
Five US banks, Huntington Bancshares, First Horizon, M&T Bank, KeyCorp and Old National Bancorp, have been involved in designing and testing the network since February, according to a Bloomberg report.
Related: Stablecoin uncertainty could hurt banks more than crypto firms: Expert
According to the release, the Mid-Size Bank Coalition of America has backed the broader model, arguing that keeping deposits within regulated institutions is critical for small business lending and local economies.
Cari’s tokens represent existing customer deposits at participating banks and are intended to remain within a permissioned environment governed by bank risk and compliance frameworks, rather than circulating freely in decentralized finance (DeFi).
Prividium targets privacy, control and onchain auditability
According to ZKsync, Prividium serves as the shared ledger, enabling instant settlement between verified counterparties while separating transaction records and balances from personally identifiable data, which stays in each bank’s core systems.
ZKsync’s public network has struggled to sustain usage in the past year. Onchain data analyzed by Nansen showed ZKsync recording one of the steepest declines among major chains in 2025, with transactions falling about 90% as airdrop-driven activity cooled.
Related: Why institutions still prefer Ethereum despite faster blockchains
At the same time, ZKsync has been steering its roadmap toward exactly the kind of institutional use case Cari represents. Its 2026 plan centers on privacy, deterministic control and native interoperability as prerequisites for banks, enterprises and governments.
Gluchowski said the architecture was designed with US banking privacy and supervisory expectations in mind, including data protection, examiner access and tamper-evident audit trails.
While some banks have explored issuing or partnering on stablecoins, Gluchowski argues that tokenized deposits “are complementary to stablecoins,” adding that ZKsync sees deposits being used as “the payment tokens by banks when money needs to move in and out” of their private infrastructure.
Big Questions: Is China hoarding gold so yuan becomes global reserve instead of USD?

PayPal (PYPL) said it is expanding access to its dollar-backed stablecoin, , to users in 70 markets, extending the token’s reach beyond the U.S. as it pushes deeper into digital payments.
Consumers in newly supported countries will be able to buy, hold, send and receive PYUSD directly through their PayPal accounts, with the option to transfer the token to third-party crypto wallets or convert it to local currency when withdrawing funds.
The launch is a “really powerful way to be able to show how stablecoins can actually be integrated into a distribution network for both consumers and merchants and then provide value and cost savings and instant speed and settlement,” May Zabaneh, senior vice president and general manager of crypto at PayPal, told CoinDesk in an interview.
“You’re lowering costs, you’re enhancing speed, you’re providing consumers as well as businesses, the ability to hold, spend and earn.”
Stablecoins, digital tokens backed by assets such as fiat currency or commodities, have become a core payment and settlement layer in the crypto market, widely used for trading and cross-border transfers. The sector is led by Tether’s USDT with a market capitalization of about $143 billion, followed by Circle Internet’s (CRCL) USDC at roughly $78 billion. PYUSD has a market cap of around $4 billion.
The tokens have emerged as one of the fastest-growing segments of the digital asset market, with the sector’s total supply climbing into the hundreds of billions of dollars as demand for dollar-linked digital payments increases.
The growth has attracted traditional financial institutions and payments companies, with firms such as Visa (V) and Mastercard (MA) exploring stablecoin integrations, while banks and fintechs test tokenized deposits and blockchain-based settlement to compete in cross-border payments and digital commerce.
Merchants using PYUSD can access payment proceeds within minutes rather than waiting days for traditional settlement cycles, potentially improving liquidity for cross-border commerce.
PayPal introduced PYUSD in the U.S. in 2023. The token is backed by dollar deposits and short-term Treasuries and issued by Paxos under U.S. regulatory oversight.
The new markets span regions including Asia-Pacific, Europe and Latin America, with countries such as Singapore, the U.K., Peru and Guatemala among those gaining access. PayPal said additional markets will be added in the coming weeks.
Read more: Stablecoin market hits $312 billion as banks, card networks embrace onchain dollars

- Tron joins the Mastercard program, boosting mainstream adoption and credibility.
- Tron Network leads in revenue, driven by USDT transfers and low fees.
- TRON price consolidates near $0.28–$0.31, next breakout could target $0.43.
TRON (TRX) has been showing renewed strength over the past few weeks, and the momentum has been boosted by the announcement that it joined Mastercard’s Crypto Partner Program.
The Mastercard Crypto Partner Program positions Tron alongside some of the leading blockchain networks, giving it direct access to traditional payment infrastructures.
The partnership signals growing mainstream adoption for Tron and reinforces the network’s reputation as a fast and cost-effective solution for large-scale transactions.
Tron outperforms competitors in revenue generation
In addition to the Mastercard Crypto Partner Program, the Tron network continues to outperform competitors like Ethereum, Polygon, and Solana in revenue generation.
In the past 30 days, Tron earned nearly $25 million, primarily driven by stablecoin transactions, with Tether (USDT) transfers accounting for a large portion of this activity.
These transfers are critical in markets where remittances, payments, and liquidity management rely on stablecoins.
Notably, Tron’s low fees and high-speed processing allow it to handle massive transaction volumes efficiently.
This combination of factors makes Tron a preferred network for traders and businesses who need speed without high costs.
Technical indicators suggest that TRON is in a consolidation phase

The Relative Strength Index (RSI) is currently at around 62, meaning there is still room for more gains before the altcoin becomes overbought.
The Bollinger Bands indicate that the price is trading in the upper range, with immediate resistance around $0.30 and the key support just below $0.28, forming a clear trading range that could define the next breakout.
What’s next for TRON price?
With the Mastercard partnership boosting credibility, TRON could see stronger bullish momentum.
The short-term target lies around $0.31 if the price breaks above its current resistance.
Traders should watch for volume spikes, as they could confirm a shift from consolidation to an upward trend.
In the long term, TRON’s historical performance suggests potential to revisit previous highs near $0.43.
Revenue dominance strengthens the case for TRON’s price appreciation.
Unlike some blockchains that prioritise smart contracts and decentralisation, TRON focuses on speed and affordability, which has helped it capture large-scale payment and exchange operations.
The combination of strategic partnerships, high transaction throughput, and stable revenue generation positions TRON as a strong contender in the crypto market.
As traders watch the $0.30–$0.31 range, breaking this level could trigger further gains.
If support at $0.28 holds, TRON may continue consolidating before the next upward push.
For now, the partnership with Mastercard, coupled with its revenue performance, gives TRON a unique advantage.
It remains one of the few networks that blends mainstream payment integration with efficient blockchain performance.

A UK resident has accused his estranged wife of stealing over 2,323 Bitcoin from a Trezor hardware wallet, allegedly using a security camera to capture his seed phrase and wallet access codes.
Summary
- Ping Fai Yuen alleges 2,323 Bitcoin were taken from his hardware wallet after his wife and her sister obtained his seed phrase through covert surveillance.
- Funds were moved to 71 wallet addresses, with no activity recorded since December 2023 as police arrested the accused and seized related devices
- A UK High Court judge said the claimant has a strong chance of success.
A court judgment filed in the UK’s High Court of Justice outlines claims by the plaintiff, Ping Fai Yuen, alleging that his wife, Fun Yung Li, and her sister secretly recorded him using surveillance equipment to obtain his seed phrase. Subsequently, the funds were transferred to 71 different wallet addresses.
Ping figured something was wrong after allegedly being tipped off by his daughter, following which he installed audio recording equipment that he claims captured conversations related to the alleged theft and plans to move the funds.
However, court documents claim no transactions have taken place from the wallets since Dec. 21, 2023.
Ping reported the alleged theft to the police, after which authorities arrested his wife and confiscated several cold wallets and luxury watches as part of the investigation.
Last year, Ping filed an application asking the court to freeze all crypto assets linked to his wife, formally recognize his ownership of the Bitcoin, and either return the funds or award him their equivalent value in fiat currency. At the time, he also raised concerns about a potential crypto dusting attack, which involves sending small amounts of cryptocurrency to wallets to track activity and identify high-value holders.
According to the judge presiding over the case, Ping has a high chance of success, noting that the defendant had not provided “any alternative (or any) explanation for the movement of the Bitcoin.”
“The evidence is that he was warned of what the First Defendant was seeking to do, the transcripts are damning; and when the First Defendant’s property was searched, the necessary equipment to exfiltrate the Bitcoin was found,” the judge wrote.
Further, the judge stated that the court will schedule a case management hearing if the parties fail to agree on the next steps and have recommended an early trial, citing the security risks and price volatility associated with Bitcoin.
As previously reported by crypto.news, last month, John Daghita was arrested in Saint Martin for allegedly stealing more than $46 million in cryptocurrency. Authorities allege Daghita misappropriated over $46 million in cryptocurrency from wallets held by the U.S. Marshals Service while working as a government contractor.
Crypto World
BTC price hits a wall at $75,000 while onchain energy markets run hot: Crypto Daybook Americas
By Omkar Godbole (All times ET unless indicated otherwise)
While bitcoin’s price rise since the Iran conflict began more than two weeks ago is impressive, the performance of Hyperliquid is even more notable.
Users of the decentralized perpetuals exchange have traded millions in commodity futures, particularly those tied to oil, highlighting the utility of blockchain-based markets in price discovery when traditional markets are closed.
That trend looks set to continue as industry pundits grow increasingly bullish on commodities, especially energy.
“Energy contracts – particularly refined products such as heating oil and gasoline – exhibit stronger expected Sharpe ratios, tighter physical markets, and supportive term structures,” Prometheus Research said
The Iran conflict has already driven gains in commodity ETFs, and Mining.com predicts a lasting impact on key metals, including nickel and other critical minerals.
All this suggests onchain commodity markets could siphon capital away from bitcoin and various parts of the crypto market. Booming AI stocks supposedly did that in 2024-25, limiting gains in the largest cryptocurrency.
Another tail risk: Economists are predicting an increase in inflation due to the oil price rally, which could prompt central banks to proceed cautiously with interest-rate cuts, further weighing on risk assets. Remember, the Fed is due to announce its rate decision tomorrow.
So while BTC looks buoyant, rapid gains may not come easily. Prices briefly topped $75,000 earlier Tuesday on the back of short-covering in futures and options markets.
“When you pair that heavily hedged options market with the persistently negative perpetual funding rates we saw over the last couple of weeks, it became clear the market was heavily skewed — hedged, short, and under-owned,” Monarq Asset Management told CoinDesk.
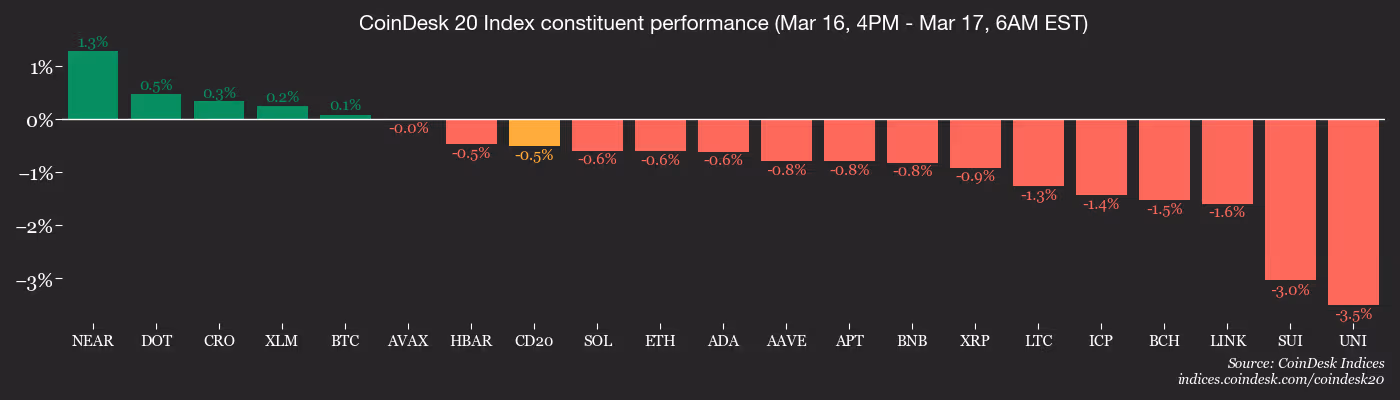
The breakout, however, was short-lived. Prices slipped back below $74,000, dragging down the CoinDesk 20 Index and major tokens such as ether (ETH), XRP (XRP) and solana (SOL). Meanwhile, S&P 500 futures fell, signaling renewed risk aversion in traditional markets. Stay alert!
Read more: For analysis of today’s activity in altcoins and derivatives, see Crypto Markets Today
What to Watch
For a more comprehensive list of events this week, see CoinDesk’s “Crypto Week Ahead“.
- Crypto
- March 17: Lava Network (LAVA) to expand with 17 new chain integrations and nine new blockchain ecosystems.
- Macro
- March 17, 10 a.m.: U.S. Pending Home Sales MoM for February (Prev. -0.8%)
- Earnings (Estimates based on FactSet data)
- March 17: CEA Industries (BNC), post-market, $0.69
Token Events
For a more comprehensive list of events this week, see CoinDesk’s “Crypto Week Ahead“.
- Governance votes & calls
- March 17: Mantle (MNT) to host State of Mind Ep. 07, discussing CeDeFi milestones and DeFi strategies.
- March 17: OKX to host an X Spaces session on agent states featuring representatives from Uniswap, Dune and Alchemy.
- Decentraland DAO is voting on whether to allow registered users to customize the color of their avatar name tag, and to add a more accessible volume slider to the UI sidebar. Voting ends March 16 and 17.
- Convex Finance is voting on Curve and Frax gauge weight allocations for the week of March 12, directing vlCVX voting power across hundreds of liquidity pools. It’s also voting on FXN gauge weight allocations for the same period. Voting ends March 17.
- Aavegotchi DAO is voting to finalize its 2026–2027 Multi-Sig Signers election, preserving the 5-of-9 threshold and setting quarterly signer compensation. Voting ends March 17.
- Aavegotchi DAO is running Ballot 3 to elect seven of the remaining 10 nominees as Multi-Sig Signers, completing the nine-signer roster for the DAO Foundation wallet. Voting ends March 17.
- Aura Finance is voting on Balancer gauge weight allocations for the week of March 12, directing vlAURA voting power across Balancer pools on Ethereum, Arbitrum, Optimism, Gnosis, Base, and Avalanche. Voting ends March 17.
- ShapeShift DAO is voting on establishing and funding a new International UX Workstream for six months to maintain professional multilingual translations of the ShapeShift app and website. Voting ends March 17.
- Unlocks
- Token Launches
Conferences
For a more comprehensive list of events this week, see CoinDesk’s “Crypto Week Ahead“.
Market Movements
- BTC is down 0.28% from 4 p.m. ET Monday at $73,668.91 (24hrs: +0.22%)
- ETH is down 1.25% at $2,307.46 (24hrs: +1.76%)
- CoinDesk 20 is down 0.96% at 2,147.86 (24hrs: +0.75%)
- Ether CESR Composite Staking Rate is up 7 bps at 2.81%
- BTC funding rate is at -0.0054% (-5.9042% annualized) on Binance

- DXY is up 0.09% at 99.80
- Gold futures are up 0.03% at $5,003.80
- Silver futures are down 0.61% at $80.19
- Nikkei 225 closed unchanged at 53,700.39
- Hang Seng closed up 0.13% at 25,868.54
- FTSE 100 is up 0.54% at 10,373.64
- Euro Stoxx 50 is up 0.45% at 5,764.94
- DJIA closed on Monday up 0.83% at 46,946.41
- S&P 500 closed up 1.01% at 6,699.38
- Nasdaq Composite closed up 1.22% at 22,374.18
- S&P/TSX Composite closed up 1.03% at 32,876.65
- S&P 40 Latin America closed down 0.32% at 3,607.58
- U.S. 10-Year Treasury rate is down 7 bps at 4.22%
- E-mini S&P 500 futures are up 0.61% at 6,745.75
- E-mini Nasdaq-100 futures are up 0.66% at 24,839.25
- E-mini Dow Jones Industrial Average futures are up 0.59% at 47,261.00
Bitcoin Stats
- BTC Dominance: 59.06% (-0.17%)
- Ether-bitcoin ratio: 0.0313 (-0.39%)
- Hashrate (seven-day moving average): 935 EH/s
- Hashprice (spot): $32.42
- Total fees: 2.54 BTC / $187,439
- CME Futures Open Interest: 115,130 BTC
- BTC priced in gold: 14.8 oz.
- BTC vs gold market cap: 4.93%
Technical Analysis

- The chart shows daily swings in the ether-bitcoin ratio in candlestick format since November.
- The ratio surged 5% Monday, breaking out of a prolonged trend of choppy price action.
- The so-called bullish breakout suggests potential for continued ether outperformance ahead.
Crypto Equities
- Coinbase Global (COIN): closed on Monday at $203.32 (+3.98%), +0.33% at $204.00 in pre-market
- Circle Internet Group (CRCL): closed at $125.83 (+9.06%), +0.79% at $126.82
- Galaxy Digital (GLXY): closed at $23.10 (+3.36%), unchanged
- MARA Holdings (MARA): closed at $9.23 (–0.97%), +0.11% at $9.24
- Riot Platforms (RIOT): closed at $14.40 (+2.56%), +0.21% at $14.43
- Core Scientific (CORZ): closed at $16.97 (+2.91%), –0.41% at $16.90
- CleanSpark (CLSK): closed at $10.02 (+2.66%), +0.50% at $10.07
- Exodus Movement (EXOD): closed at $9.32 (+3.90%)
- CoinShares Bitcoin Mining ETF (WGMI): closed at $40.45 (+5.68%), unchanged
- Bullish (BLSH): closed at $39.62 (+8.19%), –1.29% at $39.11
Crypto Treasury Companies
- Strategy (MSTR): closed at $147.52 (+5.62%), –0.83% at $146.3
- Strive (ASST): closed at $10.86 (+13.96%), unchanged
- SharpLink Gaming (SBET): closed at $8.20 (+8.90%), +0.49% at $8.24
- Upexi (UPXI): closed at $1.08 (–2.70%), +4.63% at $1.13
- Lite Strategy (LITS): closed at $1.25 (+5.93%)
ETF Flows
Spot BTC ETFs
- Daily net flows: $199.4 million
- Cumulative net flows: $56.31 billion
- Total BTC holdings ~ 1.29 million
Spot ETH ETFs
- Daily net flows: $35.9 million
- Cumulative net flows: $11.86 billion
- Total ETH holdings ~ 5.74 million
Source: Farside Investors
While You Were Sleeping
Crypto World
Ripple (XRP) Price Jumps 8%, New Crypto Project PlayNance (GCoin) Locks 250M Tokens Within Hours
XRP’s price has increased by more than 8% over the past week, pushing above the pivotal $1.5 level.
Ripple’s native cryptocurrency is also a leading performer for the past 24 hours, up by 2.8% – the most out of the top 10 coins by means of total market capitalization.
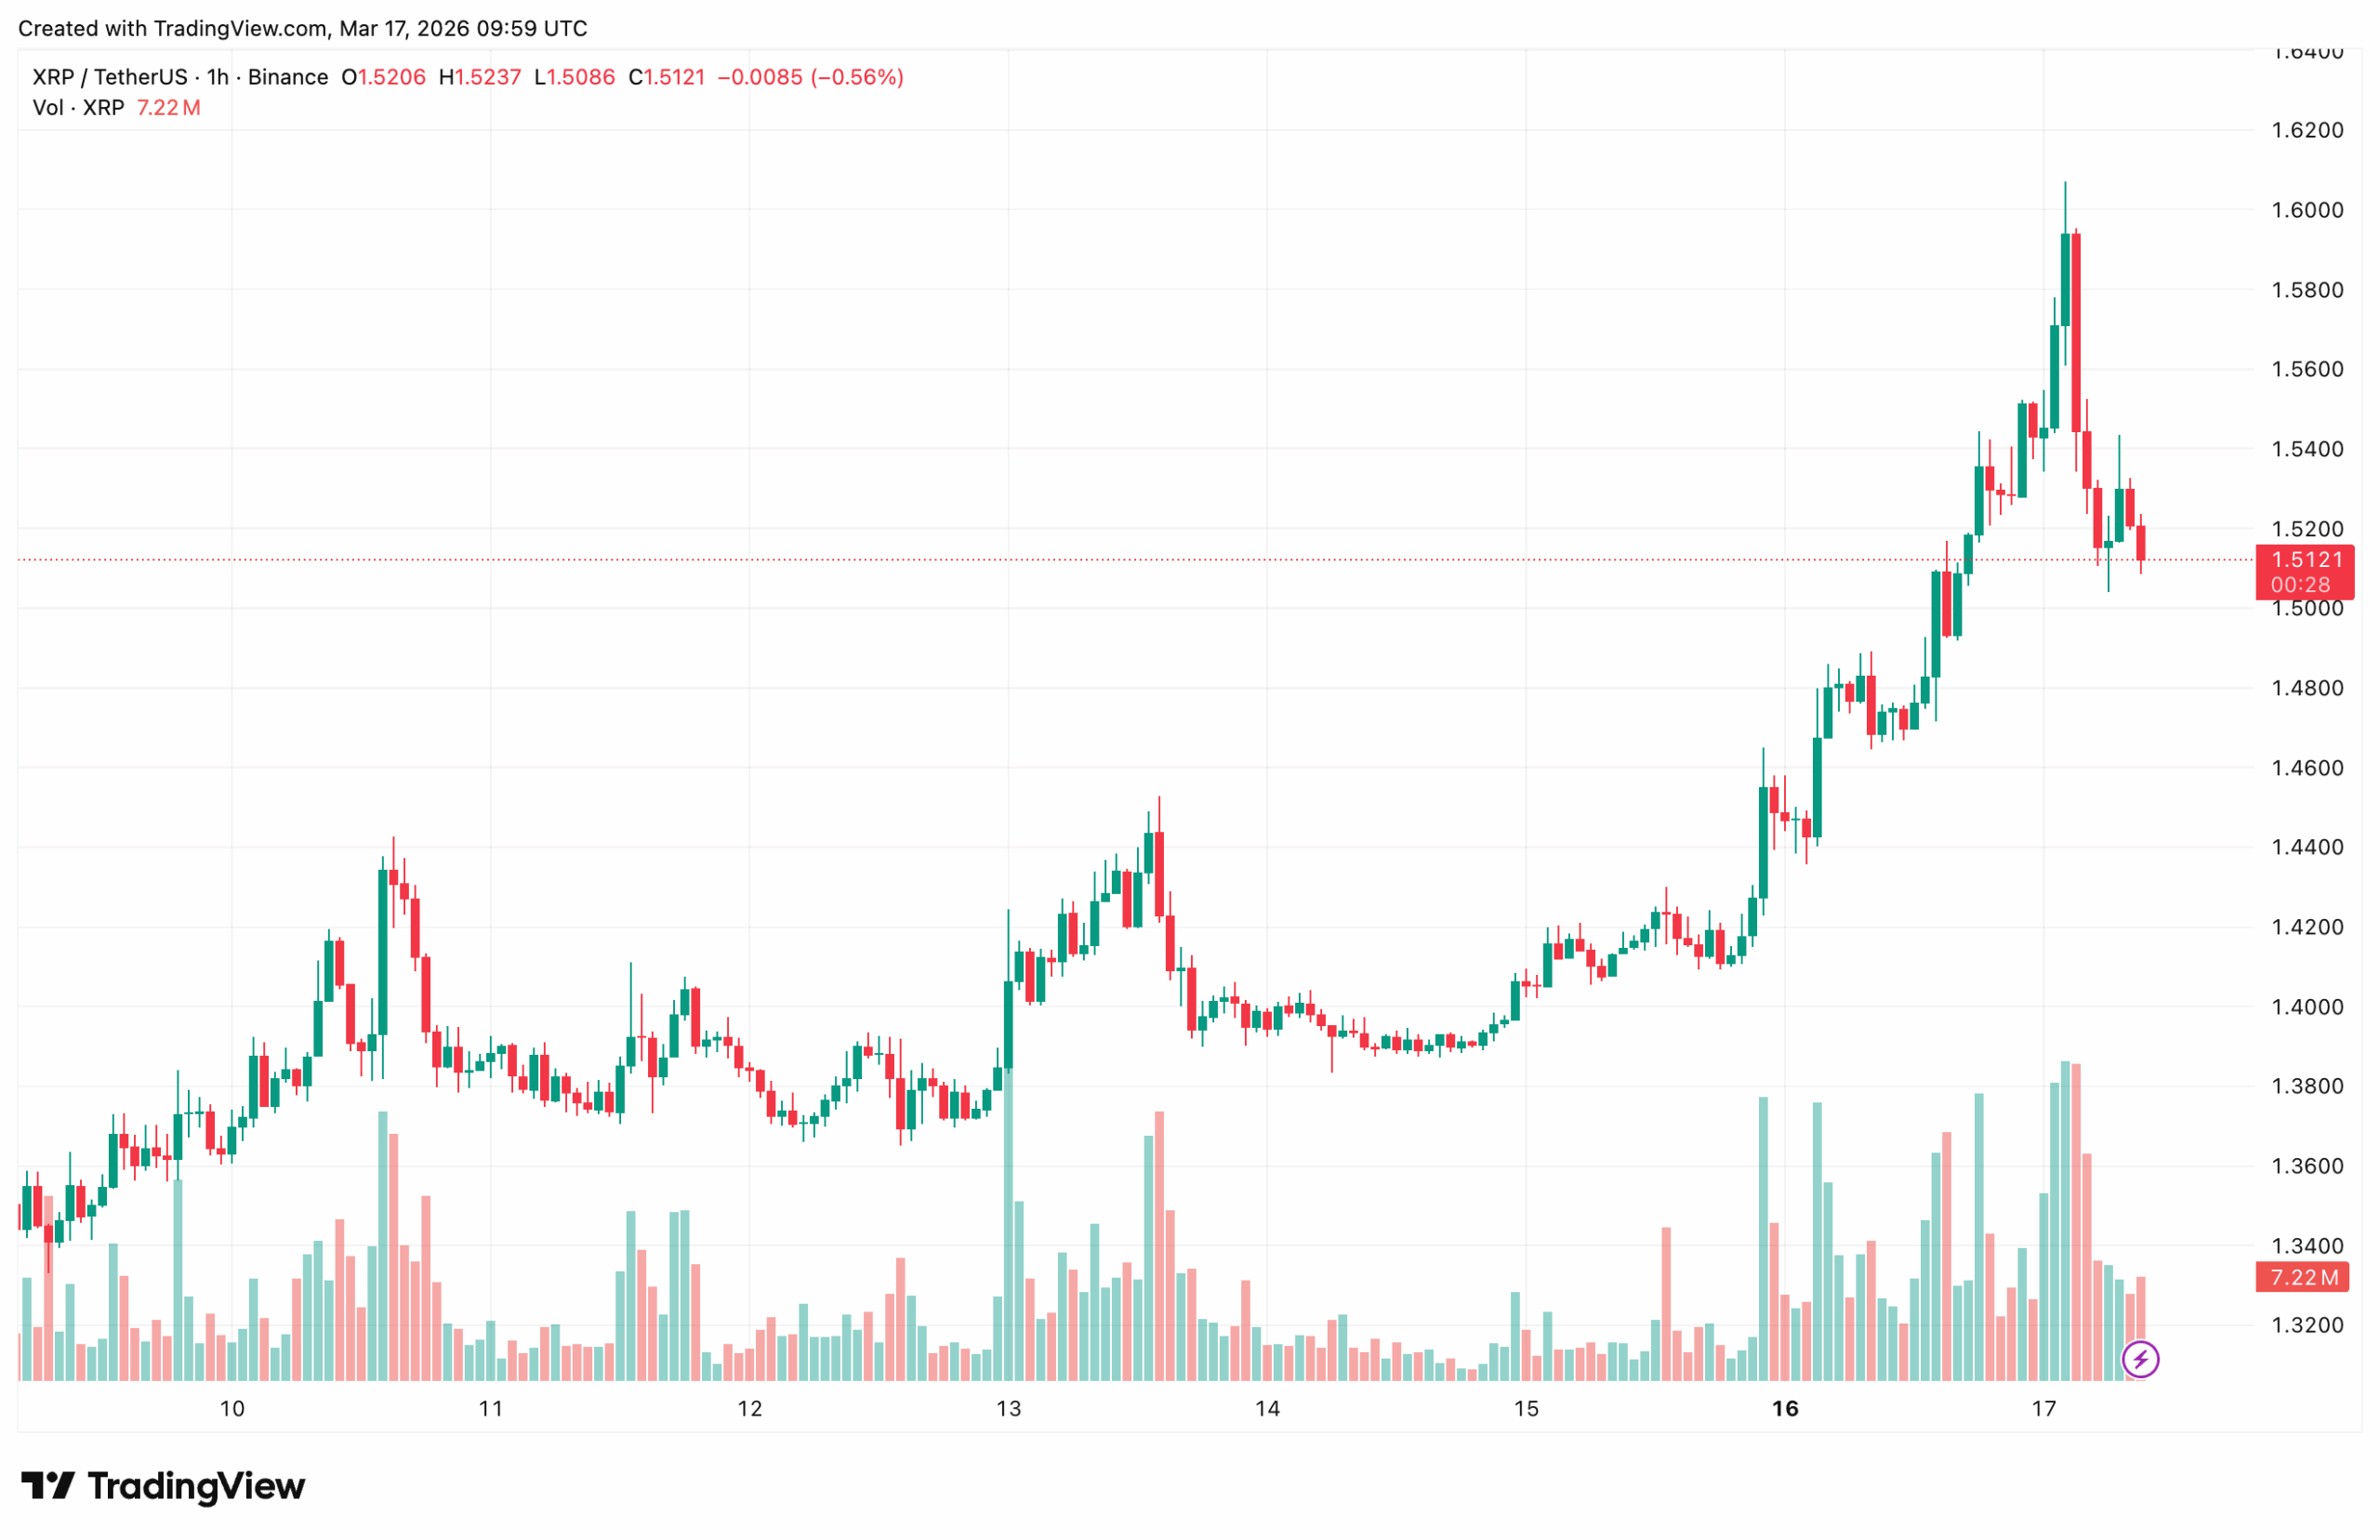
It’s worth noting that XRP reached considerably higher and pushed above $1.6 for a moment, but the bears were quick to intercept the movement, resulting in a slight decline over the past few hours.
What’s Next for the XRP Price?
Nonetheless, this marked a level not seen in over a month, which had some analysts already outlining potential breakout targets.
Notably, during the days leading to today’s move, popular market observer and analyst Ali Martinez outlined that the Bollinger Bands on XRP’s chart had been squeezing. That’s because the coin had spent considerable time trading within a relatively narrow range between $1.33 and $1.47. Bollinger Bands are a well-known volatility indicator. The more squeezed they get, the higher the chance of a breakout move, which is what is happening now, according to the analyst.
Martinez commented on today’s increase, saying that XRP is already breaking out of its triangle pattern.
Moreover, he also suggested that the next upward target is $1.85, which would mean an increase of another 23% from current levels.
$XRP is breaking out of this triangle!
Target: $1.85. https://t.co/3dirkMNDwF pic.twitter.com/H2D56F5zyZ
— Ali Charts (@alicharts) March 17, 2026
It’s also worth noting that this latest surge comes on the back of solid fundamentals. Network activity on the XRP Ledger (XRPL) is soaring, reaching a record high of more than 7.7 million non-empty wallets.
Additionally, the number of active addresses on XRPL reached 46,767, which represents a five-week high.
But XRP’s price isn’t the only thing soaring in crypto today.
PlayNance Launches GCoin Staking
Arguably one of the most anticipated token generation events, PlayNance’s GCoin, is taking place in less than 14 hours, and the team has made a major announcement ahead of it.
PlayNance announced that GCoin staking is now live. This mechanism is designed to strengthen long-term participation in the platform’s growing Web3 entertainment economy.
The program is now live on PlayW3 – the firm’s flagship social gaming platform. Moreover, the community locked over 250 million tokens within just a few hours of the capability being live.
What it means is that GCOIN holders are now able to lock their tokens and participate in rewards distributed within the ecosystem, while also reducing circulating supply through entirely voluntary locking, hence supporting the sustainability of the token’s broader economy.
There are smart-contract staking pools where users can stake their GCOIN with a minimum threshold of 1,000 coins. The lockup durations are 6, 9, 12, and 18 months. Naturally, the longer the period, the longer the reward weight.
Those interested in participating the token generation event can take a look at the official page for more details. Over 13 billion tokens have already been sold and the current price is set at $0.00161, but that’s designed to progressively increase, encouraging early participation.
Disclaimer: The above article is sponsored content. CryptoPotato doesn’t endorse or assume responsibility for the content, advertising, products, quality, accuracy, or other materials on this page. Nothing in it should be construed as financial advice. Readers are strongly advised to verify the information independently and carefully before engaging with any company or project mentioned and to do their own research. Investing in cryptocurrencies carries a risk of capital loss, and readers are also advised to consult a professional before making any decisions that may or may not be based on the above-sponsored content.
Readers are also advised to read CryptoPotato’s full disclaimer.
Binance Free $600 (CryptoPotato Exclusive): Use this link to register a new account and receive $600 exclusive welcome offer on Binance (full details).
LIMITED OFFER for CryptoPotato readers at Bybit: Use this link to register and open a $500 FREE position on any coin!

UK insolvencies jump 18% as households hit breaking point amid rising costs

EUR/USD Chart Analysis: Pair Recovers Ahead of Fed News
Hilary Duff Defends Mom As Frankie Muniz Calls Her Intense


-
 Tech6 days ago
A 1,300-Pound NASA Spacecraft To Re-Enter Earth’s Atmosphere
-
Crypto World3 days ago
HYPE Token Enters Net Deflation as HyperCore Buybacks Outpace Staking Rewards
-

 Business7 days ago
ExxonMobil seeks to move corporate registration from New Jersey to Texas
-

 Fashion4 days ago
Weekend Open Thread: Addict Lip Glow
-

 Tech7 days ago
ChatGPT will now generate interactive visuals to help you with math and science concepts
-
Sports3 days ago
Why Duke and Michigan Are Dead Even Entering Selection Sunday
-

 NewsBeat6 days ago
Residents reaction as Shildon murder probe enters second day
-

 Business2 days ago
Search for Savannah Guthrie’s Mother Enters Seventh Week with No Arrests
-

 Business6 days ago
Search Enters Sixth Week With New Leads in Tucson Abduction Case
-

 Business3 days ago
US Airports Launch Donation Drives for Unpaid TSA Workers as Partial Government Shutdown Enters Fifth Week
-

 Sports6 days ago
PWHL, Senators discussing plan to keep Charge in Ottawa
-
Crypto World3 days ago
Coinbase and Bybit in Investment Talks: Could Bybit Finally Enter the US Crypto Market?
-

 NewsBeat6 days ago
I Entered The Manosphere. Nothing Could Prepare Me For What I Found.
-

 Business3 days ago
Country star Brantley Gilbert enters growing non-alcoholic beer market
-

 Business1 day ago
Australian shares drop as Iran war enters third week
-

 Sports4 days ago
College Basketball Best Bets: Conference Tournament Semifinal Picks
-

 Crypto World1 day ago
Crypto Lender BlockFills Enters Chapter 11 with Up to $500M in Liabilities
-

 Crypto World7 days ago
Will Chainlink price reclaim $10 amid volatility squeeze?
-

 Tech7 days ago
Clarity as strategy
-

 Politics6 days ago
Trump Says Middle East Is ‘Very Lucky’ That He’s President


You must be logged in to post a comment Login