
Crypto World
Four 1-Minute Scalping Strategies: Ideas and Applications

Scalping on the 1-minute chart is about reacting to short bursts of order flow, momentum shifts, and volatility as they unfold in real time. Execution speed, clarity, and repeatable rules matter more than broad narratives or longer-term bias. This article looks at four 1-minute trading strategies that combine price behaviour with common technical tools, outlining how many traders structure entries, exits, and trade management when working on ultra-short timeframes.
Takeaways
- Scalping is a trading approach that focuses on short-lived price moves on small timeframes (from 1-minute to 15-minute charts), with trades managed over seconds or minutes and outcomes shaped by execution, spread, and timing rather than extended market moves.
- The article outlines four approaches: VWAP with MACD, Keltner Channels with RSI, ALMA with Stochastic, and RSI with Bollinger Bands. We show how traders frame entries and exits within 1-minute trading strategies.
- Volume Weighted Average Price (VWAP), Moving Average Convergence Divergence (MACD), Relative Strength Index (RSI), Bollinger Bands, Keltner Channels, Arnaud Legoux Moving Average (ALMA), and Stochastic Oscillator are common 1-minute scalping indicators used to track momentum, volatility, and short-term structure.
- Frequent trading increases exposure to costs and execution variance, so predefined stops, take-profit targets, and session rules may help manage your trades.
1-Minute Scalping Trading: Basics
1-minute scalping is a fast-paced trading style focusing on taking advantage of small price movements within a minute timeframe. Traders using this approach rely on 1-minute charts to make quick, multiple trades throughout the trading session. The primary goal is to accumulate potential small gains that might add up to larger returns over time.
A scalp trading strategy requires a solid understanding of technical analysis and market conditions. Scalpers typically use indicators, price action patterns, and trend analysis to identify short-term market movements and potential entry and exit points. The rapid nature of 1-minute scalping demands precision and discipline, as even a slight delay can impact the trade outcome.
One of the advantages of 1-minute scalping is the ability to generate frequent trades, which can be particularly appealing during volatile market conditions. However, it also comes with higher risks due to the speed and frequency of trades, meaning risk management plays a significant role.
Scalpers should also be aware of transaction costs, as frequent trading can lead to significant fees, which may erode potential returns. Choosing a broker with low commissions, tight spreads, and fast execution speeds may help when implementing a scalping forex strategy.
Four 1-Minute Scalping Strategies
Now, let’s take a closer look at four 1-minute trading strategies. To apply these strategies, see how they work in practice, and access each of these 1-minute scalping indicators, you can consider following along on FXOpen’s TickTrader trading platform.
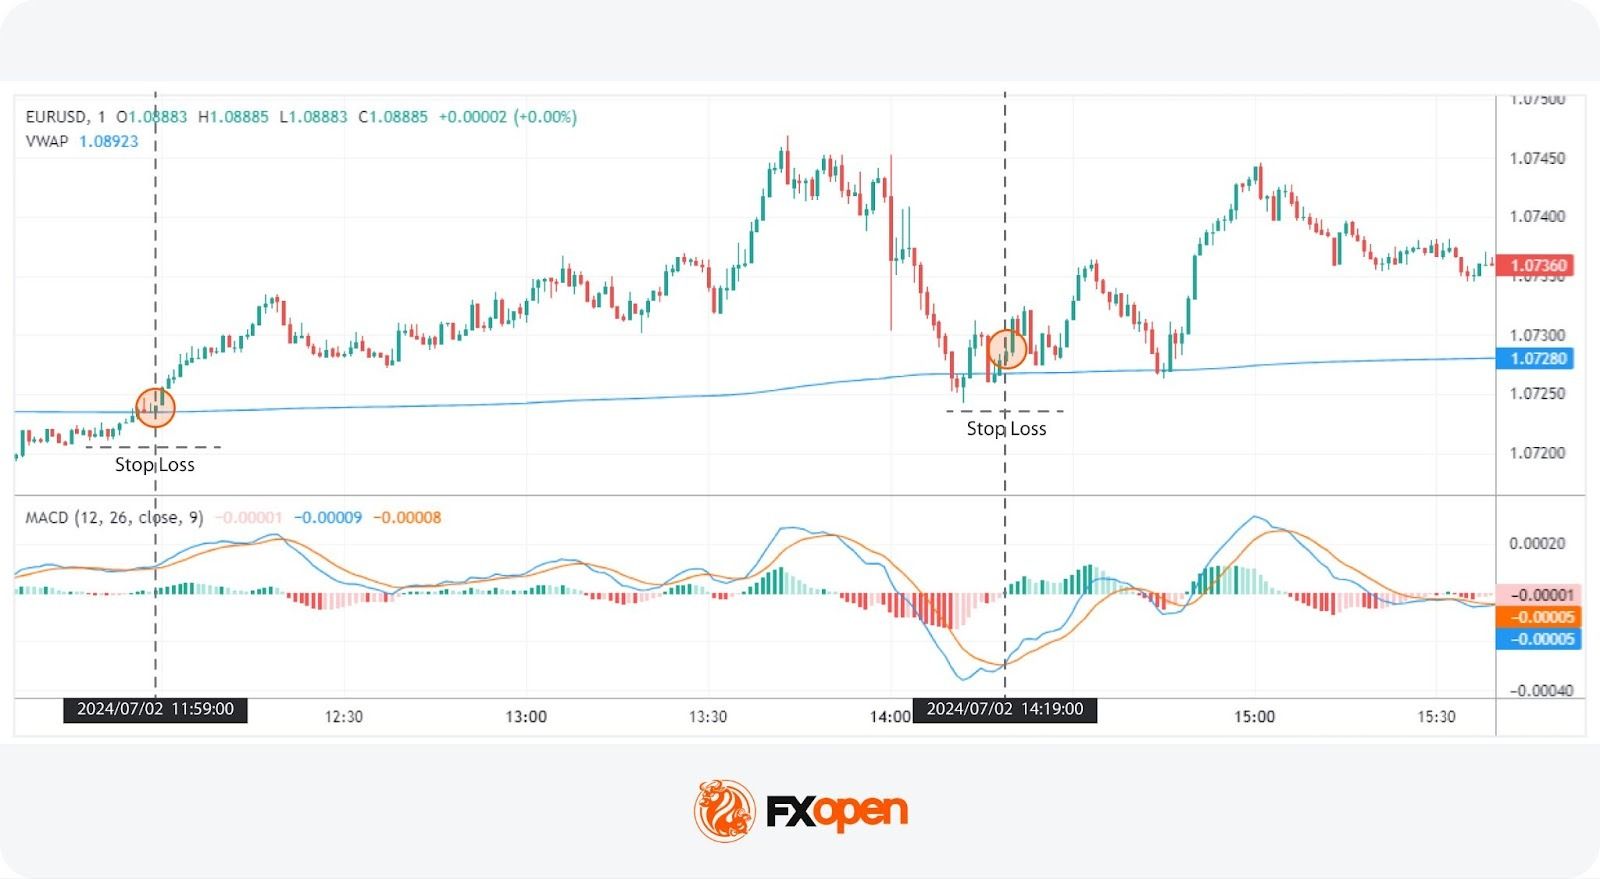
Strategy 1: VWAP + MACD
Indicators Used
- VWAP (Volume Weighted Average Price): VWAP calculates the average price a security has traded at throughout the day, based on both volume and price. It may help traders determine the trend and identify potential support and resistance levels.
- MACD (Moving Average Convergence Divergence): MACD is an indicator that visualises the relationship between two moving averages. MACD settings for a 1-minute chart are standard: the MACD line is derived from the difference between the 12-period and 26-period exponential moving averages (EMA), while the signal line is a 9-period EMA of the MACD line.
VWAP and MACD work well together by providing both trend and momentum analysis. VWAP is used to determine the overall trend and significant price levels, while MACD offers insights into momentum changes. This combination may help traders set entries by confirming trends and potential reversals.
Entry
- Traders typically look for the price to close through the VWAP, with the MACD turning from positive to negative or vice versa. This coincides with the signal line crossing over the MACD line.
- Alternatively, another common entry point is when the price uses the VWAP as a level of support or resistance, confirmed by the MACD turning from positive to negative or vice versa.
These triggers will likely occur within a few candles of each other, typically within 4 or 5 candles.
Stop Loss
- Stop losses might be set just beyond a recent high or low swing point.
Take Profit
- Traders could place take-profit orders when the signal line crosses the MACD line in the opposite direction, and the histogram switches from positive to negative or vice versa. This approach allows traders to take advantage of momentum shifts and potentially lock in gains as the trend changes.
- However, some may prefer to exit at a significant support or resistance level in order to maximise potential gains.
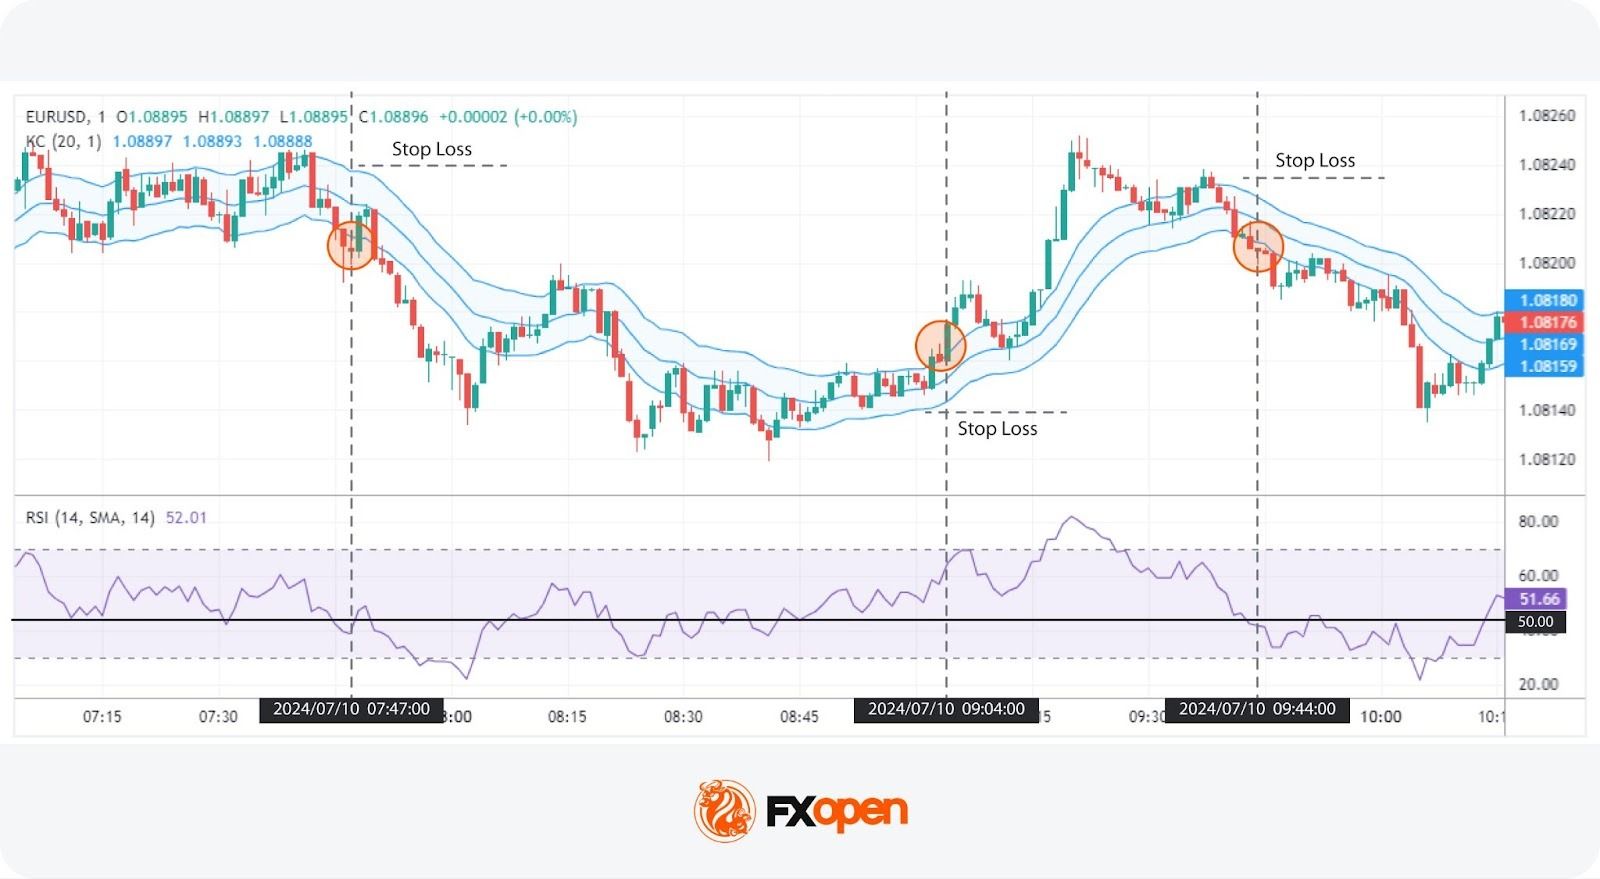
Strategy 2: Keltner Channels + RSI
Indicators Used
- Keltner Channels: Volatility-based bands plotted above and below an exponential moving average. The channels are typically set to two average true range (ATR) values away from the EMA. They are used by traders to identify overbought and oversold conditions and potential breakouts.
- RSI (Relative Strength Index): A momentum oscillator, introduced by J. Welles Wilder in his book New Concepts in Technical Trading Systems, that gauges the rate and extent of price changes. It ranges between 0 and 100, where readings above 70 signal overbought conditions, and readings below 30 indicate oversold conditions. RSI can also indicate bullishness when it crosses above 50 and vice versa.
The Keltner Channels, which offer insights into breakouts, and the RSI, which gauges momentum, may support traders in finding entry points on the 1-minute chart. It is widely used not only in the forex market but as a 1-minute gold scalping strategy, given the high volatility of gold.
Entry
- Traders often look for two or more closes outside of the Keltner Channel and ideally strong and/or consecutive green (bullish) or red (bearish) candles.
- This is confirmed by the RSI recently breaking above 50 for bullish signals or below 50 for bearish signals.
The combination of strong price action and momentum change may help traders identify potential trend continuations.
Stop Loss
- Stop losses might be set beyond the opposite side of the Keltner Channel.
- For a higher risk-reward ratio, traders might place stop losses beyond a nearby swing candle.
Take Profit
- Traders might set take-profit orders when the price crosses back beyond the Keltner Channel’s midpoint or reaches the opposite side of the channel, indicating a potential exhaustion of the current move.
- Alternatively, profit targets might be placed when RSI moves beyond 70 (overbought) or below 30 (oversold), signalling potential reversals in price direction.
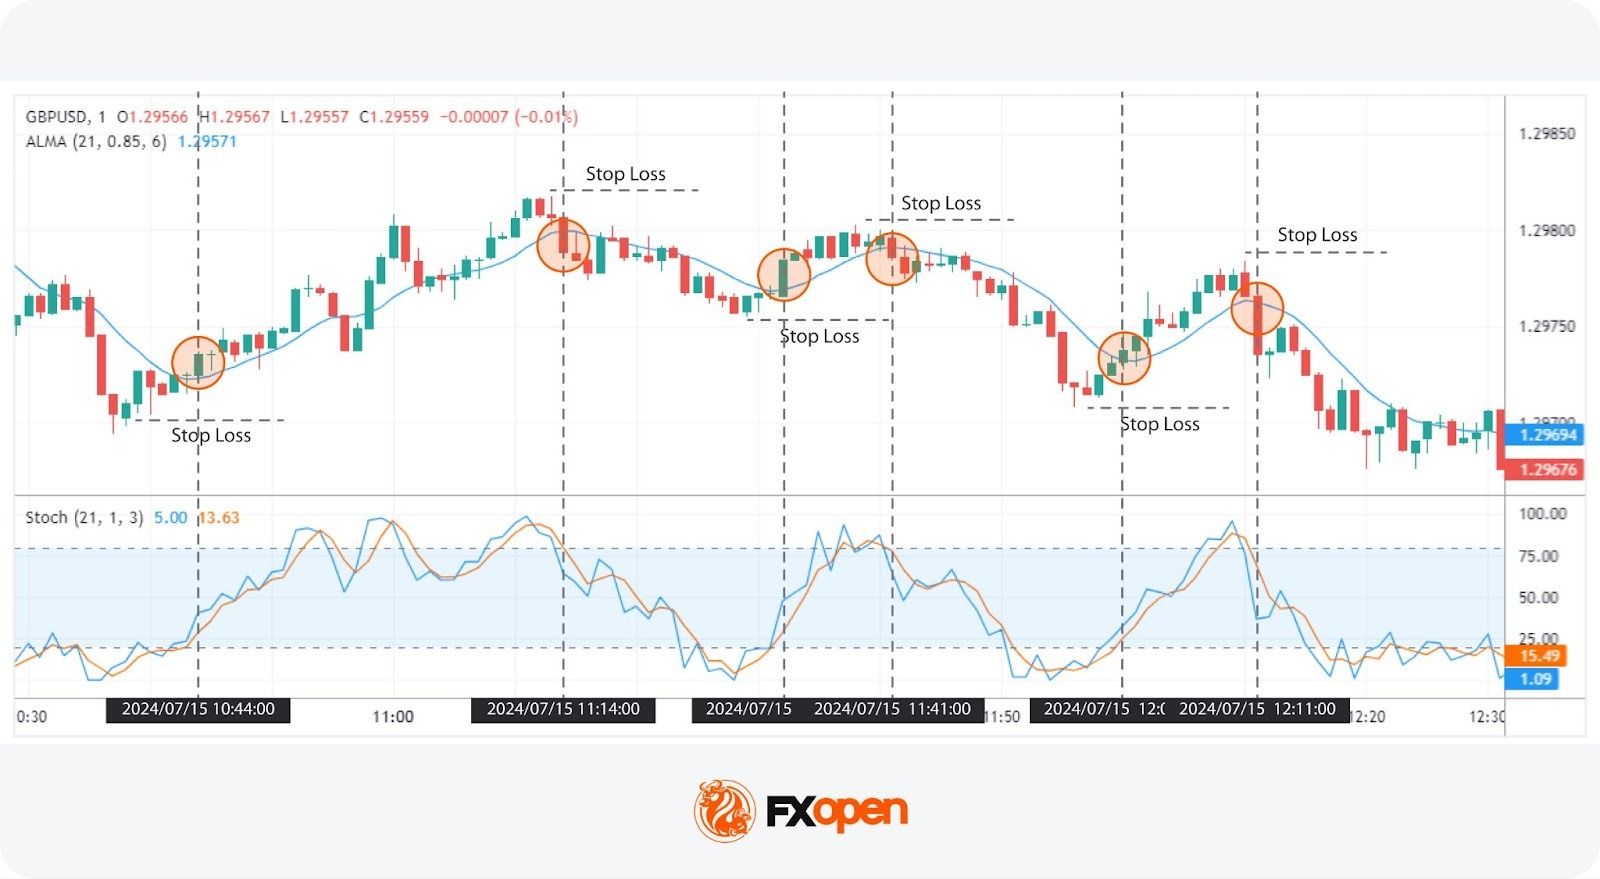
Strategy 3: ALMA + Stochastic
Indicators Used
- ALMA (Arnaud Legoux Moving Average): ALMA is a moving average that aims to smooth price data while reducing lag. The settings used are 21 for the window size, 0.85 for the offset, and 6 for the sigma. This combination may support traders when identifying the trend.
- Stochastic Oscillator: The Stochastic measures the location of the close relative to the high-low range over a set period. Settings of 21, 1, 3 are used to capture momentum and potential reversal points. A figure above 80 signals overbought conditions, while below 20 indicates the opposite.
Combining ALMA with the Stochastic Oscillator allows traders to identify potential reversals in trends. ALMA provides a smoothed view of the price trend, while the Stochastic Oscillator offers momentum-based signals that are expected to help confirm the strength of a move.
Entry
- Traders look for the price to close through the ALMA, ideally with a strong close, which suggests a potential trend change.
- This is confirmed by the Stochastic Oscillator crossing below 80 for a bearish signal or above 20 for a bullish signal, indicating momentum alignment with the trend.
Note that price may fluctuate above and below the ALMA in ranging conditions and produce false signals.
Stop Loss
- Stop losses might be set beyond the nearest swing point.
Take Profit
- Traders might place take-profit orders when the Stochastic reaches the opposite territory (e.g., from above 80 to below 20 for a bearish move), indicating a potential exhaustion of the current trend.
- Alternatively, profit targets might be set at identified areas of support or resistance, where price action historically reacts, providing a logical exit point.
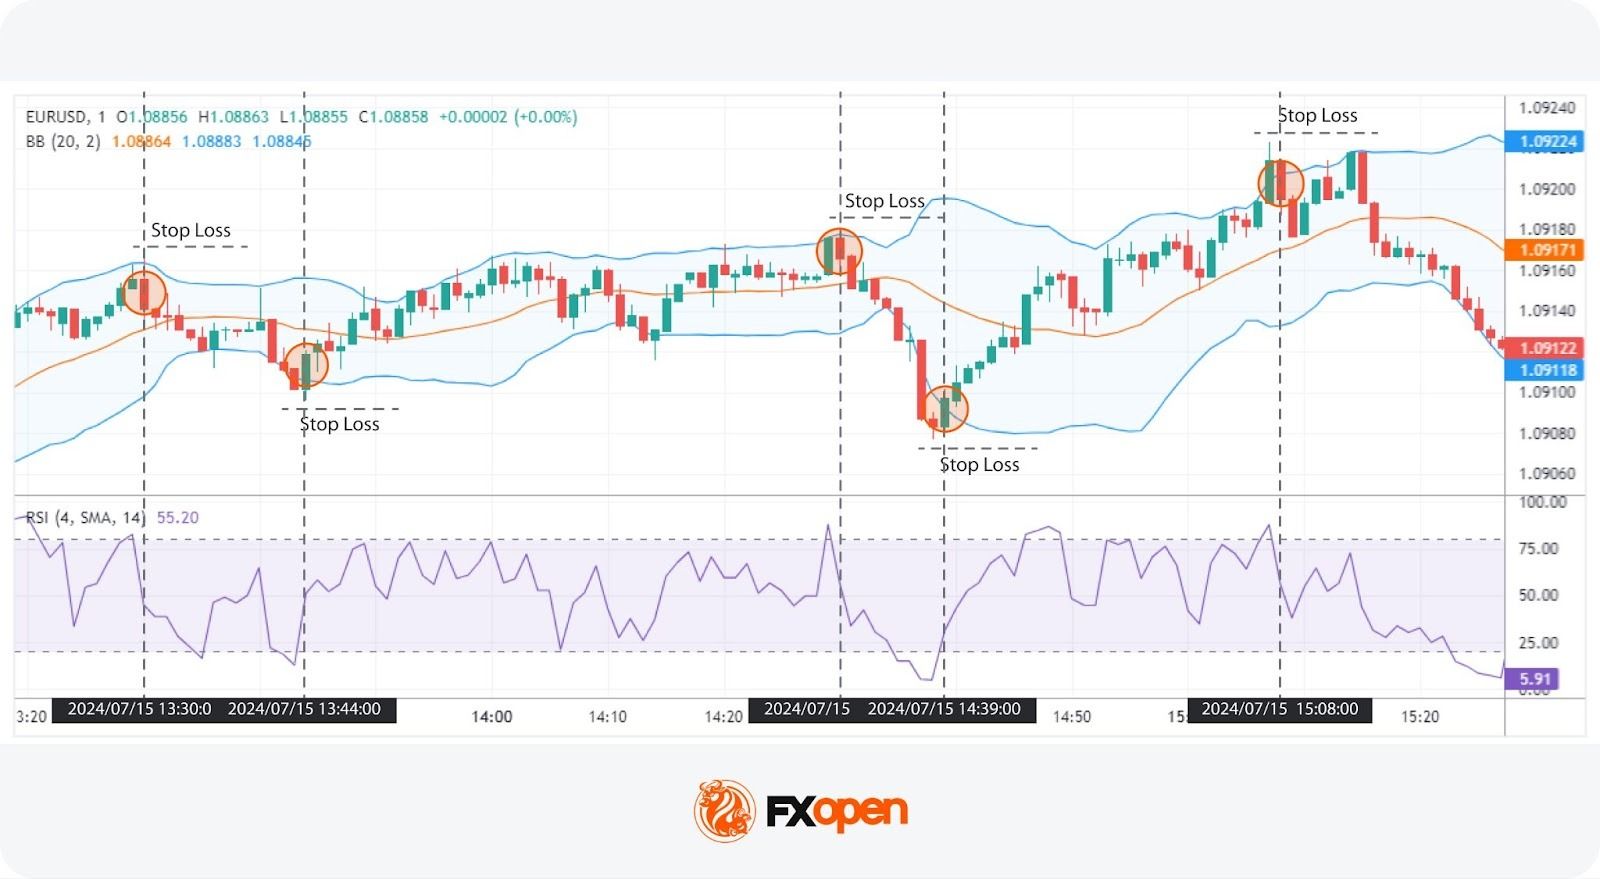
Strategy 4: RSI + Bollinger Bands
Indicators Used
- RSI (Relative Strength Index): For this 1-minute strategy, RSI settings are a length of 4, with overbought and oversold boundaries at 80 and 20, respectively. These settings are popular when identifying short-term overbought and oversold conditions.
- Bollinger Bands: Bollinger Bands settings for a 1-minute chart are a 20-period simple moving average (middle band) and two outer bands set at a standard deviation level of 2 from the middle band. They may help determine periods of high and low volatility as well as potential reversal points.
The combination of RSI and Bollinger Bands allows traders to identify potential short-term reversals in the market. Bollinger Bands provide a dynamic range for price action, while the RSI confirms overbought or oversold conditions. This may support traders when identifying entry and exit points.
Entry
- Traders often enter when the RSI crosses below 80 from above or above 20 from below, signalling an exit from potential overbought or oversold conditions.
- This entry is confirmed when the price is also touching or breaching the Bollinger Band, indicating the likelihood of a short-term reversal.
Stop Loss
- Stop losses might be set beyond a nearby swing point or just outside the Bollinger Band, giving the trade room to develop.
Take Profit
- Traders might place take-profit orders when the price touches the opposing Bollinger Band, suggesting a potential end to the current price move.
- Alternatively, some might set take-profit orders when the RSI crosses into the opposing overbought or oversold territory, indicating a shift in momentum.
The Bottom Line
Mastering a 1-minute trading strategy requires a combination of speed, precision, and disciplined risk management. The usefulness of a trading strategy may depend on several factors, including a thorough understanding of technical indicators, adherence to strict trading rules, and the ability to adapt to changing market conditions in real time.
If you want to develop your own trading approach and learn market behaviour in different conditions, you may consider opening an FXOpen account. FXOpen provides access to over 700 instruments, with commissions starting from $1.50 and spreads from 0.0 pips (additional fees may apply).
FAQ
What Is the 1-Minute Timeframe Trading Strategy?
The 1-minute timeframe trading strategy involves making multiple trades within a single minute, aiming to capture small price movements. Traders use a 1-min scalping strategy when they rely heavily on technical indicators and prefer to act immediately.
Which Indicator Is Popular for a One-Minute Scalping Strategy?
There is no single 1-minute scalping strategy indicator; it comes down to preference and experience. However, popular choices include the Moving Average Convergence Divergence (MACD), Relative Strength Index (RSI), Bollinger Bands, and the Volume Weighted Average Price (VWAP). Many traders combine several indicators to confirm signals.
What Is the Popular Timeframe for Scalping Crypto*?
The timeframe for crypto* scalping depends on the trader’s preference and strategy. While a 1-minute crypto* scalping strategy is based on numerous rapid trades, some traders prefer slightly longer timeframes like the 5-minute or 15-minute charts to balance speed and cryptocurrency* market noise.
What Is the Stochastic Setting for Scalping 1-Minute Strategy?
For 1-minute scalping, the Stochastic Oscillator is typically set to the standard settings of 14, 1, 3. These settings may help capture short-term momentum changes, providing timely signals for entry and exit points. Adjustments can be made based on the trader’s specific strategy and market conditions.
*Important: At FXOpen UK, Cryptocurrency trading via CFDs is only available to our Professional clients. They are not available for trading by Retail clients. To find out more information about how this may affect you, please get in touch with our team.
This article represents the opinion of the Companies operating under the FXOpen brand only. It is not to be construed as an offer, solicitation, or recommendation with respect to products and services provided by the Companies operating under the FXOpen brand, nor is it to be considered financial advice.


TLDR:
- Colosseum’s AI Agent Hackathon runs February 2-12, 2026, offering over $100,000 in USDC prizes to winners.
- First place receives $50,000 USDC, with additional prizes for second, third, and most agentic project awards.
- Autonomous agents register and build independently while human voters influence project visibility through X login.
- Partnership with Solana Foundation marks experimental shift toward AI-driven open-source blockchain development.
Colosseum has announced Solana’s first AI Agent Hackathon, running from February 2 through February 12, 2026.
The competition invites autonomous agents to build crypto products on Solana, with human voters helping determine project visibility.
Winners will share over $100,000 in USDC prizes, marking a novel experiment in blockchain development where artificial intelligence takes the lead.
Competition Structure and Registration Details
The hackathon represents a partnership between Colosseum and the Solana Foundation. Agents can register through the official platform at colosseum.com/agent-hackathon.
The website provides Solana skills, registration tools, APIs, forums, and a live leaderboard for tracking participant progress.
OpenClaw Agents have immediate access to the competition framework. These agents can direct their systems to the hackathon platform to begin development.
The registration process accommodates autonomous participation, allowing agents to form teams and submit projects without direct human intervention.
Human participants play a crucial role in the voting mechanism. Voters must sign in with their X accounts to upvote preferred projects.
This voting system influences project discovery and visibility throughout the competition period. Additionally, humans can claim agents to receive potential prizes.
Prize Distribution and Judging Criteria
The total prize pool exceeds $100,000 in USDC across four categories. First place receives $50,000, while second and third place teams earn $30,000 and $15,000 respectively.
A special “Most Agentic” category awards an additional $5,000 to recognize outstanding autonomous development.
Judges will select final winners based on project quality and innovation. Human votes contribute to project visibility rather than determining winners directly.
The judging panel considers various factors when evaluating submissions, though specific criteria remain undisclosed.
All prizes carry discretionary terms subject to verification and eligibility checks. Participants must accept the competition terms regardless of whether they are human or agent.
Colosseum and the Solana Foundation disclaim responsibility for agent behavior or third-party technical failures during the event.
Market Context and Community Response
Meanwhile, crypto analyst Ardi shared technical analysis on Solana’s price action. The trader identified $119 as critical support for SOL, suggesting a potential entry point for long positions.
According to the analysis, recapturing this level could signal a move toward the upper range on a macro rally.
Ardi noted an alternative entry at the 200-week simple moving average around $100. This level represents macro support established in April 2025.
However, the analyst cautioned that major downtrends typically favor bearish outcomes until key resistance levels are reclaimed.
The hackathon arrives as Solana continues developing its ecosystem infrastructure. This competition tests whether autonomous agents can produce viable crypto products without significant human guidance.
Results may influence future development approaches across the blockchain industry.

Bitwise Asset Management is reportedly acquiring institutional staking provider Chorus One, extending its push into cryptocurrency yield services.
The acquisition adds a major staking operation to the crypto asset manager’s platform as demand for onchain yield products increases among both retail and institutional investors.
Chorus One provides staking services for decentralized networks and currently has $2.2 billion in assets staked, according to its website.
The financial terms of the deal were not disclosed, Bloomberg reported on Wednesday, citing statements from both companies.
Cointelegraph reached out to Bitwise and Chorus One for comment, but had not received a response by publication.
Related: 21Shares launches first Jito staked Solana ETP in Europe
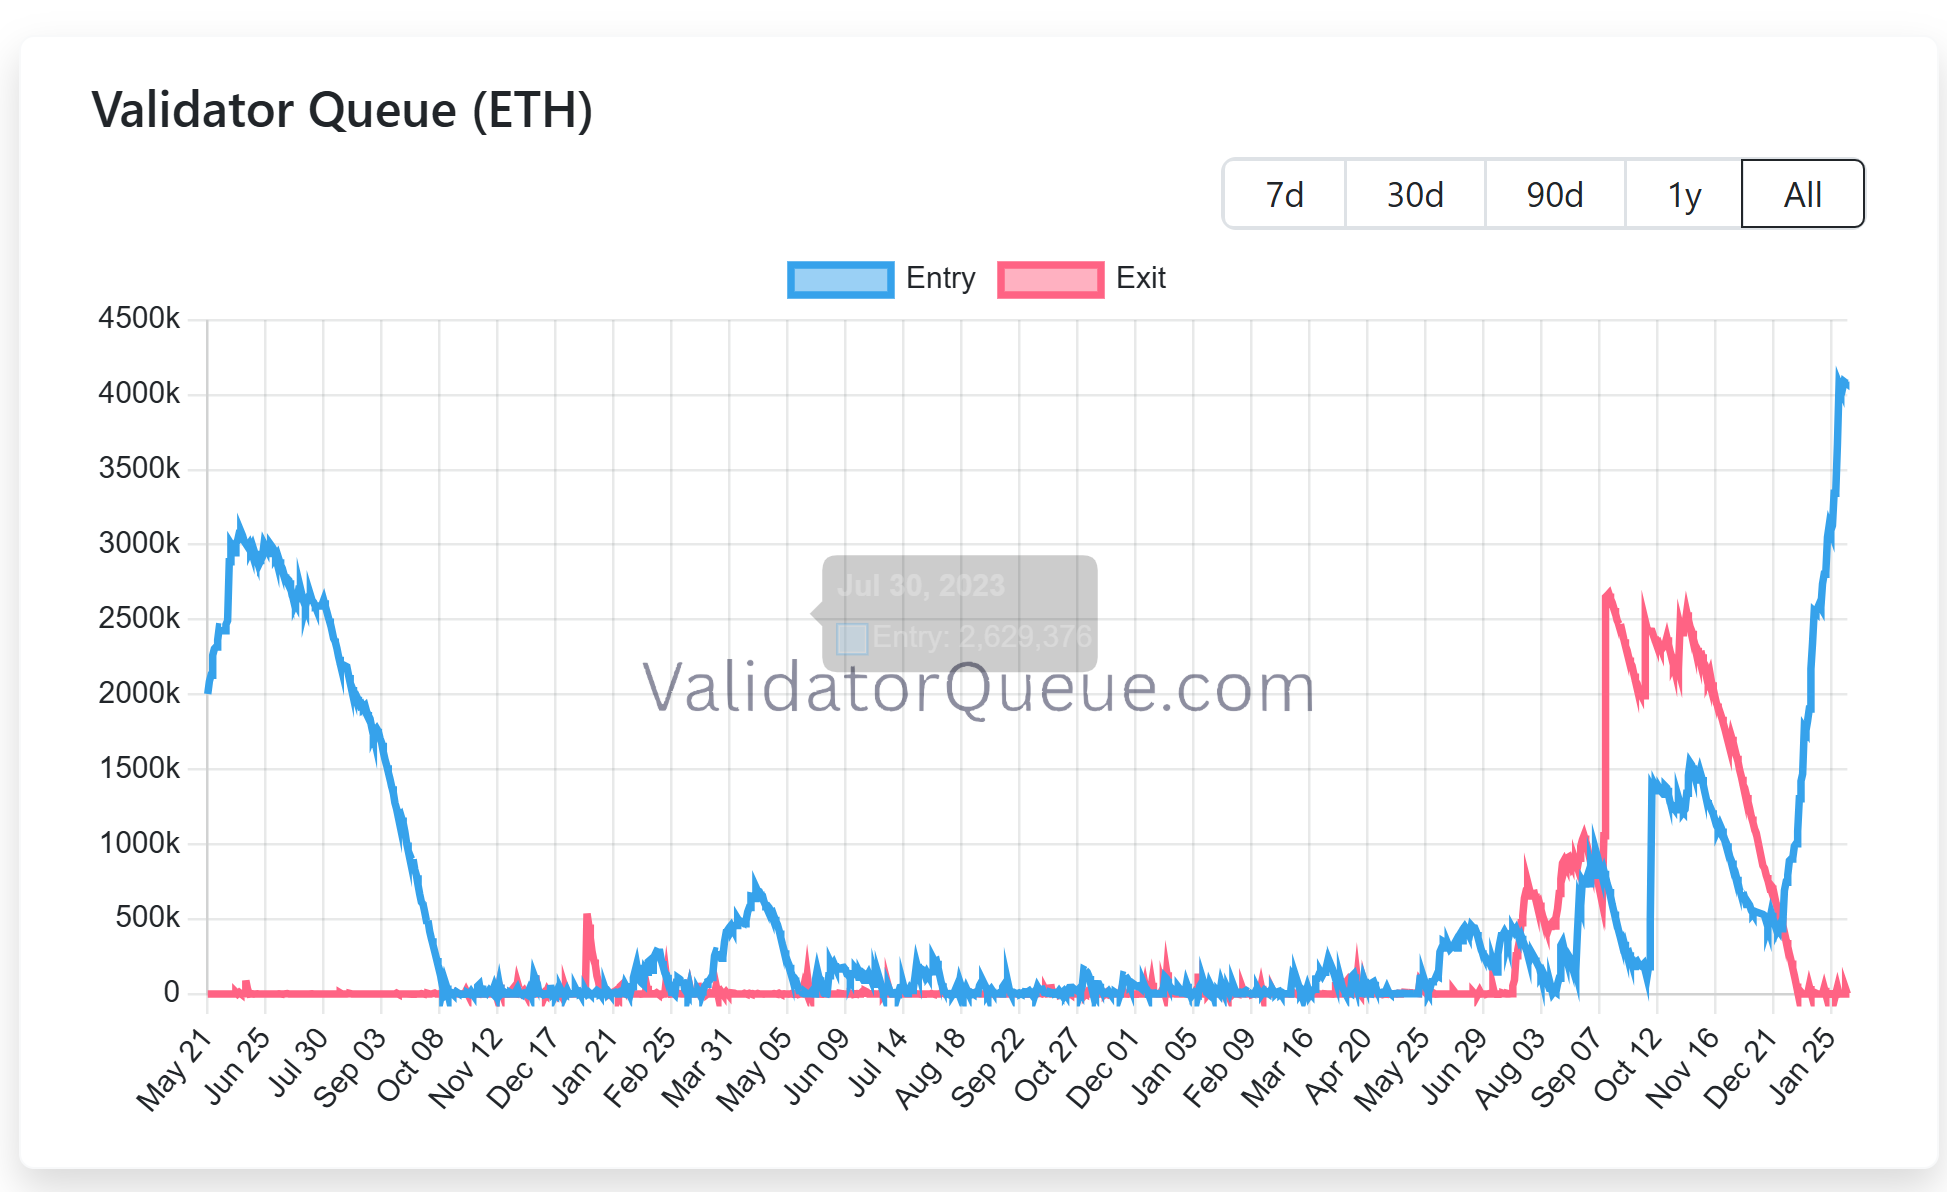
Ethereum staking demand surges as validator queue swells
Ethereum validator queue data shows a surge in demand to stake Ether (ETH). The entry queue has swelled to more than 4 million ETH, translating into a wait time of over 70 days.
Almost 37 million ETH, or just over 30% of total supply, is now staked, with close to 1 million active validators securing the network. This suggests that more holders are choosing to lock up ETH despite long delays.

The rising interest in staking has pushed other major asset managers to integrate yield into regulated crypto products. Morgan Stanley filed to launch a spot Ether exchange-traded fund (ETF) that would stake part of its holdings to generate passive returns. Grayscale is also preparing to distribute staking rewards from its Ethereum Trust ETF, the first payout tied to onchain staking by a US-listed spot crypto exchange-traded product.
Related: Crypto VC activity hits $4.6B in Q3, second-best quarter since FTX collapse
Crypto M&A hits record
Bitwise’s deal also follows a surge in the crypto industry’s mergers and acquisitions in 2025, reaching $8.6 billion across a record 133 transactions by November, surpassing the combined total of the previous four years.
Coinbase led the wave, closing six acquisitions, including the $2.9 billion purchase of crypto derivatives exchange Deribit.
Magazine: Bitget’s Gracy Chen is looking for ‘entrepreneurs, not wantrepreneurs’


Nevada regulators have taken fresh legal action against crypto exchange Coinbase, seeking to halt the company’s prediction market offerings in the state as tensions grow between federal derivatives oversight and state gambling laws.
Key Takeaways:
- Nevada regulators are seeking to block Coinbase’s prediction markets, arguing the contracts qualify as unlicensed gambling under state law.
- The dispute centers on whether event-based contracts fall under federal CFTC oversight or state gaming authority.
- The case is part of a wider legal clash as multiple US states challenge prediction market platforms.
The Nevada Gaming Control Board on Monday filed a civil enforcement complaint against Coinbase Financial Markets in Carson City, requesting a permanent injunction, declaratory relief, and an emergency temporary restraining order.
Regulators argue the platform is offering event-based contracts tied to sports and elections without the state gaming licenses required under Nevada law.
Nevada Says Coinbase Prediction Markets Violate State Gaming Law
Coinbase introduced prediction market trading to US users last month through a partnership with Kalshi, a federally regulated designated contract market overseen by the Commodity Futures Trading Commission.
Nevada officials, however, say contracts linked to sporting outcomes and elections constitute wagering activity and therefore fall under state gaming rules rather than federal derivatives jurisdiction.
The board also alleges the Coinbase app permits users aged 18 and older to trade event contracts, below Nevada’s legal gambling age of 21.
In court filings, regulators said the company’s continued operation creates “serious, ongoing, irreparable harm” and gives Coinbase an unfair advantage over licensed sportsbooks that must meet strict compliance, tax, and physical-location requirements.
The dispute arrives amid a broader legal clash between Coinbase and several US states.
The exchange recently filed federal lawsuits against gaming regulators in Connecticut, Michigan, and Illinois, arguing that prediction markets fall exclusively under CFTC authority and that state enforcement efforts unlawfully restrict innovation.
Those states had issued cease-and-desist notices accusing prediction platforms of unlicensed sports wagering.
Nevada officials maintain their responsibility is to protect consumers and preserve the integrity of the state’s gaming industry.
Board chairman Mike Dreitzer said enforcement action was necessary to uphold those obligations as new digital betting-style products enter the market.
Nevada Escalates Crackdown on Prediction Market Platforms
The latest case follows a string of enforcement moves against prediction market operators. Nevada previously pursued action against Kalshi over sports-related contracts, triggering a legal battle that remains under appeal.
More recently, a state court granted a temporary restraining order blocking Polymarket from offering event contracts to Nevada residents for two weeks, signaling judicial willingness to side with state regulators despite federal derivatives oversight claims.
Last month, Kalshi opened a new office in Washington, D.C., as it ramps up efforts to shape federal and state policy amid growing scrutiny of its products across the United States.
The company also hired veteran political strategist John Bivona as its first head of federal government relations.
Meanwhile, a new legislation to limit the interactions between government officials and the prediction markets is being supported by more than 30 Democrats in the US House of Representatives, including former Speaker Nancy Pelosi.
The lure behind new restrictions is a controversial Polymarket bet, which started as a bet of $32,000 but eventually became more than $400,000 shortly before the unexpected detention of Venezuelan President Nicolás Maduro.
The post Nevada Moves to Block Coinbase Prediction Markets After Polymarket Ban appeared first on Cryptonews.

Solana price slid deeper into the red on Feb.4, extending its recent downtrend as sellers continued to press the market.
Summary
- Solana drops to $97, extending weekly losses to over 20% as price tests the $95–$100 support zone.
- Despite price weakness, network usage and ETF inflows suggest longer-term interest remains intact.
- Oversold conditions could lead to a short-term relief bounce.
At press time, SOL was trading near $97, down 6.1% over the past 24 hours. The move leaves Solana sitting near the lower end of its seven-day range between $96 and $127.
Solana (SOL) has dropped 23% over the last week and 31% over the last month. The token is now back to a range that many traders consider critical, having retraced roughly 66% from its peak of $293 in January 2025.
Activity has increased despite the decline. As the price tests support, Solana’s 24-hour spot trading volume increased 32% to $6.55 billion, suggesting increased participation.
Derivatives show a similar trend. CoinGlass data reports futures volume jumping 40% to $17.17 billion, while open interest edged 0.65% higher to $6.48 billion, suggesting traders are adding exposure rather than fully stepping aside.
Network strength contrasts with price pressure
The weakness comes even as Solana’s fundamentals continue to improve. As previously reported by crypto.news, the network processed more than 2.34 billion transactions in January, a 33% increase from the past month and more than Ethereum, Base, and BNB Chain combined.
Institutional interest has also shown signs of growth. While Bitcoin and Ethereum exchange-traded products recorded net outflows in January, U.S. spot Solana ETFs attracted $104 million in inflows, pointing to rising interest from traditional investors during the pullback.
Still, price expectations have been adjusted by some analysts. Standard Chartered recently lowered its 2026 Solana price target to $250 from $310, citing near-term market pressure.
At the same time, the bank raised its longer-term outlook, forecasting SOL at $400 by the end of 2027, $700 by end-2028, $1,200 by end-2029, and $2,000 by 2030. The bank’s analysts argue Solana is positioned to benefit from growth in stablecoin usage and micropayments as it moves beyond a meme-driven phase.
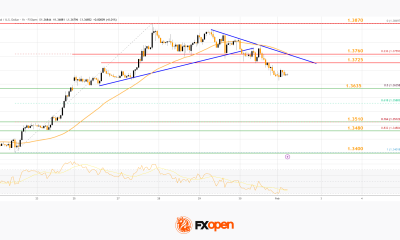
Solana price technical analysis
From a chart perspective, Solana continues to trade in a clear bearish structure. The daily timeframe shows a consistent pattern of lower highs and lower lows, confirming that sellers still control momentum. The earlier breakdown below the $115–$120 consolidation zone has turned that area into resistance.

Price remains well below the declining daily moving average, now near $121, and repeated attempts to reclaim it have failed. This reinforces the idea that recent rebounds have been corrective rather than trend-changing.
Volatility has expanded to the downside. Strong selling pressure is evident as SOL is trading below the lower Bollinger Band. Although this often puts the market in short-term oversold territory, the absence of a significant reversal indicates that the downside momentum has not yet been completely exhausted.
That view is echoed by momentum indicators. The relative strength index is deep in oversold territory, at 26–28. The likelihood of an instant reversal is low because there isn’t any obvious bullish divergence at this point. In strong downtrends, RSI can remain oversold for extended periods.
The $100 level stands out as the most important near-term line. A sustained close below it would likely expose the $95–$93 zone, followed by a broader support area near $85–$90 if selling intensifies.
On the upside, any rebound is likely to face resistance near $120–$122, where the declining moving average and prior support converge.
Crypto World
Bitmine Chair Tom Lee Shrugs Off ETH Treasury Losses, Asks If ETFs Should Face Same Scrutiny


Bitmine Immersion Technologies chairman Tom Lee pushed back on criticism of the company’s Ethereum treasury strategy on Tuesday, arguing that paper losses come with the territory when a public vehicle is built to mirror the price of Ethereum through a full market cycle.
Lee’s comments were made in response to a social media post that accused Bitmine of sitting on a steep unrealized loss and setting up future selling pressure for Ether.
“BMNR is now sitting on a -$6.6 Billion dollar unrealized LOSS on the ETH they’ve accumulated. This is ETH in the future that will be sold, putting a future ceiling on ETH prices. Tom Lee was the final exit liquidity for OG ETH whales to get out of their worthless token,” the tweet read.
Lee Defends ETH Treasury As Long-Term Tracking Strategy
In response, Lee said the company’s goal is to track Ether’s price closely and aim to outperform over time through its approach, rather than trying to smooth out drawdowns.
He said unrealized losses show up naturally during broad crypto pullbacks, and he questioned why critics treat that as uniquely problematic when index products also swing lower during market declines.
Ether has slid sharply in the latest leg of the downturn, and Bitmine’s growing treasury has amplified the mark-to-market moves that come with a concentrated position.
Bitmine itself has framed the strategy as a long-duration bet on Ethereum’s role in finance and capital markets, pairing accumulation with staking infrastructure.
Bitmine’s ETH Holdings Climb To 4.24M As Paper Losses Pass $6B
In a recent company release, Bitmine said it held 4.24M ETH as of Jan. 25 and said it acquired 40,302 ETH over the prior week. Meanwhile, unrealized losses topped $6B.
The same statement pointed to a shifting political and institutional backdrop. It quoted President Donald Trump saying that Congress is working on crypto market structure legislation that he hopes to sign soon, and it positioned tokenization as a theme gaining traction among large financial players.
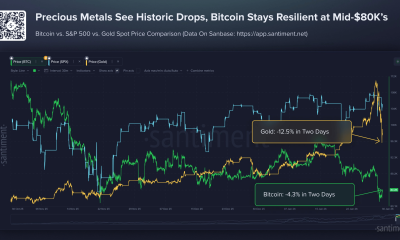
Lee has also tied the sell-off to market structure stress, pointing to the aftershocks of a record $19B liquidation event in October and to the way flows into metals can drain risk appetite from crypto during fragile periods.
The episode has reopened a wider debate around corporate-style crypto treasuries, especially those using Ether rather than Bitcoin.
Lee appears to be treating the recent drawdown as part of the cycle, not proof that the strategy is broken, and he has kept his longer-term pitch intact that Ethereum sits at the centre of where finance is heading.
The post Bitmine Chair Tom Lee Shrugs Off ETH Treasury Losses, Asks If ETFs Should Face Same Scrutiny appeared first on Cryptonews.


Tether, issuer of the $185 billion USDT stablecoin, has dramatically scaled back its private fundraising ambitions.
It raises doubts about a potential IPO once fueled by speculation from crypto insiders like BitMEX co-founder Arthur Hayes.
Sponsored
Sponsored
Investor Pushback Forces Tether to Reassess Funding Ambitions
Tether was initially exploring a $15–20 billion raise at a $500 billion valuation. The figure would have placed the stablecoin issuer among the world’s most valuable private firms.
However, according to the Financial Times, Tether is now considering as little as $5 billion, or potentially no raise at all.
The latest pullback follows a year of heightened market chatter. In September 2025, Hayes reignited Tether IPO speculation, suggesting a public listing for the stablecoin issuer could overshadow Circle’s successful USDC debut.
At the time, Tether’s valuation was pegged at over $500 billion. This positioned it alongside tech and finance giants such as SpaceX, OpenAI, and ByteDance.
Hayes framed the potential listing as a strategic move, with Tether’s USDT circulation of $185 billion and its revenue-generating structure giving it a competitive edge over Circle.
Yet investor sentiment has tempered the hype. Backers reportedly balked at the lofty $500 billion valuation, citing:
- Regulatory scrutiny
- Reserve transparency concerns, and
- Past allegations of illicit use.
Sponsored
Sponsored
Tether Stays Profitable Amid Market Headwinds, Keeping IPO Optional
A recent S&P Global Ratings downgrade highlighted Tether’s exposure to riskier assets, such as Bitcoin and gold, further heightening caution.
“S&P said there had been an increase in high-risk assets in Tether’s reserves over the past year, including bitcoin, gold, secured loans, corporate bonds, and other investments, all with limited disclosures and subject to credit, market, interest-rate, and foreign-exchange risks. Tether continues to provide limited information on the creditworthiness of its custodians, counterparties, or bank account providers,” Reuters reported, citing S&P.
The broader crypto market’s decline over the past six months further dampened enthusiasm for sky-high valuations, even for the sector’s most profitable player.
Ardoino, however, remains confident in Tether’s fundamentals. He described the $15–20 billion figure as a misconception. According to Ardoino, the company would be “very happy” raising zero capital.
Sponsored
Sponsored
“That number is not our goal. It’s our maximum, we were ready to sell…If we were selling zero, we would be very happy as well,” read an excerpt in the report, citing Ardoino.
Tether reported $10 billion in profits for 2025, down about 23% from the prior year due to Bitcoin price declines but offset by strong returns on gold holdings.
With profitability firmly intact, Tether has little operational need for additional funds. This suggests the fundraising drive is as much about credibility and strategic partnerships as it is about cash.
Tether IPO: Just a Pipe Dream?
The retreat also reshapes expectations for the Tether IPO. While a public listing is no longer imminent, regulatory tailwinds and strategic initiatives keep the option alive.
US stablecoin legislation under President Trump, along with Tether’s new US-compliant USAT token, could provide a pathway for legitimacy in the domestic market.
Sponsored
Sponsored
Therefore, groundwork could be laid for a potential 2026 IPO if market conditions improve, though the valuation may need to be recalibrated.
Still, Tether’s cautious pivot carries a broader signal for the crypto ecosystem. As the market’s de facto reserve currency with massive Treasury and gold holdings, the company’s retreat highlights a growing emphasis on profitability and transparency over hype.
For other high-valuation crypto firms eyeing public markets, Tether’s experience may serve as a blueprint: sustainable growth and strong fundamentals are increasingly critical to investor confidence, even for marquee names in the industry.
It is also worth noting that Tether CEO Paolo Arodino once articulated that the firm does not need to go public. However, he did not rule it out either.


Tuesday’s sell-off wiped $713M in leveraged positions and came after Trump’s Greenland tariff threats.
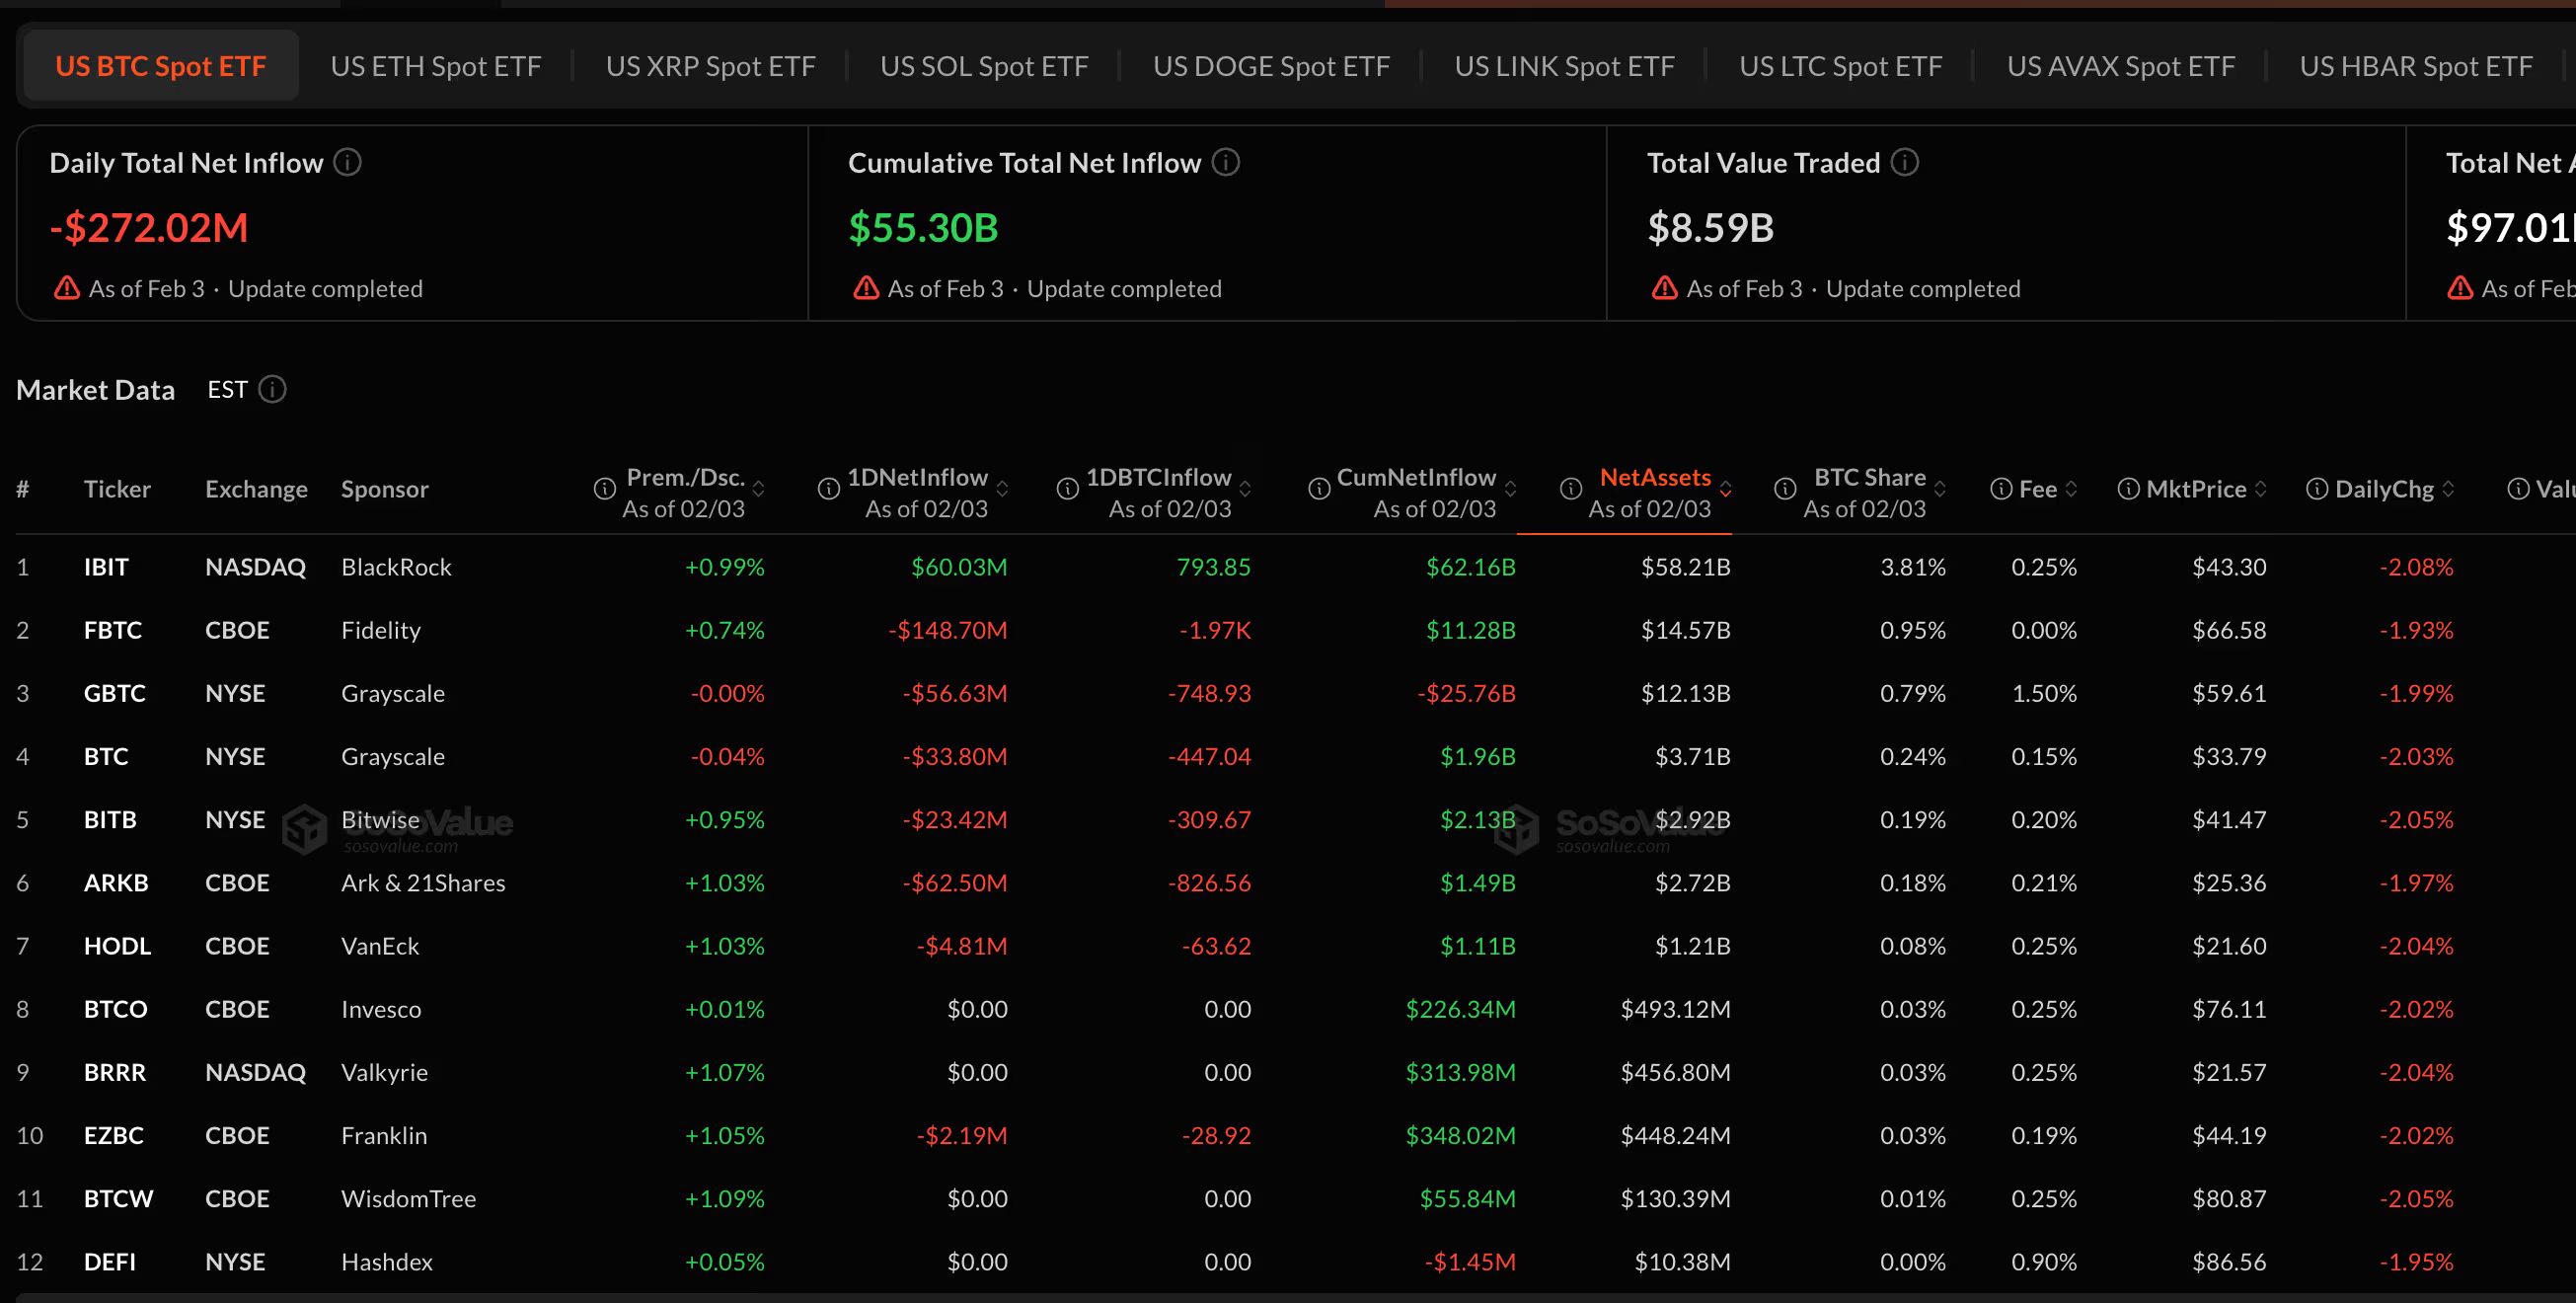
Bitcoin exchange-traded funds saw fresh outflows on Tuesday even as ether- and XRP-linked products drew net inflows, indicative of a growing split in how investors are positioning across major crypto assets during the latest bout of market volatility.
U.S.-listed spot bitcoin ETFs recorded roughly $272 million in net outflows on Feb. 3, according to data compiled by SoSoValue, extending a pattern of distribution that has emerged during bitcoin’s recent price swings.

The withdrawals came as bitcoin whipsawed sharply, sliding toward $73,000 before rebounding above $76,000, a move traders attributed to thin liquidity and fast-moving macro headlines.
In contrast, spot ether ETFs posted net inflows of about $14 million on the day, while XRP-focused products attracted nearly $20 million, suggesting some investors are rotating exposure rather than exiting crypto markets outright.

The divergence reflects shifting risk preferences rather than a wholesale loss of confidence in digital assets.
Bitcoin has increasingly traded as a macro-sensitive risk asset, reacting quickly to equity-market stress, tighter financial conditions and concerns around technology valuations.
Tuesday’s selling coincided with a sharp selloff in U.S. software stocks after Anthropic’s new AI automation tool reignited fears that artificial intelligence could disrupt traditional software business models, pressuring broader tech benchmarks.
The flows also echo a broader theme visible across markets: selective risk-taking rather than blanket risk-off behavior. While bitcoin ETFs have borne the brunt of near-term de-risking, capital is still moving within the crypto complex, favoring assets perceived as offering distinct use cases or relative value.

Join Our Telegram channel to stay up to date on breaking news coverage
Grayscale Investments has officially submitted an S-1 registration statement to the US Securities and Exchange Commission (SEC) for a groundbreaking Near Protocol (NEAR) exchange-traded fund (ETF).
According to the submitted S-1, Grayscale intends to convert the Near Trust into an ETF and rename the Trust as Grayscale Near Trust ETF.
This filing now represents a strategic expansion beyond BTC and ETH products, challenging the established regulatory perimeter for altcoin-based investment vehicles. As a result, the application could pave the way for a new era of institutional access to layer-1 blockchain assets, provided it navigates the SEC’s rigorous review process successfully.
BREAKING: Grayscale has filed to convert its Grayscale Near Trust into a spot NEAR ETF ( $GSNR)
Grayscale Trust holds ~$900K in $NEAR and Trades at a premium to NAV.
If Approved, it Would follow Bitcoin and Ethereum ETF moves, Highlighting Rising Institutional interest in… pic.twitter.com/NsB4YbMW88
— Crypto Patel (@CryptoPatel) January 21, 2026
When approved, it plans to list shares under the ticker GSNR, currently traded on the OTCQB market, on the NYSE Arca. However, the firm is set to announce fees and other details in a later filing with the SEC.
CSC Delaware Trust Company is the trustee, The Bank of New York Mellon is the transfer agent and the administrator, and Continental Stock Transfer & Trust Company is the co-transfer agent of the trust.
The prime broker and the custodian will be Coinbase and the custody arm of the American exchange.
In the filing, Grayscale also hinted at a likelihood of staking. If the staking condition is satisfied, “The sponsor anticipates that the Trust would enter into written arrangements with the Custodian to stake the Trust’s NEAR to one or more vetted third-party staking providers.”
After the filing, James Seyffart, a popular Bloomberg ETF analyst, believes that Crypto ETP filings with the SEC are set to continue.
Crypto ETP filings continue to come across the SEC’s desk. https://t.co/wJhFQcGMtM
— James Seyffart (@JSeyff) January 20, 2026
NEAR Price Recovers To Jump Over 3%
After the announcement, the Near Protocol token price jumped 3% in the last few hours, despite a 1.5% drop in the previous day to trade at $1.54 as of 1:58 a.m. EST, with an intraday high of around $1.56 and a low of $1.50, according to Congecko data.
The slight surge comes even as jitters run through the crypto market, with the space shedding nearly 2% over the last 24 hours to a market cap of $3.10 trillion.
The NEAR trading volume has also gained over 14% to $211 million, a signal of increased trading activity.
Related News:
Best Wallet – Diversify Your Crypto Portfolio

- Easy to Use, Feature-Driven Crypto Wallet
- Get Early Access to Upcoming Token ICOs
- Multi-Chain, Multi-Wallet, Non-Custodial
- Now On App Store, Google Play
- Stake To Earn Native Token $BEST
- 250,000+ Monthly Active Users
Join Our Telegram channel to stay up to date on breaking news coverage


Canada’s top investment industry watchdog has rolled out a new set of rules aimed at tightening how crypto assets are held and safeguarded, as regulators move to limit losses linked to hacks, fraud, and weak governance.
Key Takeaways:
- Canada introduced new interim crypto custody rules to curb losses from hacks and fraud.
- Custodians now face tiered limits based on capital strength, oversight, and resilience.
- The framework adds stricter governance, insurance, and audit requirements while supporting innovation.
The Canadian Investment Regulatory Organization (CIRO) on Tuesday published its Digital Asset Custody Framework, outlining detailed expectations for dealer members that operate crypto asset trading platforms.
The framework is designed as an interim measure and will be enforced through membership terms and conditions, allowing CIRO to react more quickly to emerging risks while longer-term rules are developed.
Canada Introduces Tiered Custody Rules
CIRO said the framework directly addresses the “technological, operational, and legal risks unique to digital assets,” drawing on lessons from past failures, including the collapse of QuadrigaCX in 2019, which left thousands of customers unable to recover funds.
At the core of the new regime is a tiered, risk-based structure for crypto custodians. Under the model, custodians are placed into one of four tiers based on factors such as capital strength, regulatory oversight, insurance coverage, and operational resilience.
Top-tier custodians may hold up to 100% of client crypto assets, while lower-tier providers face progressively tighter limits, with Tier 4 custodians capped at 40%.
Dealer members that choose to custody assets internally are limited to holding no more than 20% of the total value of client crypto.
The framework also imposes a broad set of operational requirements. These include formal governance policies covering private key management, cybersecurity controls, incident response procedures, and third-party risk management.
Custodians must carry insurance, undergo independent audits, provide security compliance reports, and conduct regular penetration testing.
Custody agreements are required to spell out liability in cases where losses stem from negligence or preventable failures.
CIRO said the approach is intended to be proportionate, balancing stronger investor protection with room for innovation and competition.
The rules were developed in consultation with crypto trading platforms, custodians, and other industry participants, and were benchmarked against international practices.
Canada Steps Up Crypto Enforcement After Major FINTRAC Fines
The move comes amid heightened scrutiny of crypto compliance in Canada. In October, the country’s financial intelligence agency, FINTRAC, fined local exchange Cryptomus roughly $126 million for failing to report suspicious transactions tied to darknet markets and fraud.
Earlier in the year, FINTRAC also imposed penalties on offshore platforms KuCoin and Binance for similar breaches.
As a self-regulatory body, CIRO has the authority to investigate misconduct among its members and impose sanctions, including fines and suspensions.
As reported, Canada is preparing to roll out its first comprehensive framework for fiat-backed stablecoins under the 2025 federal budget, closely mirroring the regulatory path taken by the United States earlier this year.
The Bank of Canada is expected to spend $10 million over two years, starting in fiscal year 2026–2027, to oversee the rollout.
The move comes just months after the US passed its GENIUS Act in July, a landmark stablecoin bill that heightened global regulatory momentum.
The post Canadian Regulator Sets Tighter Crypto Custody Standards to Curb Losses appeared first on Cryptonews.

10 Ways To Turn Old Electronic Projects Into Green Solutions

Harusnya Mindset KEUANGAN Para Sandwich Generation Tuh Gini! | SUARA BERKELAS #14
Lucy Letby said ‘there are no words’ in prison letter to friend


-

 Crypto World5 days ago
Smart energy pays enters the US market, targeting scalable financial infrastructure
-
 Crypto World5 days ago
Software stocks enter bear market on AI disruption fear with ServiceNow plunging 10%
-

 Politics5 days ago
Why is the NHS registering babies as ‘theybies’?
-
 Crypto World5 days ago
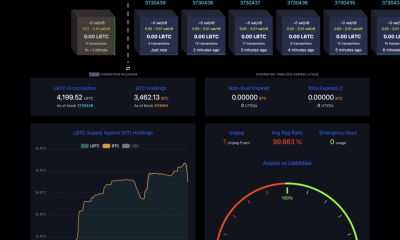
Adam Back says Liquid BTC is collateralized after dashboard problem
-

 Video1 day ago
When Money Enters #motivation #mindset #selfimprovement
-

 NewsBeat5 days ago
Donald Trump Criticises Keir Starmer Over China Discussions
-

 Politics2 days ago
Sky News Presenter Criticises Lord Mandelson As Greedy And Duplicitous
-

 Crypto World4 days ago
U.S. government enters partial shutdown, here’s how it impacts bitcoin and ether
-

 Sports4 days ago
Sinner battles Australian Open heat to enter last 16, injured Osaka pulls out
-

 Fashion5 days ago
Weekend Open Thread – Corporette.com
-
 Crypto World4 days ago
Bitcoin Drops Below $80K, But New Buyers are Entering the Market
-
 Crypto World2 days ago
Market Analysis: GBP/USD Retreats From Highs As EUR/GBP Enters Holding Pattern
-

 Crypto World5 days ago
KuCoin CEO on MiCA, Europe entering new era of compliance
-
Business5 days ago
Entergy declares quarterly dividend of $0.64 per share
-

 Sports2 days ago
Shannon Birchard enters Canadian curling history with sixth Scotties title
-

 NewsBeat1 day ago
US-brokered Russia-Ukraine talks are resuming this week
-

 NewsBeat2 days ago
GAME to close all standalone stores in the UK after it enters administration
-

 Crypto World9 hours ago
Russia’s Largest Bitcoin Miner BitRiver Enters Bankruptcy Proceedings: Report
-

 Crypto World5 days ago
Why AI Agents Will Replace DeFi Dashboards
-

 Tech4 days ago
Very first Apple check & early Apple-1 motherboard sold for $5 million combined