
Crypto World
Bitcoin ETF Holders Are $5K Underwater Even as Institutional Demand Returns


Institutional holders quietly added roughly 26,600 BTC to ETF positions during the recent recovery, a 2% increase in total holdings.
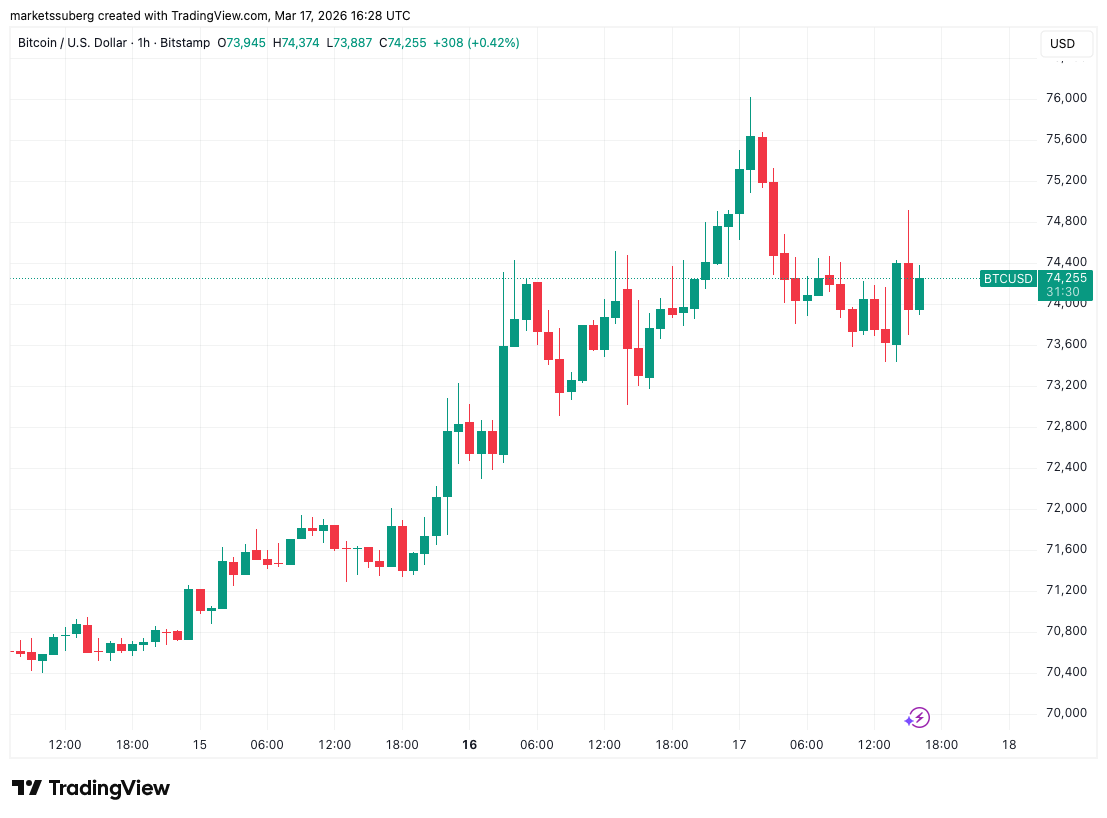
Bitcoin (BTC) touched $76,000 on March 17 to register its highest price level since early February, as institutional investors continued to put money into U.S. spot ETFs, extending a multi-day recovery streak coming after heavy outflows in February.
However, the rebound in demand is running into a key constraint, according to analyst Axel Adler Jr., with ETF investors still sitting on an average unrealized loss of $5,174, which he says could affect price action around the $80,000 mark.
ETF Flows Recover, But the $79,962 Realized Price Looms
In his latest market update, Adler said that spot Bitcoin ETF flows have gone through what he called a “full cycle” over the past month, going from capitulation in mid-February to a steady recovery in the last few weeks. According to him, from February 15 to 24, the seven-day average of ETF net flows stayed negative, hitting a low of about -1,883 BTC per day on February 18.
However, around February 25, the trend changed, with flows turning positive and peaking at about +3,387 BTC per day on March 2. Adler currently puts the seven-day average at around +1,472 BTC per day, with liquidity conditions also getting better. During the same period, the total number of ETF holdings rose by about 26,600 BTC, which is a little over 2%.
The analyst sees this change as a return of institutional demand after the earlier outflows. He does, however, point out that this demand is below a clearly defined level of resistance.
That level is the realized price for the ETF cohort, which Adler mapped at $79,962, an amount showing the average cost of buying an ETF for all investors. And with BTC trading just above $74,000 after earlier hitting a six-week high, it means the group still has an overall paper loss of over $5,000.
Adler described the gap as one of the most important structural features of the current market. This is because, as Bitcoin gets closer to the realized price, more investors will get closer to breaking even, which can make it more likely for them to sell. For that reason, the market technician says that the $80,000 region is a place where upward movement may slow down unless demand is strong enough to take in the potential extra supply.
You may also like:
Market to Test Resistance Condition
At the time of writing, data from CoinGecko showed BTC up over 5% in the last 7 days and the same across 30 days. However, the uptick was almost 9% over two weeks, although performance still lagged year-on-year, with the asset shedding nearly 11% from its value in that time, keeping it over 41% below its all-time high.
For now, Adler is watching the $80,000 level as the key battleground.
“A spot close above $79,962 combined with sustained ETF net inflow above +2,000 BTC per day would signal a regime change,” he wrote in his analysis.
Binance Free $600 (CryptoPotato Exclusive): Use this link to register a new account and receive $600 exclusive welcome offer on Binance (full details).
LIMITED OFFER for CryptoPotato readers at Bybit: Use this link to register and open a $500 FREE position on any coin!

Bitcoin consolidated recent gains in the face of blanket skepticism over its rebound, while gold threatened to give up $5,000 support.
Bitcoin (BTC) circled $74,000 after Tuesday’s Wall Street open as skepticism increased over BTC price strength.
Key points:
-
Bitcoin stalls after a trip to $76,000, with short-term targets including a retreat to $68,000.
-
Traders stand by the long-term bear market thesis for BTC/USD.
-
Gold continues to show weakness, risking the loss of $5,000 per ounce support.
Trader warns against “hyping up” BTC price move
Data from TradingView showed cooling BTC price volatility after a run to new six-week highs of $76,000 to start the daily candle.

This proved unsustainable as heavy resistance sent BTC/USD lower, leading to concerns of a fakeout for Telegram channel Technical Crypto Analyst.
“Bitcoin is trending upward inside a rising channel and approaching the $74K–$79K resistance zone; while structure remains bullish above the trendline, a rejection from current levels could trigger a pullback toward the $68K support area,” it wrote on the day.

Traders stayed wary, doubling down on existing doubts about the fate of Bitcoin’s relief rally.
“Still nothing on HTF that suggests the bear market has bottomed. No divs, no volume at lows, no reversal pattern, etc,” trader Roman wrote in his latest analysis on X, referring to higher time frames.
Roman argued that market participants were “hyping up” a comparatively modest uptick in price, and that history demanded a longer bear market.

On the latter point, trader Jelle agreed, pointing to the 0.618 Fibonacci retracement level as a key price point.
“Every bear market has been shallower than the one before it – but all of them have happened well below the 0.618 retracement, after months of boring sideways PA,” he told X followers.
“Even if we don’t get the usual drawdown, I’m pretty sure the boredom chop is coming. Patience.”

Analyst eyes Bitcoin “outperformance” versus gold
Macro conditions were cooler compared to the start of the week. US stocks continued a modest rebound, while WTI crude oil remained below the $100 per barrel mark.
Related: Bitcoin sparks ‘bull trap’ warning after BTC price rejects at $76K
Gold, however, teased a breakdown from $5,000 support, retesting that level for the third consecutive day.

Calls for Bitcoin to steal the spotlight from the precious metal thus grew louder.
“Stand by for the outperformance of the decade,” crypto analyst James Easton commented on the weekly BTC/XAU chart.

This article does not contain investment advice or recommendations. Every investment and trading move involves risk, and readers should conduct their own research when making a decision. While we strive to provide accurate and timely information, Cointelegraph does not guarantee the accuracy, completeness, or reliability of any information in this article. This article may contain forward-looking statements that are subject to risks and uncertainties. Cointelegraph will not be liable for any loss or damage arising from your reliance on this information.
Ethereum is finally showing more upside potential. After spending weeks building a base above the February lows, ETH has now pushed into a key resistance zone, which makes this one of the more important tests since the selloff began. The rebound is real, but it is now approaching an area where sellers previously stepped in.
Ethereum Price Analysis: The Daily Chart
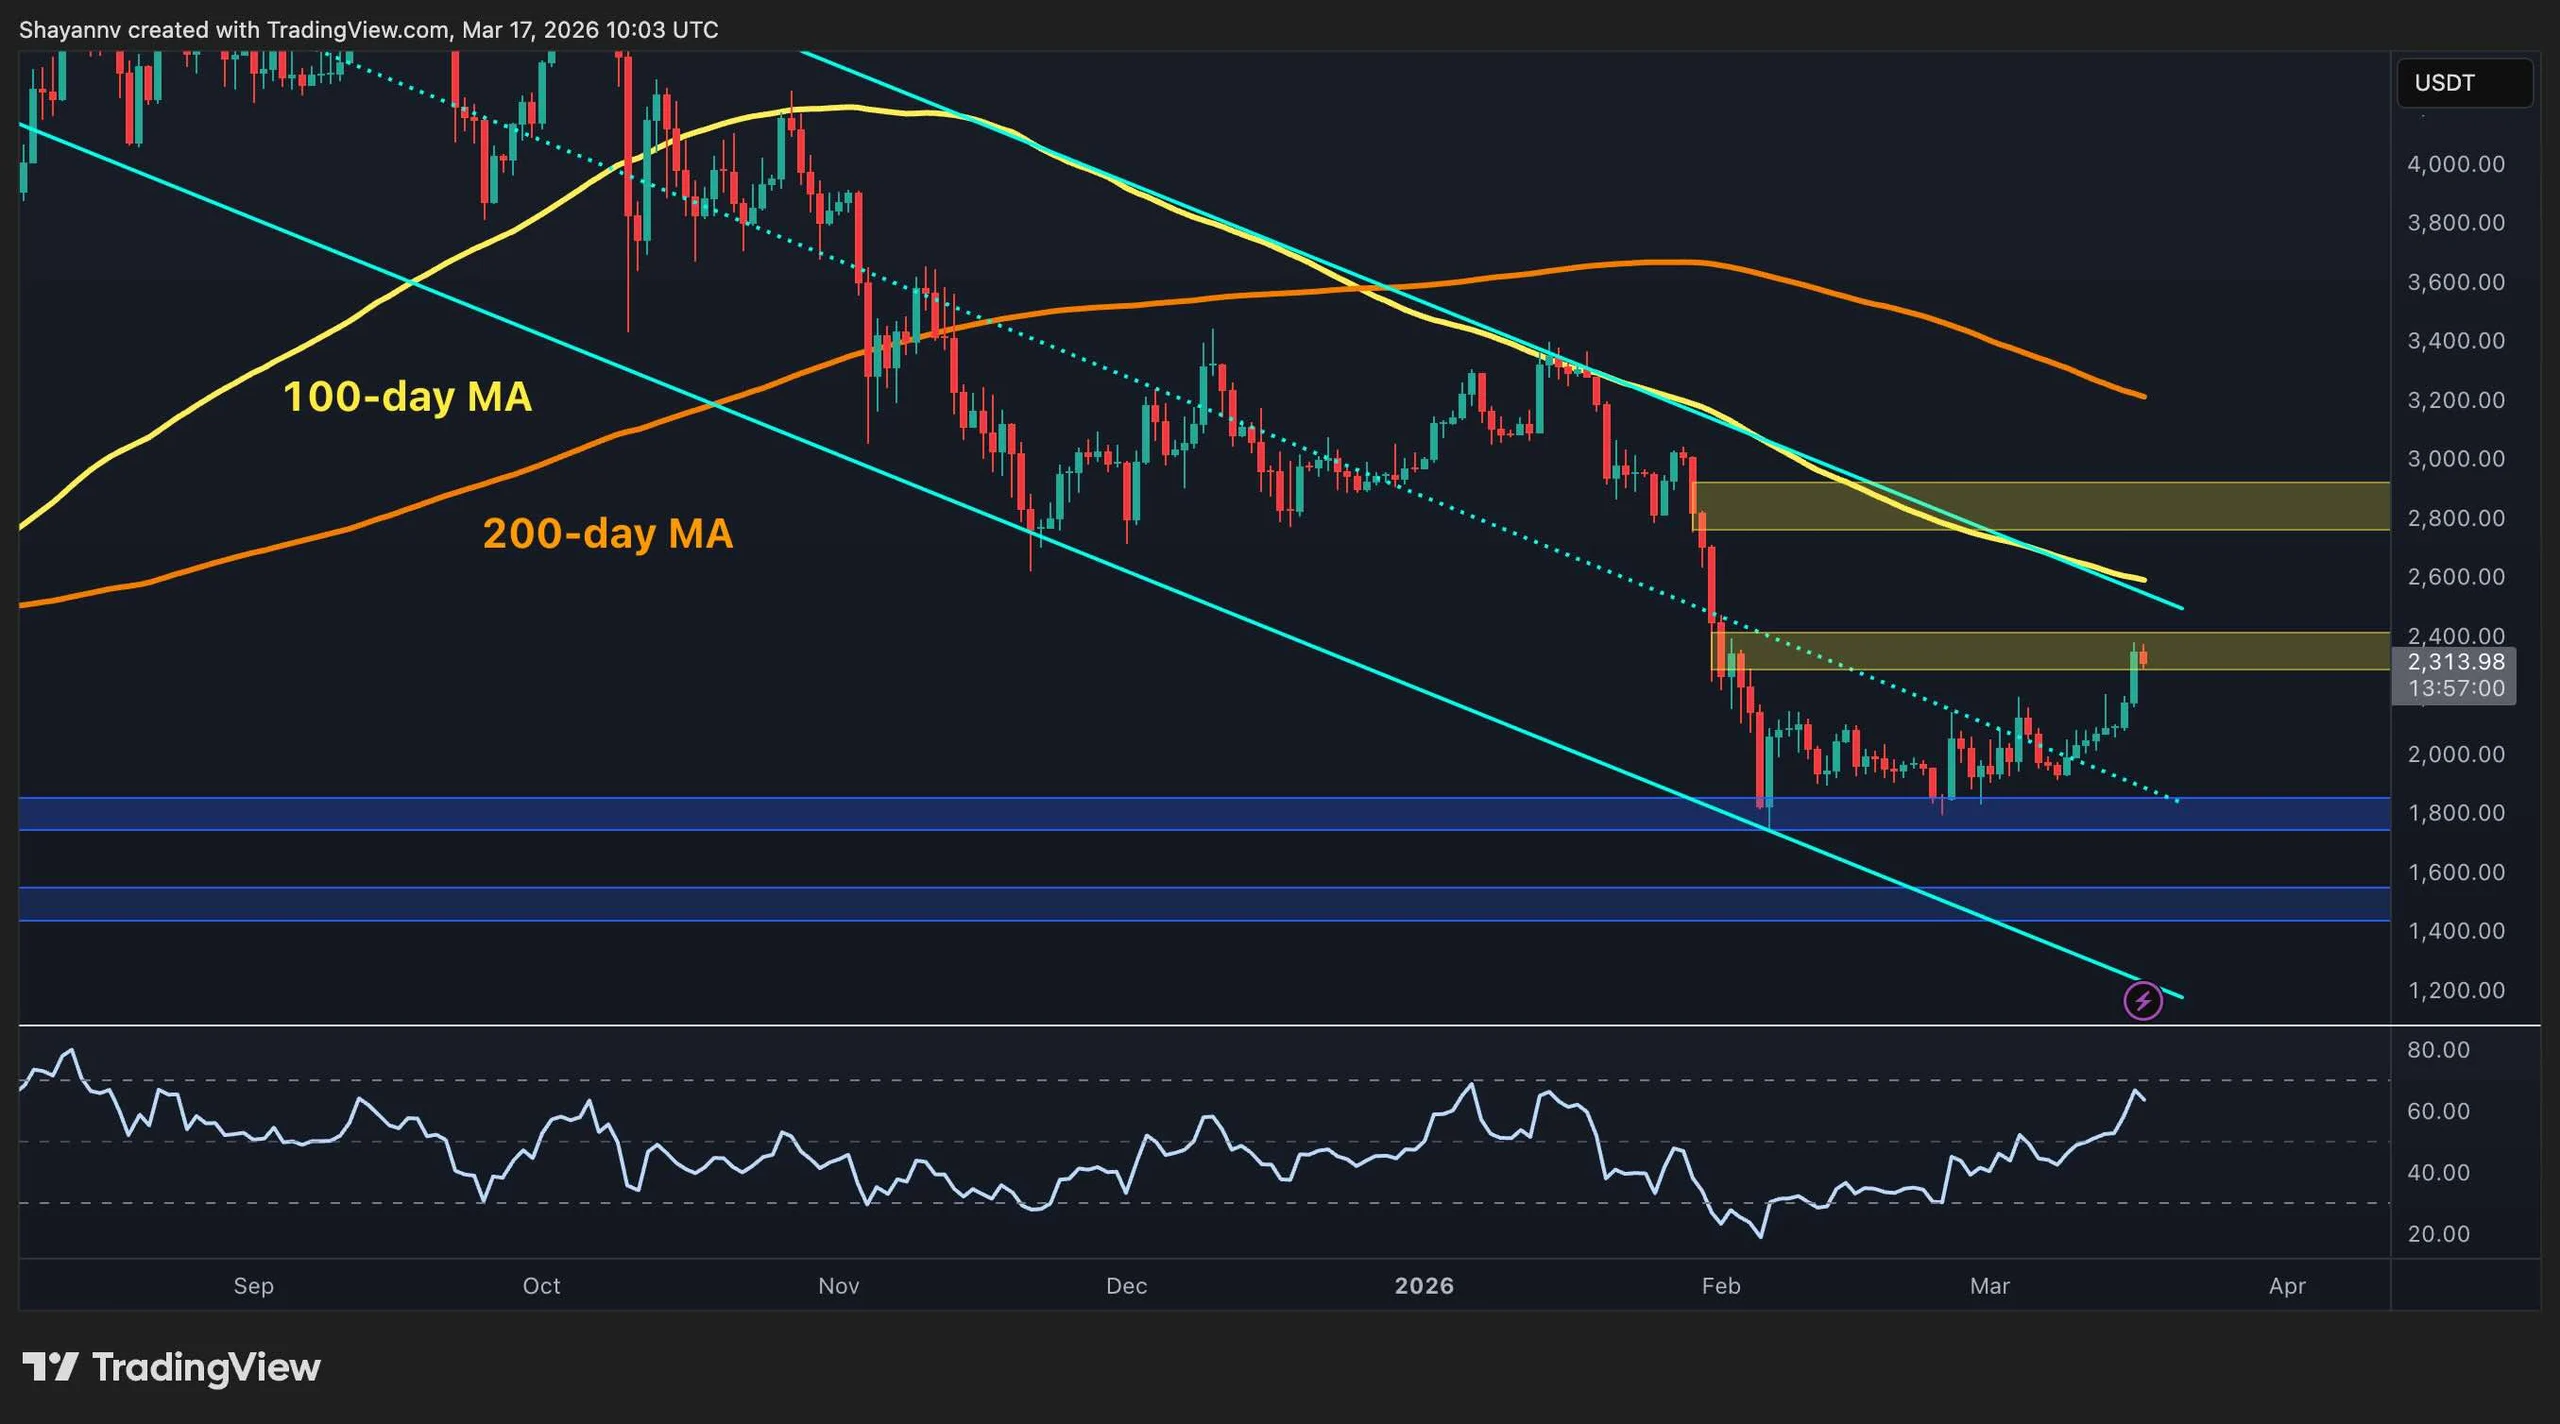
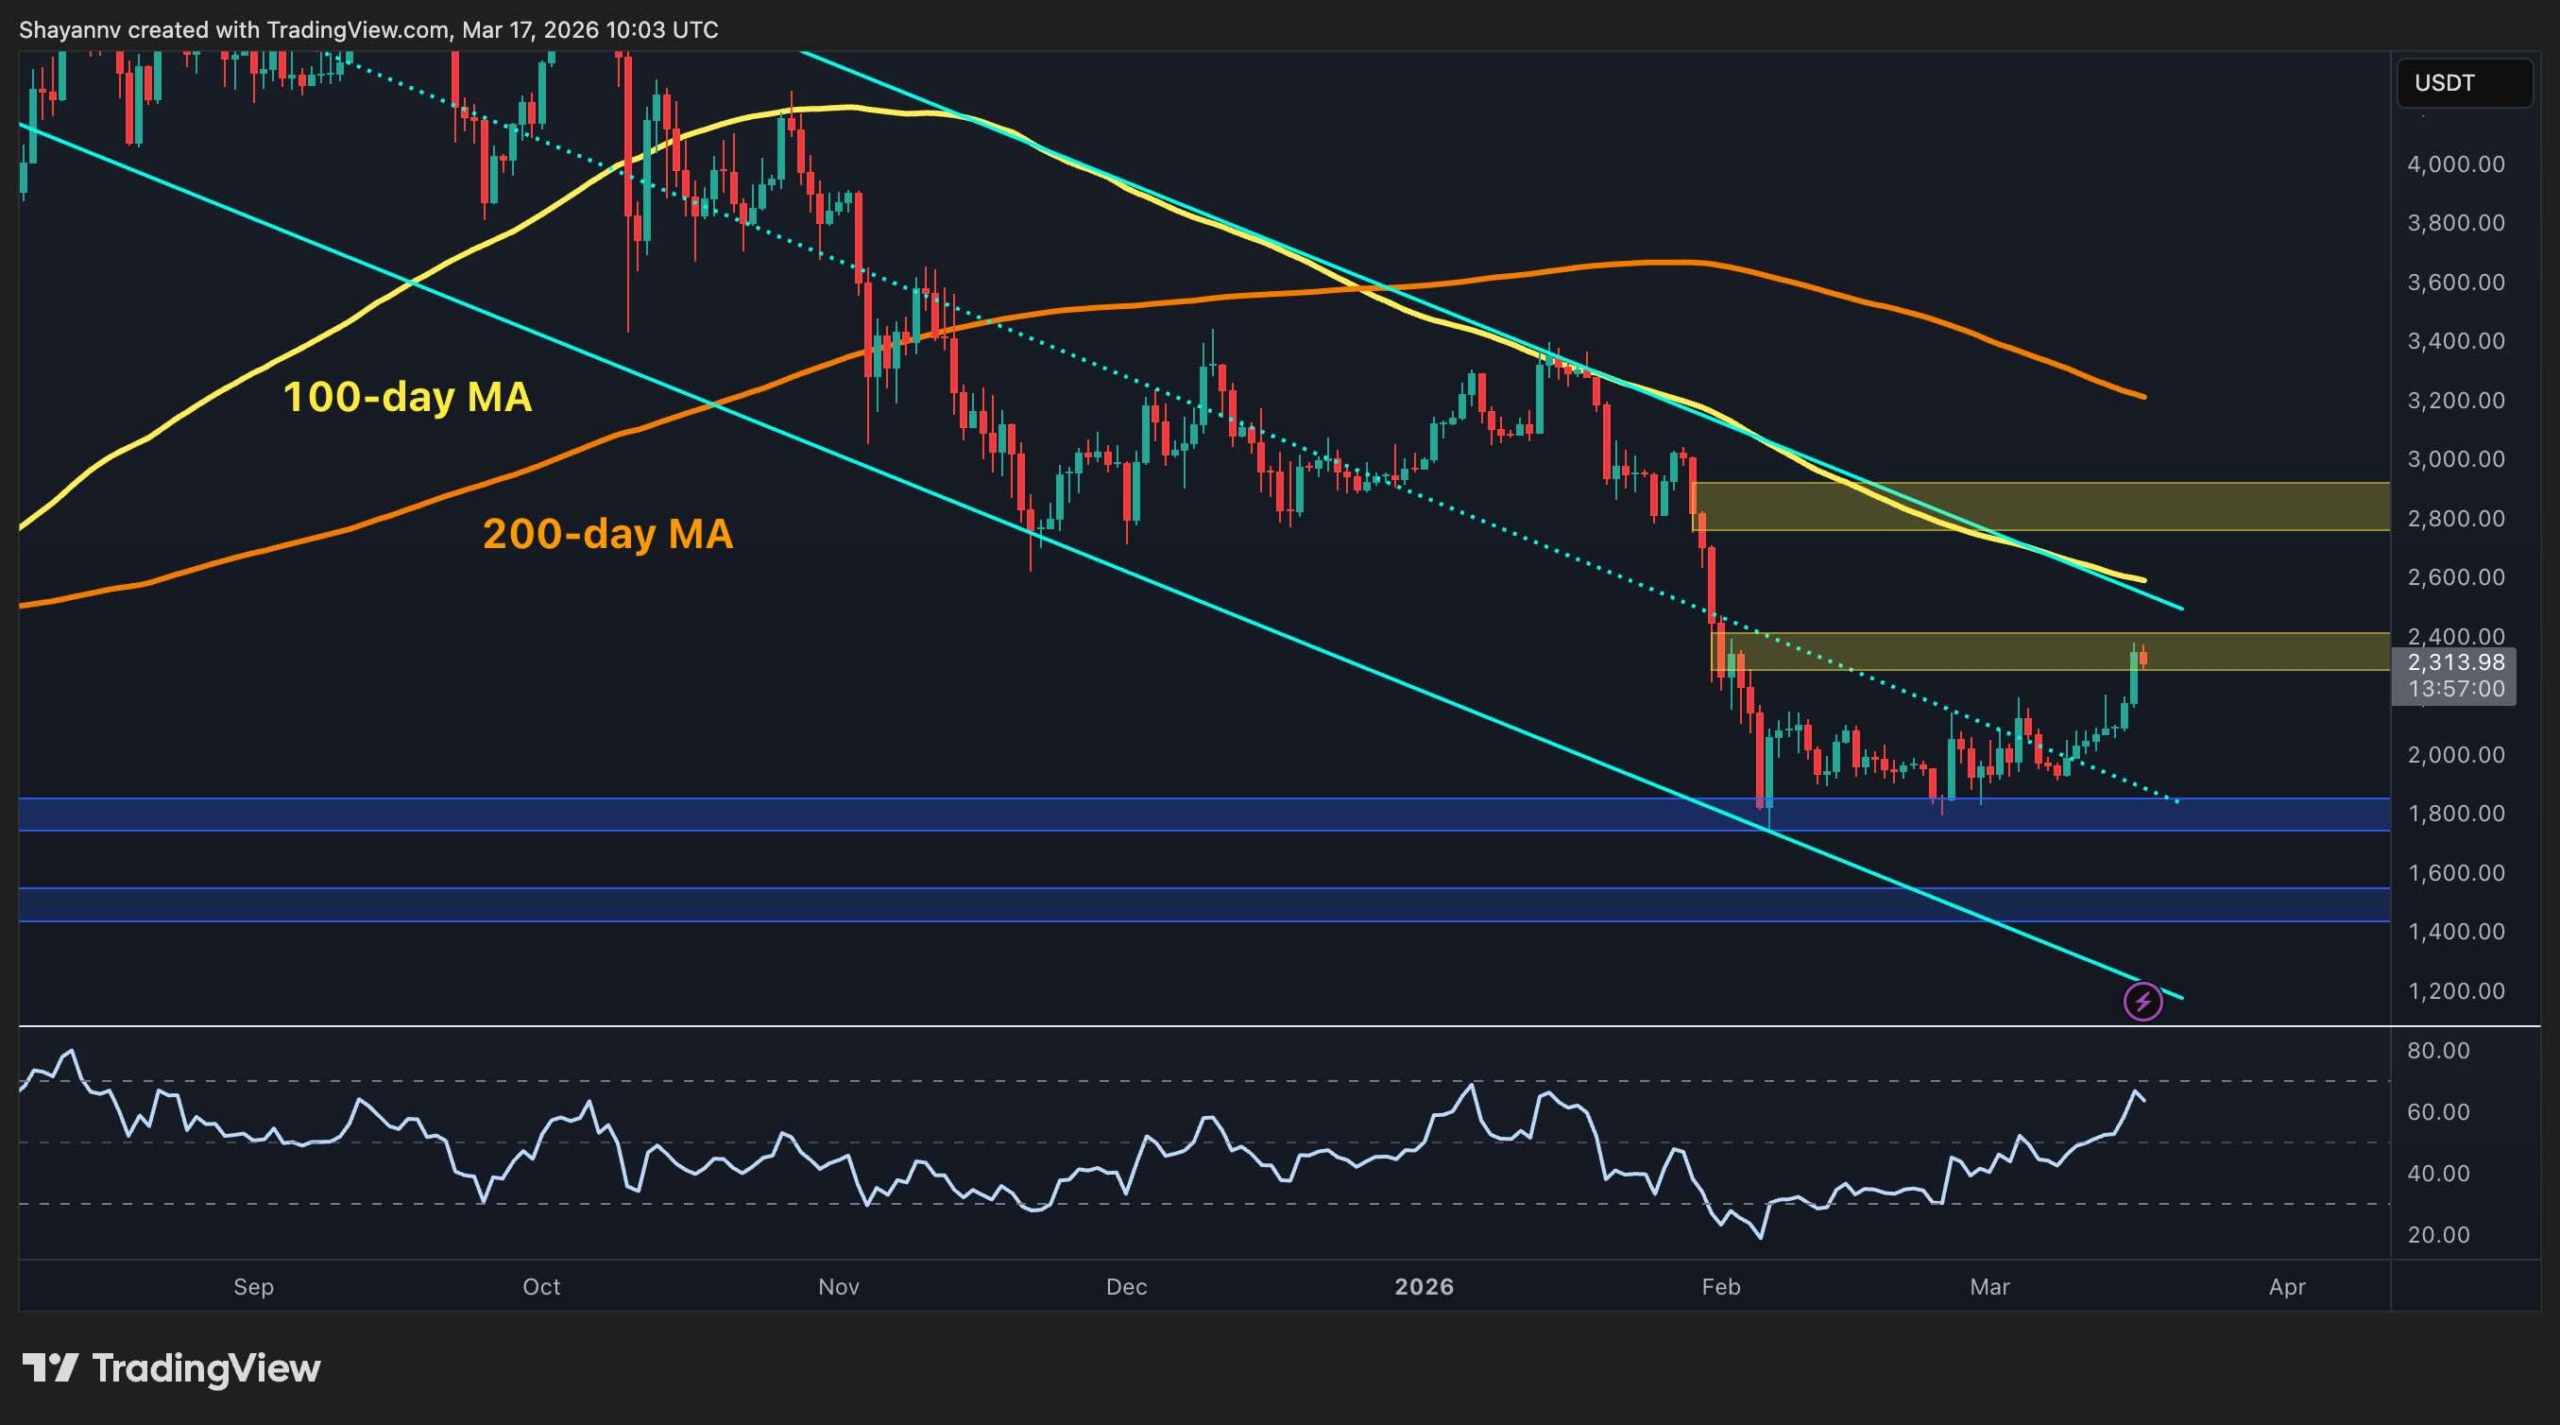
The daily chart has improved, but the broader trend is not fully repaired yet. ETH is still trading below the major 100-day and 200-day moving averages, and the bigger bearish structure from the previous months has not been completely invalidated. Even so, the strong reaction from the $1,800 region confirms that buyers have been defending that area aggressively.
The asset is now trading near the $2,300 to $2,400 supply zone, which is the next major battleground. If buyers manage to turn this area into support, the path could open toward the higher resistance band near $2,800. If not, this move may end up being just a strong relief rally inside a still-damaged higher timeframe structure.
ETH/USDT 4-Hour Chart
On the 4-hour chart, the recovery looks much cleaner. ETH has been climbing inside an ascending channel, printing higher highs and higher lows, which shows clear short-term control by buyers. The asset has even broken above the channel, pointing to a potentially more aggressive rally, if the current move does not become a fake breakout by dropping back inside the channel. Momentum has also expanded sharply, with RSI pushing into the overbought territory as the price accelerated into resistance.
That said, the market is no longer trading in the middle of the range. It is now testing the upper boundary of the recent advance and pressing into overhead supply at the same time. This usually means the next move matters a lot. It can either be a breakout continuation above the channel and resistance, or a fakeout and drop toward the mid-channel and the $2,000 to $2,100 area.

On-Chain Analysis
The on-chain backdrop is constructive. Ethereum’s 30-day transaction count exponential moving average remains elevated relative to most of the past cycle, even after cooling off from its recent spike.
That suggests network activity has not collapsed with the prior price weakness and that underlying usage is still holding up fairly well. However, it also shows that a potential capitulation phase is happening, as many holders have become active in selling their coins and exiting the market quickly. However, for every seller, there is a fresh buyer.
Overall, the network is showing better participation than price alone might suggest. That does not guarantee immediate upside, but it does support the idea that the recent rebound has a stronger foundation than a purely speculative bounce. If the price can now follow through above resistance, the on-chain picture would start to align much more clearly with a broader recovery thesis.
Binance Free $600 (CryptoPotato Exclusive): Use this link to register a new account and receive $600 exclusive welcome offer on Binance (full details).
LIMITED OFFER for CryptoPotato readers at Bybit: Use this link to register and open a $500 FREE position on any coin!
Disclaimer: Information found on CryptoPotato is those of writers quoted. It does not represent the opinions of CryptoPotato on whether to buy, sell, or hold any investments. You are advised to conduct your own research before making any investment decisions. Use provided information at your own risk. See Disclaimer for more information.

The company’s expansion in Brazil comes after it made big moves in Australia, the US, and Canada.
Ripple announced earlier today that it has significantly enhanced its presence in Brazil by incorporating some of its key features in the local market, including cross-border payments and digital asset custody.
The company’s President highlighted the importance of the Latin American market and praised Brazil for its rapidly developing financial ecosystem.
Ripple Doubles Down in Brazil
The statement published on March 17 reads that Ripple has now become the “only solution in the region capable of serving institutions across the full spectrum of financial needs – from cross-border payments and digital asset custody to prime brokerage and treasury management.”
The firm has also applied for a Virtual Asset Service Provider (VASP) license with the country’s central bank. The move comes after Brazil introduced its cryptocurrency regulatory framework and aims to reinforce Ripple’s “compliance-first approach” that has guided its global operations for over a decade.
After outlining the significance of the Latin American market, Ripple President Monica Long added that “Brazil has built one of the most advanced and forward-thinking financial ecosystems in the world.”
“We’ve spent more than a decade building the trust, licensing, and technology required to operate in regulated markets. Now, with our expanded platform, we can meet institutions across the region with everything they need to compete in the modern financial system,” Long concluded.
Brazilian Institutions Tapping Ripple Payments
The announcement explained that Ripple Custody will bring “bank-grade security, real-time compliance controls, and flexible deployment options to regulated institutions in the region.” Some of those include CRX and Justoken.
In the meantime, Ripple Payments, the end-to-end solution for moving money across borders with over $100 billion in processed volume globally, works with Banco Genial, Braza Bank, Nomad, Azify, ATTRUS, and Frente Corretora.
You may also like:
The company also said that its enterprise-grade stablecoin, RLUSD, has gained “significant traction” in the LATAM region, as institutions look for “trusted, regulated, digital dollar infrastructure.” RLUSD’s market cap has grown past $1.5 billion in less than 18 months after its launch.
The stablecoin has been adopted in Brazil by some of the most prominent exchanges and fintechs, including Mercado Bitcoin, Foxbit, Ripio, Braza Bank, Banco Genial, and others.
Ripple’s big move in Brazil follows similar developments in other regions. It began with a major announcement about an Australian financial license application, followed by a partnership focused on the North American markets.
Binance Free $600 (CryptoPotato Exclusive): Use this link to register a new account and receive $600 exclusive welcome offer on Binance (full details).
LIMITED OFFER for CryptoPotato readers at Bybit: Use this link to register and open a $500 FREE position on any coin!
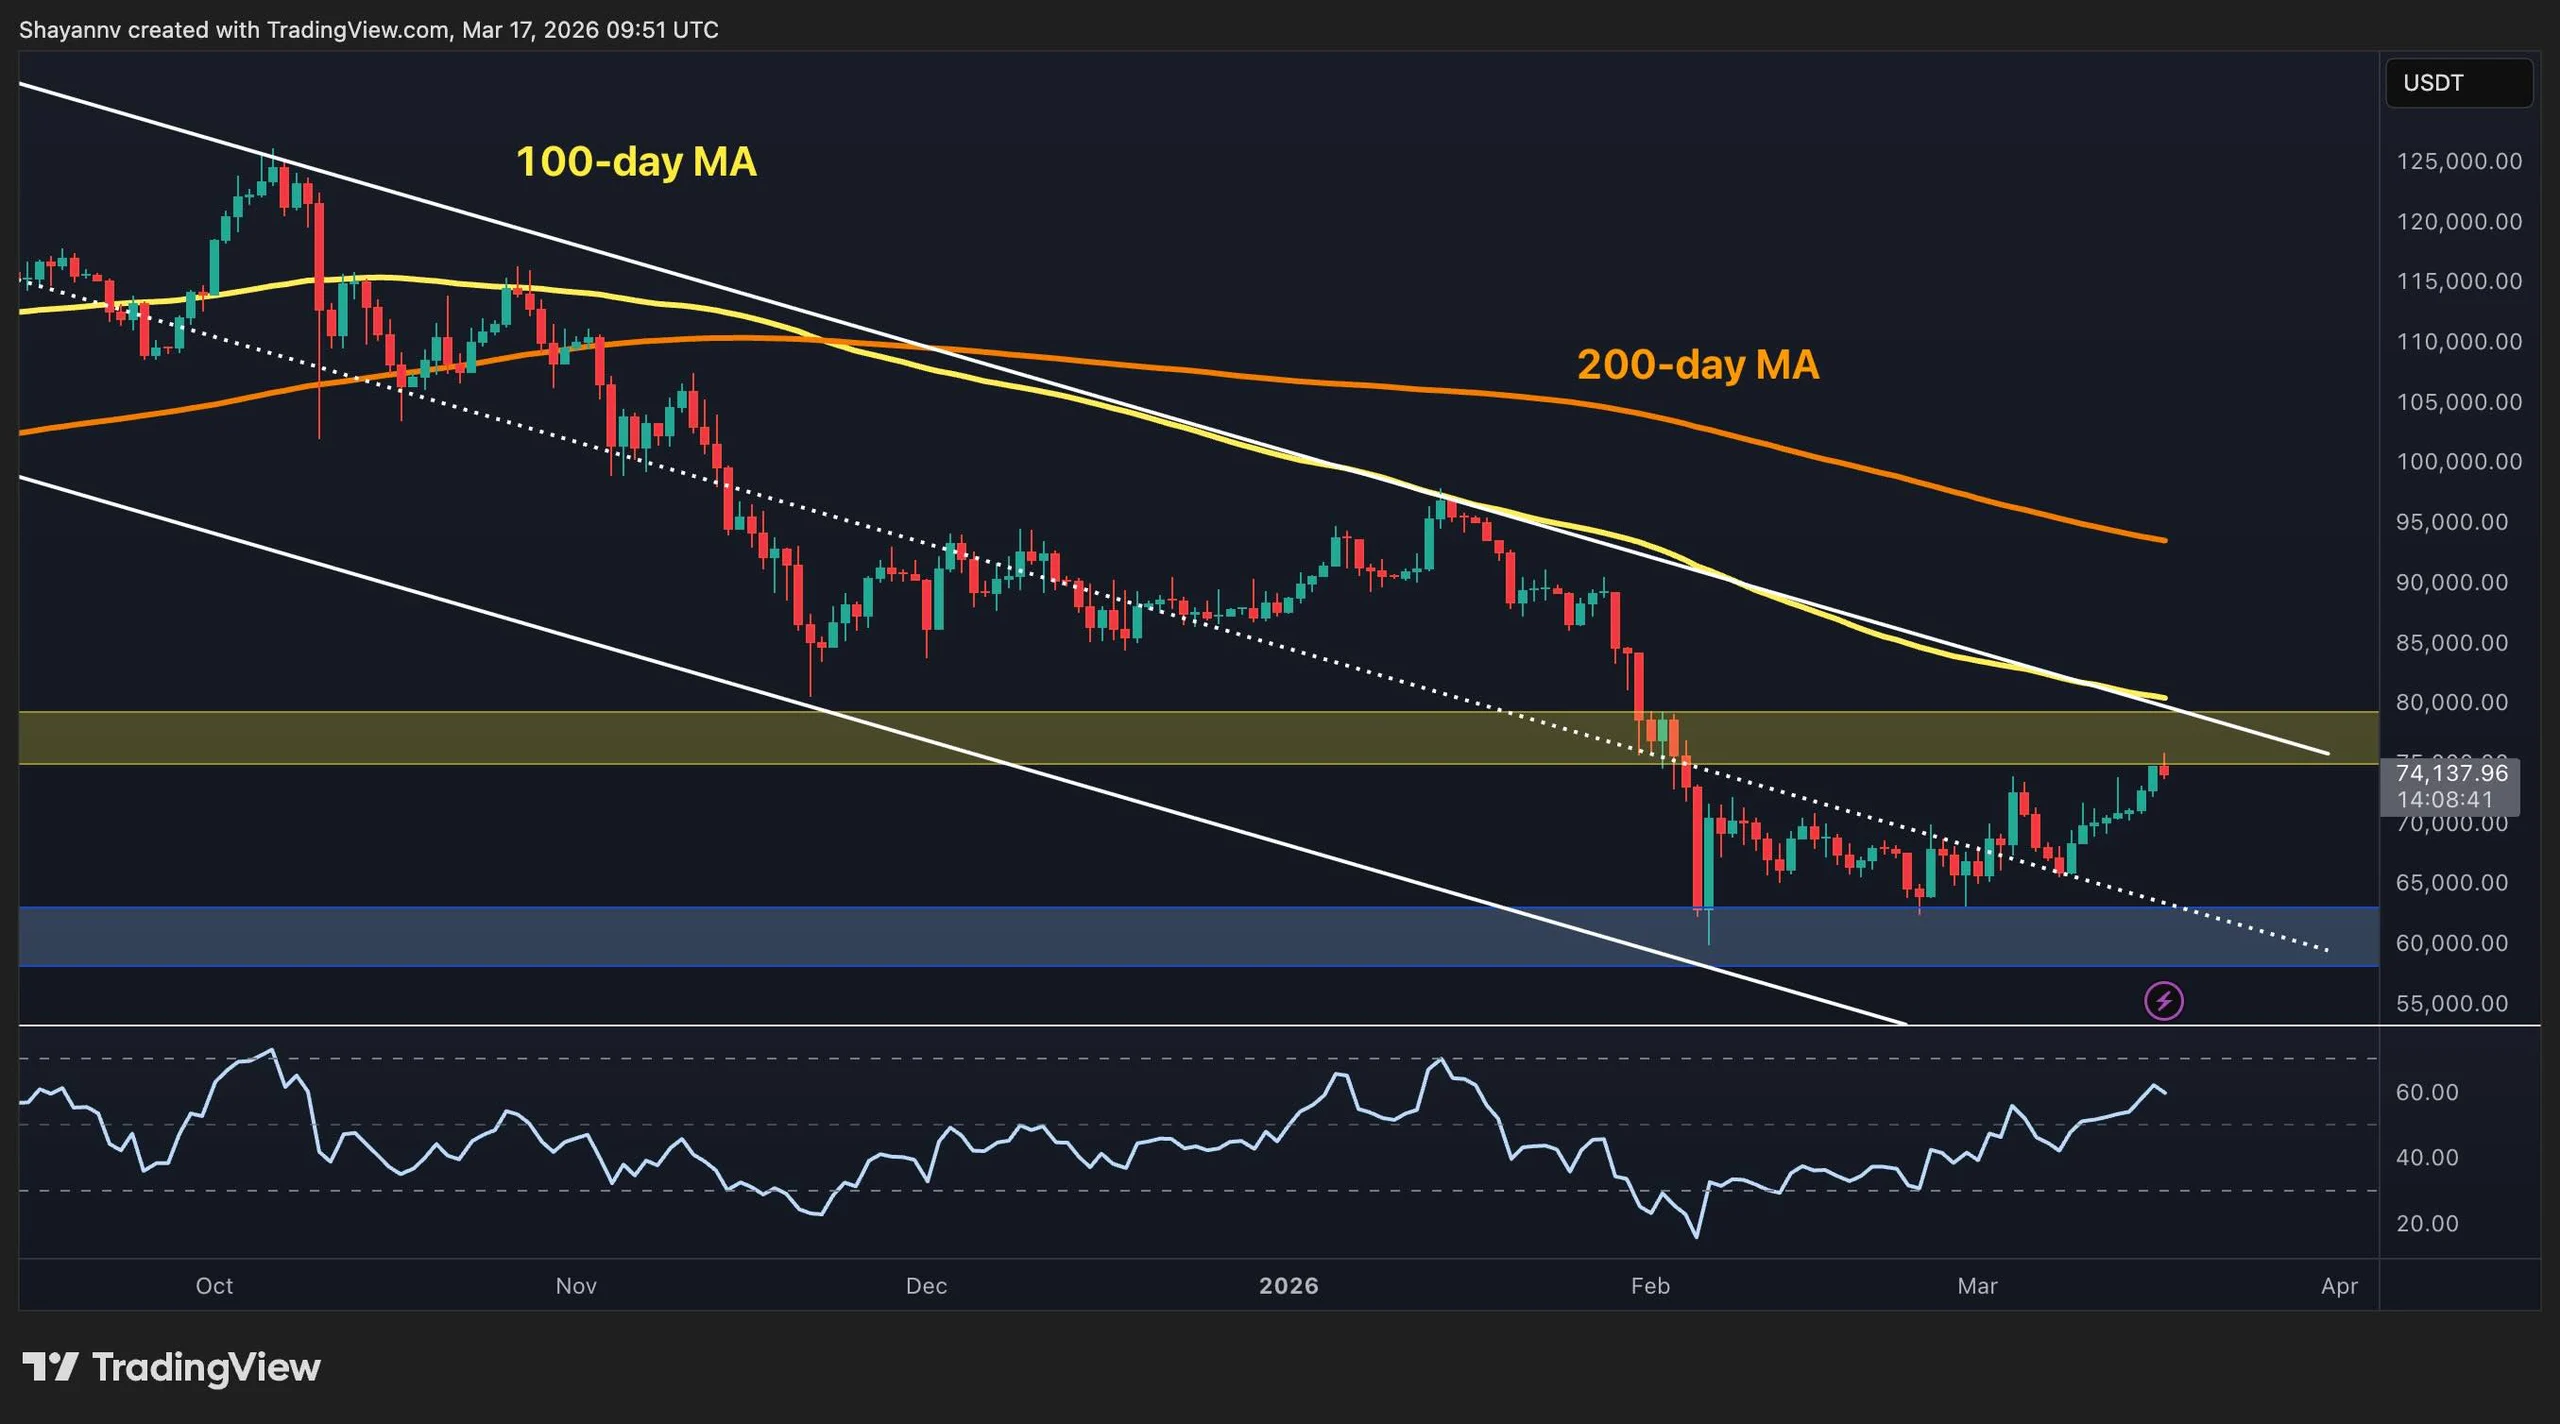
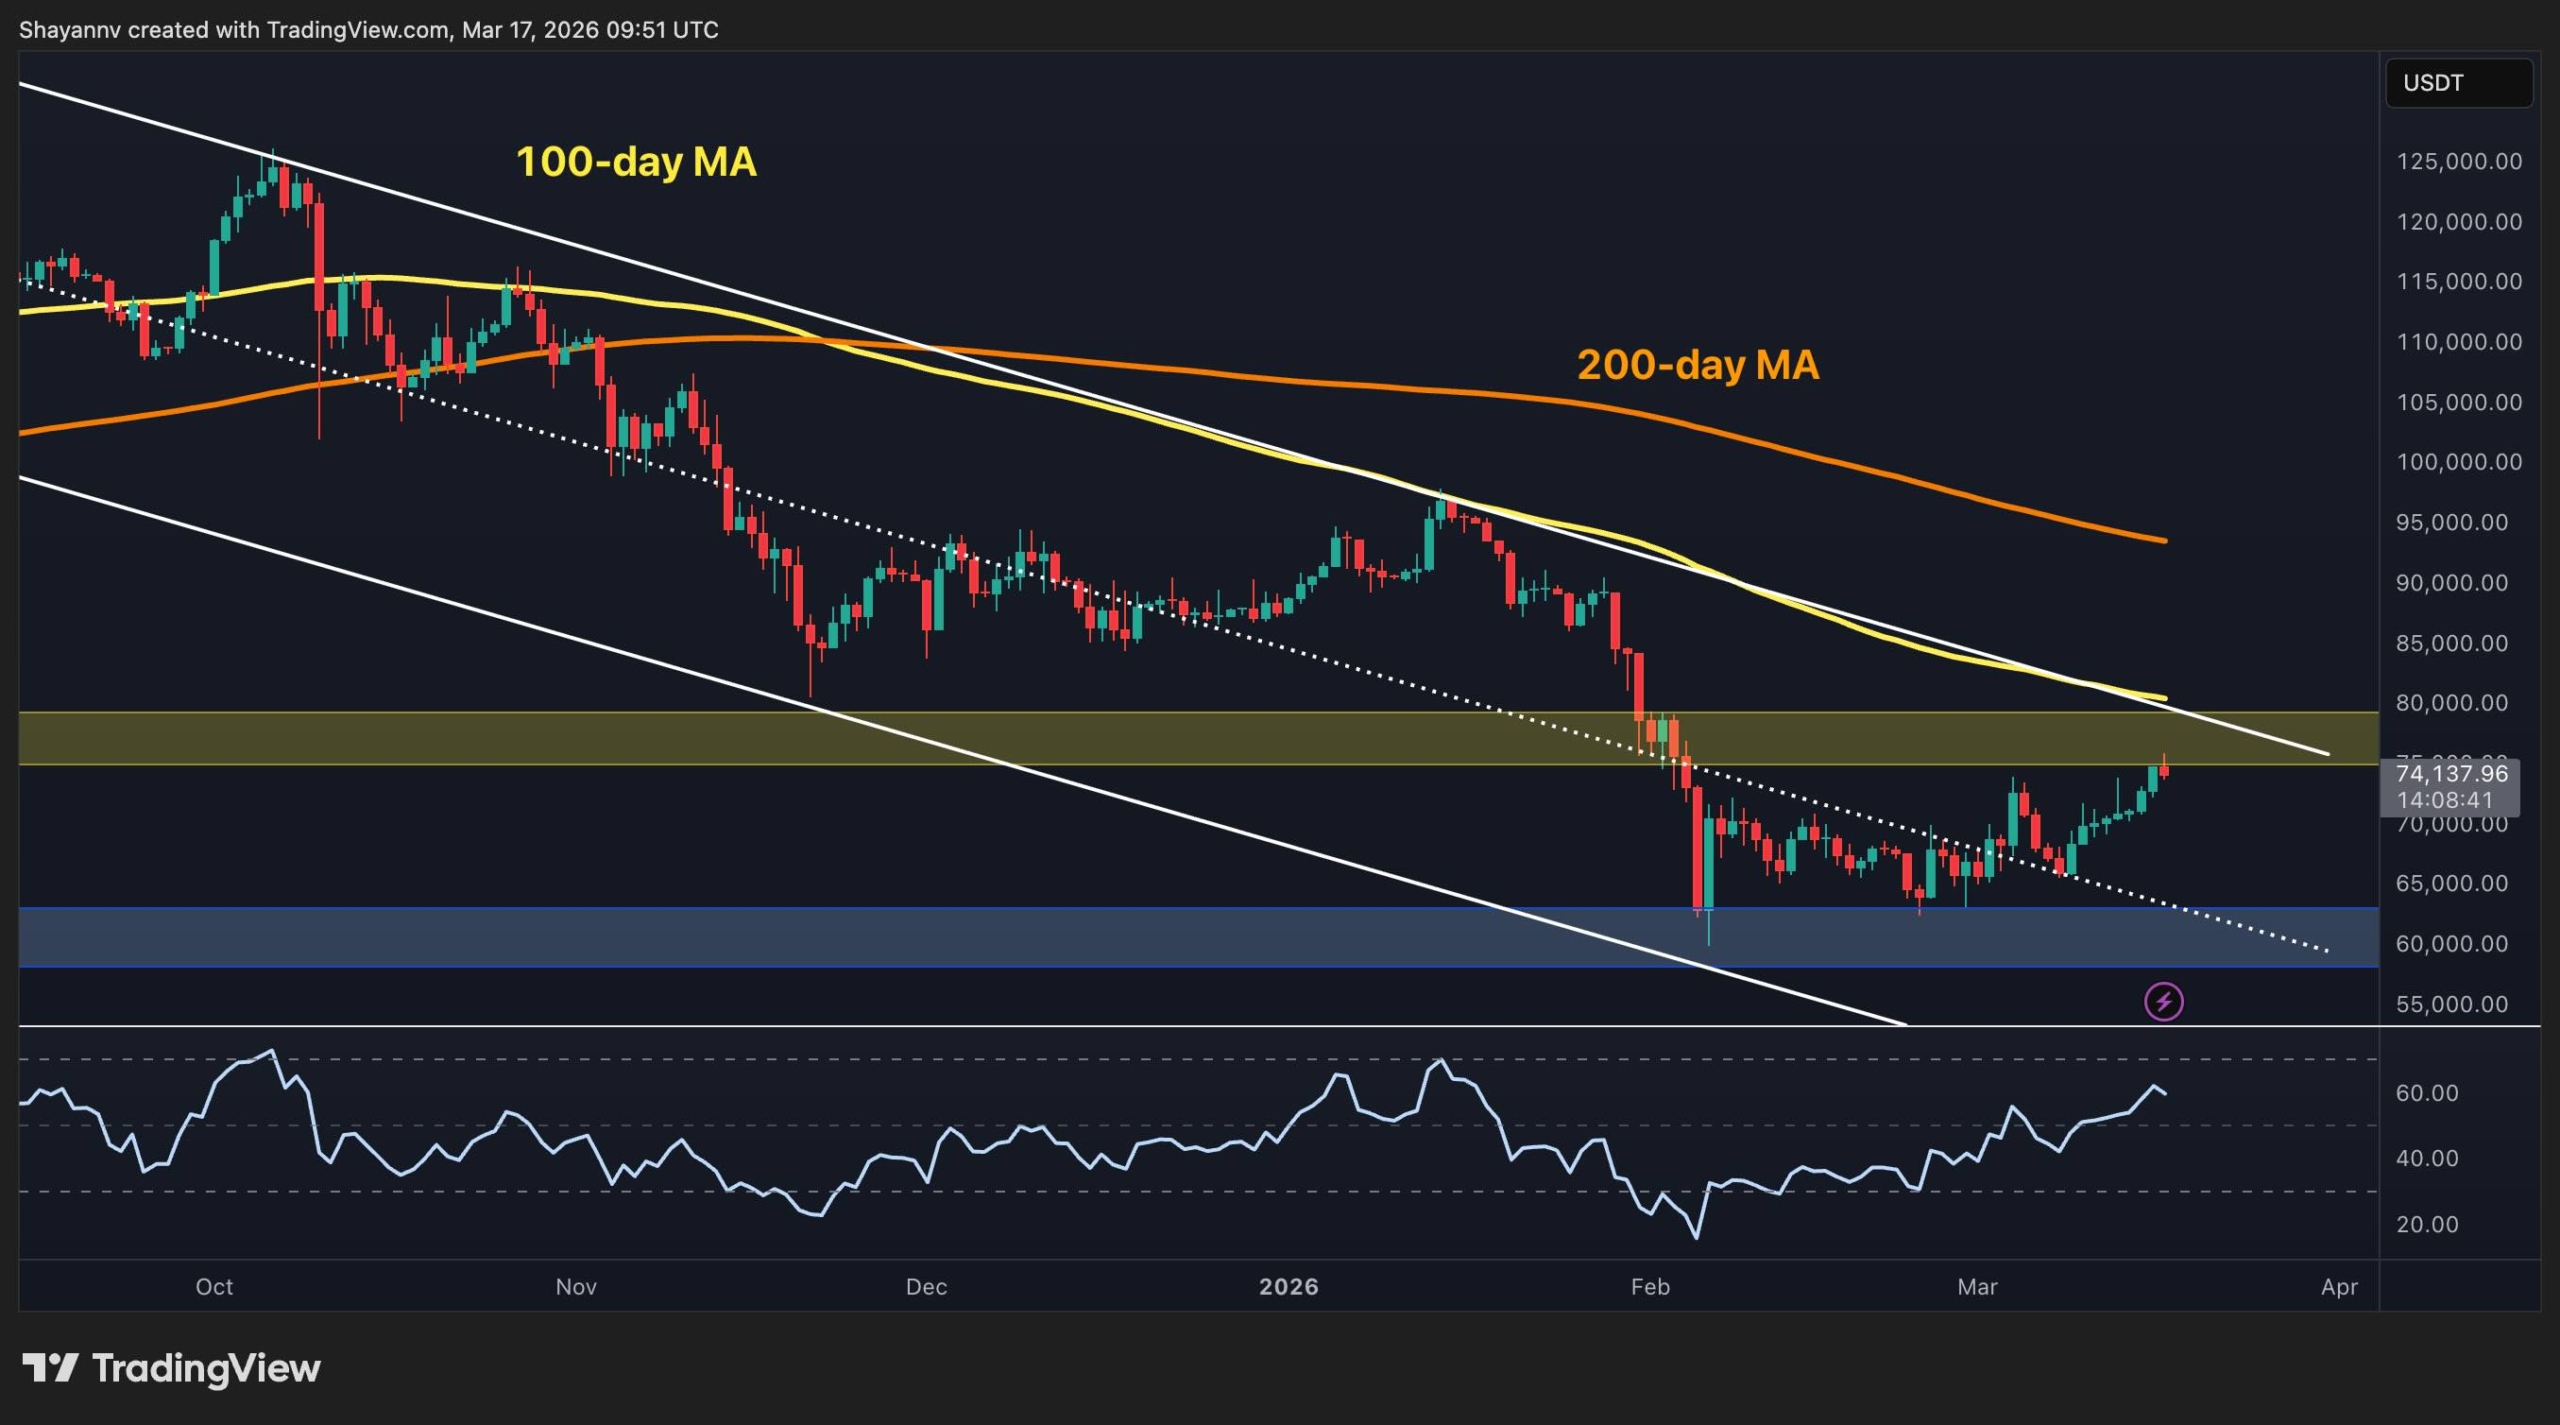
Bitcoin is pressing into a major test. The rebound from the $60,000 area has now extended into the mid-$70,000s, which means the price is no longer just recovering. It is challenging the first real ceiling of this bounce, and that makes the current zone especially important for the next directional move.
Bitcoin Price Analysis: The Daily Chart
The daily chart has improved meaningfully, but the broader trend has not fully flipped yet. BTC is now pushing back into the $75,000 to $80,000 region, which marked the previous breakdown area and has now turned into a heavy supply zone. The price is also approaching the higher trendline of the descending channel again, while still trading beneath both the 100-day and 200-day moving averages, located at $80,000 and $93,000 levels, respectively.
That combination makes the current level a key decision area. If buyers can reclaim this region with a clean daily break, the recovery would start to look much more structural. If not, this could still end up being another lower-high rejection inside the broader corrective trend. For now, the chart is stronger than it was a few weeks ago, but not yet fully repaired.
BTC/USDT 4-Hour Chart
On the 4-hour chart, the structure remains constructive. Bitcoin has continued printing higher lows and highs inside its rising recovery channel, and the latest move has carried the price right into the upper resistance band around $73,000 to $76,000. That shows buyers are still in control in the short term.
Momentum is also firm, with the RSI holding in the upper half of its range and recently pushing higher again. Still, the market is now at a confluence zone where horizontal resistance and the upper trend boundary meet. So this is where continuation needs confirmation. A breakout could open the door to a stronger leg higher, while rejection here would likely drag BTC back toward the middle of the channel.

Sentiment Analysis
From a sentiment perspective, funding rates remain negative even as the price keeps climbing. That is a notable divergence. It shows that derivatives traders are still not leaning aggressively long, and short exposure remains relatively elevated despite the recovery.
That kind of backdrop is often supportive rather than bearish in the near term. When the price rises while funding stays subdued or negative, it suggests the move is not being driven by overcrowded bullish leverage. In other words, sentiment is still cautious, and that leaves room for upside if BTC can break resistance, since the market has not yet reached an overheated condition, and a short liquidation cascade could be the fuel the price needs to jump aggressively.

Binance Free $600 (CryptoPotato Exclusive): Use this link to register a new account and receive $600 exclusive welcome offer on Binance (full details).
LIMITED OFFER for CryptoPotato readers at Bybit: Use this link to register and open a $500 FREE position on any coin!
Disclaimer: Information found on CryptoPotato is those of writers quoted. It does not represent the opinions of CryptoPotato on whether to buy, sell, or hold any investments. You are advised to conduct your own research before making any investment decisions. Use provided information at your own risk. See Disclaimer for more information.
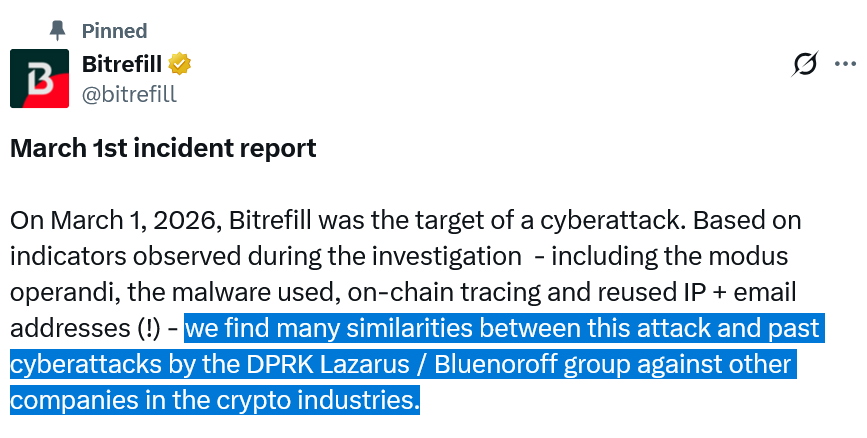
Crypto e-commerce store Bitrefill has revealed it was the victim of a cybersecurity attack on March 1, with the methods used closely resembling those of Lazarus Group, North Korea’s notorious hacking organization.
In a post to X on Tuesday, Bitrefill said the hackers used malware, on-chain tracing, and reused IP and email infrastructure to compromise an employee’s laptop, enabling them to drain funds from the company’s hot wallets while also accessing 18,500 purchase records, potentially revealing “limited customer information.”
Bitrefill said BlueNoroff Group, another North Korean hacking organization with close ties to the Lazarus Group, may have also been involved or been the sole attacker.

Source: Bitrefill
Bitrefill, which enables customers to spend crypto on real-world products and gift cards, said there was no evidence that the hackers extracted its database, suggesting the motive was financial.
“There is no evidence that they extracted our entire database, only that the attackers ran a limited number of queries consistent with probing to understand what there was to steal, including cryptocurrency and Bitrefill gift card inventory.”
While Bitrefill didn’t disclose how much funds were stolen, the company said it “will absorb” those losses from its operational capital.
“Almost everything is back to normal: payments, stock, accounts,” Bitrefill said, adding: “Sales volumes are also back to normal, and we are eternally thankful to our customers for your continued confidence in us.”
Despite many crypto platforms strengthening security measures in recent years, sophisticated hackers have continued to find ways to breach their defenses.
Related: Bonk.fun warns hackers hijacked domain in wallet-drainer attack
Lazarus Group remains the crypto industry’s most formidable threat and was behind the largest hack in crypto history, when it stole $1.4 billion from crypto exchange Bybit in February 2025.
Bitrefill has upped its security measures
Bitrefill said it contacted law enforcement and worked with crypto security firms Security Alliance, FearsOff Security, Recoveris.io and zeroShadow to navigate the cybersecurity incident. Part of its initial response was to turn its systems offline to contain the attack.
Bitrefill said it has already “significantly improved” its cybersecurity practices since the incident.
Those measures include cybersecurity reviews with security researchers and implementing their recommendations, tightening internal access controls and improving monitoring strategies for faster detection and response.
Magazine: China’s ‘50x’ blockchain boost, Alibaba-linked AI mines Bitcoin: Asia Express
Crypto World
SEC and CFTC Issue Joint Crypto Interpretation, Ending Over a Decade of Regulatory Uncertainty

TLDR:
- The SEC introduced a token taxonomy covering digital commodities, collectibles, tools, stablecoins, and securities.
- The CFTC will administer the Commodity Exchange Act in line with the SEC’s new crypto asset interpretation.
- The guidance clarifies how non-security crypto assets can enter or exit the scope of an investment contract.
- Activities like airdrops, protocol staking, and asset wrapping now have clearer treatment under federal securities law.
Crypto assets have taken center stage as the U.S. Securities and Exchange Commission issued a landmark interpretation.
Released on March 17, 2026, the guidance clarifies how federal securities laws apply to crypto assets and related transactions.
The Commodity Futures Trading Commission joined the effort, signaling a unified regulatory approach. Market participants, including investors and innovators, now have clearer guidance on where SEC and CFTC jurisdiction begins and ends.
SEC Establishes a Token Taxonomy for Crypto Assets
The interpretation introduces a coherent token taxonomy covering several categories of crypto assets. These categories include digital commodities, digital collectibles, digital tools, stablecoins, and digital securities.
Each category carries distinct treatment under federal law, providing structure where ambiguity once existed.
Moreover, the guidance addresses how a non-security crypto asset can become subject to an investment contract. It also explains how that same asset can cease to be subject to one. This distinction matters greatly for builders and issuers navigating compliance requirements.
TODAY
: The Commission issued an interpretation that clarifies the application of federal securities laws to crypto assets.
This is a major step to provide greater clarity regarding the Commission’s treatment of crypto assets.
Read the release here: https://t.co/DDykVLHZQI pic.twitter.com/zbLFS2JH6g
— U.S. Securities and Exchange Commission (@SECGov) March 17, 2026
SEC Chairman Paul Atkins stated, “After more than a decade of uncertainty, this interpretation will provide market participants with a clear understanding.”
He added that most crypto assets are not themselves securities, which the former administration declined to acknowledge. The guidance further affirms that investment contracts can come to an end.
Additionally, the interpretation covers activities such as airdrops, protocol mining, protocol staking, and the wrapping of non-security crypto assets.
These are common functions in decentralized networks that previously lacked clear regulatory treatment. The clarity on these activities reduces legal risk for developers and participants alike.
CFTC Aligns With SEC on Harmonized Rules for Crypto Assets
The CFTC’s involvement in the joint interpretation marks a notable step toward harmonized oversight of crypto assets. CFTC Chairman Michael Selig confirmed the agency will administer the Commodity Exchange Act in line with the SEC’s interpretation. This alignment removes a layer of regulatory conflict that has long burdened the industry.
Selig further noted that American builders and innovators had long awaited guidance on the status of crypto assets. He stated, “With today’s interpretation, the wait is over.”
Both chairmen expressed commitment to fostering a regulatory environment where the crypto industry can operate with rational rules.
Furthermore, the joint action is seen as a bridge measure while Congress advances bipartisan market structure legislation.
Chairman Atkins indicated he looks forward to implementing that legislation alongside Chairman Selig. The interpretation complements, rather than replaces, the expected Congressional framework.
The SEC’s interpretation will be published on SEC.gov and in the Federal Register. Market participants are encouraged to review the document to understand regulatory boundaries.
As the legislative process continues, this guidance offers the clearest foundation yet for the U.S. crypto market.
The post SEC and CFTC Issue Joint Crypto Interpretation, Ending Over a Decade of Regulatory Uncertainty appeared first on Blockonomi.
Crypto World
GSR Acquires Autonomous and Architech to Launch Integrated Capital Markets and Treasury Platform for Crypto


[PRESS RELEASE – New York, United States, March 17th, 2026]
GSR, crypto’s capital markets partner, today announced the $57 million acquisition of Autonomous and Architech. The transaction significantly expands the firm’s ability to support tokenized organizations from formation through scale. Autonomous will continue to operate under its existing brand within the GSR group, providing launch operations, operational support, and financial infrastructure for tokenized organizations, while Architech will form the foundation of GSR Digital Asset Advisory, working alongside GSR’s institutional trading, liquidity, and asset management capabilities.
Launching a tokenized network today often requires engaging multiple structuring advisors, token economists, market makers, and listing consultants, typically operating under fragmented mandates and misaligned incentives. GSR’s integrated model replaces that patchwork with a coordinated approach, aligning foundation structuring, governance design, token economics, fundraising and exchange strategy, and long-term capital planning. Clients can also access GSR’s institutional trading, derivatives, and asset management capabilities through its existing, regulated entities.
“The crypto industry has matured, but its capital markets infrastructure remains fragmented,” said Xin Song, CEO of GSR. “Entrepreneurs should not have to allocate significant portions of their token supply to disconnected service providers. By aligning advisory expertise alongside GSR’s institutional trading and asset management capabilities, we provide coordinated support from pre-launch through scale.”
Beyond launch, the platform addresses a structural challenge in crypto: foundations frequently begin life managing substantial digital asset treasuries without the financial infrastructure required to oversee them. GSR is able to provide strategic treasury and capital markets guidance, including:
- Cash and Liquidity Planning – optimizing working capital and banking relationships.
- Cash Flow Forecasting – runway modeling and capital planning.
- Risk Management – structured approaches to manage token volatility and exposures, with execution available through GSR’s trading and derivatives businesses.
- Capital Allocation Strategy – disciplined diversification and portfolio construction, supported by GSR’s asset management and trading capabilities.
Today, many crypto treasuries function primarily as passive holdings of their own tokens. Introducing structured diversification and income strategies can transform those balance sheets into sustainable funding engines without diluting long-term token alignment. Professionalizing treasury management not only strengthens individual networks but supports the long-term stability of the broader ecosystem.
“Crypto foundations are effectively managing large, complex balance sheets from day one,” said James Hutchings, Managing Director, Autonomous. “Integrating with GSR allows us to pair deep advisory expertise with institutional trading infrastructure.”
“Successful tokenization doesn’t end at launch,” added Matt Solomon, CEO, Architech. “It requires coordination across design, liquidity, and long-term financial management. This platform unifies those elements within a first-of-its-kind, integrated offering.”
With this acquisition, GSR advances its strategy to become crypto’s one-stop capital markets partner, delivering institutional standards, aligned incentives, and full-lifecycle support for the next generation of on-chain businesses.
About GSR
GSR is crypto’s capital markets partner, delivering market-making services, institutional-grade OTC trading, and venture backing to founders and institutions. With more than a decade of experience, we provide strategic guidance, market intelligence, and access to a global network to help teams scale. Users can visit www.gsr.io for more information, including the General Terms Business, relevant disclosures, and GSR’s trading terms.
About Autonomous
Autonomous is an end-to-end launch, finance, and operations partner for digital asset projects. With comprehensive white-glove services including fractional CFO/COO services, finance management, treasury operations, payment processing, partner coordination (i.e., exchanges, custodians, market makers, OTC desks), multi-sig and treasury architecture, token minting, liquidity planning, lock/vest administration, grants management, governance support, and banking setup. Autonomous support projects through their full lifecycle, spanning pre-launch preparation, TGE, and go-to-market execution, and post-launch steady-state operations.
About Architech
Architech is the premier advisory firm specializing in fungible token launches and bespoke liquidity strategies. Since its inception in October 2024, Architech has supported token launches totaling over $10 billion in peak fully diluted value. Its core services span mechanism design, market maker facilitation, centralized exchange coordination, GTM strategy, and fundraising.
Binance Free $600 (CryptoPotato Exclusive): Use this link to register a new account and receive $600 exclusive welcome offer on Binance (full details).
LIMITED OFFER for CryptoPotato readers at Bybit: Use this link to register and open a $500 FREE position on any coin!
Crypto World
Crypto.com integrates with South Korea’s largest payment processor to enable tourist crypto payments: Crypto.com and KG Inicis

Crypto.com has partnered with KG Inicis to let foreign travelers pay for goods and services in South Korea using digital assets through the exchange’s merchant network.
Crypto.com has partnered with KG Inicis, South Korea’s largest payment gateway and value-added network provider, to enable cryptocurrency payments for foreign tourists visiting the country. The integration will allow travelers to use digital assets through Crypto.com Pay to purchase goods and services from South Korean merchants connected to KG Inicis’s network.
The partnership represents a real-world expansion of Crypto.com’s merchant payment infrastructure in Asia, one of the exchange’s key growth markets. Merchants using the service will have options for how they settle transactions, addressing a key adoption barrier for crypto payments in traditional retail environments.
Sources: Phemex News | Crypto.com LinkedIn
This article was generated automatically by The Defiant’s AI news system from publicly available sources.
Crypto World
Cardano Price Prediction 2026: Messari Just Went All-In on AI and DeepSnitch AI Deployed 5 AI Crypto Security Tools In Presale
Messari replaced its CEO and pivoted to an AI-first company serving institutions through research and AI products, opening its entire data layer to autonomous agents. This confirms the 2026 AI boom is incoming.
The Cardano price prediction for 2026 points to $2.75 to $3.25 with Voltaire governance live, and a pending spot ETF, and HYPE is targeting $150 by August, according to Arthur Hayes.
But the position that makes both of those look like the conservative trade is DeepSnitch AI, the only presale in this market with five live AI surveillance tools running for traders today, over $2 million raised, 197% gains already on the board, and a $0.04487 entry closing March 31 permanently.

Messari went AI-first and opened its blockchain data layer to autonomous agents
Messari, the blockchain data and research company that institutional investors have relied on since 2018, announced on Monday that founder-era CEO Eric Turner stepped down to make way for incoming CEO Diran Li, who immediately confirmed that Messari is “doubling down as an AI-first company serving institutions through research and AI products.”
Li also announced that Messari is opening its entire data layer to autonomous agents using the x402 protocol, allowing AI agents and developers to autonomously source and pay for institutional-grade blockchain intelligence using crypto wallets.
When the companies that serve institutional crypto capital all converge on the same narrative simultaneously, the tokens providing the security, intelligence, and surveillance layer for that AI-native future are the ones that get repriced first and hardest.
DeepSnitch AI ($DSNT) deployed 5 AI crypto surveillance tools in presale
Every company Messari is now competing with, every AI agent that needs blockchain data, and every institution relying on AI research all push demand toward $DSNT at $0.04487.
DeepSnitch AI is the only presale in this market where five AI surveillance tools are already live and running for traders every single day before a single exchange listing has happened.
AuditSnitch stops you from signing bad contracts before it’s too late. SnitchGPT helps you understand what’s actually happening on-chain so you trade with confidence.
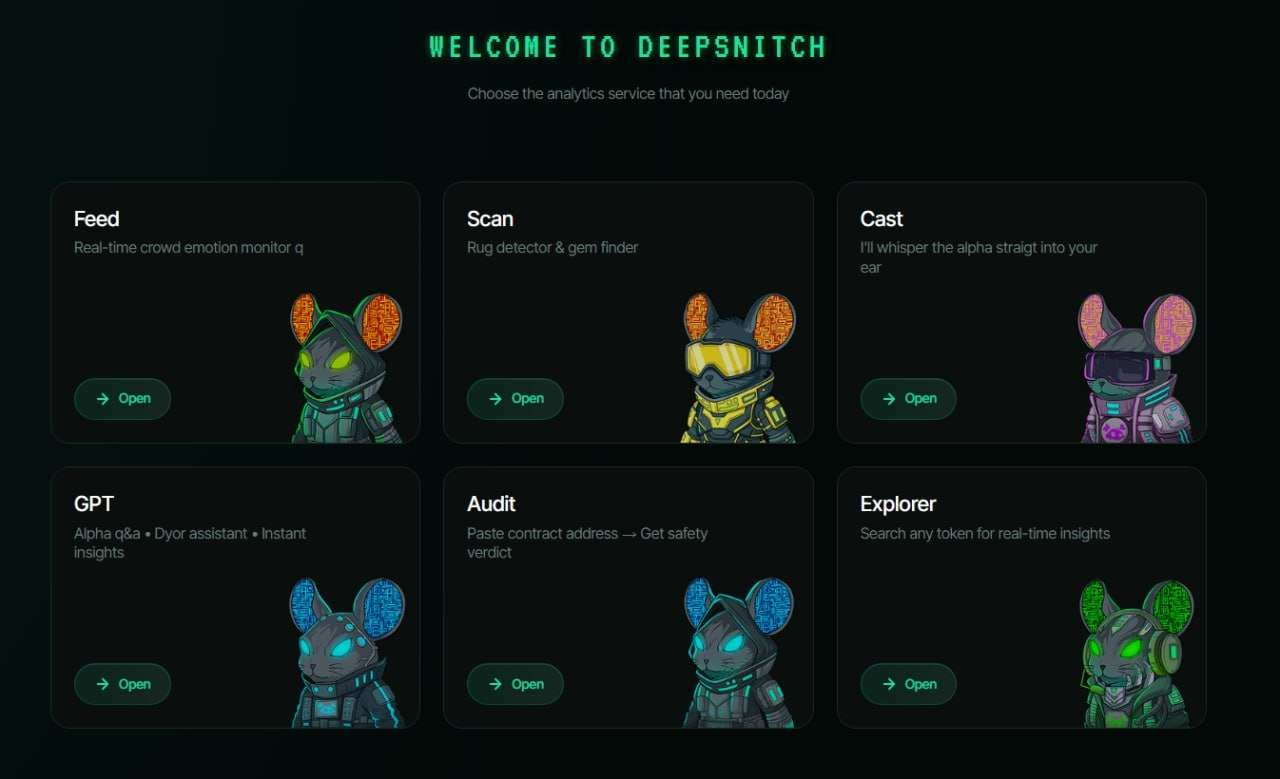
SnitchFeed shows whale moves in real time, so you’re early, not exit liquidity. Token Explorer breaks down risk, holders, and liquidity in seconds. SnitchCast keeps the market insights flowing so you’re never guessing.
The contract has been audited by both Coinsult and SolidProof and passed with flying colors, showing it is solid and trustworthy. More than $2 million has already been raised, and early investors are sitting on 197% gains before Uniswap even opens.
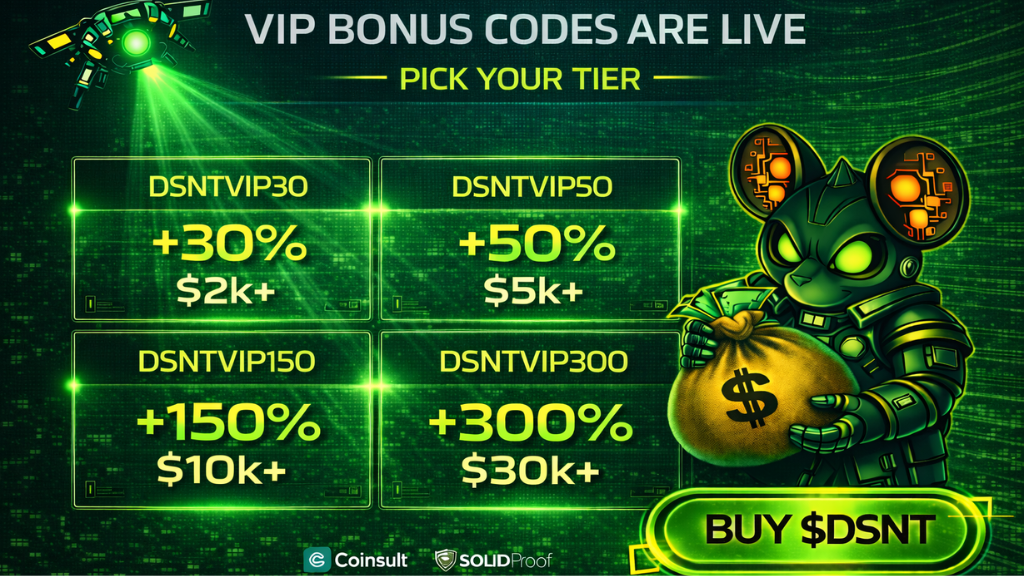
If you invest $10,000 today, you will get 568,000 $DSNT with the 150% bonus. Investing $30,000 or more gives you the 300% bonus, which could turn your position into over $80 million if DSNT reaches $30. This is a huge opportunity for anyone who gets in early.
Cardano price prediction for 2026
The Cardano price prediction narrative for 2026 is finally aligned with the technology that has been shipping quietly for three years, and the Cardano market outlook is the most constructive it has been since the 2021 cycle.
ADA is currently trading around $0.28 on March 17, sitting 91% below its September 2021 all-time high of $3.10.
The Voltaire era is fully live, meaning Cardano is no longer a foundation-led project. Governance now runs through a Constitutional Committee, delegated representatives, and stake pool operators, with over $1 billion in ADA sitting under direct community treasury control, ready to deploy for ecosystem development.
Cardano forecast 2026 range sits between $2.75 and $3.25 for the year-end with a long-term 2030 target of $10.25. From $0.28 to $2.75 is nearly a 10x in the base case for the cycle, and the ada price target gets significantly more interesting if the spot ETF clears.
Hyperliquid (HYPE) update for 2026
HYPE is the Cardano alternative for traders who want a token that generates real revenue in every market condition, and Arthur Hayes just told the world it is his largest liquid altcoin position.
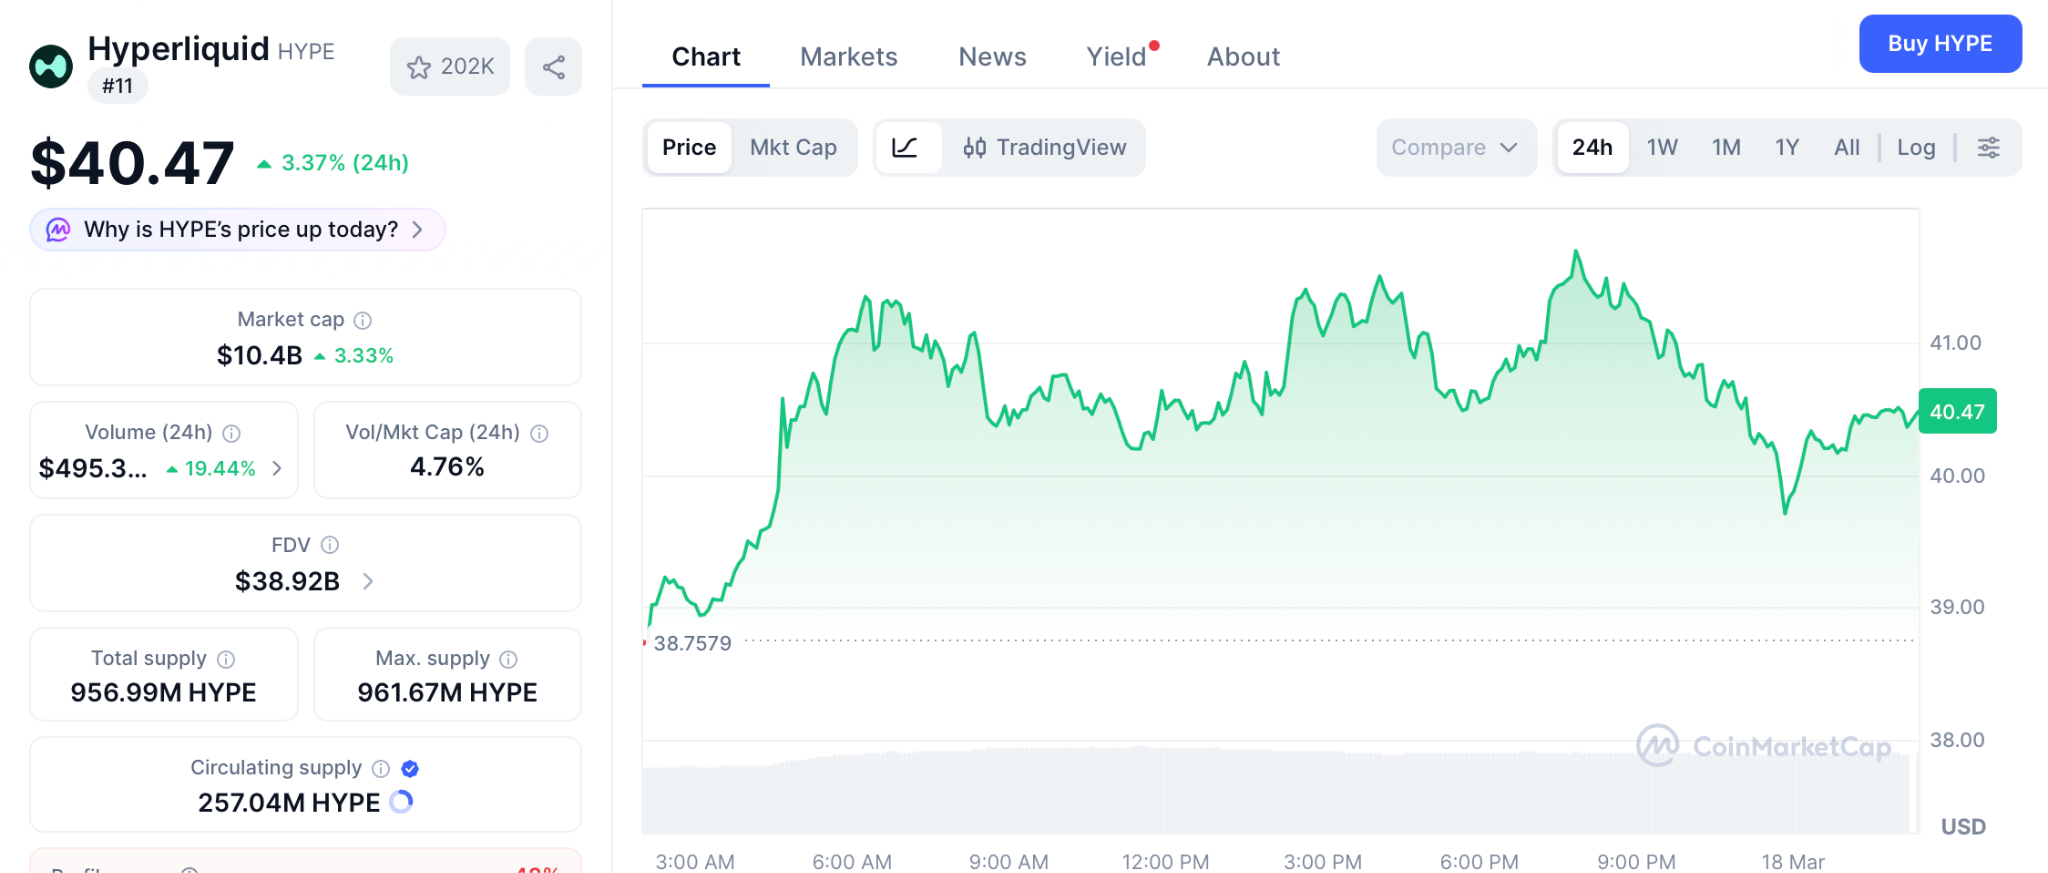
HYPE is currently trading around $41 on March 17, up 25% year-to-date and recovering strongly from its $20 low in February, with a market cap approaching $11 billion as Hyperliquid generates over $54 million in fees from mid-February to mid-March alone, making it the top-earning protocol in all of crypto, excluding stablecoins.
Hayes’ $150 August 2026 target requires Hyperliquid to grow annualized revenue to $1.4 billion, a figure it previously hit in August 2025.
From $40 to $150 is a near 4x in the Hayes bull case, and the revenue mechanics behind that move are already running in real time.
Final thoughts
Messari going AI-first and opening its data layer to autonomous agents is the Cardano price prediction macro signal that confirms 2026 is the year AI and crypto infrastructure merge permanently.
But DeepSnitch is the only presale in the market where five AI surveillance tools are already live, giving traders real-time insights every day, even before a single exchange listing.
Go to the official DeepSnitch AI website, get your $DSNT at $0.04487, and join X and Telegram for the listing announcement.
FAQs
What is the Cardano price prediction for 2026, and what catalysts make ADA a strong cycle play right now?
The Cardano price prediction for 2026 ranges from $2.75 to $3.25, driven by Voltaire governance live, $1B treasury under community control, CME futures, and a pending spot ETF. Load ADA for the 10x and load $DSNT before March 31 for the 300x.
What is the Cardano forecast 2026 compared to HYPE and $DSNT for traders who want maximum upside this cycle?
The Cardano forecast 2026 tops out at around $3.25 from $0.28, which is a solid 10x. HYPE targets $150 from $40 for a 4x per Hayes. $DSNT at $0.04487 carries 300x to 500x analyst projections and closes March 31, making it the sharpest Cardano forecast 2026 alternative for parabolic upside.
Does the ADA price target for 2026 and Messari’s AI pivot make this the best time to load ADA and $DSNT together before the AI boom fully lands?
Yes. The ADA price target of $2.75 to $3.25 in 2026, with CME futures and a pending ETF behind it, is one of the cleanest cycle entries available. Stack ADA for the blue chip move and $DSNT at $0.04487 for the generational wealth builder before March 31 closes the ground floor on both simultaneously.
The post Cardano Price Prediction 2026: Messari Just Went All-In on AI and DeepSnitch AI Deployed 5 AI Crypto Security Tools In Presale appeared first on Blockonomi.
Crypto World
XRP Price Prediction: Pepeto Surges Past $8 Million While Ripple and Hyperliquid Ride the Market Recovery Higher
Every token on your watchlist is green today. XRP jumped 9%. Bitcoin broke $75,000. But the biggest returns this cycle will not come from the coins that already moved overnight. They will come from the presale that reprices when the Binance listing opens.
While traders chase momentum in large caps that already moved, the sharpest money in the market is positioning in the projects that capture long term volume, not just today’s recovery bounce.
That is where Pepeto enters the conversation. The project built zero fee exchange infrastructure for the meme coin economy with cross chain bridging and AI token screening that verifies every listed token. The presale crossed $8 million according to CoinDesk, and the Binance listing is locked in. That early infrastructure is one reason Pepeto trends alongside popular topics like the XRP price prediction according to Bloomberg.
The market turns green as Bitcoin breaks $75,000 and altcoins surge
Bitcoin surged above $75,000 on March 17, breaking a six week range as spot ETFs recorded $1.3 billion in March inflows. XRP jumped 9% to $1.57. Ethereum surged 8.5% past $2,360. The Fear and Greed Index improved from extreme fear at 15 to 28. Capital is rushing back into every corner of the market.
Three tokens leading the conversation in this recovery
Pepeto
Most presale launches follow the same tired script. Investors fund a roadmap and hope the product eventually shows up months later. Pepeto flipped that entirely. The team built the exchange infrastructure first and then opened the presale, which is exactly why capital kept flowing in even when the market was at its lowest.
PepetoSwap handles zero fee trades across Ethereum, BNB Chain, and Solana. The cross chain bridge transfers assets at zero cost with AI contract verification scanning every transfer. The full exchange screens every listed token for contract risks, holder concentration, and liquidity depth. All three products route through the $PEPETO token at the protocol level, creating demand from real trading volume.
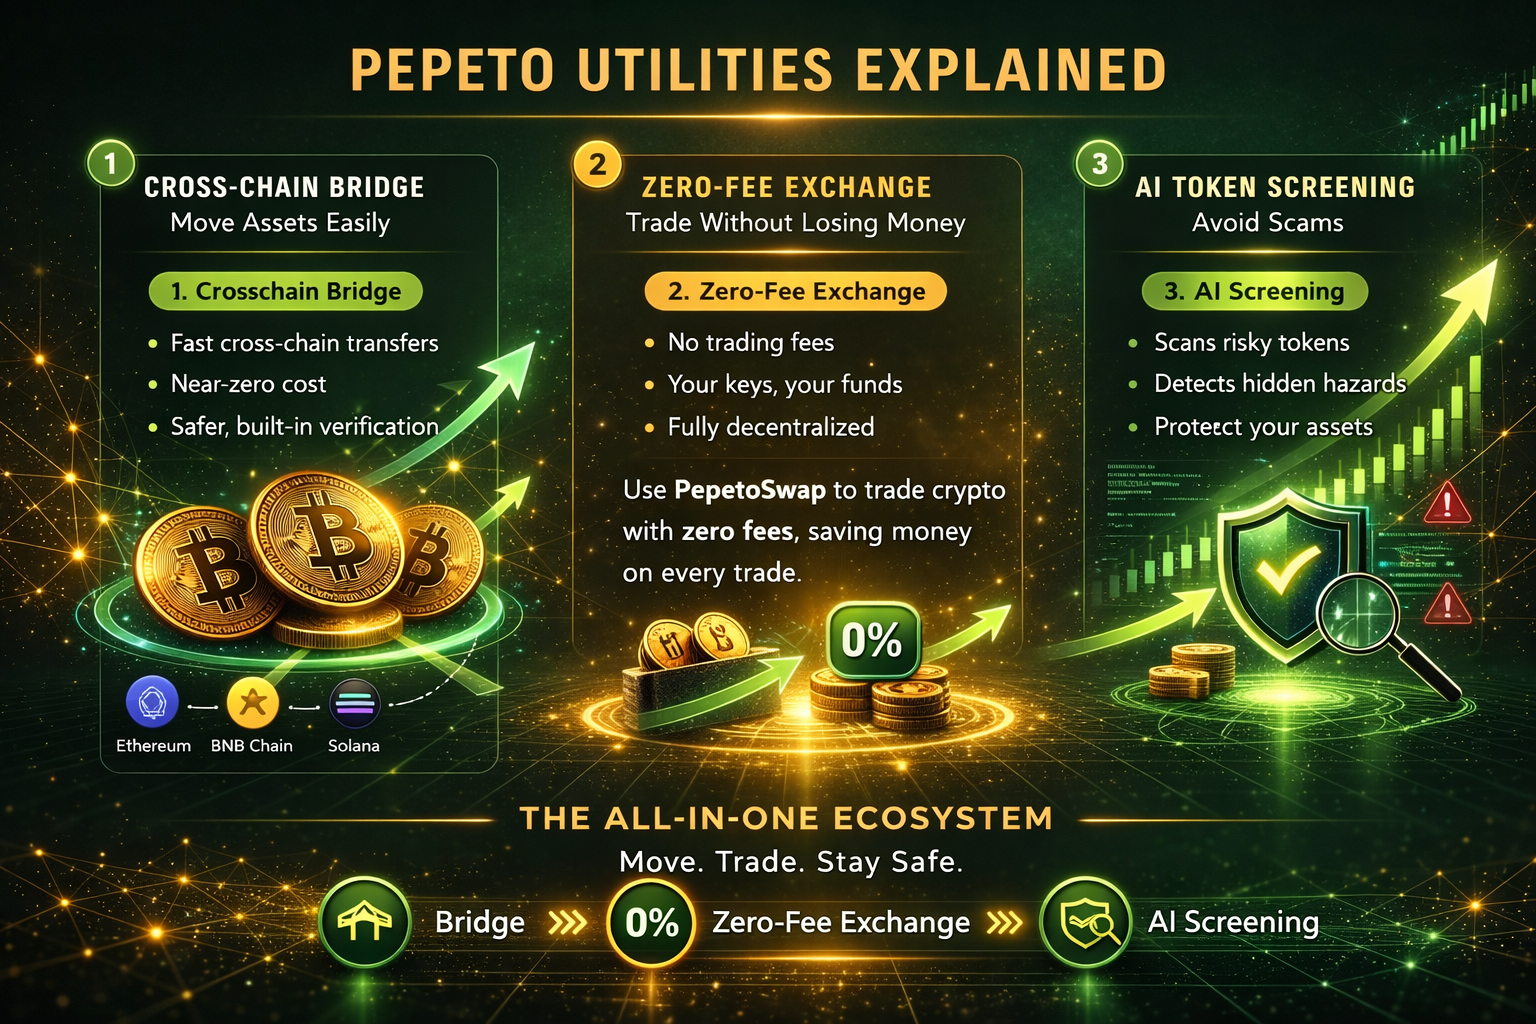
Exchange infrastructure like this is becoming more relevant by the day as the meme coin economy grows more complex and more fragmented. The need for a single zero fee exchange layer that verifies everything before it reaches traders has never been greater.
SolidProof and Coinsult completed independent audits with zero critical findings. The cofounder built Pepe to $11 billion. A former Binance executive advises the listing. At $0.000000186, a $10,000 entry becomes $1,000,000 if Pepeto reaches just 1% of what Pepe achieved with nothing. Staking at196% APY compounds daily while the listing approaches.
XRP price prediction: Can Ripple push past $1.67 as momentum builds?
XRP surged to $1.57, up nearly 9% in 24 hours as institutional access expands through regulated platforms like Coinbase Derivatives, which now offers futures for Bitcoin, Ethereum, Solana, and XRP. Retail activity has cooled however, with futures open interest falling to $2.33 billion, down sharply from the $10.94 billion peak in July.
The token faces resistance near $1.67. According to current XRP price predictions, a break above opens the path toward $2.00, but even that best case is roughly 27% from here. Not the 100x sitting at six zeros.
Hyperliquid rides the recovery as derivatives volume surges
HYPE trades near $40,47 according to CoinMarketCap as the broader market recovery lifts sentiment across the derivatives sector. Perpetual volume surged past $11 billion. Resistance at $39, with $43 and $50 as targets if it breaks.
A solid position, but the upside is measured in percentage points, not the 100x that sits at six zeros with three exchange products and a Binance listing.
The recovery is here and the listing window is closing
You can chase the XRP price prediction and hope for 27% if everything breaks right. Or you can position at $0.000000186 in an exchange ecosystem built by the team that created an $11 billion token and backed by dual audits from SolidProof and Coinsult. Over $8 million in presale conviction says the smart money already made its choice.
The Binance listing will close this entry permanently. Staking at 196% APY compounds daily. People are already in. This is the kind of entry that changes everything, but only for those who actually take it.
Click To Visit Pepeto Website To Enter The Presale

FAQs
What factors could influence XRP’s price movement in the near term?
XRP price predictions depend on holding $1.40 support and breaking $1.67 resistance to confirm stronger upward momentum on charts.
How does institutional activity impact XRP’s long term outlook for 2026?
Growing access through regulated platforms may support the XRP forecast as institutional participation increases liquidity and long term confidence.
What signals do analysts watch when estimating XRP’s next big move?
Sentiment, futures open interest, and resistance zones shape XRP price targets, especially combined with broader crypto and macro trends.
The post XRP Price Prediction: Pepeto Surges Past $8 Million While Ripple and Hyperliquid Ride the Market Recovery Higher appeared first on Blockonomi.

Bank warns about ‘cruel’ friendship fraudsters targeting older people

Fini to buy Caves House

Bitcoin Coils Below Six-Week Highs as Gold Stays Vulnerable at $5,000


-
 Tech7 days ago
A 1,300-Pound NASA Spacecraft To Re-Enter Earth’s Atmosphere
-
 Crypto World4 days ago
HYPE Token Enters Net Deflation as HyperCore Buybacks Outpace Staking Rewards
-

 Fashion4 days ago
Weekend Open Thread: Addict Lip Glow
-

 Tech2 days ago
Your Legally Registered ‘Motorcycle’ Might Not Count Under Proposed US Law
-
Sports3 days ago
Why Duke and Michigan Are Dead Even Entering Selection Sunday
-

 NewsBeat6 days ago
Residents reaction as Shildon murder probe enters second day
-

 Business2 days ago
Search for Savannah Guthrie’s Mother Enters Seventh Week with No Arrests
-

 Business7 days ago
Search Enters Sixth Week With New Leads in Tucson Abduction Case
-

 Sports6 days ago
PWHL, Senators discussing plan to keep Charge in Ottawa
-

 Business4 days ago
US Airports Launch Donation Drives for Unpaid TSA Workers as Partial Government Shutdown Enters Fifth Week
-
 Tech9 hours ago
Are Split Spacebars the Next Big Gaming Keyboard Trend?
-
Crypto World3 days ago
Coinbase and Bybit in Investment Talks: Could Bybit Finally Enter the US Crypto Market?
-

 NewsBeat6 days ago
I Entered The Manosphere. Nothing Could Prepare Me For What I Found.
-

 Business4 days ago
Country star Brantley Gilbert enters growing non-alcoholic beer market
-

 Business2 days ago
Australian shares drop as Iran war enters third week
-

 Crypto World2 days ago
Crypto Lender BlockFills Enters Chapter 11 with Up to $500M in Liabilities
-

 Sports4 days ago
College Basketball Best Bets: Conference Tournament Semifinal Picks
-

 Politics7 days ago
Trump Says Middle East Is ‘Very Lucky’ That He’s President
-

 Crypto World6 days ago
Three Binance Charts May Be Hinting at Bitcoin’s Next Move
-

 Business5 days ago
Trump demands Powell cut rates as Iran conflict raises energy prices


You must be logged in to post a comment Login