
Crypto World
Bitcoin Exchange Inflows Surge as BTC Hits $75K Resistance
On March 16, hourly inflows into centralized crypto venues spiked to 6,100 units, the highest level in over a month as a broad market rally took hold. Data compiled for the period show that larger transfers dominated the flow, comprising 63% of total inflows—the strongest share dating back to mid-October 2025. The surge in exchange deposits comes as the leading digital asset has advanced roughly 12% for the month, with intraday prints approaching six-week highs near 76,000 in mid-March. Traders frequently move funds to exchanges in anticipation of selling or swapping into stablecoins, a pattern that market participants watch closely for signs of distribution when price momentum wavers.
CryptoQuant’s analysis highlighted that the spike included a notable rise in the share of large inflows, a behavior historically linked to selling pressure. These on-chain dynamics add a layer of nuance to the ongoing rally, suggesting that even as prices push higher, there could be a growing readiness among market participants to monetize gains. The data, reported by Julio Moreno, the head of research at CryptoQuant, underscore the choppy balance between demand and potential supply as the market navigates macro uncertainty and cross-asset risk sentiment. CryptoQuant
Beyond the on-chain signal, the price landscape remains a focal point for traders. Bitcoin’s price action has driven the market to a roughly 12% gain for March, with the asset trading near multi-month resistance levels. In recent days, the market has flirted with a six-week high around $76,000, a level that has proven challenging to break on several attempts. Market observers point to the Realized Price, a measure of the average price at which active supply transacted, as a proxy for potential resistance. The Realized Price currently sits in the neighborhood of $84,700, with the lower band—where many traders previously found concrete resistance during bear phases—acting as a rough guide for possible price ceilings in the near term. This dynamic was evident as the price repeatedly tested the $75,000 area on Coinbase, finding resistance at each try in a short span of time. TradingView data corroborate the near-term challenge around that psychological threshold.
Amid the price action, traders are keenly watching the Federal Reserve’s policy trajectory. The forthcoming Fed meeting, scheduled for Wednesday, sits at the center of market expectations, with many participants pricing in no interest-rate changes for March. CME Group’s FedWatch tool showed a high probability—about 98.9%—that the federal funds rate will remain unchanged, with only a 1.1% chance of a hike. The market’s attunement to the Fed reflects a broader risk-off risk-on mood that often drives crypto liquidity and ETF flow dynamics in tandem with macro cues. As coverage in traditional outlets highlights, a hawkish or cautious stance from the central bank could alter risk appetite across assets, including cryptocurrencies. CME FedWatch data and related market commentary underscore the tightrope between growth worries and inflation concerns that has defined the current regime.
In context, the rally’s momentum appears fragile, and the on-chain signals—while pointing to ongoing demand—also warn of potential distribution if large holders decide to realize gains as headline risk shifts. The price vicinity around $75,000 remains a key focal point; if the asset can push above this zone, it could test the next band near the realized price level, although history shows the lower RP band can act as a stubborn resistance in bear-market cycles. Traders are therefore weighing whether the current flow pattern represents a temporary flush of liquidity to exchanges or the onset of a broader reallocation into longer-term holdings or other assets, including stablecoins.
Why it matters
For investors, the observed spike in exchange inflows—especially with a rising share of large transfers—serves as a reminder that on-chain activity does not always align with short-term price strength. If sellers emerge from notable exchange deposits, price weaknesses could follow, even in a currently constructive market backdrop. The Fed’s rate stance, coupled with macro headlines, can influence liquidity and risk sentiment, which in turn shapes how and where capital flows. For market builders and liquidity providers, monitoring the balance between on-chain realized prices and exchange inflows could offer early clues about shifts in supply-demand dynamics and potential volatility around key technical levels.
From a macro perspective, the interplay between monetary policy expectations and crypto price action remains a critical driver of flows and risk tolerance. The Fed’s decision on Wednesday—alongside ongoing inflation readings and geopolitical developments—will likely set the tone for near-term momentum. Traders keeping a close eye on the on-chain data and the official communications should be prepared for rapid shifts in sentiment, especially if the Fed signaling strengthens or weakens the case for rate cuts later in the year.
What to watch next
- Federal Reserve decision and accompanying statement (Wednesday): assess any changes to forward guidance and inflation outlook.
- Next batch of on-chain data from CryptoQuant: watch for shifts in the share of large inflows versus overall inflows and any corroborating metrics on exchange net flows.
- Price action around the $75,000 level and the realized price vicinity near $84,700: look for breakout or rejection patterns and volume confirmation.
- Market reaction to Fed commentary: observe risk appetite shifts that could impact liquidity, ETF flows, and spot market participation.
Sources & verification
- CryptoQuant insights on exchange inflows and the share of large inflows for March 16–17, including the 63% figure.
- CME FedWatch tool data on the probability of rate hold versus hike.
- Associated Press reporting on Fed policy expectations and inflation considerations in the current environment.
- Cointelegraph market coverage discussing Bitcoin’s price around $70k and near-term resistance levels.
- TradingView BTCUSD data for price action on Coinbase as a reference for breakout and resistance testing.
Bitcoin exchange flows rise ahead of Fed decision; on-chain signals warn of selling pressure
Bitcoin (CRYPTO: BTC) exchange flows surged ahead of the Federal Reserve’s policy decision, with on-chain data indicating a potential tilt toward distribution despite a broader rally. On March 16, centralized exchanges recorded inflows totaling 6,100 coins—the highest since February 20—according to CryptoQuant. A closer breakdown shows large transfers dominating the flow, making up about 63% of total inflows, the strongest proportion observed since October 2025. These signals emerge as the asset has climbed roughly 12% in March, drawing near $76,000 in intraday trading on March 17. The behavior of inflows and on-chain metrics has historically foreshadowed price dynamics, and traders are weighing whether the current momentum can be sustained or whether a wave of selling could emerge as participants seek risk-adjusted gains. CryptoQuant notes the potential for selling pressure when large deposits to exchanges spike, a pattern that has played out in past cycles.
The price backdrop remains a mix of resilience and caution. After a month characterized by a steady ascent, the asset touched six-week highs near $76,000, underscoring renewed risk appetite among investors. Yet the on-chain Realized Price, which represents the average break-even price for active holders, sits well higher at approximately $84,700. This creates a ceiling effect, as the current price remains below the lower band of the realized-price metric, a zone historically associated with resistance during bear-market phases. Market data from TradingView show the asset testing the $75,000 mark on Coinbase multiple times in the past 24 hours, underscoring the psychological and technical significance of that level.
The broader market is anchored by expectations around the Federal Reserve’s policy stance. CME FedWatch data indicated a near-ceremonial stance for the March meeting, with markets pricing in a substantial probability of no rate change. The implications of the Fed’s decision—or even its language around rate paths—could influence liquidity cycles across crypto markets, where ETF interest, spot demand, and derivative positioning interact with macro risk sentiment. Associated Press reporting on the Fed’s trajectory highlights ongoing inflation concerns and the possibility that the central bank could refrain from rate cuts in the near term, a scenario that could shape risk-on versus risk-off temperament in the weeks ahead. CME FedWatch Associated Press
Looking forward, the market will likely calibrate its expectations around the Fed’s guidance and the pace of any potential policy normalization. Should the Fed acknowledge persistent inflation risks while signaling a cautious path, traders could see continued volatility as liquidity shifts between risk assets. Conversely, a more accommodating read could sustain the current momentum, allowing the rally to extend and on-chain inflows to reflect renewed demand rather than distribution. The next few sessions will be telling, as investors parse macro cues against the backdrop of on-chain indicators that have in the past proven prescient about fundamental shifts in supply and demand.

EUR/USD is attempting a recovery wave from the 1.1400 zone. USD/CHF climbed higher above 0.7900 before it started a downside correction.
Important Takeaways for EUR/USD and USD/CHF Analysis Today
· The Euro declined toward 1.1400 before it started a recovery wave against the US Dollar.
· There was a break above a major bearish trend line with resistance at 1.1500 on the hourly chart of EUR/USD at FXOpen.
· USD/CHF climbed higher above 0.7850 and 0.7900 before it faced hurdles.
· There was a break below a bullish trend line with support at 0.7870 on the hourly chart at FXOpen.
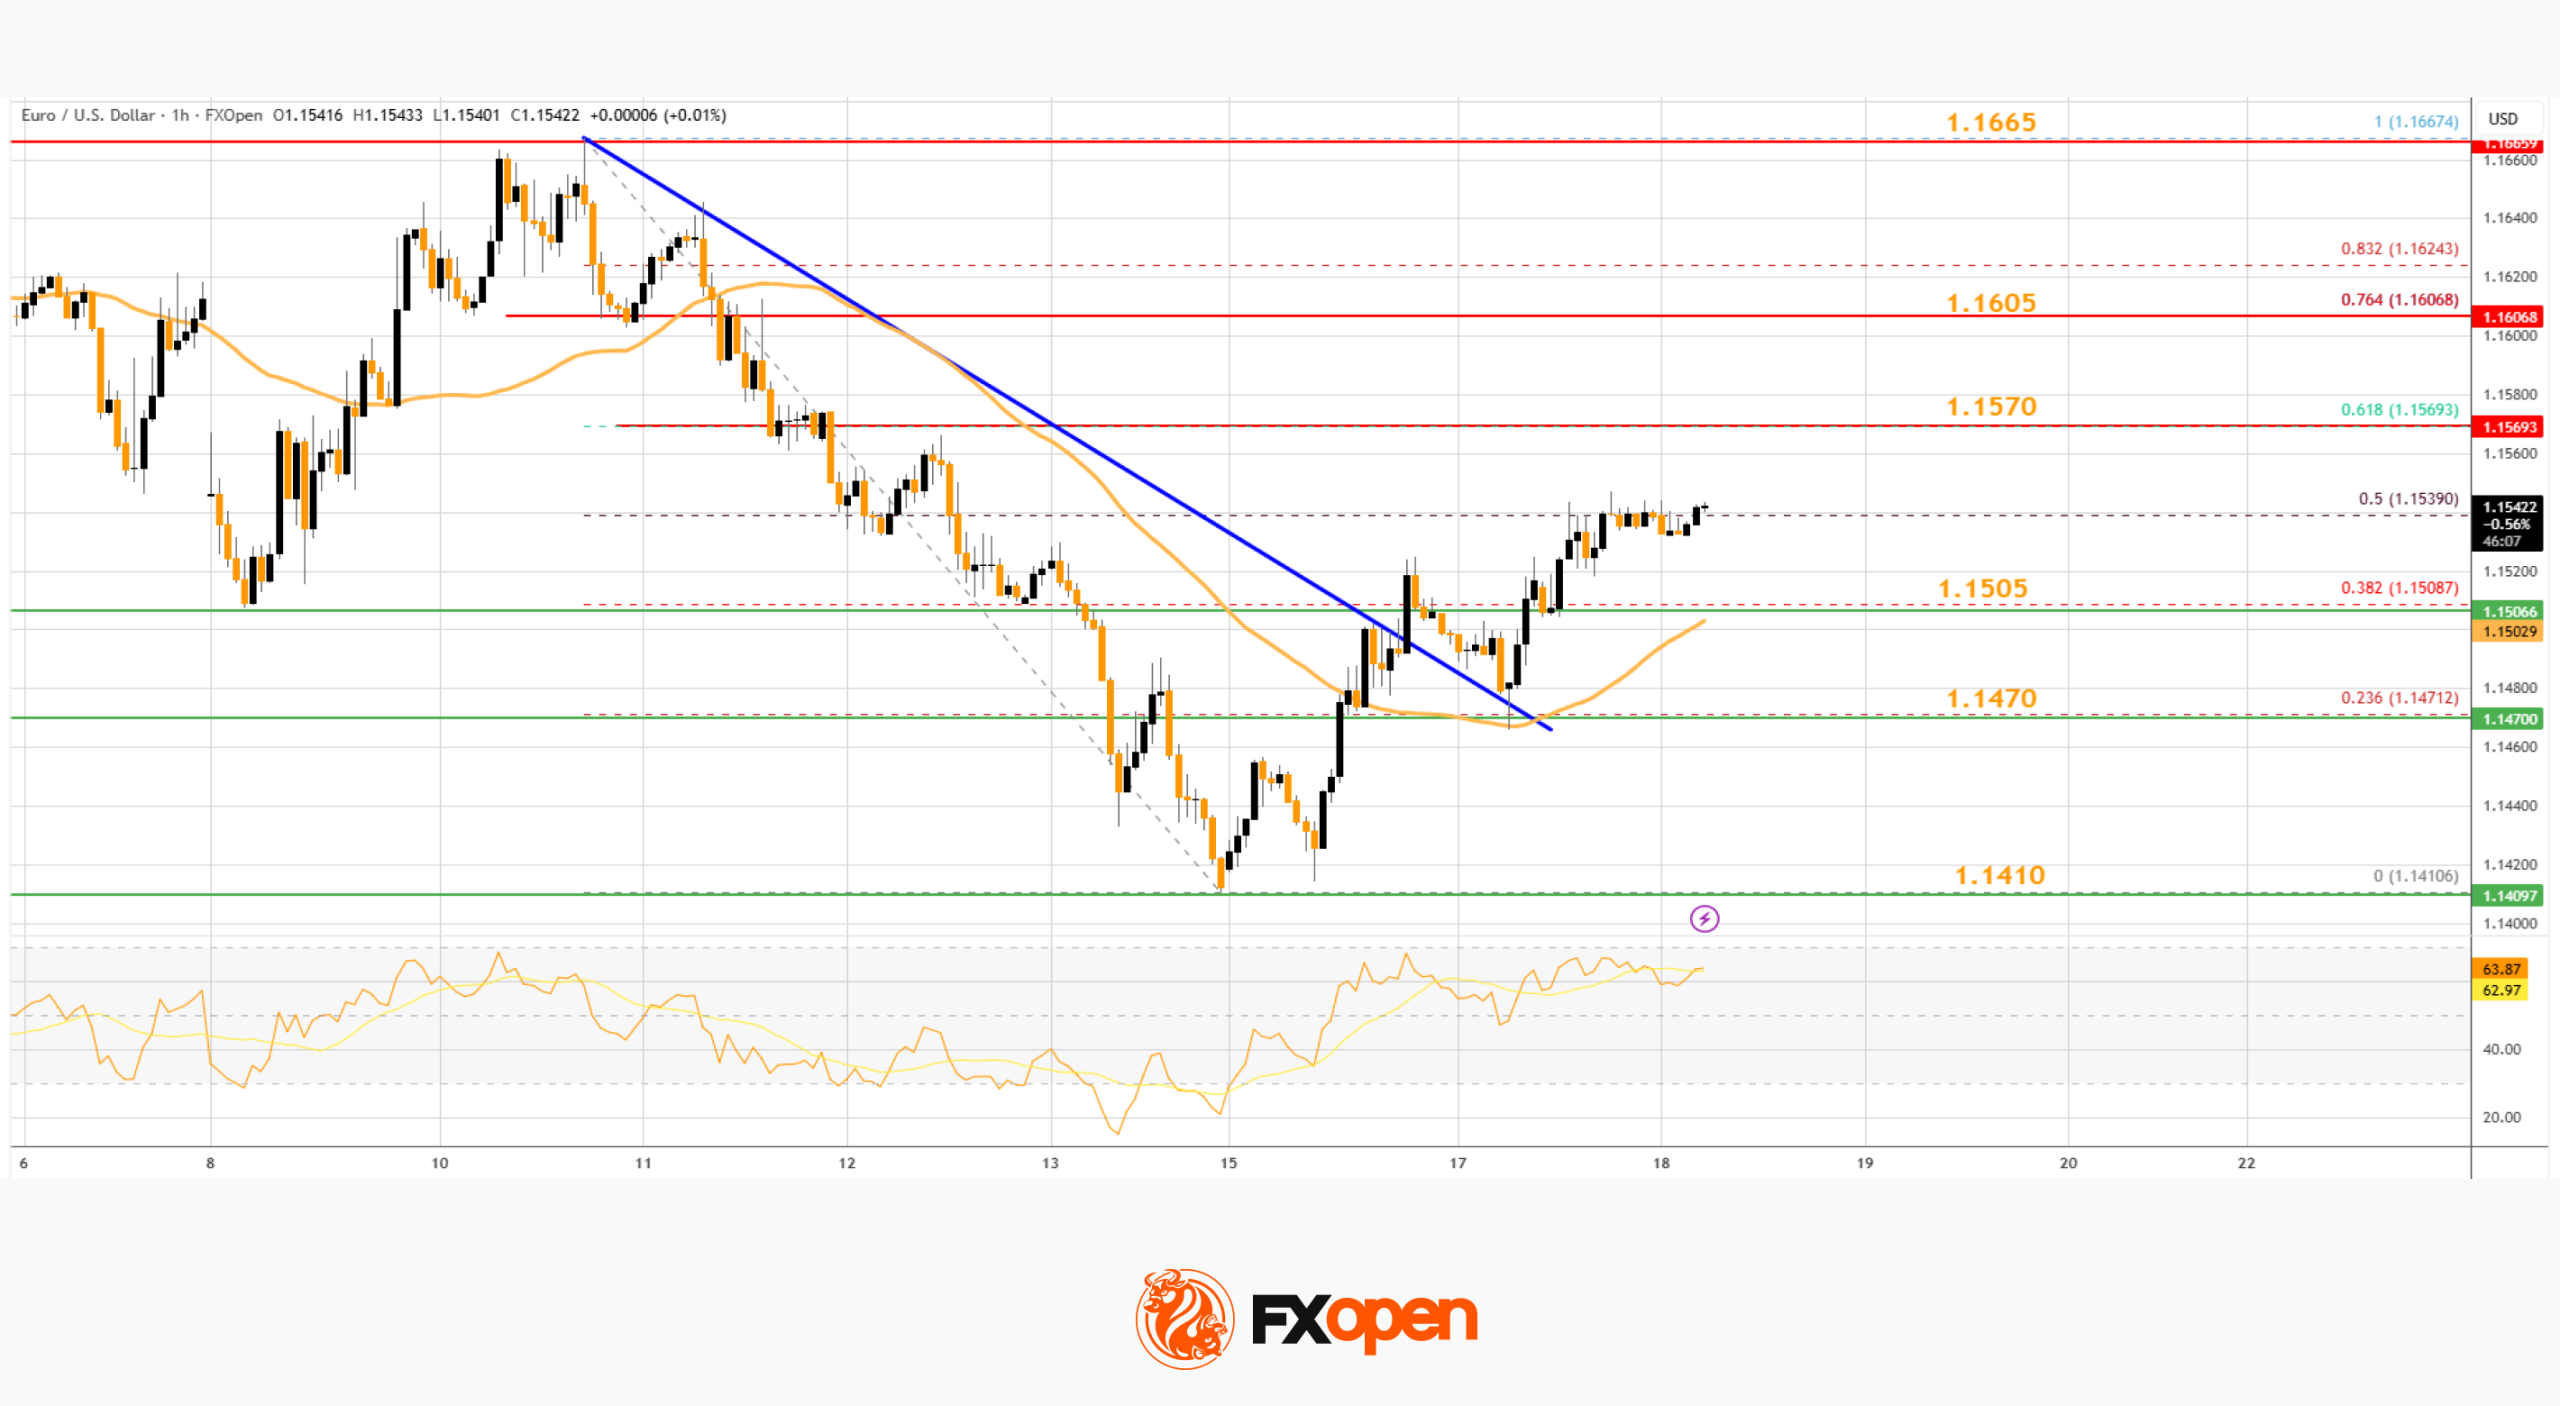
EUR/USD Technical Analysis
On the hourly chart of EUR/USD at FXOpen, the pair extended the decline below 1.1500. The Euro even declined below 1.1440 before the bulls appeared against the US Dollar.
The pair tested 1.1410 and recently started a recovery wave. There was a move above 1.1450 and 1.1480. The pair climbed above the 38.2% Fib retracement level of the downward move from the 1.1667 swing high to the 1.1410 low.

More importantly, there was a break above a major bearish trend line with resistance at 1.1500. The pair is now trading above 1.1520 and the 50-hour simple moving average. Immediate hurdle on the EUR/USD chart is near the 61.8% Fib retracement at 1.1570.
The first key breakout zone sits at 1.1605. An upside break above 1.1605 might send the pair toward 1.1665. Any more gains might open the doors for a move toward the 1.1700 zone. If there is a fresh decline, the pair might find bids near 1.1505.
The next major support is 1.1470. A downside break below 1.1470 could send the pair toward 1.1410. Any more losses might send the pair to 1.1360.
USD/CHF Technical Analysis
On the hourly chart of USD/CHF at FXOpen, the pair started a decent increase from 0.7750. The US Dollar climbed above the 0.7800 handle against the Swiss Franc.
The bulls were able to pump the pair above the 50-hour simple moving average and 0.7850. Finally, the pair tested 0.7920. A high was formed near 0.7923 and the pair is now correcting some gains. The pair dipped below the 38.2% Fib retracement level of the upward move from the 0.7748 swing low to the 0.7923 high.
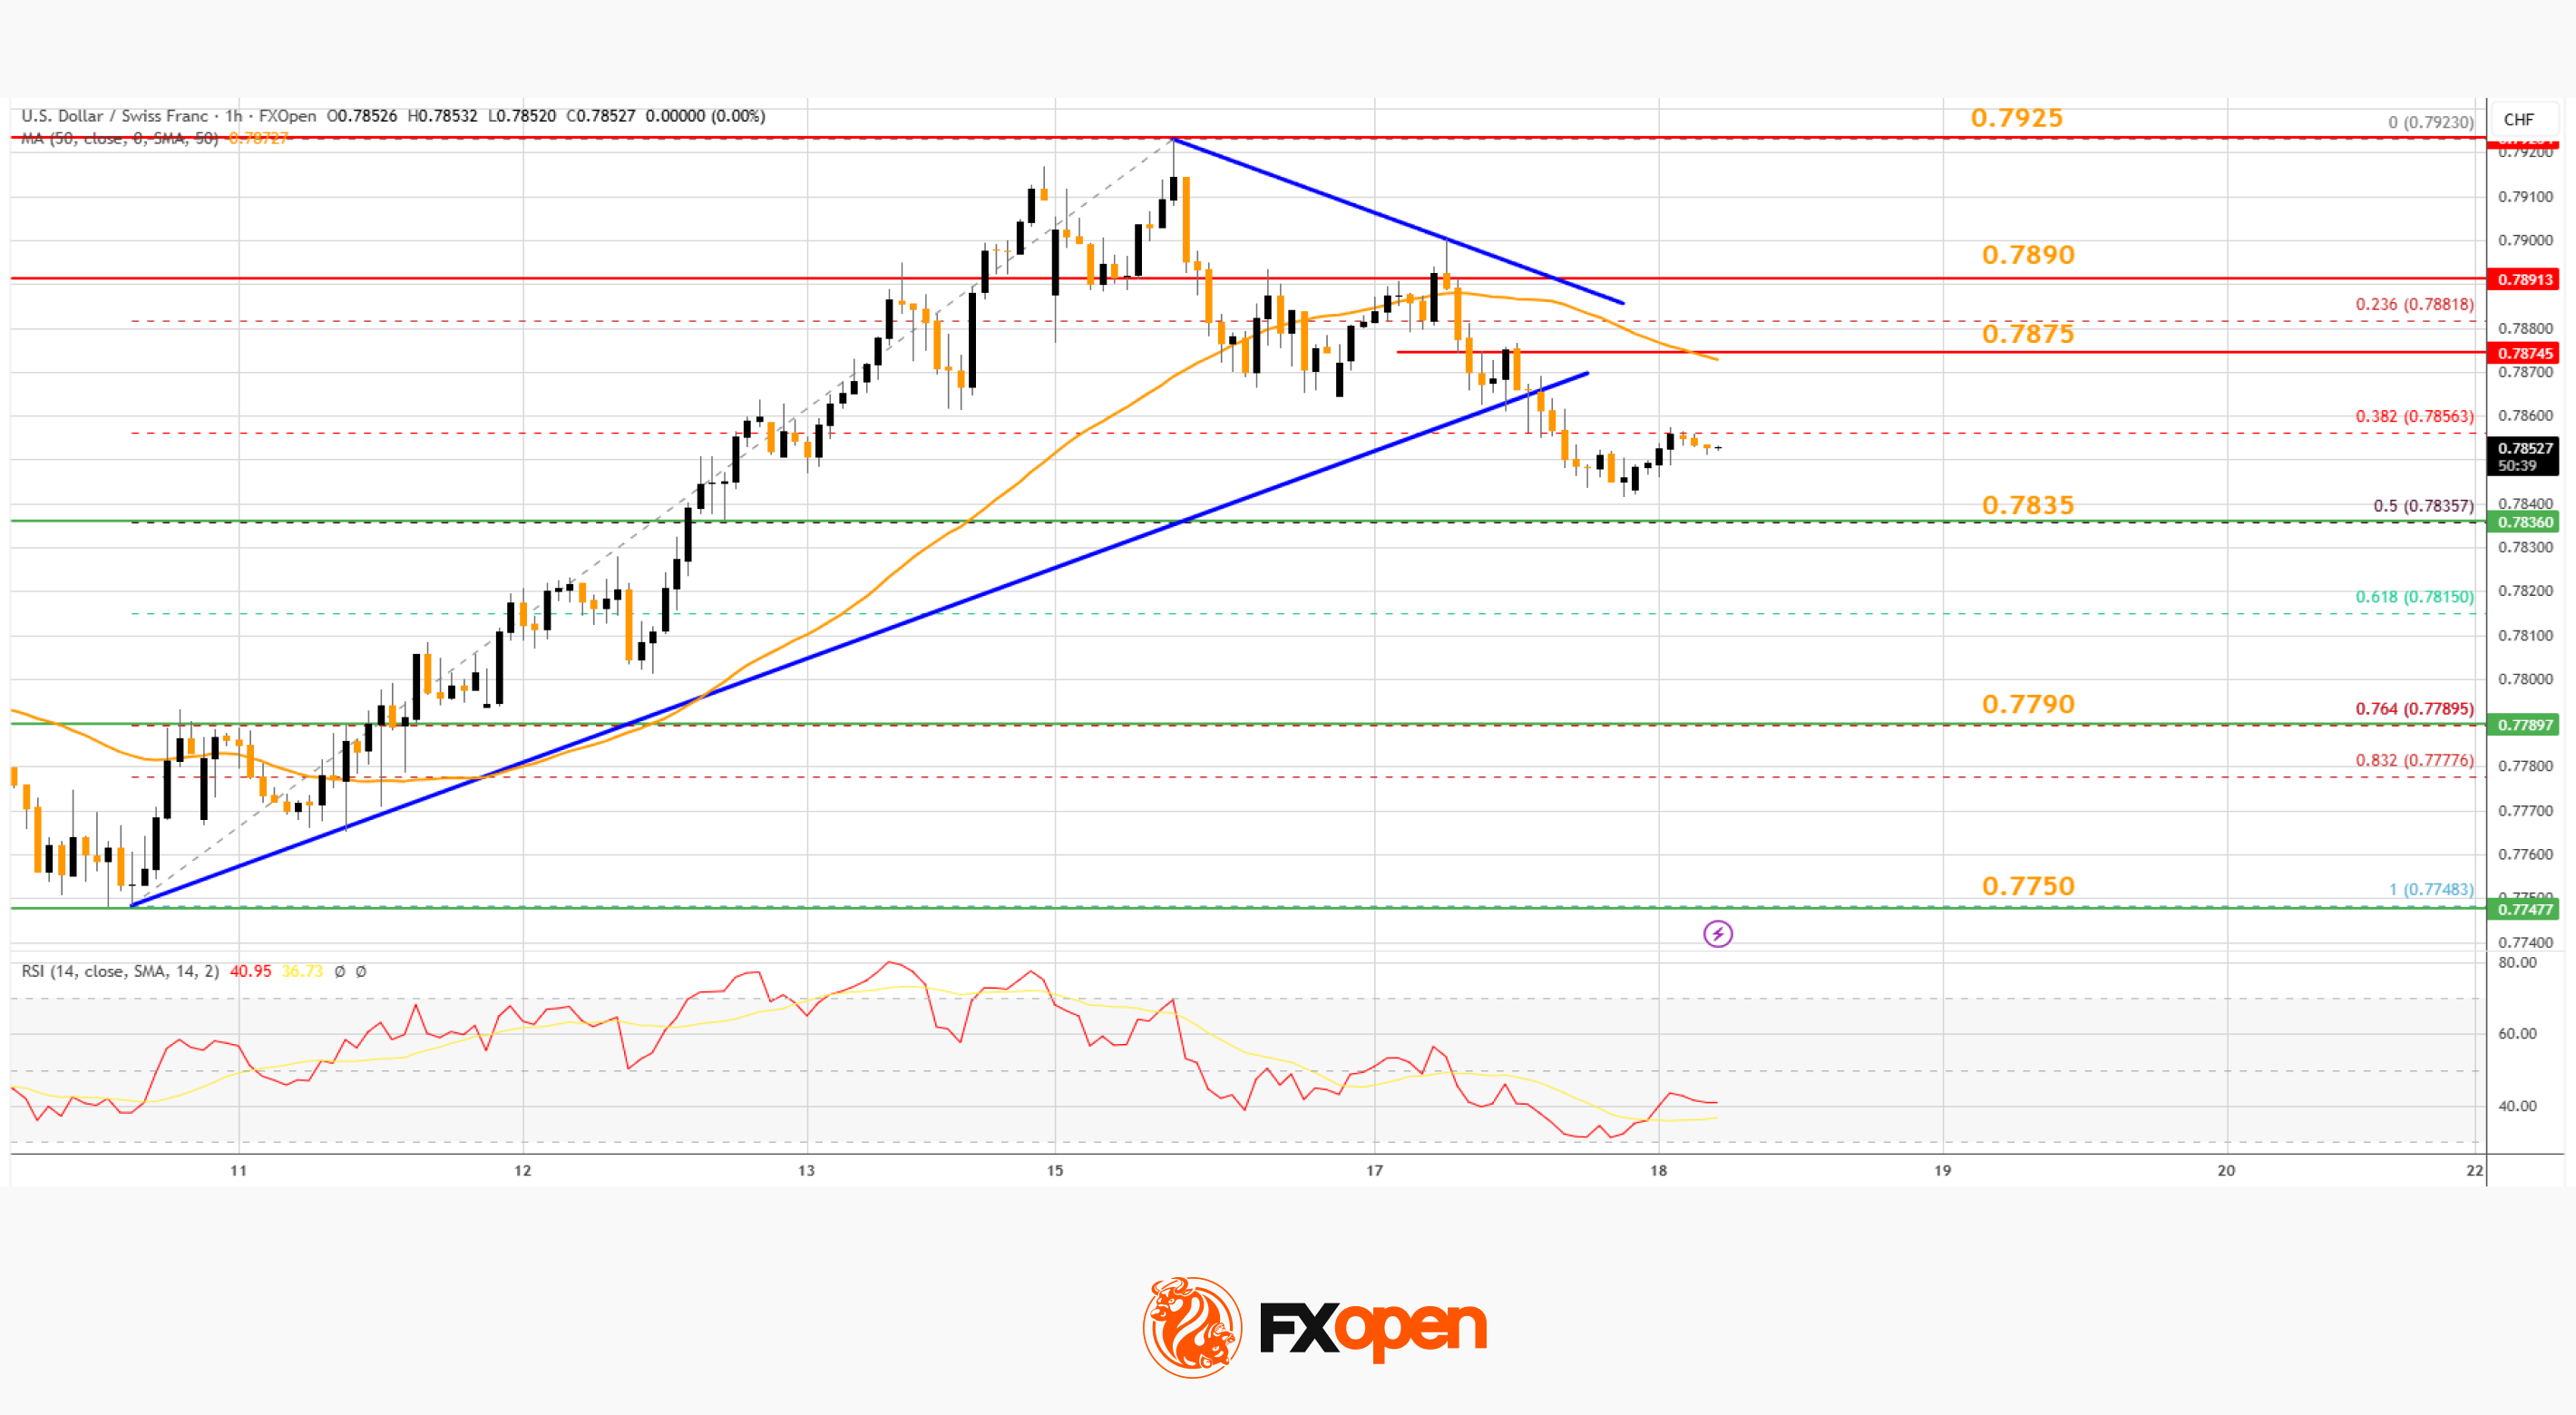
Besides, there was a break below a bullish trend line at 0.7870. On the downside, immediate support on the USD/CHF chart is near the 50% Fib retracement at 0.7835. The first key area of interest might be 0.7790.
A downside break below 0.7790 might call for a drop to 0.7750. Any more losses may possibly open the doors for a move toward 0.7720.
On the upside, the pair could struggle near 0.7875. The first major barrier for bulls is 0.7890. If there is a clear break above 0.7890 and the RSI climbs above 50, the pair could start another increase. In the stated case, it could test 0.7925.
Trade over 50 forex markets 24 hours a day with FXOpen. Take advantage of low commissions, deep liquidity, and spreads from 0.0 pips (additional fees may apply). Open your FXOpen account now or learn more about trading forex with FXOpen.
This article represents the opinion of the Companies operating under the FXOpen brand only. It is not to be construed as an offer, solicitation, or recommendation with respect to products and services provided by the Companies operating under the FXOpen brand, nor is it to be considered financial advice.

Whale activity around the Official Trump (TRUMP) token, which is tied to United States President Donald Trump, has hit a five-month high according to on-chain data.
Summary
- Whale wallets holding over 1 million TRUMP tokens have risen to a five-month high of 83, with combined holdings valued at around $3.7 million, according to Santiment.
- TRUMP price has climbed more than 50% from recent lows after a Mar-a-Lago luncheon announcement for top holders, though the token remains over 95% below its all time high.
According to Santiment, there are now 83 wallets that hold more than 1 million Official Trump (TRUMP) tokens. Collectively, these holdings amount to roughly $3.7 million worth of the tokens, marking the highest level recorded since Oct. 8 last year.
TRUMP has remained in a steady downtrend since the start of the year, but activity picked up pace after the project’s team announced a luncheon event at Trump’s Mar-a-Lago residence, where the U.S. president is expected to host top token holders.
Beyond the main event, those ranked among the top 297 holders are eligible to attend, while the top 29 wallets will qualify for a private reception with the president, subject to background checks.
Several figures across the crypto sector are expected to take part in the gathering, which appears to have driven the recent surge in interest around the token.
Additional data from CoinCarp shows that TRUMP has 642,882 holders, though concentration remains heavily skewed. Over 91% of the supply is held by the top 10 wallets, while roughly 97% sits with the top 100 wallets.
TRUMP started rallying from multi-month lows near $2.7, climbing more than 50% to reach a peak of $4.35. As of press time, the token is up over 26% in the past 7 days, though it remains down more than 95% from its all time high of $73.43.
For TRUMP holders, this pattern is not new. Last year, a similar gala-style event was announced, which saw the token rally sharply in the lead-up.
However, after the initial momentum faded, the token entered a prolonged downtrend, and unless market conditions change meaningfully, the latest event could follow a similar trajectory.
Regulatory concerns remain
While the upcoming event has generated renewed interest among crypto participants, it is also likely to draw scrutiny in Washington, where lawmakers have continued to question whether such initiatives present conflicts of interest.
Last year, Democratic Senator Jon Ossoff called for Trump’s impeachment over the memecoin dinner, while Senators Elizabeth Warren and Adam Schiff urged ethics officials to review the president’s involvement with the event.
Meanwhile, Representative Sam Liccardo introduced the Modern Emoluments and Malfeasance Enforcement (MEME) Act in February 2025, seeking to bar federal officials and their families from issuing or promoting digital assets.
Similar concerns could resurface this time around, as lawmakers have already raised questions over potential foreign influence and financial interests tied to Trump-linked crypto ventures.

Shibarium’s recovery process shows steady progress as indexing levels improve and system stability returns. Network data accuracy remains limited, yet activity continues to build across the ecosystem. Meanwhile, broader developments around Shiba Inu add new context to the current market positioning.
Shibarium indexing recovery gains traction
Shibariumscan reports that 45% of network blocks are now indexed, showing clear progress from earlier levels. This improvement follows ongoing restoration efforts after infrastructure changes. Consequently, the network continues to rebuild visibility across transactions and wallet activity.
Earlier, the team initiated a migration to a new server environment to boost performance and reliability. This move aimed to address system limitations that affected data tracking and user experience. As a result, indexing resumed gradually while stability improved across the network.
However, incomplete indexing still affects the accuracy of key metrics such as total transactions and wallet counts. Users may see partial data until the process reaches completion. Nevertheless, the steady increase signals continued backend recovery and system alignment.
Temporary display issues and network adjustments
At the beginning of the month, users reported missing tokens and NFTs within wallet interfaces and the explorer. These display issues created confusion across parts of the Shiba Inu ecosystem. However, developers linked the problem to indexing delays and a temporary bridge update.
Indexing plays a central role in how blockchain explorers present on-chain data. Without full indexing, systems cannot display complete transaction histories or asset balances. Therefore, partial indexing directly impacts how users interact with network data.
Meanwhile, ongoing updates aim to restore full functionality across the explorer and connected services. The community expects improvements as indexing progresses toward completion. Additionally, future upgrades may strengthen data handling and network performance further.
Broader developments shape Shiba Inu outlook
Beyond technical updates, Shiba Inu has entered discussions around inclusion in a proposed exchange-traded fund. T. Rowe Price submitted plans for an actively managed crypto ETF that includes multiple digital assets. This development places Shiba Inu within a broader institutional framework.
The asset manager oversees significant capital, which adds weight to the filing despite pending regulatory decisions. Inclusion in such a fund could expand exposure to digital assets beyond direct trading platforms. Consequently, it reflects ongoing integration between traditional finance and crypto markets.
At the same time, Shiba Inu price activity remains subdued amid wider market conditions. The token declined slightly over the past day while trading near the lower end of recent ranges. However, macroeconomic factors continue to influence short-term price direction.
The current market focus centers on the Federal Reserve meeting and interest rate expectations. Market data suggests a high probability of unchanged rates within the existing range. As a result, traders position cautiously while awaiting further signals from monetary policy decisions.
Bittensor (TAO) crypto just surged 46% in March. Trading near $277.
The network successfully deployed its Covenant-72B model on Subnet 3. That is not a roadmap promise. It is a live heavy-compute model running on-chain.
The market responded immediately. The subnet-native τemplar token pumped nearly 200% in under a week.
TAO is no longer just a governance play. Actual utility demand is driving this move.
Key Takeaways:
- TAO posts 46% monthly gain driven by Covenant-72B model deployment.
- Subnet 3 activity explodes, pushing the τemplar token up 194% in days.
- Institutional inflow accelerates ahead of potential Grayscale ETF approval.
Covenant-72B: Why This Release Moved the Market
Covenant-72B is a 72 billion parameter large language model. A significant jump from the lighter models Bittensor has run previously. It means the network can now handle enterprise-grade compute loads.
That scale directly impacts validator staking. Running a model this size requires higher quality miner inputs and more TAO staked to secure the bandwidth. Demand for compute on Subnet 3 created direct demand for the collateral backing it. The pricing mechanism worked exactly as designed.
The biggest winner was not TAO itself. It was τemplar, the Subnet 3 native token, which rallied 194% following the deployment. That is the ecosystem feedback loop in action. High-performance subnets attract speculative capital, which deepens liquidity for the miners running there.
Volume backs the move. TAO’s volume-to-market-cap ratio is sitting between 17% and 19%, with over $254 million traded in 24 hours. That is not a thin order book pump. That is real participation.
When subnet tokens outperform the parent chain like this, it typically signals the start of an application layer season for the protocol. That is the next phase traders are positioning for.
TAO Crypto Price Analysis: Can Bulls Breach $300?
TAO is consolidating at $277.49, just below the $300 psychological level. Structure stays bullish as long as $250 holds.
The 46% impulse already flushed weak hands. OI is building. Traders are positioning for a breakout.
Bull case: daily close above $300 opens $350. Grayscale ETF filing provides the fundamental narrative. Volume needs to stay above $250 million daily to keep the momentum alive.
Bear case: rejection at $300 retests $240. If the broader altcoin recovery stalls, TAO could chop sideways for weeks. Watch $265 closely. Lose that level and the immediate breakout setup is invalidated.
The post Bittensor (TAO) Crypto Surges 46% as Covenant-72B Launch Triggers Subnet Explosion appeared first on Cryptonews.
US spot Bitcoin exchange-traded funds (ETFs) extended their inflow streak to seven consecutive days, marking the longest run since October 2025.
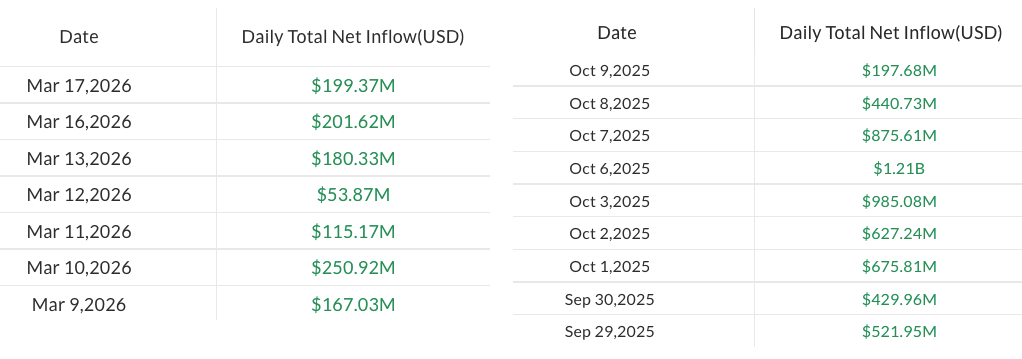
Spot Bitcoin (BTC) ETFs added $199.4 million on Monday, bringing their seven-day streak to around $1.2 billion, according to data from SoSoValue. The latest inflows suggest continued institutional interest, though total inflows remain far below the roughly $6 billion seen during the October 2025 run.
Total trading volumes fell to $2.6 billion on Monday, while total assets under management in Bitcoin ETFs climbed to $96.7 billion. Net year-to-date flows remain negative, following $1.8 billion in cumulative monthly outflows and $1.7 billion in cumulative inflows.
The ETF rebound has coincided with broader strength in crypto investment products, which drew about $2.7 billion over three straight weeks, lifting year-to-date inflows to roughly $1.2 billion, according to CoinShares.

XRP funds post first gains after eight-day losing streak
Spot altcoin ETFs also saw a broad uptick, led by Ether (ETH) with $138.3 million in inflows, the largest since March 4. Solana (SOL) followed the trend with $17.8 million in inflows, also the biggest since March 4.
XRP (XRP) stood out with $4.64 million inflows, the first gains since March 4. The ETFs saw $56.8 million outflows in the period from March 5-16.

Despite $33.5 million in outflows so far in March, XRP ETFs remain in the green year-to-date, supported by $73.7 million in inflows during January and February.
Solana leads all crypto ETFs year-to-date with $223 million in net inflows.
Related: Bernstein says Bitcoin rebound reflects more resilient long-term holder base
In contrast, Ether ETFs remain underwater, with $364.5 million in year-to-date outflows, following $358.5 million in inflows in March and $723 million in outflows during the first two months of the year.
Magazine: Spot Bitcoin ETFs first green week, crypto ATM losses surge 33%: Hodler’s Digest, Mar. 8 – 14

Bitcoin price fell back under the $74,000 support level after three straight days of gains as investors remained cautious ahead of the Federal Reserve’s rate cut decision scheduled for later today.
Summary
- Bitcoin price slipped below $74,000 after a three-day rally, as traders booked profits ahead of the Federal Reserve’s rate decision.
- Markets expect the Fed to hold rates at 3.50% to 3.75%, with CME FedWatch showing over 99% probability of no rate cut.
- Bullish technical signals persist, with a triangle breakout and ETF inflows supporting upside, while $76,000 remains key resistance.
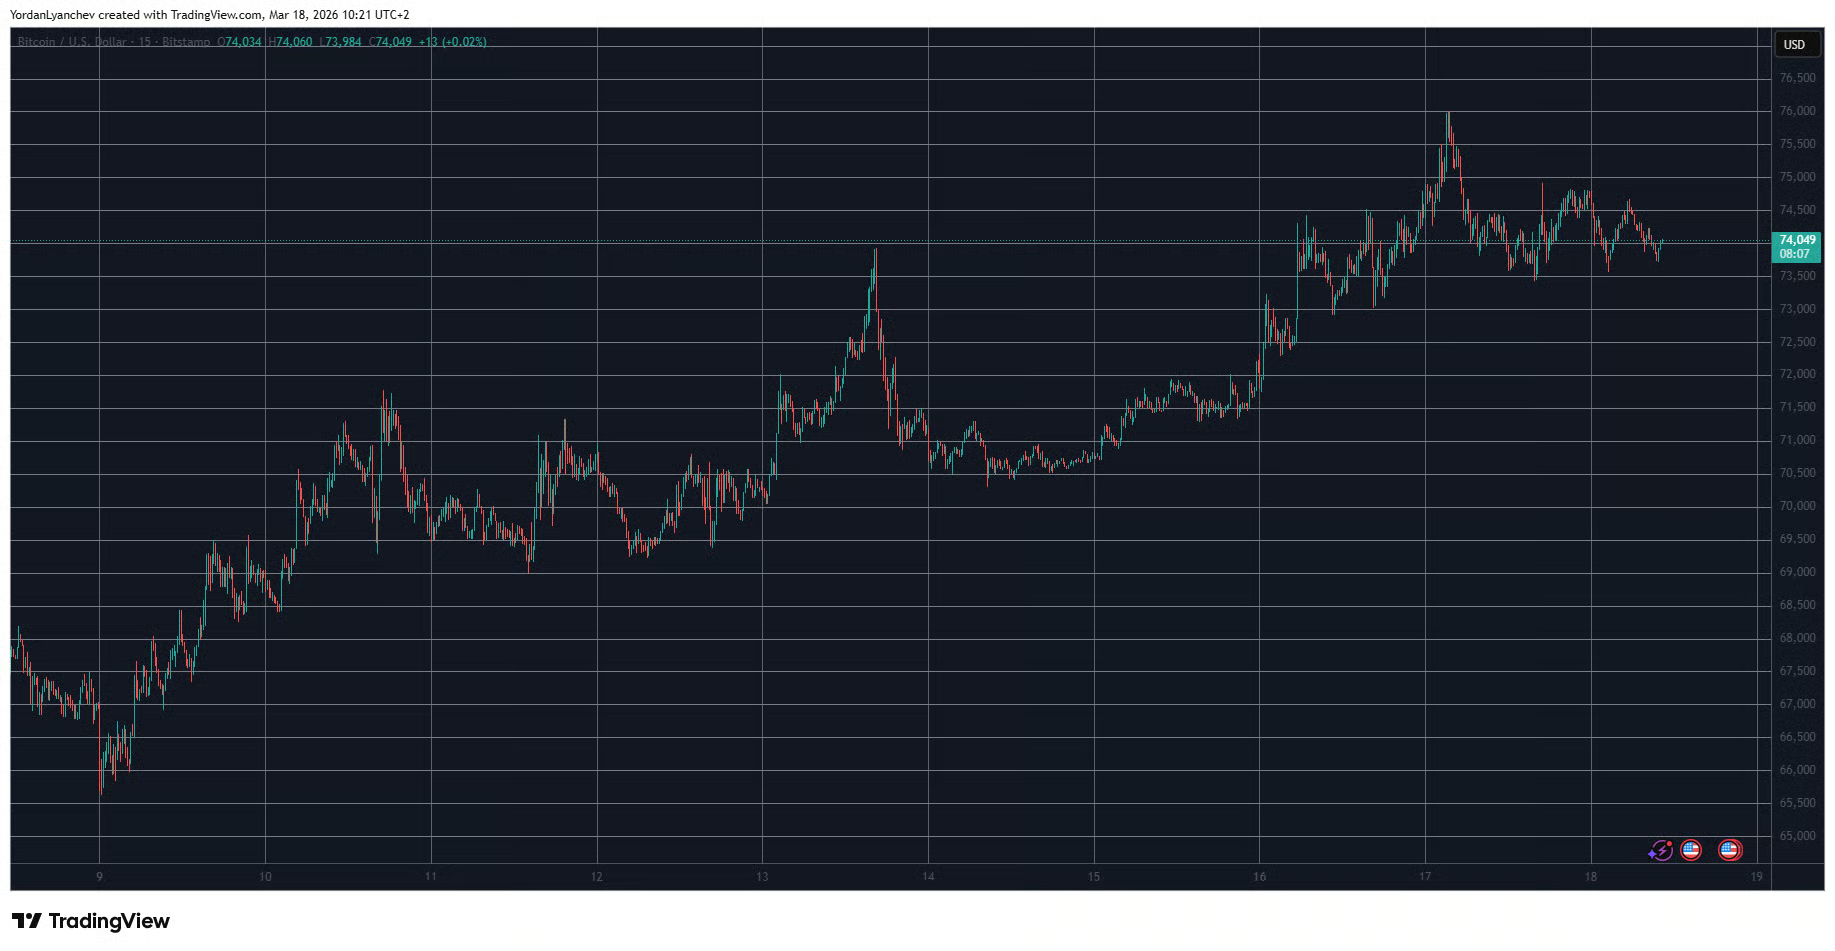
After rallying over 7% and touching nearly $76,000 on Tuesday, Bitcoin (BTC) gave up part of its gains, dropping back below the $74,000 support level on Wednesday. Trading at $73,836, the bellwether remains 2.7% lower than its local peak and 24% below its year-to-date high.
Bitcoin price fell as investors booked profits from its recent run before entering wait-and-watch mode ahead of the Federal Reserve’s rate cut decision scheduled to be revealed at 2:30 P.M. UTC today.
According to market expectations, the Federal Reserve will likely hold interest rates at 3.50% to 3.75%. This stance is likely due to a surge in inflation from a spike in oil prices, which climbed over $100 per barrel amid the ongoing U.S.-Iran war in the Middle East. According to the CME FedWatch Tool, the odds of the Fed holding the interest rate steady are as high as 98.9%.
Risk assets such as Bitcoin tend to benefit when the Fed cuts interest rates, while they often face pressure when the Federal Reserve decides to hold or increase them to combat sticky inflation.
However, it should be noted that the Fed’s interest rate decision could have already been priced in, and the market could just be taking a breather before resuming its broader trend, as seen during rallies in times of macroeconomic and geopolitical uncertainty.
For Bitcoin, a key underlying catalyst that could support a potential rebound comes from the continued inflows into spot Bitcoin ETFs. Data from SoSoValue show that the 12 spot BTC ETFs have extended their inflow streak to seven consecutive days, attracting nearly $1.17 billion from institutional investors.
On the daily chart, Bitcoin price has confirmed a breakout from the upper side of a symmetrical triangle pattern, a bullish continuation pattern in technical analysis.
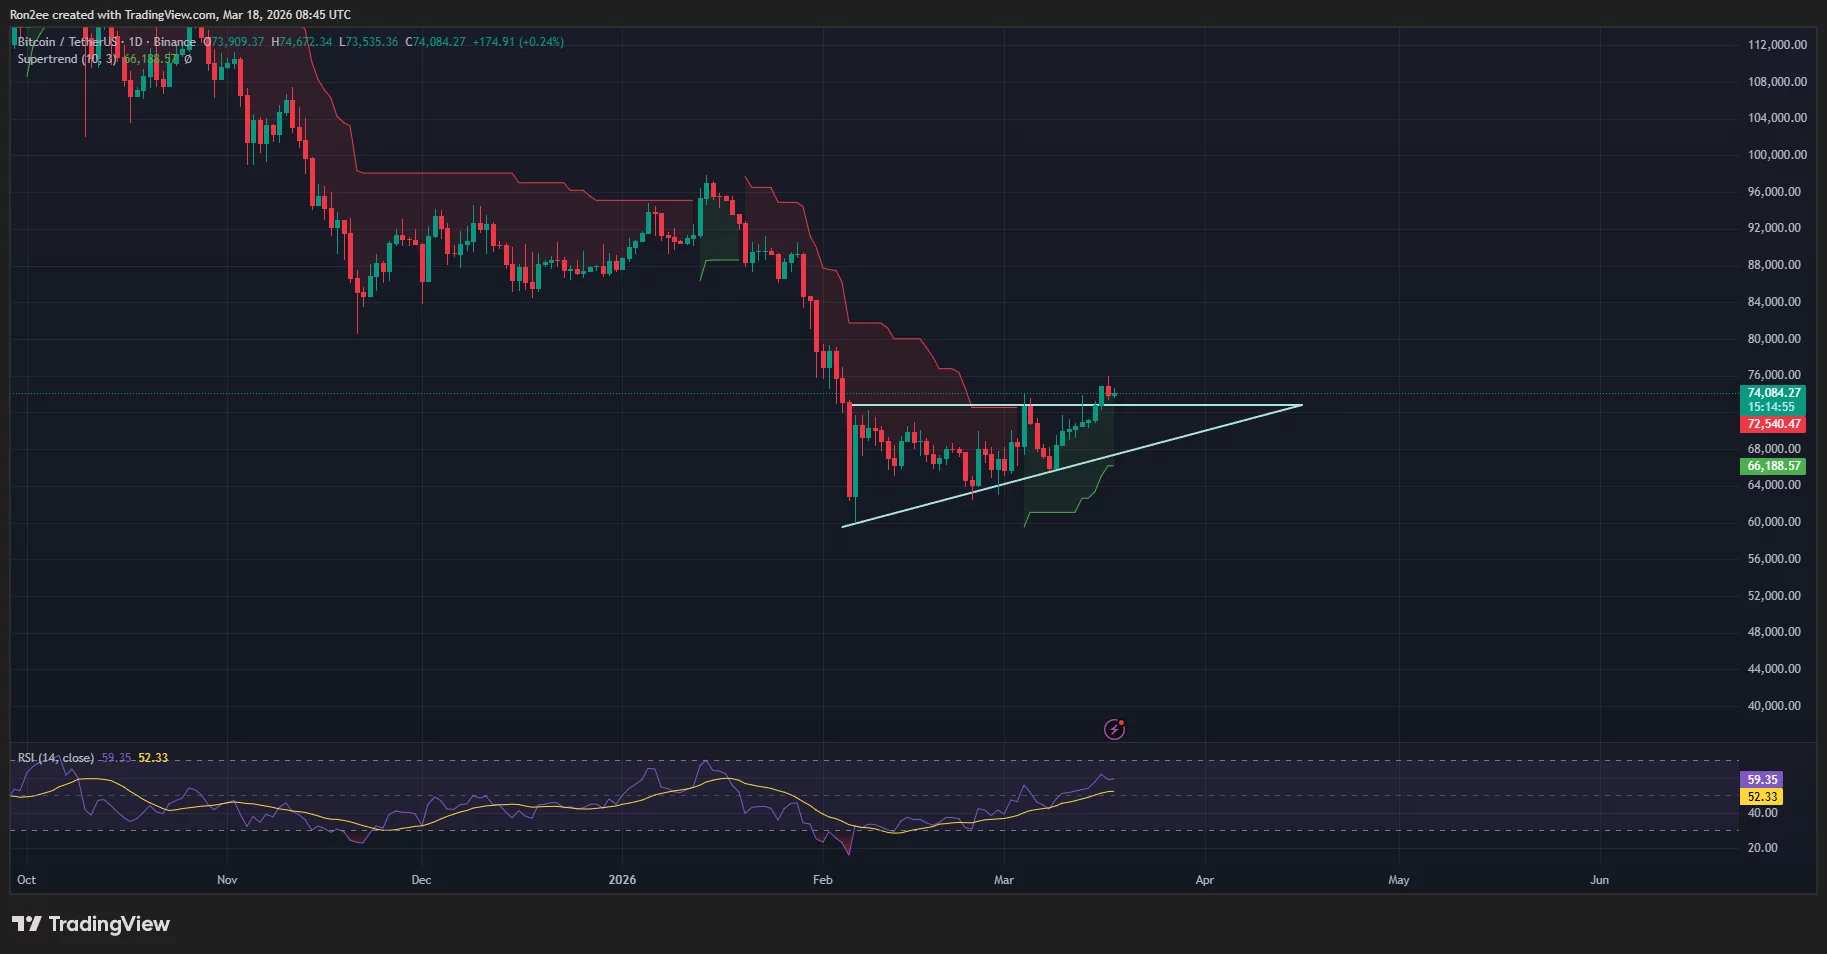
Bitcoin price has also moved above the Supertrend line, which has flipped green, a sign that the short-term momentum is turning positive.
Meanwhile, the Relative Strength Index reading has moved higher to 59 while still having room for more gains before hitting overbought levels at 70, where buying pressure often reaches exhaustion.
For now, traders would be keeping an eye on $76,000, the level BTC failed to breach during its run on Tuesday. A break above the threshold could clear the way to test the $80,000 psychological milestone.
On the contrary, a drop below $73,000 could lead to a shift in sentiment and a deeper retest of support levels near $71,000.
Disclosure: This article does not represent investment advice. The content and materials featured on this page are for educational purposes only.
Crypto World
SIREN Solidifies Top 100 Spot With 300% Monthly Surge, BTC Stalls at $74K: Market Watch
Aside from SIREN, the other double-digit gainer today is M, followed by KAS.
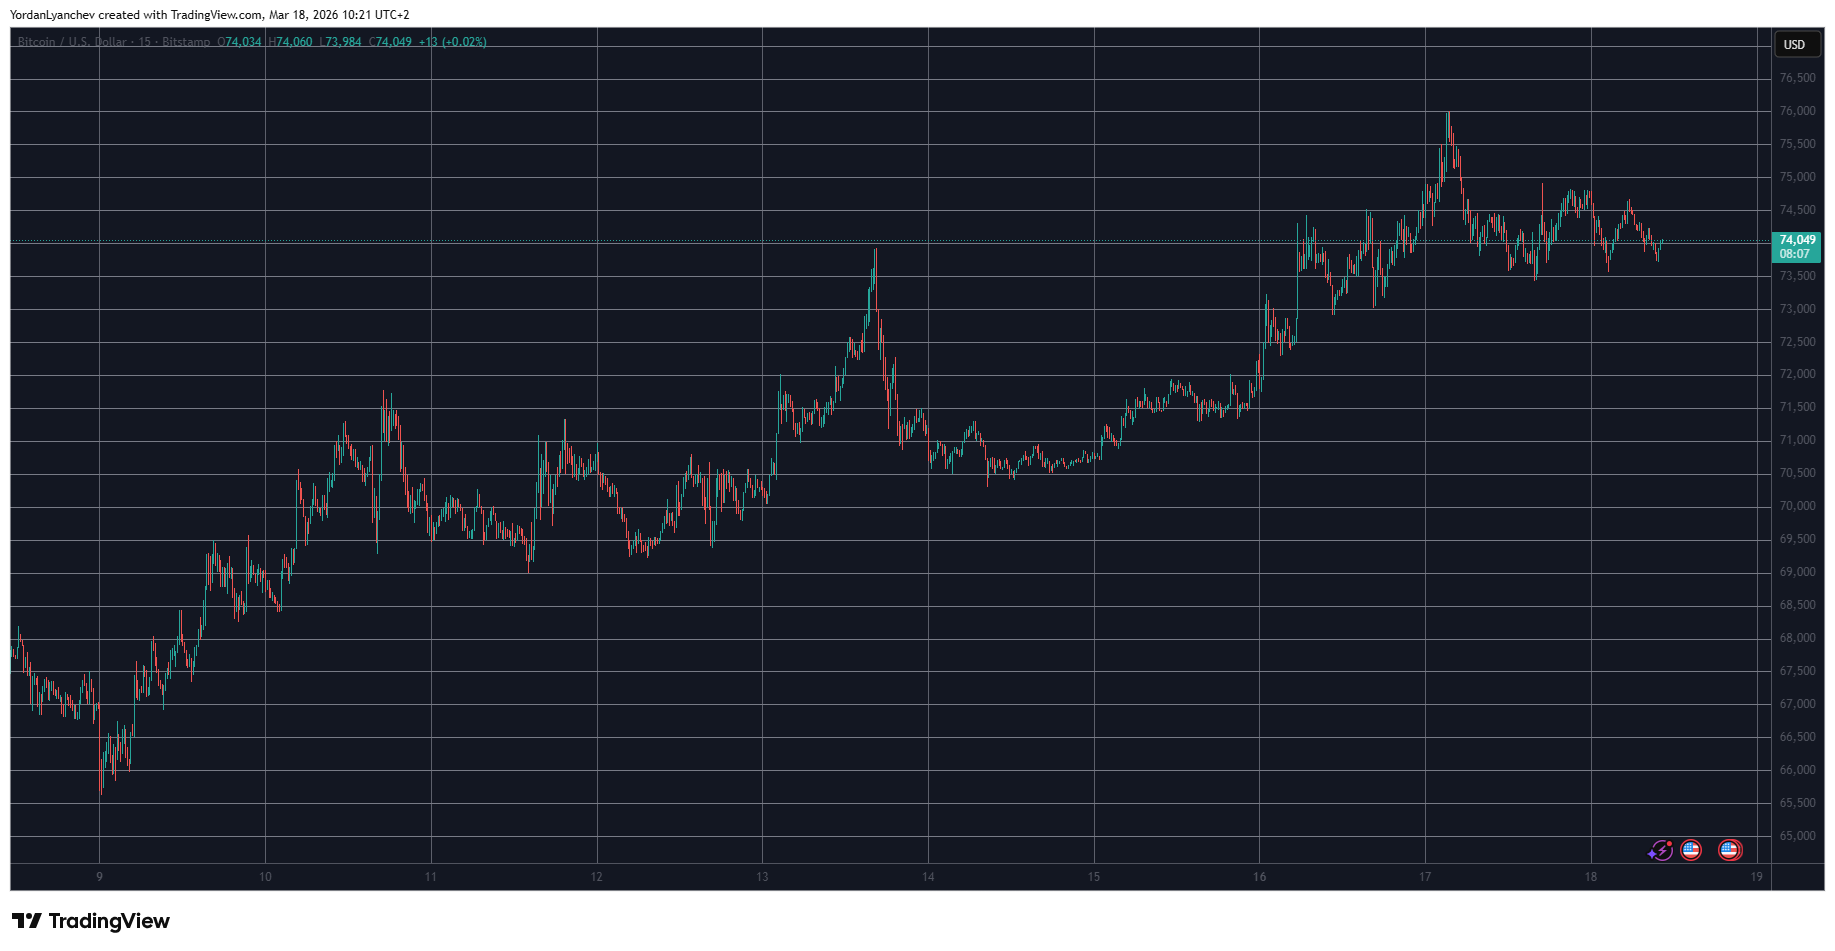
After the recent volatility that drove bitcoin to a six-week peak at $76,000 and the subsequent retracement, the asset has calmed at around $74,000.
Most larger-cap alts are also quite sluggish on a daily scale, but ETH has managed to defend the $2,300 level, while XRP is above $1.50.
BTC Stands Still at $74K
The primary cryptocurrency initiated an impressive leg up last week that culminated on Friday when it touched $74,000 for the second time in the past 10 days. However, the bears were quick to intercept the move and pushed the asset south by almost four grand toward $70,000, especially on Saturday when the US launched another major attack against Iran.
The asset remained above $70,000 during the weekend, and the bulls returned as the new business week began. They helped bitcoin climb toward $74,000 again, where it faced more resistance but ultimately managed to break through on Tuesday morning.
The leg up drove BTC to its highest price level since early February at $76,000. Nevertheless, bitcoin couldn’t keep rising and dipped to $73,500 later that day. The past 18 hours or so have been less eventful, as BTC has remained sideways at around $74,000, where it currently trades as well.
Its market cap stands at $1.480 trillion, while its dominance over the alts on CG is flat at 56.7%.
SIREN Enters Top 100
Ethereum continues to trade above $2,300 despite a minor slip in the past day. XRP is also slightly in the red, but remains north of $1.50. BNB, TRX, ADA, HYPE, and LINK are with minor gains, while SOL, DOGE, and BCH have posted insignificant losses.
XMR, CC, and SKY have dropped the most from the larger-cap alts, while ZEC is up by 3% to $276. SIREN has entered the top 90 alts by market after another double-digit daily surge. The asset has soared by 300% in the past month. M and KAS follow suit with 10% gains.
The total crypto market cap continues to sit above $2.6 trillion on CG.

Binance Free $600 (CryptoPotato Exclusive): Use this link to register a new account and receive $600 exclusive welcome offer on Binance (full details).
LIMITED OFFER for CryptoPotato readers at Bybit: Use this link to register and open a $500 FREE position on any coin!
Disclaimer: Information found on CryptoPotato is those of writers quoted. It does not represent the opinions of CryptoPotato on whether to buy, sell, or hold any investments. You are advised to conduct your own research before making any investment decisions. Use provided information at your own risk. See Disclaimer for more information.

UK lawmakers are raising concerns over the risks tied to crypto donations, which they claim can open the door to foreign influence in political financing.
Summary
- UK parliamentary committee calls for an immediate ban on crypto donations to political parties, citing risks of foreign influence and gaps in oversight.
- Lawmakers warn that tools such as mixers and AI-driven micro-donations could obscure fund origins and bypass existing reporting thresholds.
- Experts remain divided, with some pointing to transparency within regulated systems while others caution that a ban may push activity offshore without resolving core risks.
In its latest report, the Joint Committee on the National Security Strategy urged a moratorium on crypto donations to political parties.
According to the committee, such contributions pose an “unnecessary and unacceptably high risk to the integrity of the political finance system.”
They argued that the government should amend the Representation of the People Bill, which entered committee stage on Wednesday, to prohibit such donations until stronger safeguards are in place. The committee called for an immediate ban on crypto-based political funding.
“Few things are more important than maintaining trust in our politics. The pervasive idea that politicians can be ‘bought’ through foreign money is increasingly corrosive,” Chair of the Joint Committee on the National Security Strategy, Matt Western MP, said.
The report discussed how crypto tools such as mixers, privacy coins, and cross-chain swaps can obscure the origin of funds. Meanwhile, it raised concerns over how AI could enable automated “micro-donations” that allow large contributions to be split into smaller transfers that fall below the reporting threshold under existing electoral law.
Experts consulted by the committee have argued that crypto transactions can remain transparent within regulated systems, while others have warned that a blanket ban could push activity offshore without addressing the underlying risks.
However, the committee report concluded that the “opportunity to evade rules is too high” under current oversight.
Regulatory pressure grows
Last month, some Members of Parliament in the United Kingdom, led by Matt Western, sent a letter to the Secretary of State for Housing, Communities and Local Government, Steve Reed, where it raised similar concerns around foreign interference risks.
The letter urged the Electoral Commission to introduce interim safeguards by only allowing political parties to process crypto donations through FCA-registered Virtual Asset Service Providers and ensuring there is high confidence in identifying the ultimate source of funds.
Among other suggestions, lawmakers proposed prohibiting the use of crypto mixers or tumblers, alongside stricter source-of-wealth checks and faster conversion of donations into pounds sterling.
According to a BBC report, Reform UK was among the first parties at Westminster to accept crypto donations. However, details on the party’s official website state that it does not accept anonymous donations and applies standard compliance checks to verify donor eligibility.


- Hedera (HBAR) gains on ecosystem token listings and growing exchange support.
- Google, IBM, and Deutsche Telekom back Hedera Hashgraph, boosting credibility.
- Breaking above the resistance at $0.1051 could target $0.15 in coming months.
Hedera is showing renewed momentum as its price hovers around $0.10, signaling potential for a near-term breakout.
The cryptocurrency has outperformed Bitcoin (BTC) over the past 24 hours, gaining 1.5% despite low overall market activity.
Much of this movement is being driven by growing visibility and adoption of the Hedera ecosystem on major exchanges.
Kraken’s recent listings of Hedera-native tokens, including lending protocol BONZO and community tokens like $SAUCE, have brought attention to the network.
These listings are more than just symbolic. They represent deeper integration and access for investors to the broader Hedera ecosystem.
Volume trends suggest that this price uptick is sentiment-driven rather than a surge of large capital inflows.
This highlights that investor interest is increasingly tied to the network’s fundamental growth.
Enterprise adoption fuels confidence
One of Hedera’s strongest advantages is its backing by major global enterprises.
Companies like Google, IBM, and Deutsche Telekom are active participants in the Hedera Council, giving the Hedera Hashgraph network both governance oversight and credibility.
Council members operate nodes, vote on protocol updates, and guide the technical direction of Hedera.
This governance model appeals to institutional investors who value transparency and accountability in enterprise blockchain solutions.
The involvement of these companies also signals that Hedera is moving beyond speculative trading into real-world enterprise applications.
Analysts point to projects like supply chain tracking and tokenized services as examples where Hedera is already proving its practical value.
This fundamental adoption could be a critical driver for HBAR price growth in the months ahead.
Technical analysis suggests near-term upside
On the technical side, HBAR is testing important support and resistance zones.
Short-term support has held around $0.0942, while immediate resistance is near $0.1051.
Breaking above this level could open the way for further gains toward $0.1174 and possibly $0.1293 according to CoinLore.
Additional near-term resistance exists at around $0.104, marking Fibonacci retracement targets that traders are watching closely.

A daily close above $0.1014 would signal stronger bullish momentum, while a break below $0.0979 could trigger a pullback toward the 20-day exponential moving average near $0.097.
Analysts suggest that if current support levels hold and momentum continues, HBAR could test the $0.15 level in the medium term.
Upcoming events like the HederaCon 2026, scheduled for early May, could also provide catalysts.
Positive news from the conference could add momentum to HBAR’s price, particularly if it coincides with increased trading activity for ecosystem tokens.
An Australian survey signals growing everyday crypto use despite lingering banking frictions. Independent Reserve’s annual poll of 2,000 Australians, conducted between January 12 and January 30, 2026, shows a meaningful uptick in practical crypto payments, with households increasingly treating digital assets as a usable payment method rather than solely a speculative bet. The report reveals a notable expansion in real-world use cases, even as banks continue to scrutinize and constrain crypto-enabled transactions. These dynamics highlight a country that is embracing crypto for everyday commerce while navigating a still unsettled regulatory and banking landscape.
Key takeaways
- Crypto as a payment method has doubled, rising from 6% to 12% of respondents who used crypto to pay for goods or services in 2026.
- Online shopping emerged as the leading use case, with 21% of respondents paying for online purchases using crypto.
- Paying for services, including freelancing and video game purchases, accounted for 16% of respondents’ crypto usage for goods and services.
- Banking friction remains a major barrier, with about 30% reporting delays or rejections when buying crypto or transferring funds to exchanges, up from 19.3% in 2025.
- Regulatory clarity is widely seen as the key to unlocking smoother bank-crypto interactions and broader adoption.
Tickers mentioned:
Sentiment: Neutral
Market context: The findings come amid ongoing global debates over crypto regulation and the role of banks in digital-asset ecosystems. In Australia, the push for clearer licensing and standards is framed as a path to reduce friction while protecting consumers and institutions.
Why it matters
The Independent Reserve survey underscores a shift in consumer behavior: crypto is crossing from the fringes of finance into everyday checkout lanes. The fact that more Australians view crypto as a practical payment tool rather than a mere investment signals a potential shift in demand for crypto-enabled products and services. Yet the journey is uneven. The same research shows that a substantial portion of the population still encounters roadblocks when attempting to transact with crypto, particularly through traditional banking rails.
The banking environment in Australia has grown more cautious since 2023, when several large banks introduced constraints on crypto-related transactions. This cautious stance manifests as payment delays, caps on transfers to exchanges, and additional identity checks. The report notes that around 30% of investors faced delays or rejections at least once, a notable rise from the prior year. The friction is not merely transactional; it influences consumer confidence and business planning for exchanges, wallets, and merchants who accept crypto as a form of payment.
“For many Australians, the lack of regulation hits home when a payment to a crypto exchange is delayed or blocked, an issue that has continued to rise for another year,” the report authors said. “These interruptions affect both consumers and businesses, showing how cautious banks are with crypto when the rules aren’t clear.”
The authors argue that the core issue is not simply the size of a transaction but the behavior and patterns associated with crypto activity. Banks may be tailoring their risk assessments to perceived patterns rather than merely to transaction value, a shift that underscores the urgent call for regulatory clarity. In their view, clear licensing would enable banks to differentiate legitimate, compliant operators from opaque or high-risk actors, reducing unnecessary friction while protecting consumers.
Beyond the regulatory question, the report also notes a broader sentiment within the sector: the Australian crypto market has seen population-wide growth and regulatory dialogue, but a spectrum of issues remains. Crypto executives who spoke to Cointelegraph last month pointed to ongoing progress—especially in terms of user growth and constructive regulatory reforms—while acknowledging gaps that still hinder seamless integration with traditional financial services. The conversation around licensing, consumer protections, and operator standards continues to shape how the sector can scale without compromising safety or prudence.
To illustrate the complexity of the landscape, the report and related coverage highlight several intertwined factors: a pragmatic upscaling of crypto payments among consumers, persistent friction within banking channels, and a clear demand for a robust, authority-backed framework. The calls for regulatory clarity are not merely aspirational; they are being framed as practical enablers that could foster greater interoperability between exchanges, wallets, and banks. The net takeaway is a cautious optimism: adoption is rising, but a well-defined regulatory regime is viewed as essential to preserving consumer protection while unlocking broader access to crypto-enabled commerce.
Related coverage and prior reporting emphasize that the Australian market has long wrestled with banking barriers, a situation that policymakers and industry participants alike view as solvable through consistent licensing standards and transparent governance. In that sense, the present survey adds empirical weight to the argument that regulated, auditable operations will bolster banks’ confidence in crypto transactions, ultimately supporting a healthier, more reliable payment ecosystem for ordinary Australians.
What to watch next
- Regulatory milestones in Australia: pending licensing standards and clarity around crypto-operator oversight.
- Banking policy evolution: how major lenders adapt their risk models and customer onboarding rules in response to new regulations.
- Industry partnerships: how exchanges, wallets, and merchants align with regulatory expectations to reduce friction for end users.
- Further research: follow-up surveys to track whether banking changes translate into improved accessibility and reduced delays for crypto transactions.
Sources & verification
- Independent Reserve’s 2026 Australian crypto adoption survey of 2,000 adults, conducted January 12–30, focusing on real-world payments and use cases.
- Binance survey noting persistent banking barriers for crypto exchange users in Australia.
- National Australia Bank and Commonwealth Bank regulatory changes in crypto transaction processing in 2023, including delays and identity checks.
- Cointelegraph reporting on Australian crypto adoption, regulation, and SMSF growth in 2026.
- Crypto regulation discussions and legal commentary on regulatory clarity to bridge gaps between exchanges and banks.
Transforming payments in a cautious environment
Banking friction and practical use reshape Australia’s crypto payments
Independent Reserve’s study paints a nuanced portrait of a market on the cusp of broader adoption. The 2026 survey of 2,000 Australians indicates a clear uptick in crypto payment activity, with 12% using crypto to purchase goods or services—double the 2025 level of 6%. The shift reflects a growing belief that crypto can function as a consumer payment option, particularly for everyday online purchases where speed and convenience matter. In a country with robust digital commerce, the ability to settle online orders with crypto appears to be appealing to a subset of shoppers who value control over their transaction experiences and seek alternatives to traditional card rails.
The data show notable segmentation in use cases. Online shopping was the most common scenario among those who used crypto for goods and services, with 21% selecting it as their primary real-world application. Another 16% indicated they used crypto to pay for services, including freelancing and digital entertainment purchases. These figures suggest that the technology is becoming part of the fabric of everyday commerce rather than merely a speculative asset held in portfolios. Yet the path to broader acceptance remains colored by friction at the interface between crypto services and mainstream banking.
Frictions at banks’ doors are repeatedly highlighted as a major hurdle. The survey notes that around 30% of investors encountered delays or outright rejections when attempting to buy cryptocurrency or transfer funds to a crypto exchange at least once, up from 19.3% in 2025. This widening gap underscores a banking sector that remains wary of crypto activity in the absence of clear and consistent regulatory guardrails. In practical terms, delays can mean missed opportunities and increased costs for users who rely on timely access to digital assets for commerce, payroll, or freelance payments.
Regulatory clarity emerges as a central remedy in the conversation. The report argues that clear licensing and robust standards would give banks the confidence to process crypto-related transactions while maintaining appropriate risk checks. As one excerpt from the analysis notes, “Clear licensing and regulation can help fix this. By setting high standards for crypto operators, banks would have more confidence that transactions are legitimate.” The implication is straightforward: a well-defined framework could bridge the gap between exchanges and banks, reducing the friction that currently dampens consumer confidence and business activity in the crypto space.
“For Australia’s blockchain industry, which has faced banking hurdles for over a decade, effective regulation could finally bridge the gap between exchanges and banks, giving investors and businesses more certainty and reliability.”
While the sentiment is cautiously optimistic, the authors stress that progress hinges on policy clarity. In interviews and industry briefings cited by the piece, executives emphasized that the country’s crypto market shows momentum in user growth and regulatory reform, yet still requires a cohesive approach to licensing, consumer protection, and operator accountability. The takeaway is not merely about increasing volumes; it is about cultivating a trusted environment in which ordinary Australians can access and use crypto as a legitimate, compliant means of payment.
As regulators, banks, and industry participants navigate this transitional phase, the survey’s findings offer a evidence-backed pulse check on how far the ecosystem has come—and how far it still has to travel. If the regulatory regime establishes credible guardrails and operational standards, a broader segment of the population could begin to treat crypto as a regular, reliable payment option, with banks offering smoother onboarding and fewer interruptions. The next steps for policymakers will involve balancing consumer protection with innovation, ensuring that the gains in adoption are not undermined by a lack of clarity or insufficient oversight.
Welsh mum shares terrifying first signs of daughter’s meningitis

Small Business Commissioner appoints new board members to tackle late payments

Market Analysis: EUR/USD Rebound Continues as USD/CHF Nears Key Inflection Point

Smart energy pays enters the US market, targeting scalable financial infrastructure

Why Israel is blocking foreign journalists from entering

Bitcoin: We’re Entering The Most Dangerous Phase

The Last Time The Financial System Shifted Like This, A New Class Of Millionaires Was Made

GET READY NOW… THIS IS THE BIGGEST EVENT FOR XRP & FLARE IN 2026?!?

The Biggest Financial Traps Men Fall In Their 50’s (Nobody Warns You)
-
 Crypto World4 days ago
HYPE Token Enters Net Deflation as HyperCore Buybacks Outpace Staking Rewards
-

 Fashion5 days ago
Weekend Open Thread: Addict Lip Glow
-

 Tech3 days ago
Your Legally Registered ‘Motorcycle’ Might Not Count Under Proposed US Law
-
Sports4 days ago
Why Duke and Michigan Are Dead Even Entering Selection Sunday
-

 NewsBeat7 days ago
Residents reaction as Shildon murder probe enters second day
-

 Sports7 days ago
PWHL, Senators discussing plan to keep Charge in Ottawa
-

 Business3 days ago
Search for Savannah Guthrie’s Mother Enters Seventh Week with No Arrests
-

 Business4 days ago
US Airports Launch Donation Drives for Unpaid TSA Workers as Partial Government Shutdown Enters Fifth Week
-
 Tech16 hours ago
Are Split Spacebars the Next Big Gaming Keyboard Trend?
-
Crypto World4 days ago
Coinbase and Bybit in Investment Talks: Could Bybit Finally Enter the US Crypto Market?
-

 NewsBeat7 days ago
I Entered The Manosphere. Nothing Could Prepare Me For What I Found.
-

 Business4 days ago
Country star Brantley Gilbert enters growing non-alcoholic beer market
-

 Business2 days ago
Australian shares drop as Iran war enters third week
-

 Crypto World2 days ago
Crypto Lender BlockFills Enters Chapter 11 with Up to $500M in Liabilities
-

 Sports5 days ago
College Basketball Best Bets: Conference Tournament Semifinal Picks
-

 Crypto World6 days ago
Three Binance Charts May Be Hinting at Bitcoin’s Next Move
-

 Business5 days ago
Trump demands Powell cut rates as Iran conflict raises energy prices
-

 Crypto World5 days ago
Senate Votes to Include CBDC Ban in Bipartisan Housing Bill
-

 Fashion2 days ago
25 Celebrities with Curly Hair That Are Naturally Beautiful
-

 NewsBeat7 days ago
What to know about Erika Kirk after her Air Force board appointment | News US


You must be logged in to post a comment Login