
Crypto World
Ethereum price hovers near key level as $111M whale sparks fresh accumulation

- Ethereum price was poised above the $2,150 level.
- Bulls were showing resilience as a whale re-accumulated $111 million worth of ETH.
- Another move above $2,000 could push prices towards the $2,500 resistance.
A mysterious Ethereum whale has re-emerged after lying dormant for seven months, and just deployed over $111 million in USDT to accumulate ETH.
The whale’s move came as the ETH price hovered above $2,170 amid a broader slip for cryptocurrencies early Thursday.
As Bitcoin revisited $70,000 support, Ethereum bounced off the crucial $2,150 level, with intraday volume up 39% at over $27 billion.
Ethereum whale spends $111 million to re-accumulate ETH
According to Lookonchain, a whale that exited Ethereum seven months ago as prices jumped towards $4,000 is back.
The mysterious holder has spent 111.62 million USDT to buy 50,706 ETH, executing this fresh buy at an average price of $2,201 per token.
On-chain data shows this purchase mirrors a sale exactly one year prior, when the same address offloaded 28,683 ETH at $3,892 each.
That sale netted $111.62 million, and a re-cumulation worth this exact value highlights a classic “buy-low, sell-high” move.
A mysterious whale returned after 7 months of inactivity and spent 111.62M $USDT to buy back 50,706 $ETH at an average price of $2,201.
1 year ago, this whale sold 28,683 $ETH at an average price of $3,892 for 111.62M $USDT.
What a perfect buy-low-sell-high move!… pic.twitter.com/3F56jkgr2y
— Lookonchain (@lookonchain) March 19, 2026
Waking up after seven months also points to the whale’s positioning amid a potential rebound, and mirrors conviction buys by entities such as Bitmine.
The treasury firm, led by Fundstrat’s Tom Lee, recently bought 60,999 ETH worth over $140.3 million and currently holds 4,595,562 ETH worth over $10.5 billion.
ETH’s rebound above $2,000 coincided with the Ethereum Foundation depositing $7.88 million of the altcoin to Steakhouse, a DeFi asset manager with over a billion dollars in AUM.
The EF currently holds over $400 million of ETH.
Can ETH hold gains above $2,150?
Ethereum’s price rose to highs of $2,386 on Monday, riding a bullish flip that pushed Bitcoin to $76,000.
However, the current price hovers near $2,170, testing support amid Bitcoin’s fresh retest of support around $70,000.
As noted, top coins are retreating as risk assets grapple with global economic headwinds. Inflation and escalating Middle East tensions stand out as key short-term headwinds.
Meanwhile, the technical picture shows ETH hovering near a key support level on the daily chart.
The $2,100 mark currently acts as a pivotal support zone and aligns with a rising trendline.
Prices also track the 50-day exponential moving average, currently acting as resistance near $2,215. This is the hurdle bulls need to surmount for potential upside continuation.

If support holds firm above the aforementioned level, the next target remains $2,400-$2,500. Per the daily chart, the 100 EMA sits at the $2,500 mark.
A breakdown from current levels could allow bears to target $2,000 or lower. Cycle lows near $1,800 offer a robust demand reload zone.

XRP is trying to build a short-term recovery, but the broader trend still leans cautious. The recent bounce has improved momentum on both pairs, yet the price is still trading beneath major trend-defining resistance levels. In other words, sellers are no longer fully in control of the very short term, but buyers have not done enough to claim a real trend reversal either.
XRP/USDT Analysis: The Daily Chart
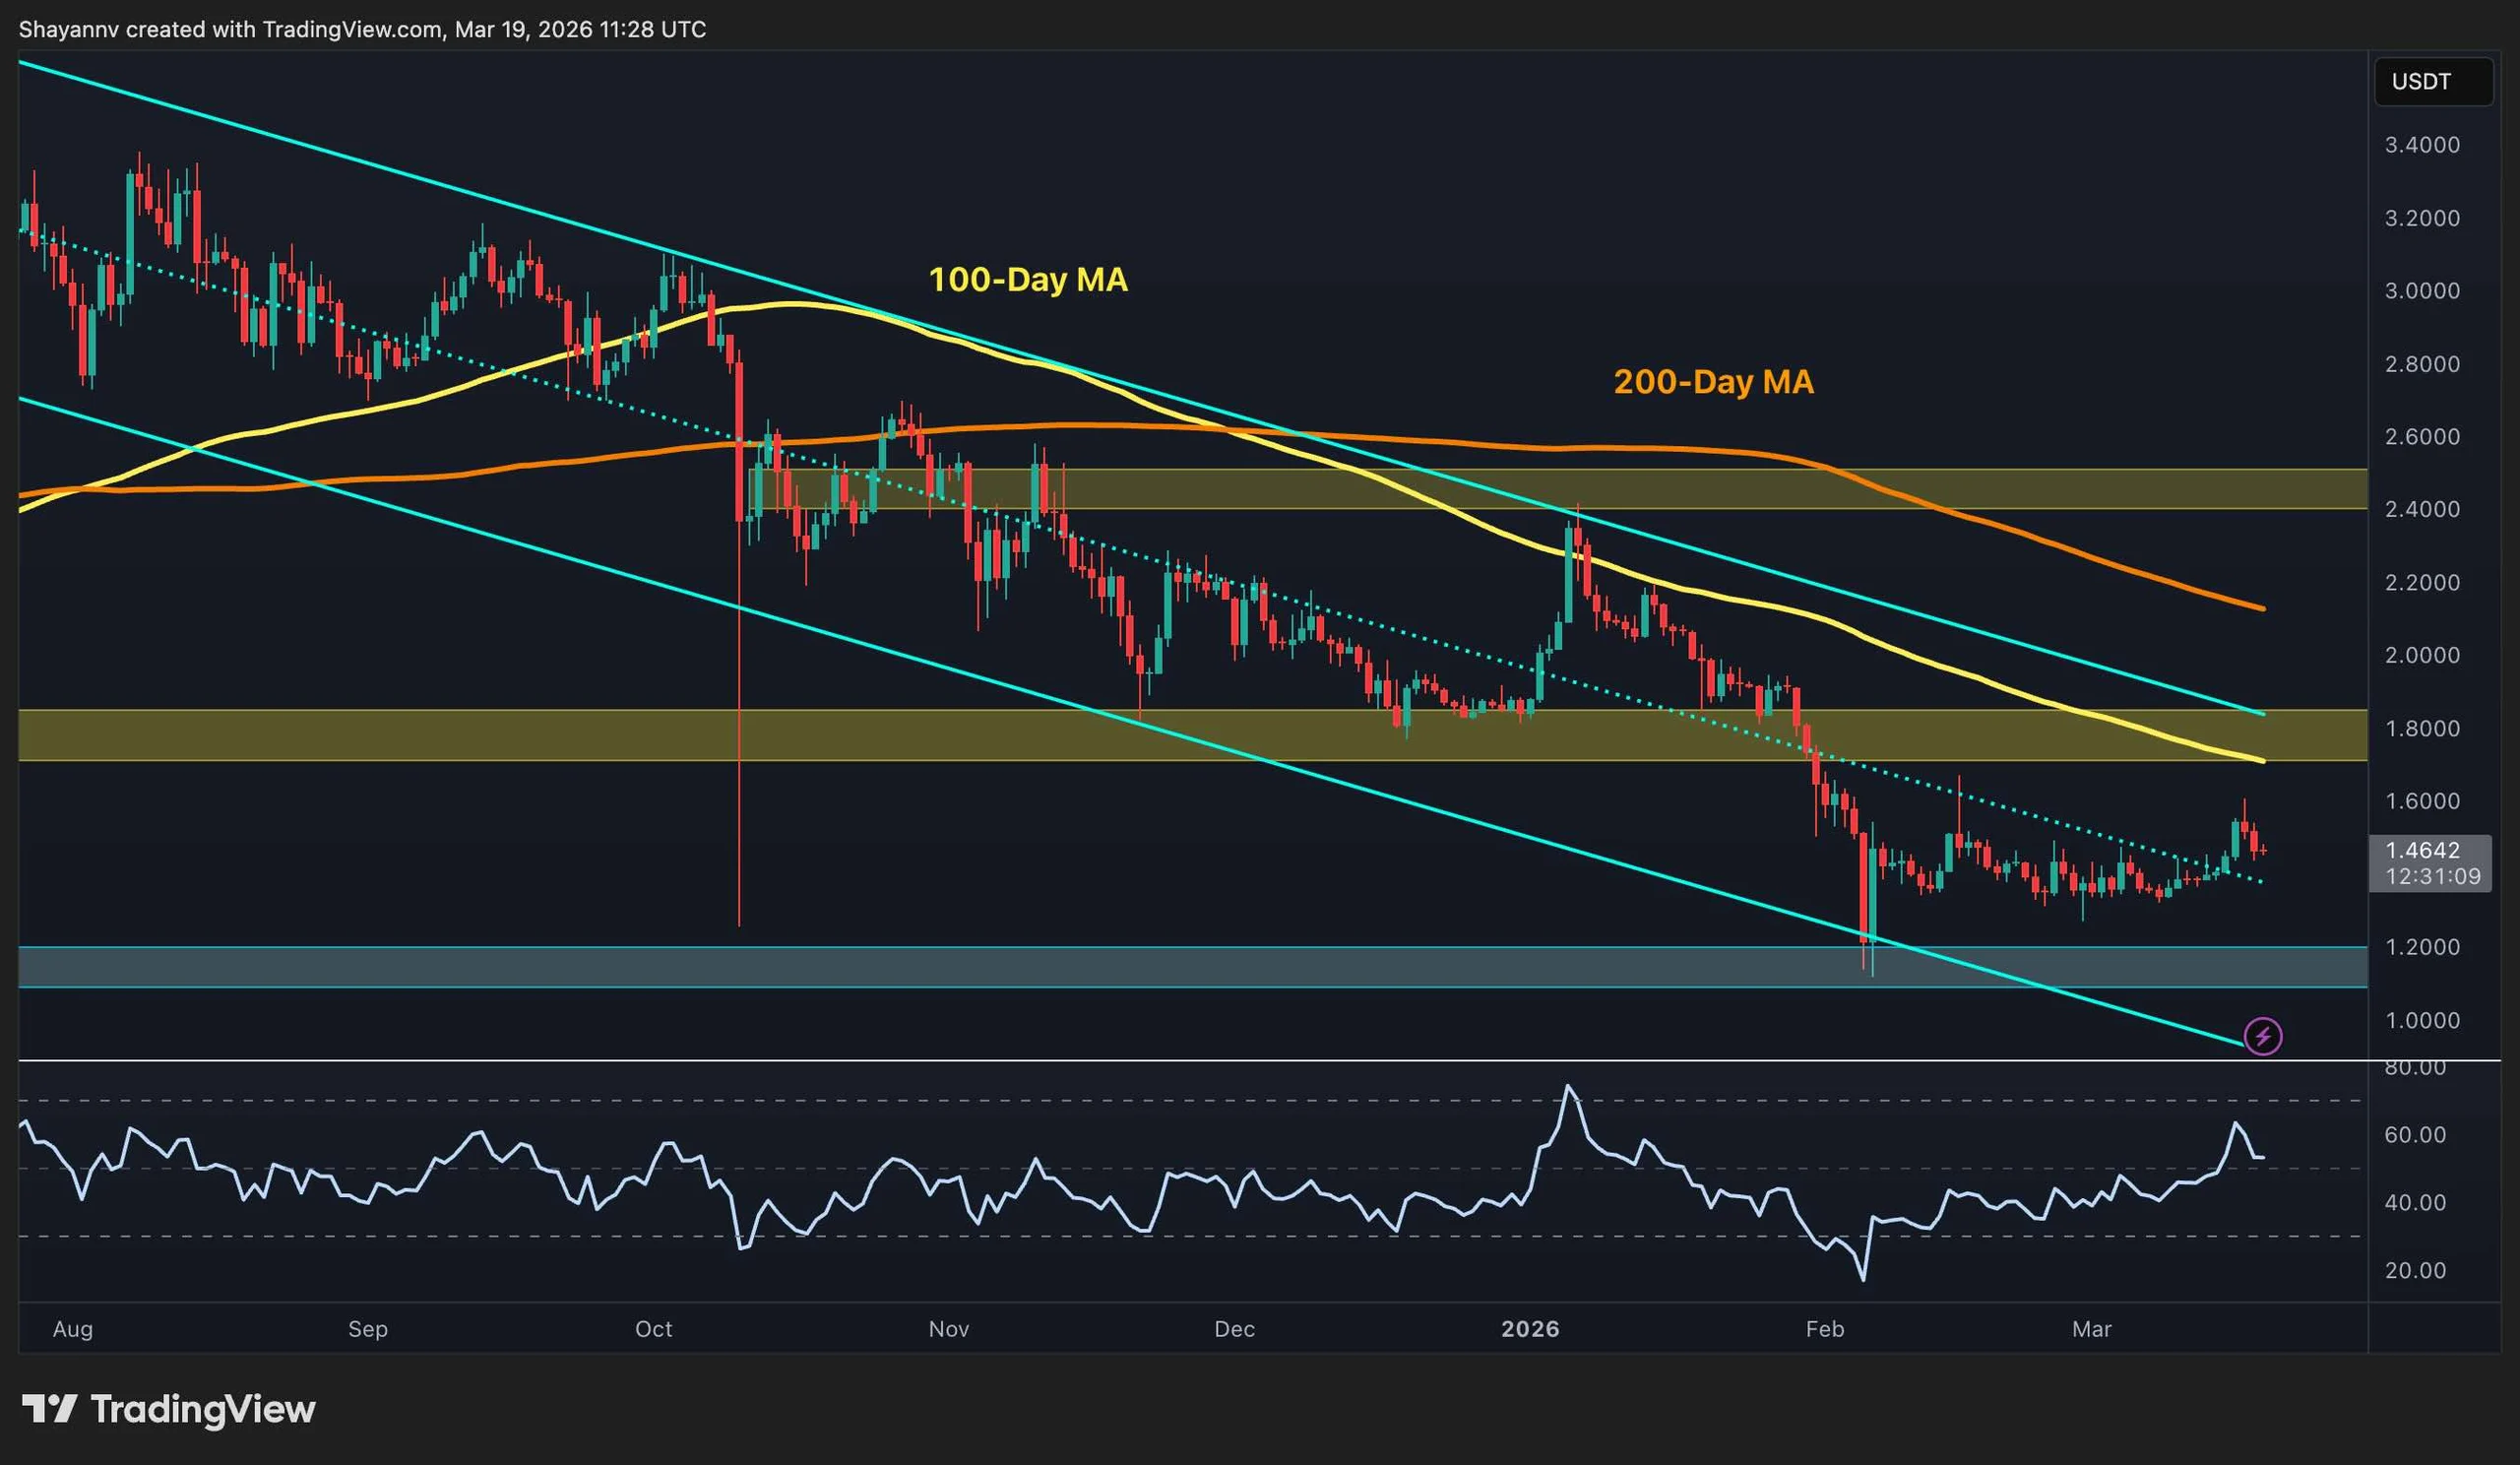
On the XRP/USDT chart, the asset has pushed back toward the mid-$1.40s after defending the $1.10 to $1.20 demand zone earlier this month. That rebound matters because it keeps XRP off the lows and lifts RSI back into a healthier range, but the price is still stuck inside the descending structure and below the first major supply band around $1.75 to $1.80.
That leaves XRP in a tricky spot. The current move looks constructive, but it still resembles a relief rally inside a larger downtrend rather than a clean breakout. If buyers can force a reclaim of the $1.75 to $1.80 region, the door opens toward the much heavier $2.40 to $2.50 resistance area. But the price would also need to climb above both the 100-day and 200-day moving averages to reach this area. Until then, the bounce is not decisive.
XRP/BTC 4-Hour Chart
The XRP/BTC pair is telling a similar story. After repeatedly holding the 2,000 sats area, XRP has started to recover a bit and is now pressing back above that support zone. Momentum has improved, and the pair no longer looks as weak as it did during the recent dip, though it is still trading under both the 100-day and 200-day moving averages.
For the BTC pair, the first task is to turn this rebound into follow-through. A push through the 2,100 to 2,200 sats area would be a good start, and lead to a breakout above both key moving averages. But the real test remains higher at 2,400 to 2,500 sats, where layered resistance and the broader downtrend line converge. If XRP gets rejected before that, the market likely falls back into the same sideways-to-bearish range. However, if it breaks through, the tone shifts from simple stabilization to genuine recovery.

Binance Free $600 (CryptoPotato Exclusive): Use this link to register a new account and receive $600 exclusive welcome offer on Binance (full details).
LIMITED OFFER for CryptoPotato readers at Bybit: Use this link to register and open a $500 FREE position on any coin!
Disclaimer: Information found on CryptoPotato is those of writers quoted. It does not represent the opinions of CryptoPotato on whether to buy, sell, or hold any investments. You are advised to conduct your own research before making any investment decisions. Use provided information at your own risk. See Disclaimer for more information.
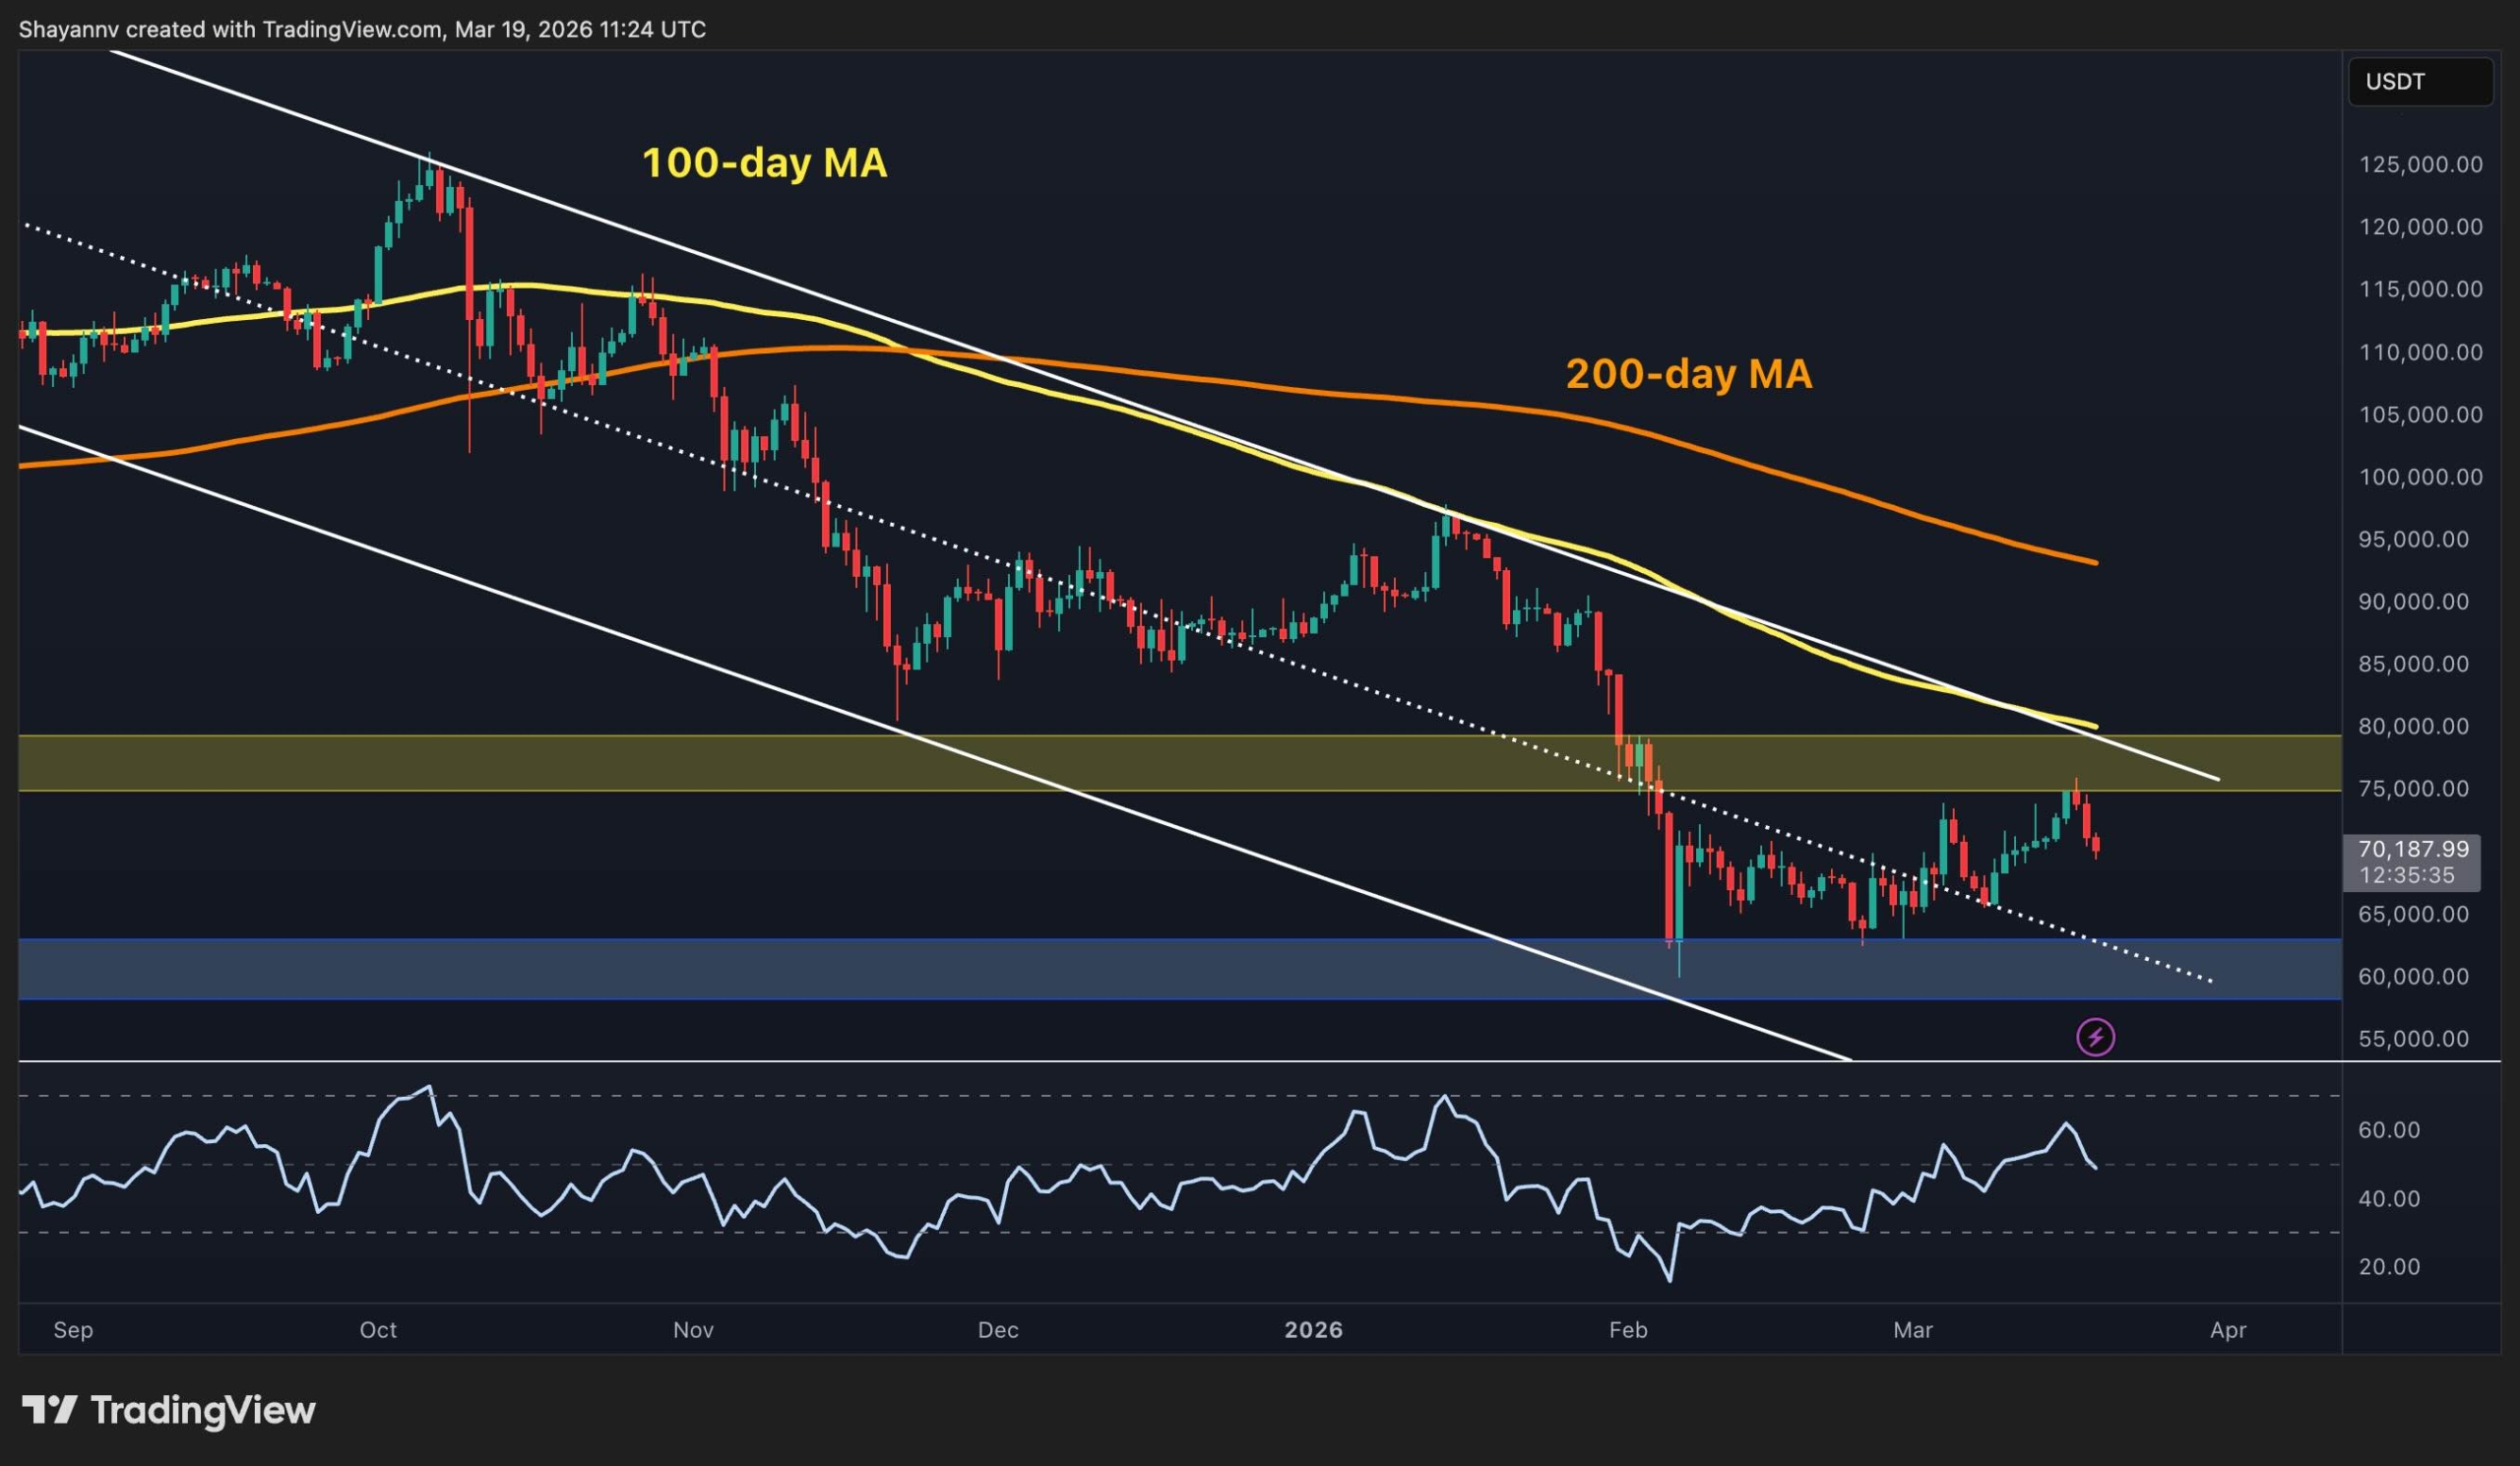
Bitcoin has continued to trade in a precarious zone after months of relentless selling pressure from the October 2025 highs above $125K. The asset is currently hovering below $70,000, attempting to stabilize after a dramatic downtrend, but several technical and on-chain signals suggest the battle between buyers and sellers is far from over.
Bitcoin Price Analysis: The Daily Chart
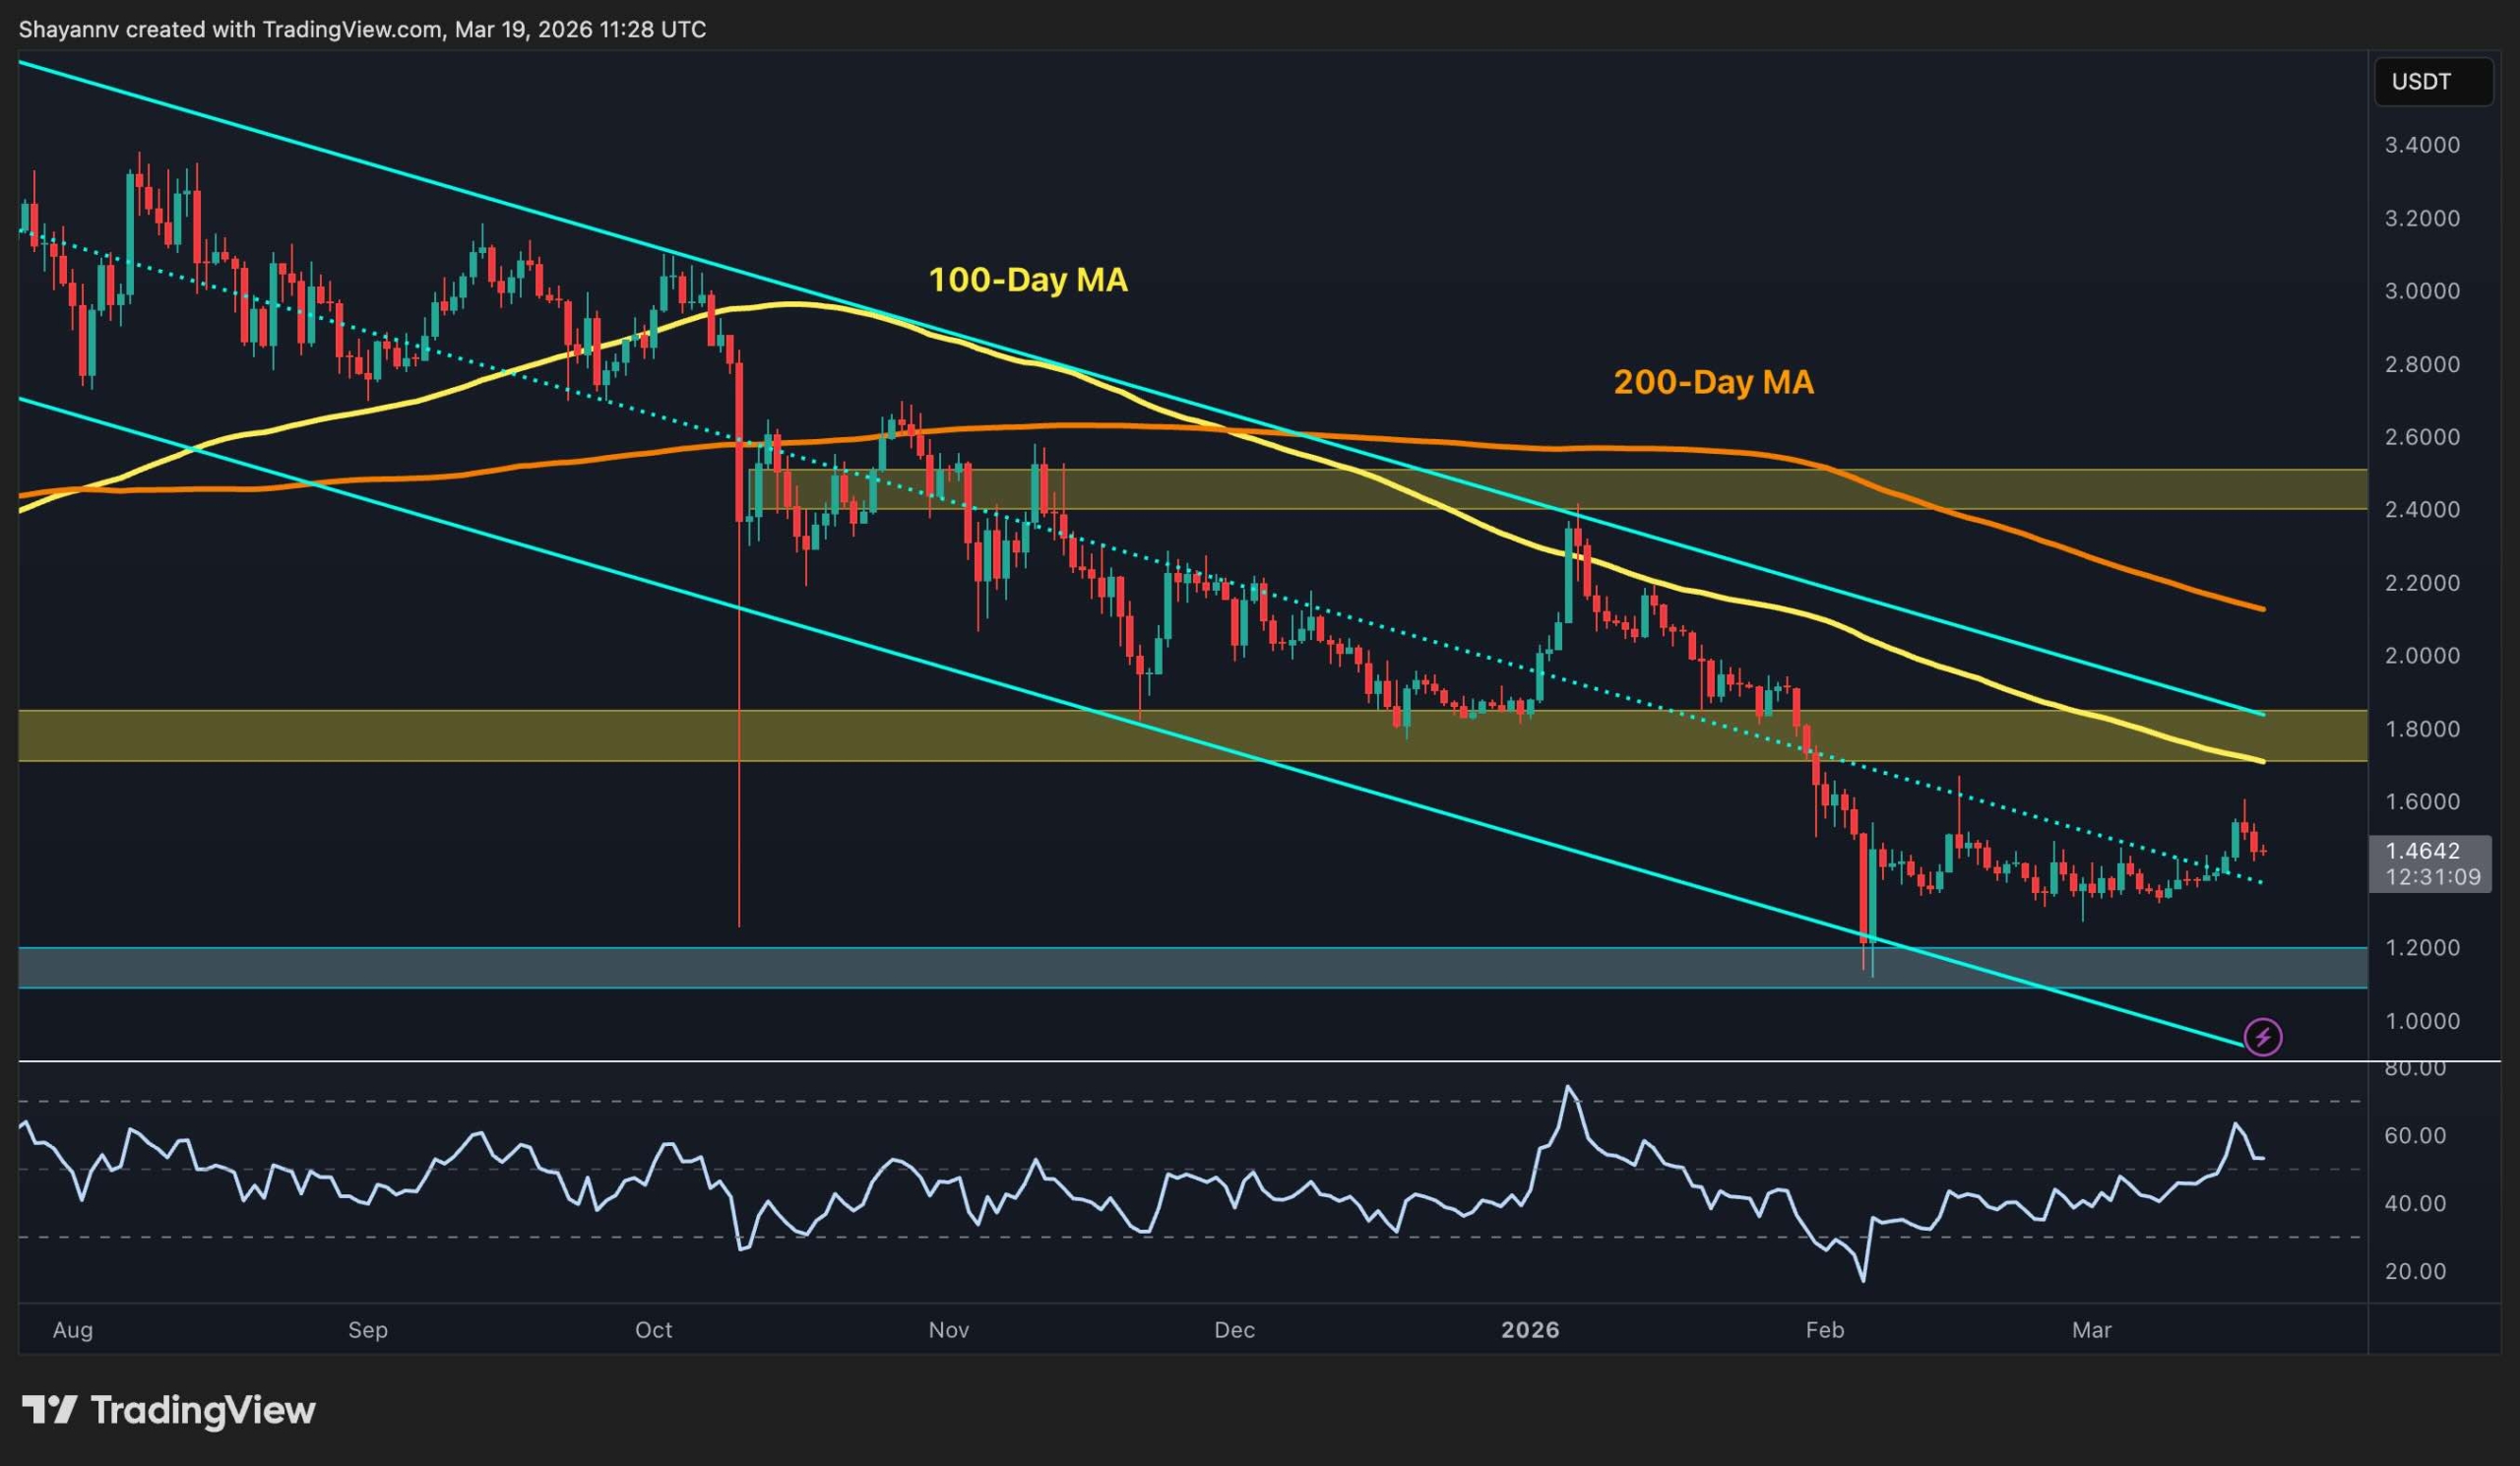
Looking at the daily timeframe, the broader picture remains firmly bearish. BTC has been trapped inside a descending channel since its peak above $125K, printing a consistent series of lower highs and lower lows. The asset is now trading well below both the 100-day and 200-day moving averages, which are acting as dynamic resistance overhead. The 200-day MA sits around $92K, and the 100-day near $80K, both far above the current price.
The daily RSI has recovered from deeply oversold territory, currently oscillating around the midline. A key horizontal support zone between $58K and $62K (highlighted in blue) held during the February capitulation wick, and that area remains the most critical floor to watch. For any meaningful reversal, however, the market would need to reclaim the $75K–$80K zone, which also aligns with the descending channel’s upper boundary.
BTC/USDT 4-Hour Chart
Zooming into the 4-hour chart, a more constructive short-term structure emerges. Since the early February lows near $60K, BTC has been forming an ascending channel pattern with higher lows, supported by a rising trendline. Yet, the price recently tagged the upper resistance near $75K before facing a decisive rejection and pulling back sharply toward $70k.
The area between $74K and $76K has acted as a stubborn supply zone, rejecting multiple attempts to break higher. The 4-hour RSI has also cooled off from overbought conditions and now sits below the 40 level, indicating a change in momentum to relatively bearish. A confirmed break below the rising trendline (~$66K) would likely accelerate selling toward $60K, while a push above $75K could trigger a squeeze toward $80K, and change the market outlook to bullish in the short-term.

On-Chain Analysis
The Exchange Whale Ratio, measuring the proportion of large transactions relative to total exchange inflows, has shown a notable spike in recent weeks. After months of relatively subdued whale activity during the prolonged downtrend, the ratio has jumped sharply from around 0.45 to above 0.6, signaling that large holders are becoming more active on exchanges.
Historically, sharp increases in this metric have coincided with periods of heightened volatility, as whales tend to move coins to exchanges either to sell or to reposition. The current uptick, combined with the price hovering near a technically sensitive zone, suggests that big players are preparing for a decisive move. Whether this translates into distribution (selling) or accumulation at these levels will likely determine BTC’s direction in the coming weeks.

Binance Free $600 (CryptoPotato Exclusive): Use this link to register a new account and receive $600 exclusive welcome offer on Binance (full details).
LIMITED OFFER for CryptoPotato readers at Bybit: Use this link to register and open a $500 FREE position on any coin!
Disclaimer: Information found on CryptoPotato is those of writers quoted. It does not represent the opinions of CryptoPotato on whether to buy, sell, or hold any investments. You are advised to conduct your own research before making any investment decisions. Use provided information at your own risk. See Disclaimer for more information.

- Bittensor price is trapped between key support and strong resistance levels.
- Momentum is cooling, hinting at either consolidation or a drop.
- A break above $300 or below $250 will decide the next major move.
Bittensor (TAO) had shown strong bullish movement for the better part of the year before hitting a snag on March 16.
That rejection triggered a sharp pullback that erased part of the recent gains.
The cryptocurrency has now entered a tense phase, with analysts trying to determine whether the current weakness is a healthy pause or the start of a deeper decline.
Key technical levels shaping the market
Bittensor is currently trading within a well-defined range that has formed over recent price swings.
The upper boundary sits near the $282 to $300 zone, where multiple attempts to break higher have failed.
This area has consistently acted as a ceiling and has attracted strong selling pressure.
A clean move above $282 would shift the market sentiment quickly, signalling renewed strength and possibly opening the path toward $313.
Beyond that, $357 remains a longer-term target if momentum continues to build.

On the downside, the market has shown repeated reactions around the $250 region.
This level aligns closely with a key Fibonacci retracement zone and has become a critical support area.
Below that, analysts note that $168 stands out as another important level where buyers have previously stepped in.
Accumulation or correction?
The current structure presents two clear possibilities. The first is a controlled pullback that leads into accumulation.
In this scenario, the price stabilises between $230 and $250 as larger participants gradually build positions.
This type of behaviour often appears after strong rallies and helps reset momentum.
The second scenario is a deeper correction that extends below current support levels.
This would indicate that selling pressure is stronger than expected and that buyers are not yet ready to defend higher prices.
A breakdown below $233 would strengthen this view and likely accelerate downside movement.
Market indicators currently suggest that momentum is cooling, with the Relative Strength Index (RSI) moving down from overbought levels, signalling a loss of upward pressure.
While this does not confirm a trend reversal on its own, it does suggest caution in the short term.
The bigger picture
Despite the recent weakness, Bittensor continues to stand out due to its underlying purpose.
The network is built around rewarding useful artificial intelligence, creating a system where performance determines value.
This gives the project a foundation that is different from many speculative assets.
Price action often moves ahead of fundamentals, and this appears to be one of those moments.
The market is currently adjusting after a strong run, and this adjustment could take time.
However, whether this turns into accumulation or further decline will depend on how the price behaves around key levels in the coming days.

OP_NET said it is launching a “SlowFi” decentralized finance (DeFi) stack on Bitcoin that uses standard Bitcoin transactions and native BTC fees rather than bridges, wrapped assets or a separate gas token.
According to a Thursday release shared with Cointelegraph, the project is part of a broader push to bring trading and yield-style activity directly onto Bitcoin’s base layer instead of routing it through sidechains, bridges or adjacent networks. OP_NET is betting some users will accept slower and more expensive transactions in exchange for staying fully on Bitcoin.
According to OP_NET co-founder Frederic Fosco, who goes by Danny Plainview, applications run through standard Bitcoin (BTC) transactions using Taproot-based spends, while the platform’s NativeSwap model is designed to support token swaps without wrapped BTC or a separate gas asset. Plainview told Cointelegraph that every transaction on OP_NET is “just a Bitcoin transaction with BTC as the only gas asset.”
The launch lands in the middle of a growing fight inside Bitcoin over whether DeFi-style and data-heavy uses of block space strengthen the network’s fee market or amount to spam that crowds out monetary transactions.
Plainview said a swap would typically cost about $1 to $2 under normal fee conditions and roughly $10 to $20 when blocks are congested, because users pay only standard Bitcoin network fees rather than a separate gas token.

OP_NET describes the model as “SlowFi,” arguing that Bitcoin’s roughly 10-minute block times and congestion-driven exit friction can make liquidity stickier and produce longer-lived DeFi cycles than faster chains.
Related: Fireblocks to integrate Stacks for institutional-grade Bitcoin DeFi
Critics say OP_NET brings Ethereum-style DeFi bloat
Plainview framed layer-1 DeFi as a way to support miner revenue as block subsidies decline, arguing that “miners are bleeding” due to Bitcoin’s halving schedule. “The only thing that keeps miners solvent is a fee market,” he said, insisting that OP_NET does not modify Bitcoin consensus.
Related: Animoca, RootstockLabs partner to bring Bitcoin DeFi to Japanese institutions
That view has drawn criticism from Bitcoin users who argue that pushing DeFi-style activity onto layer 1 dilutes Bitcoin’s monetary focus or clogs block space with nonessential transactions. In recent posts on X, some critics described OP_NET as an attempt to bring Ethereum-style crypto infrastructure onto Bitcoin.
Some maximalists argued that any attempt to expand Bitcoin’s use cases beyond money made its proponents “sh*tcoiners” larping as Bitcoiners.

Plainview pushed back, saying that any fee-paying Taproot transaction should be treated as a legitimate use of block space.
He warned that drawing moral lines around valid transactions handed de facto control of Bitcoin to whoever defines those categories. He said:
“The whole point is that nobody controls it.”
OP_NET keeps DeFi on Bitcoin base layer
OP_NET enters a field already populated by earlier attempts to bring programmability to Bitcoin, including through RSK and Stacks.
RSK operates as a separate Ethereum Virtual Machine-compatible sidechain with its own RBTC gas token and a federated BTC peg, meaning users move value off mainnet and trust a federation to manage the bridge.
Stacks, by contrast, is a Bitcoin-anchored layer-2 with its own STX token and sBTC mechanism, executing smart contracts on a distinct chain that settles periodically to Bitcoin rather than inside L1 transactions.
By keeping execution and fees directly on Bitcoin and avoiding wrapped BTC or new gas assets, Plainview is betting that some users will accept slower, more expensive transactions in exchange for staying entirely on Bitcoin’s base layer.
Magazine: Bitcoin may take 7 years to upgrade to post-quantum — BIP-360 co-author


Evernorth Holdings, an XRP treasury company going public through a SPAC merger, disclosed in a new S-4 filing that it and Pathfinder Digital Assets held about 473.1 million XRP as of the end of last year.
The document also gives investors a clearer look at how that position was built. Evernorth said it used $214.1 million in cash to acquire 84.4 million XRP, which works out to about $2.54 per token for that portion of the treasury. XRP is currently trading at $1.45, or down about 35% from the average purchase price.
The filing also points to a $233.7 million digital asset impairment for 2025 under U.S. accounting rules, reflecting the gap between purchase prices and lower market values at the reporting date.
The filing also shows the treasury did not come only from open-market buying. Ripple, a major player in the XRP ecosystem, contributed 126.8 million XRP to Pathfinder under a contribution agreement.
The sponsor separately contributed 211.3 million XRP through a Series C subscription tied to the broader deal, the filing shows.
Evernorth says it wants to actively manage its treasury rather than simply holding XRP and waiting for the token to rise. The S-4 says the company plans to use Ripple’s RLUSD stablecoin in XRP-based decentralized finance activity, including RLUSD/XRP liquidity pools.
It also expects to lend XRP, provide automated market-maker liquidity, and run options strategies, such as covered calls and cash-secured puts, to further monetize the company’s treasury.
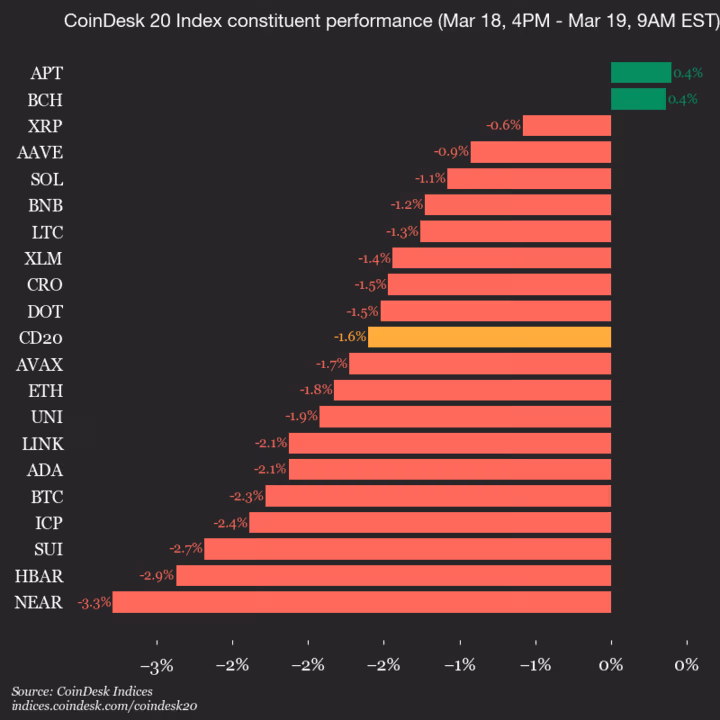
CoinDesk Indices presents its daily market update, highlighting the performance of leaders and laggards in the CoinDesk 20 Index.
The CoinDesk 20 is currently trading at 2029.25, down 1.6% (-33.09) since yesterday’s close.
Two of 20 assets are trading higher.

Leaders: APT (+0.4%) and BCH (+0.4%).
Laggards: NEAR (-3.3%) and HBAR (-2.9%).
The CoinDesk 20 is a broad-based index traded on multiple platforms in several regions globally.

Attendees bring their laptops to install the OpenClaw AI agent during a Baidu event in Beijing, China, on Tuesday, March 17, 2026.
Bloomberg | Bloomberg | Getty Images
BEIJING — So many people in China are rushing to try the OpenClaw artificial intelligence tool that they’re driving up prices for secondhand Mac computers.
That’s according to Jeremy Ji, chief strategy officer and general manager of international business at ATRenew, a used consumer electronics buyer and reseller that works with Apple and retailer JD.com in mainland China.
OpenClaw is an AI agent, a tool that can autonomously conduct personal tasks such as sending emails and shopping online. Usage in China is currently outstripping the U.S., according to American cybersecurity firm SecurityScorecard.
However, the free-to-download software also poses security risks, prompting many users to run OpenClaw on a cloud computing server or laptop separate from their primary device. If allowed direct access to a personal computer, the AI agent could autonomously alter private data such as banking information, or enable hackers to access it more easily.
As people in China jump on the OpenClaw trend, they are turning to preowned computers, Ji said in a phone interview.
He likened the demand surge to the pandemic, when many people bought more personal computing devices since they were working and spending more time at home.
As a result, from March to May this year, Ji said that ATRenew is keeping its prices for Apple products similar to those seen during the peak fall season around new iPhone releases. That contrasts with a typical price drop during the spring.
Ji said prices for a new MacBook are typically 15% higher than the used ones sold through ATRenew.

Apple’s self-developed chips, the latest of which is called the M5, are generally more power-efficient than chips for computers running Windows systems. For early OpenClaw adopters, the popular hardware of choice has been Apple’s Mac Mini.
ATRenew’s Ji said the company is seeing people trade-in their MacBooks with older M1 and M2 chips for computers with the M4 or M5 chip. “We do see the growing demand for laptops, PCs as a whole, but the Mac devices benefit from that trend [to try OpenClaw] above all.”
Consumer interest in more powerful secondhand MacBooks is “still going very strong,” Ji said, noting that ATRenew has had to increase its price for buying back devices in order to increase the supply of secondhand Macs available for purchase. He predicted the trend could continue “throughout the whole year.”
Subscribe now
An Austrian developer, Peter Steinberger, launched OpenClaw in November. But the latest wave of interest in China only picked up early this month as Tencent and other Chinese tech companies used OpenClaw as a way to attract more users.
ATRenew’s Ji declined to share the exact volume of MacBooks handled since late February, but noted the average number of devices the company processed last year was around 100,000 a day. He expects the share of MacBook and other laptop or personal computing devices could grow to 20% of the business, up from 15% right now.
Jensen Huang, CEO of U.S. chip giant Nvidia, told CNBC’s Jim Cramer on Tuesday that OpenClaw is “definitely the next ChatGPT.”
“It is now the largest, most popular, the most successful open-sourced project in the history of humanity,” Huang said.
Overall demand for AI computing power has also driven up prices for memory chips, a key component of smartphones and laptops.
The chip price surge has specifically encouraged more consumers in China to buy used Apple smartphones, rather than flagship Android-based devices, Ji said.

Bitcoin slid as geopolitical shocks in the Middle East reverberated through energy markets, pushing crude prices higher and prompting a fresh round of profit-taking among long-term holders. Large, one-time transfers—conducted by an ancient BTC whale and one of the earliest adopters—added to the sense that risk appetite was evaporating as investors weighed the intersection of conflict, energy supply concerns, and crypto exposure.
Blockchain trackers reported notable moves from historical bitcoin wallets on the same day that Brent crude surged past $119 per barrel before retreating, and European energy prices spiked in response to attacks on gas infrastructure in the region. The broader macro backdrop has crypto traders watching for where the next large liquidity shift might come from, as the balance between risk-off sentiment and perceived safe-haven demand remains unsettled.
Key takeaways
- A long-destined bitcoin whale moved 1,000 BTC to Binance on Wednesday, after purchasing 5,000 BTC around 13 years ago. The address reportedly still holds roughly 1,500 BTC, worth about $106 million at current prices.
- One of the earliest BTC holders, Owen Gunden, transferred 650 BTC to Kraken on the same day, marking his first substantial sale in five months. He previously liquidated a large portion of his stack, around 11,000 BTC, in a prior period.
- Bitcoin traded around $70,400, down about 5% over 24 hours, as traders weighed the conflict-driven energy shock against ongoing macro uncertainty. Gold also softened, dipping roughly 4% to around $4,686 per ounce.
- Geopolitical events linked to Iran, Israel, and Qatar pushed energy benchmarks higher, with Brent briefly tipping above $119 before retreating, and WTI testing the $100 level in intraday moves.
- Analysts characterized the move as part of a broader risk-off shift rather than a straightforward move into safe-haven assets, underscoring ongoing questions about how crypto assets react to geopolitical stress.
Whale activity amid macro turmoil
Data from Arkham indicates that the so-called “bc1ql” whale—one of the most famous address labels in the bitcoin ecosystem—sent 1,000 BTC to Binance on Wednesday. The address originally acquired 5,000 BTC about 13 years ago and remains a significant UTXO holder, with roughly 1,500 BTC still in reserve, according to Onchain Lens analysis of the wallet’s balance history.
Meanwhile, Owen Gunden—one of the earliest BTC holders—moved 650 BTC to Kraken on the same day. Lookonchain reported this as his first sizeable sale in five months, part of a pattern of selective liquidity operations during a period of heightened macro noise.
Aurelie Barthere, principal research analyst at crypto intelligence platform Nansen, noted that the BTC sell-off appeared to be connected to a broader risk-off phase driven by the energy shock in the Middle East. “BTC began to sell off yesterday around noon CET, following the escalation of the war between Iran and Israel and the attack on gas infrastructure in Qatar,” she told Cointelegraph, adding: “If we fail to hold the $70K–$71K level, we could return to the previous range of approximately $60K–$71K.”
Energy markets in flux deepen crypto uncertainty
The same day, energy markets reacted decisively to the regional tensions. Brent crude surged past $119 per barrel before easing to about $114.77, while West Texas Intermediate moved in a similar range, briefly touching $100 before trading near $96.50, according to Trading Economics. The price action underscores how geopolitical catalysts can quickly translate into risk-off dynamics across traditional and digital asset markets.
New developments in the region further intensified market attention. Reports emerged that Israel conducted strikes on Iran’s South Pars gas field—a component of the world’s most prolific natural gas reserve, which Iran shares with Qatar. The South Pars field has long been a focal point for debates about regional energy security and its potential spillover effects on energy prices globally. In the wake of the strikes, energy headlines dominated market screens, with Western wholesale gas prices in Europe and the UK spiking as European buyers weighed potential supply disruptions.
These energy-market ripples helped propel a narrative that the crypto market’s recent risk-off move is not a pure flight-to-safety among crypto bulls, but rather a broader shift away from risk assets in a period of heightened geopolitical risk. As Barthere put it, the interplay between energy prices, macro risk, and crypto exposure is still ambiguous—investors will be watching whether bitcoin can defend the key psychological level around $70,000.
Bitcoin’s price path amid a mixed risk environment
Bitcoin’s price action reflected a cautious stance among traders. As of early European trading hours, BTC traded around $70,440, down roughly 5% on the day, according to CoinMarketCap data. The pullback mirrors a concurrent decline in gold, which shed about 4.2% to roughly $4,686 per ounce, signaling that even traditional haven assets were not immune to the risk-off tone at the time.
Analysts stressed that this is not a straightforward “buy-the-dip” moment for all investors. Rather, it is a climate in which macro shocks, energy-market volatility, and geopolitical risk converge to shape liquidity flows. The key question for participants is whether BTC can hold the $70,000–$71,000 zone, which may prove pivotal in determining whether the market stabilizes in the near term or if the next leg down tests lower ranges.
“If we fail to hold the $70K–$71K level, we could return to the previous range of approximately $60K–$71K,” Barthere summarized, highlighting how quickly support levels can become contested when macro drivers shift abruptly. In this environment, traders and investors may need to consider both on-chain signals, such as whale balance movements, and off-chain indicators, including energy pricing and geopolitical risk proxies, to calibrate risk and potential hedges.
What remains uncertain is how durable the current risk-off mood will prove, and whether fresh catalysts—such as diplomatic developments or escalations in regional tensions—will reorient flows toward or away from digital assets. Market participants will be watching for any signs that key support holds and whether larger players—whether legacy funds or new entrants—adjust their allocations in response to evolving macro conditions.
As the situation in the Middle East continues to unfold, investors should keep a close eye on on-chain movements from long-held wallets, shifts in correlated markets like oil and gold, and the evolving narrative around bitcoin’s role in a high-uncertainty environment. The coming days could reveal whether this is a temporary liquidity squeeze or the first stage of a longer adjustment in crypto demand amid a broader macro pivot.
Readers should watch forthcoming updates on energy-market developments and on-chain whale activity, which together may illuminate the next leg for bitcoin’s price and its evolving relationship with traditional financial markets.
Pi Network price managed to brush off the bearish sentiment prevailing in the broader crypto market amid a major mainnet upgrade that introduced smart contract functionality to the Pi ecosystem.
Summary
- Pi Network price held steady near $0.177 after a brief drop, defying a broader crypto market downturn despite remaining nearly 40% below its post-listing high.
- The resilience followed the rollout of mainnet version 20, which introduced smart contract capabilities and boosted expectations for ecosystem growth.
- Technical indicators remain bearish, with PI trading below key moving averages and facing downside risk if support near $0.176 fails.
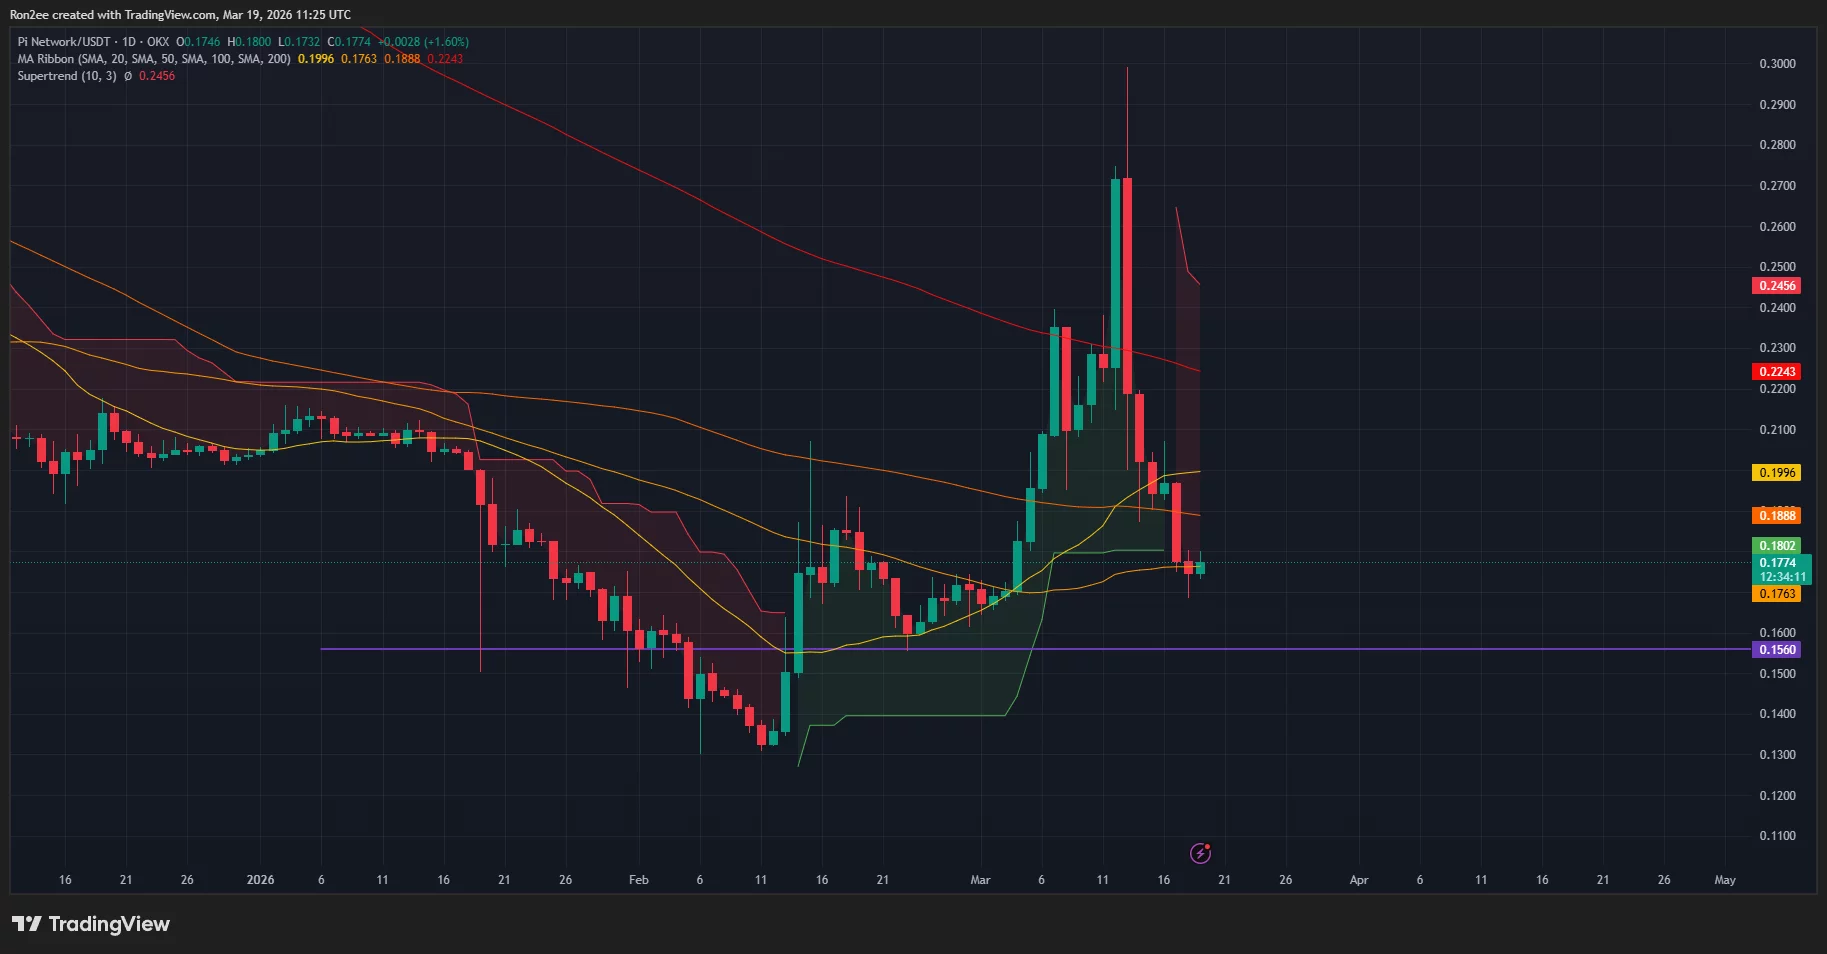
According to data from crypto.news, Pi Network (PI) price initially fell 5% to an intraday low of $0.171 on March 19 before recouping from its losses and edging higher to $0.177 at press time. The token, however, remains nearly 40% lower than its high, which it attained following its highly anticipated listing on crypto exchange Kraken.
Pi Network’s resilience amidst the sectorwide downturn can be attributed to hype surrounding its mainnet upgrade to version 20. The latest upgrade brings the ability to support smart contracts to the network. This means developers can now build decentralized applications and other services on the platform, which could ultimately drive development and adoption of the Pi ecosystem.
In a March 19 X post, Pi developers also revealed that version 21 of the protocol would soon be rolled out. They instructed node operators to ensure their systems are up to date and to wait for more detailed instructions.
Major announcements such as these tend to boost investor demand for the token and thus add upward pressure on its price.
The latest upgrade follows a series of protocol updates that began on Feb. 20, when the team rolled out its first upgrade of the year to version 19.6.
Despite the bullish development for the Pi ecosystem, charts seem to present a bearish outlook for the Pi token for the upcoming sessions.
On the daily chart, Pi Network price has fallen below the 50, 100, and 200-day moving averages, a sign that the long-term trend has shifted decisively in favor of sellers. The only exception was the 20-day SMA at $0.176, which stands as the final line of support preventing a deeper slide into bearish territory.

As PI price fell, it flipped the Supertrend indicator red, which means the market bias has turned negative and volatility is now working against the bulls. Furthermore, the MACD lines have pointed downwards, which indicates that bears have seized dominance over the price action, and momentum is currently favoring further downside.
For now, $0.176 is the most important support level to keep an eye on. A drop below this could instill confidence in bears to push prices down to the Feb 23 low of $0.156. However, a break above the $0.200 psychological resistance would invalidate the bearish forecast and potentially signal a trend reversal.
Disclosure: This article does not represent investment advice. The content and materials featured on this page are for educational purposes only.


Some South Korean lawmakers are pushing back against the ruling party’s plan to levy a 22% tax on cryptocurrencies.
Summary
- People Power Party has introduced a bill to amend the Income Tax Act and scrap the planned crypto gains tax ahead of its 2027 rollout.
- The proposed 22% tax on crypto profits above 2.5 million won has already been delayed three times amid continued political disagreement and industry pushback.
A bill introduced by the right-wing People Power Party on Thursday seeks to amend the Income Tax Act and fully abolish the planned taxation on cryptocurrency gains, according to local media reports.
The tax plan was originally introduced in 2020 by the Ministry of Economy and Finance and proposed a 20% national income tax and 2% local tax on crypto profits that exceed 2.5 million Korean won. Since its inception, the proposal has been at the center of a heated political debate and has been postponed three times.
It was originally set to be implemented in 2022, but the effective date is now slated for Jan. 1, 2027.
However, the opposition contends that the proposal raises concerns around fairness and equity in taxation across investment classes, especially as South Korea has previously repealed income tax on other financial investments such as stocks. Critics of the framework argue that taxing only crypto investors is unfair.
Several major exchanges in the country have also argued that the tax structure would hamper trading activity and reduce market participation.
Interestingly, the bill cites the U.S. Securities and Exchange Commission’s recent guidance on how most cryptocurrencies may not qualify as securities. The People Power Party’s bill highlights this position to argue that crypto should not be treated the same as traditional securities.
Kim Han-gyu, the senior deputy floor leader for policy of the Ruling Democratic Party, has reportedly said that the left-wing party will discuss the bill, but noted that such a proposal has not been seriously considered so far.
As one of the largest crypto markets in the world, South Korea has been reevaluating its approach to taxation on digital assets.
Last year, the country’s Ministry of Small and Medium Enterprises and Startups proposed an amendment to the framework which would allow crypto firms to register as venture companies and become eligible for tax cuts and other benefits.

Waka Flocka On Becoming A Financial Historian #rapper #investments #mindset #mentality

Two child benefit cap axed as millions of families to gain
Plans for new train stations in South Wales take step forward

Smart energy pays enters the US market, targeting scalable financial infrastructure

Why Israel is blocking foreign journalists from entering

Bitcoin: We’re Entering The Most Dangerous Phase
Waka Flocka On Becoming A Financial Historian #rapper #investments #mindset #mentality

Financial Seatbelts: 3 Risks Every Youngster Must Cover!#financialfreedom #helthinsurence #shorts

Governor Newsom, First Partner make announcements on financial literacy, wealth access for women
-
 Crypto World5 days ago
HYPE Token Enters Net Deflation as HyperCore Buybacks Outpace Staking Rewards
-

 Tech4 days ago
Your Legally Registered ‘Motorcycle’ Might Not Count Under Proposed US Law
-

 Fashion6 days ago
Weekend Open Thread: Addict Lip Glow
-
 Tech2 days ago
Are Split Spacebars the Next Big Gaming Keyboard Trend?
-
Sports5 days ago
Why Duke and Michigan Are Dead Even Entering Selection Sunday
-

 Business4 days ago
Search for Savannah Guthrie’s Mother Enters Seventh Week with No Arrests
-

 Business5 days ago
US Airports Launch Donation Drives for Unpaid TSA Workers as Partial Government Shutdown Enters Fifth Week
-
Crypto World5 days ago
Coinbase and Bybit in Investment Talks: Could Bybit Finally Enter the US Crypto Market?
-

 Business3 days ago
Australian shares drop as Iran war enters third week
-

 Business5 days ago
Country star Brantley Gilbert enters growing non-alcoholic beer market
-

 Crypto World3 days ago
Crypto Lender BlockFills Enters Chapter 11 with Up to $500M in Liabilities
-

 Sports6 days ago
College Basketball Best Bets: Conference Tournament Semifinal Picks
-

 Politics1 day ago
The House | The new register to protect children from their abusers shows Parliament at its best
-

 Business7 days ago
Trump demands Powell cut rates as Iran conflict raises energy prices
-

 Fashion3 days ago
25 Celebrities with Curly Hair That Are Naturally Beautiful
-

 News Videos21 hours ago
RBA board divided on rate cut, unusually buoyant share market | Finance Report | ABC NEWS
-

 Crypto World7 days ago
Senate Votes to Include CBDC Ban in Bipartisan Housing Bill
-

 NewsBeat7 days ago
Deane Road crash near Bolton colleges and university
-

 Crypto World21 hours ago
Canada’s FINTRAC revokes registrations of 23 crypto MSBs in AML crackdown
-

 News Videos7 days ago
Tom Lee: The 100x Opportunity EVEN Bigger Than Bitcoin (New Ethereum Prediction 2026)


You must be logged in to post a comment Login