
Crypto World
Further Gains Ahead or Brutal Collapse?
Certain market observers predicted that the asset’s price could soon surpass $50, while others cautioned traders to be extremely careful.
The lesser-known altcoin RIVER has defied the ongoing bear market, with its price spiking by double digits over the past seven days.
Some analysts expect the rally to continue, while others view the project as a red flag and warn investors to stay away.
How Much More?
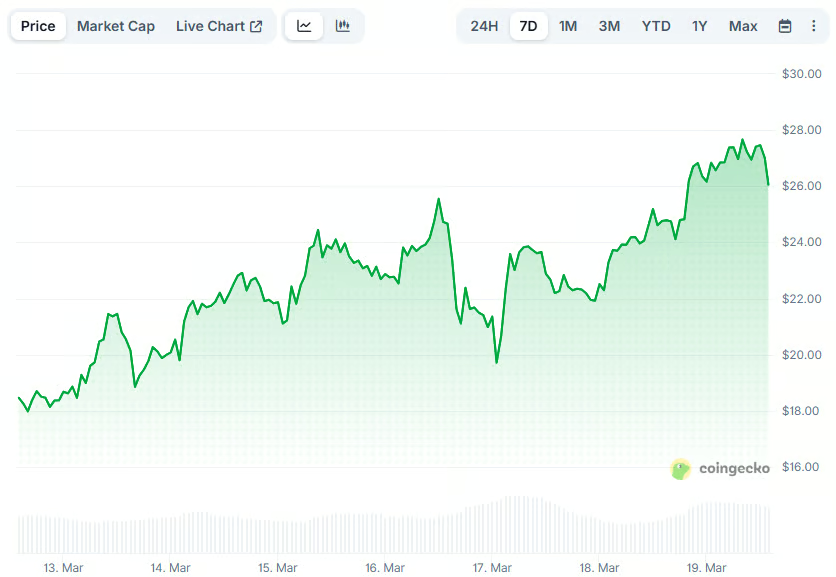
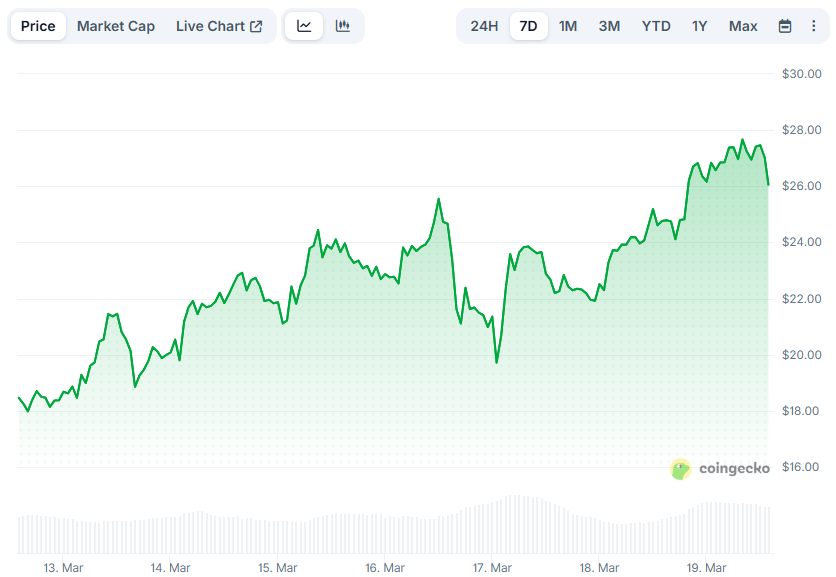
RIVER is among the best-performing top 100 cryptocurrencies in the last week, jumping by 50% and currently trading at around $26 (per CoinGecko’s data). At one point, its market capitalization neared $550 million, whereas as of this writing, it stands at around $500 million.
One factor that may have contributed to the rally is the recent partnership between DIA and River, which is intended to provide the former’s omnichain stablecoin system with accurate, trustworthy price data.
The coin’s pump caught the eye of many analysts, including the popular Ali Martinez. Earlier this month, he claimed that RIVER “is looking bullish” since it has formed an “inverse head-and-shoulders” pattern and predicted that a pump above $20 could open the door to $57. Later on, Martinez confirmed the breakout, setting anything in the $45-$57 range as potential targets.
Kamran Asghar chipped in when RIVER was testing the “critical resistance zone” around $23. Back then, he argued that turning this into support could result in a “clear run” toward $40 and beyond.
Major Red Flags?
Despite the impressive price increase, others remain quite skeptical toward the cryptocurrency. X user Julius Elum noted that RIVER “looks good in the chart,” but claimed that it might be a “manipulatable token” by whales. In his view, entry between $10 and $15 is safe, hopping on the bandwagon at around $20 is risky, while the current levels represent FOMO.
You may also like:
“It might be a planned liquidity grab. I don’t chase setups if it has formed this obvious conviction. Because most times, it’s a trap. I’d rather take entry when the conviction is still in the doubt stage. But if I must risk it, I will do so with caution,” the analyst concluded.
X user Nehal also sounded the alarm. They believe that there are major red flags surrounding RIVER, suggesting that investors should be aware of more than just a pump-and-dump volatility. The analyst went even further, stating that many traders have reported losing money because the price has moved against their positions. In a subsequent post on March 18, Nehal forecasted that RIVER could plummet below $5 soon.
Highlighting the risks related to the token is nothing new. Earlier this year, X user Erik said 94% of RIVER’s total supply is held by only five wallets, whereas Honey argued that the project resembles previous rug pull schemes.
Binance Free $600 (CryptoPotato Exclusive): Use this link to register a new account and receive $600 exclusive welcome offer on Binance (full details).
LIMITED OFFER for CryptoPotato readers at Bybit: Use this link to register and open a $500 FREE position on any coin!

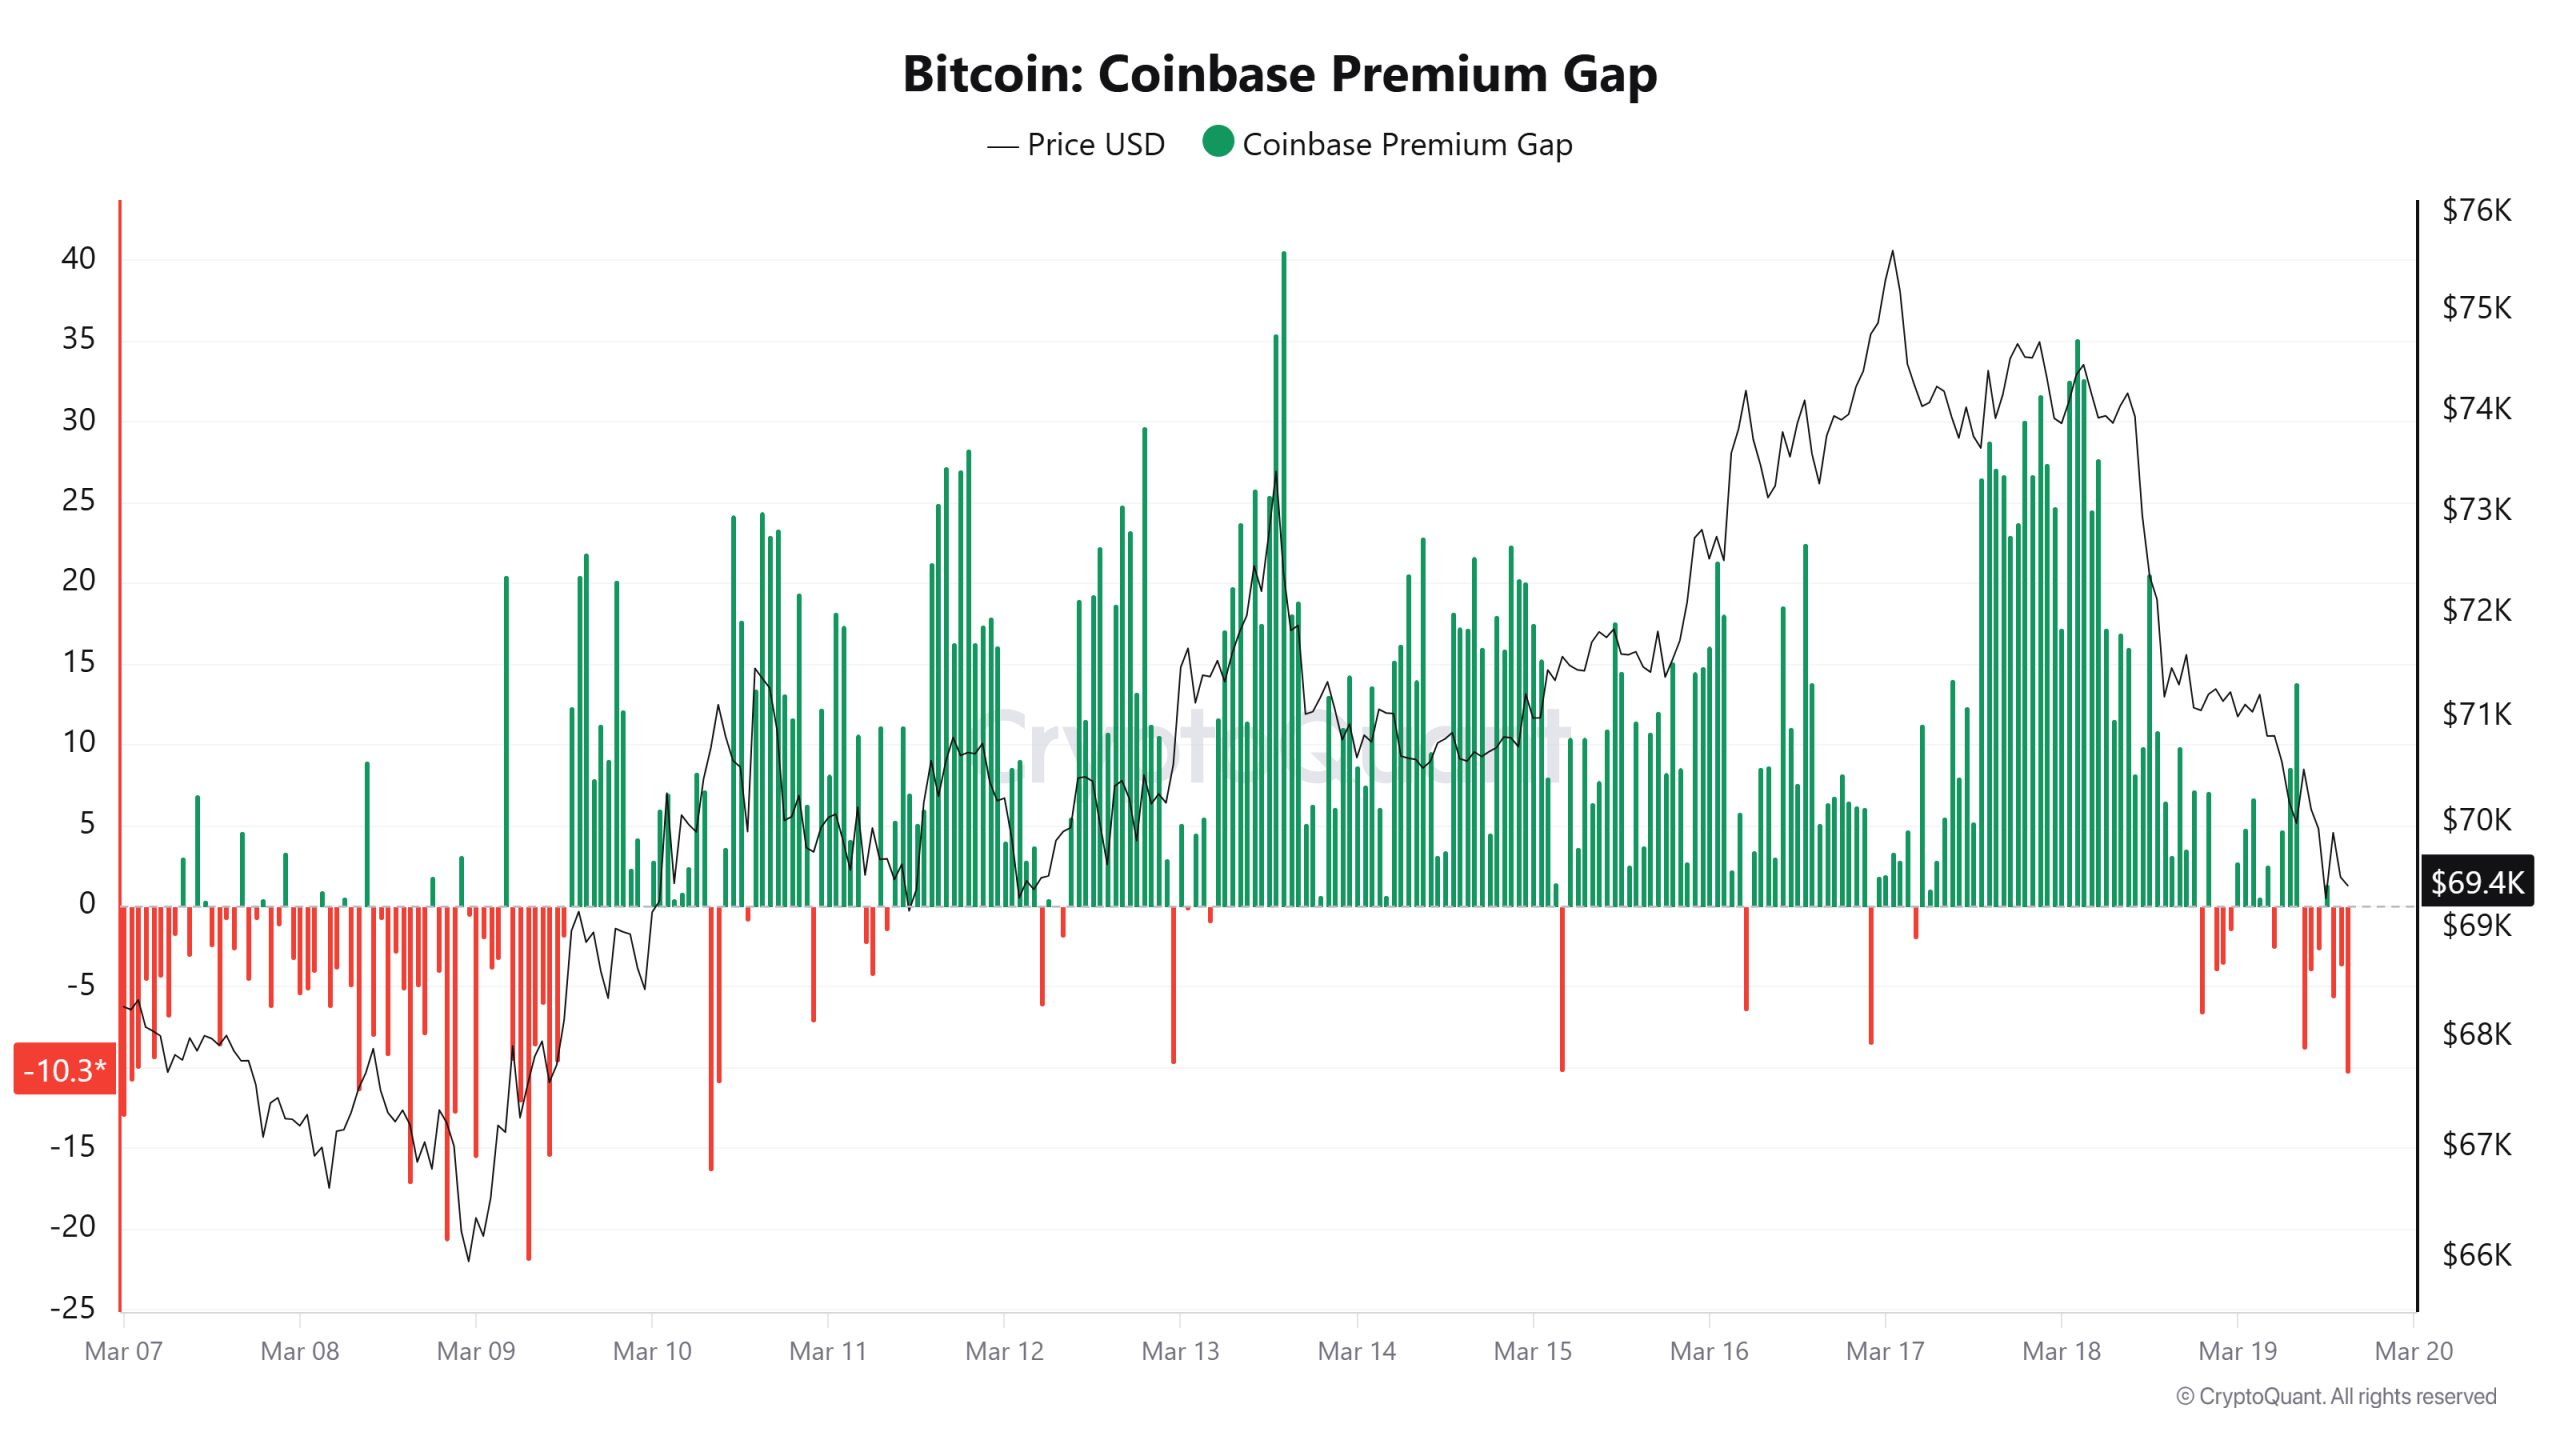
Bitcoin (BTC) dropped below $69,000 on Thursday, pulling the price back into its six-week range just days after tapping range highs above $76,000.
The pullback coincides with an increase in selling from Bitcoin futures markets and stalling demand from US-based investors, but the chance for a rebound rally remains. A recurring chart setup indicates that BTC can return to its bullish pathway if the necessary conditions are met.
Bitcoin futures set the trend as spot demand fades
The latest pullback aligns with a visible shift in derivatives’ dominance over spot activity. The Coinbase premium gap turned negative after a period of steady demand, pointing to weak follow-through from US-based investors.

Meanwhile, crypto analyst IT Tech noted a clear imbalance between the spot and perpetual futures. The cumulative volume delta (CVD), which tracks the net buying versus selling across markets, fell by $40.64 million for the spot CVD, while the perpetual CVD dropped by $506.75 million, highlighting stronger selling pressure from leveraged traders.

However, the funding rates have flipped positive to 0.05%, meaning long positions are now paying shorts, indicating a long bias across the derivatives markets.
The order book data shows bid-side support holding near the $70,000 region, with both spot and perpetual markets leaning toward buyers.
Related: OP_NET launches Bitcoin DeFi push without bridges or wrapped BTC
Fractal setup mirrors early-March bounce
On the lower timeframes, Bitcoin is forming a similar fractal setup to the March 6 through March 8 correction when the price declined and swept internal liquidity levels before reversing higher on the charts.
The current move follows the same sequence, with successive lower lows developing into a potential exhaustion phase for the price.

In the prior breakout, the reversal aligned with a bullish divergence on the relative strength index (RSI) indicator, where RSI held equal lows as the price printed a lower low. The pattern signaled a fading momentum from sellers. A comparable divergence is now developing, reinforcing the bullish fractal structure.
The liquidation data also supports this setup. Significant long-side liquidations have been observed on both occasions, reducing the open interest and flushing out overleveraged positions.

A swift reclaim of $70,000 aligns with the previous fractal recovery path, opening a move toward $76,000. The $72,000 level acts as the key pivot, where a reclaim may trigger a short squeeze if short positions get trapped.
However, the setup remains time-sensitive. A breakdown below $68,300 shifts focus toward the $65,000 and $62,000 levels, where higher time frame liquidity sits for BTC.
Trading Stables founder Ryan Scott flagged $73,000 as a key base level, noting that failure to stabilize above this level signals a weak buyer response, raising the chance for a drop to range lows near $62,000.
Related: Bitcoin prediction markets see 70% chance BTC price crashes to $55K in 2026
This article does not contain investment advice or recommendations. Every investment and trading move involves risk, and readers should conduct their own research when making a decision. While we strive to provide accurate and timely information, Cointelegraph does not guarantee the accuracy, completeness, or reliability of any information in this article. This article may contain forward-looking statements that are subject to risks and uncertainties. Cointelegraph will not be liable for any loss or damage arising from your reliance on this information.
Crypto World
Trillions in options set to expire Friday as quadruple witching tests crypto resilience
On Friday, global markets will face a trillions-of-dollars quarterly derivatives event known as quadruple witching.
The event occurs on the third Friday of March, June, September, and December, when four major types of derivatives expire simultaneously. These include stock index futures, stock index options, single-stock options, and single-stock futures.
Because traders must close, roll or settle these positions simultaneously, trading activity often surges, and price swings can intensify in the traditional markets.
Exact figures for the March 2026 expiry have not yet been published, though recent events illustrate the scale. In March 2025, roughly $4.7 trillion worth of equity and index derivatives expired during the quarterly event. According to TradeStation, that session saw the highest S&P 500 trading volume of the entire year, while other witching days also recorded above-average activity.
Large expiries like this often force institutions to rebalance portfolios, unwind hedges and adjust risk exposure within a short window. Much of the activity tends to concentrate in the final hour of trading, when liquidity spikes and volatility can increase rapidly.
This quarter’s expiration arrives during an already volatile trading environment. Conflict in the Middle East recently pushed oil prices to $120 per barrel, while gold slipped below $4,600 and bitcoin fell below $69,000. Meanwhile, the VIX volatility index jumped above 35 last week, the highest level in a year, signalling heightened stress in financial markets.
Although quadruple witching originates in traditional finance, it can spill into crypto markets. Bitcoin increasingly trades alongside broader risk assets, meaning sharp moves in equities often ripple into digital markets.
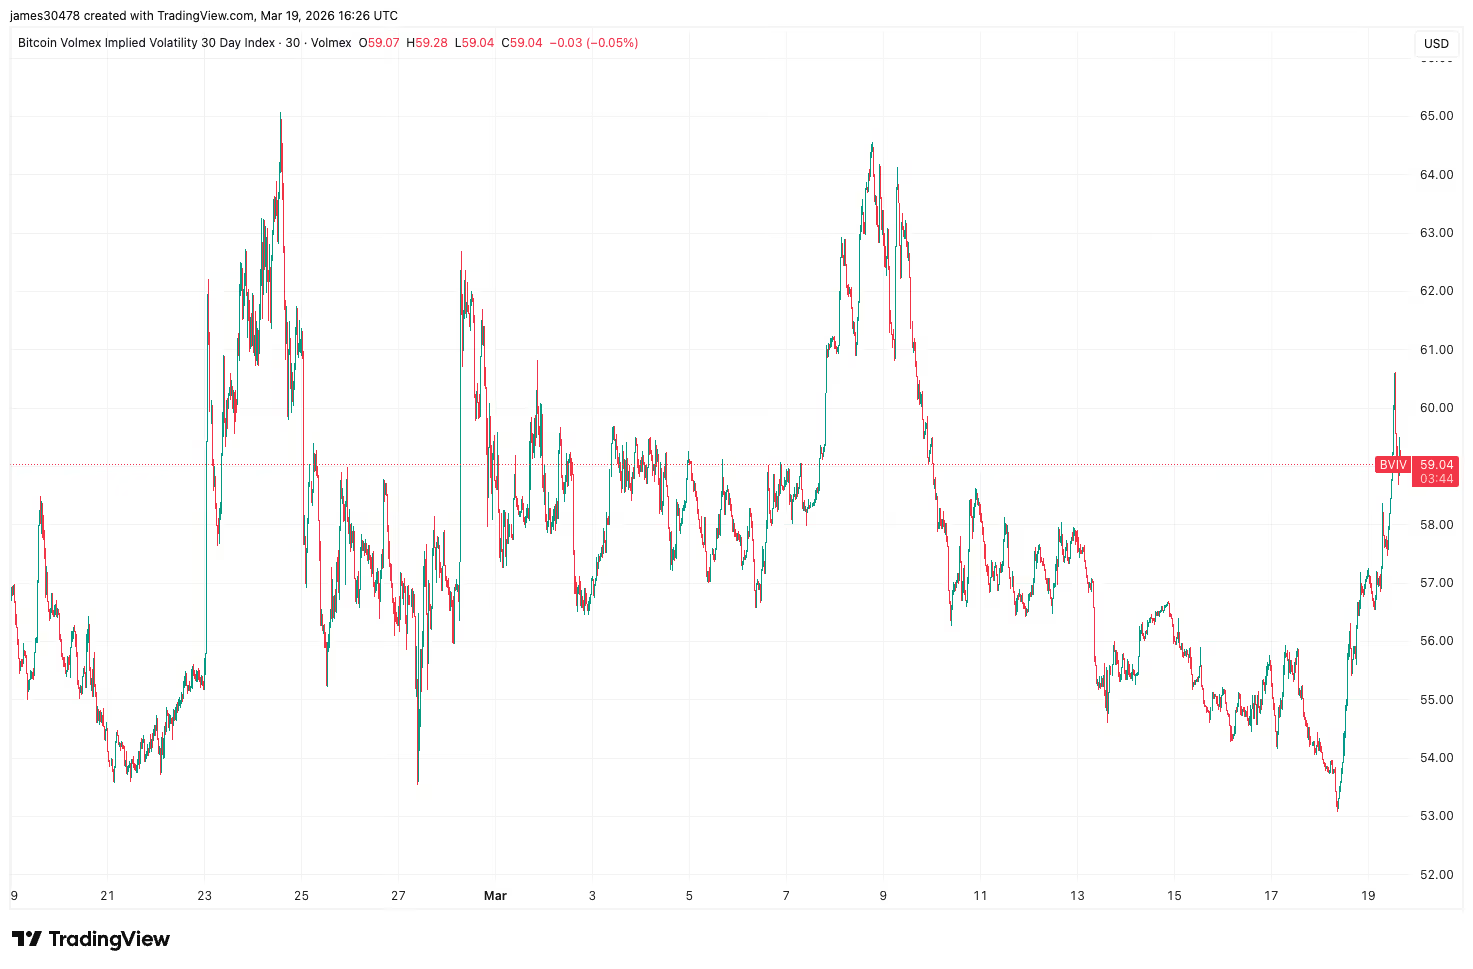
Cole Kennelly, CEO of Volmex Finance, said tomorrow’s event could drive volatility in crypto markets, noting that “quadruple witching could trigger a spike in cross-asset volatility as large derivatives positions expire. This may already be showing up in crypto, with the Bitcoin Volmex Implied Volatility (BVIV) Index trending higher into the event.”

How did bitcoin perform on quadruple witching days in 2025
On March 21, bitcoin was slightly down on the day, but the more significant move came later, with prices bottoming a few weeks afterward around $76,000 following the market reaction to President Trump’s “Liberation Day” tariffs.
On June 20, bitcoin declined 1.5% and continued drifting lower, reaching a local bottom near $98,000 just two days later. On September 19, Bitcoin fell over 1% on the day, but the real move unfolded in the following week, with a sharp drop from $177,000 to $108,000. Then, on December 19, bitcoin finished roughly 3% higher at around $85,000, though it remained in a broader drawdown from the October highs.
While price action on the day itself tends to be relatively muted, a consistent pattern of weakness emerges in the days to weeks that follow.
Even if the quad-witching doesn’t add to bitcoin’s volatility on Friday, crypto traders have another event, specifically for digital assets, to keep in mind.
Crypto derivatives face their own major quarterly expiry the week after, on March 27, with $13.5 billion set to expire on Deribit, where positioning points to elevated demand for volatility strategies rather than strong directional bets.


Exchange giant Coinbase’s (COIN) asset management arm is bringing its bitcoin yield fund onchain, creating a tokenized share class of the fund with $3.5 trillion fund administrator Apex Group.
The Coinbase Bitcoin Yield Fund, managed by Coinbase Asset Management (CBAM), will be available to investors on the Base network, Coinbase’s blockchain built on Ethereum. Apex remains the transfer agent, keeping records aligned with the fund’s net asset value.
The launch comes as global asset managers are looking at tokenization as the next frontier in how capital markets evolve, making bonds, equites and funds tradable on blockchain rails. Firms including BlackRock (BLK), Fidelity and Franklin Templeton have introduced tokenized funds in recent years, aiming to speed up settlement times, cut costs and open new distribution channels.
Brett Tejpaul, head of Coinbase Institutional, said the company’s asset management business already has a lot of institutional capital allocated, with many investors holding core positions in bitcoin and ether.
“Incrementally, we’re getting new capital coming to the space that wants the ability to get compounded returns, so their bet isn’t just on the appreciation of bitcoin, but while they’re waiting for it to rise in price, they’re earning yield along the way,” he told CoinDesk.
“The bitcoin yield fund allows them to do that by virtue of doing things like selling call options or participating in lending arrangements.”
Tokenized assets are potentially a multiple-trillion-dollar market, with estimates ranging from McKinsey’s projection of $2 trillion by 2030 to BCG and Ripple’s $18.9 trillion target by 2033.
Apex, a significant player in the fund service business supporting $3.5 trillion in assets, is increasingly leaning into tokenization as well. It acquired Tokeny last year, a specialist that facilitated the tokenization of over $32 billion in assets. Apex also said it plans to tokenize $100 billion in funds using the T-REX Ledger by June 2027 to manage ownership and compliance across multiple blockchains.
In the case of the Coinbase Bitcoin Yield Fund, the tokenized share class uses the ERC-3643 token standard, which encodes investor checks directly into the token. Only approved investors can hold or transfer the asset, with identity tied to each wallet through a dedicated onboarding process.
The setup replaces manual compliance checks with automated rules. If a wallet is not cleared, the transaction fails. That could reduce friction in how institutional investors access and move fund positions.
The fund is available to non-U.S. investors, but CBAM said it plans to create a tokenized share class of the fund’s U.S.-version as well.

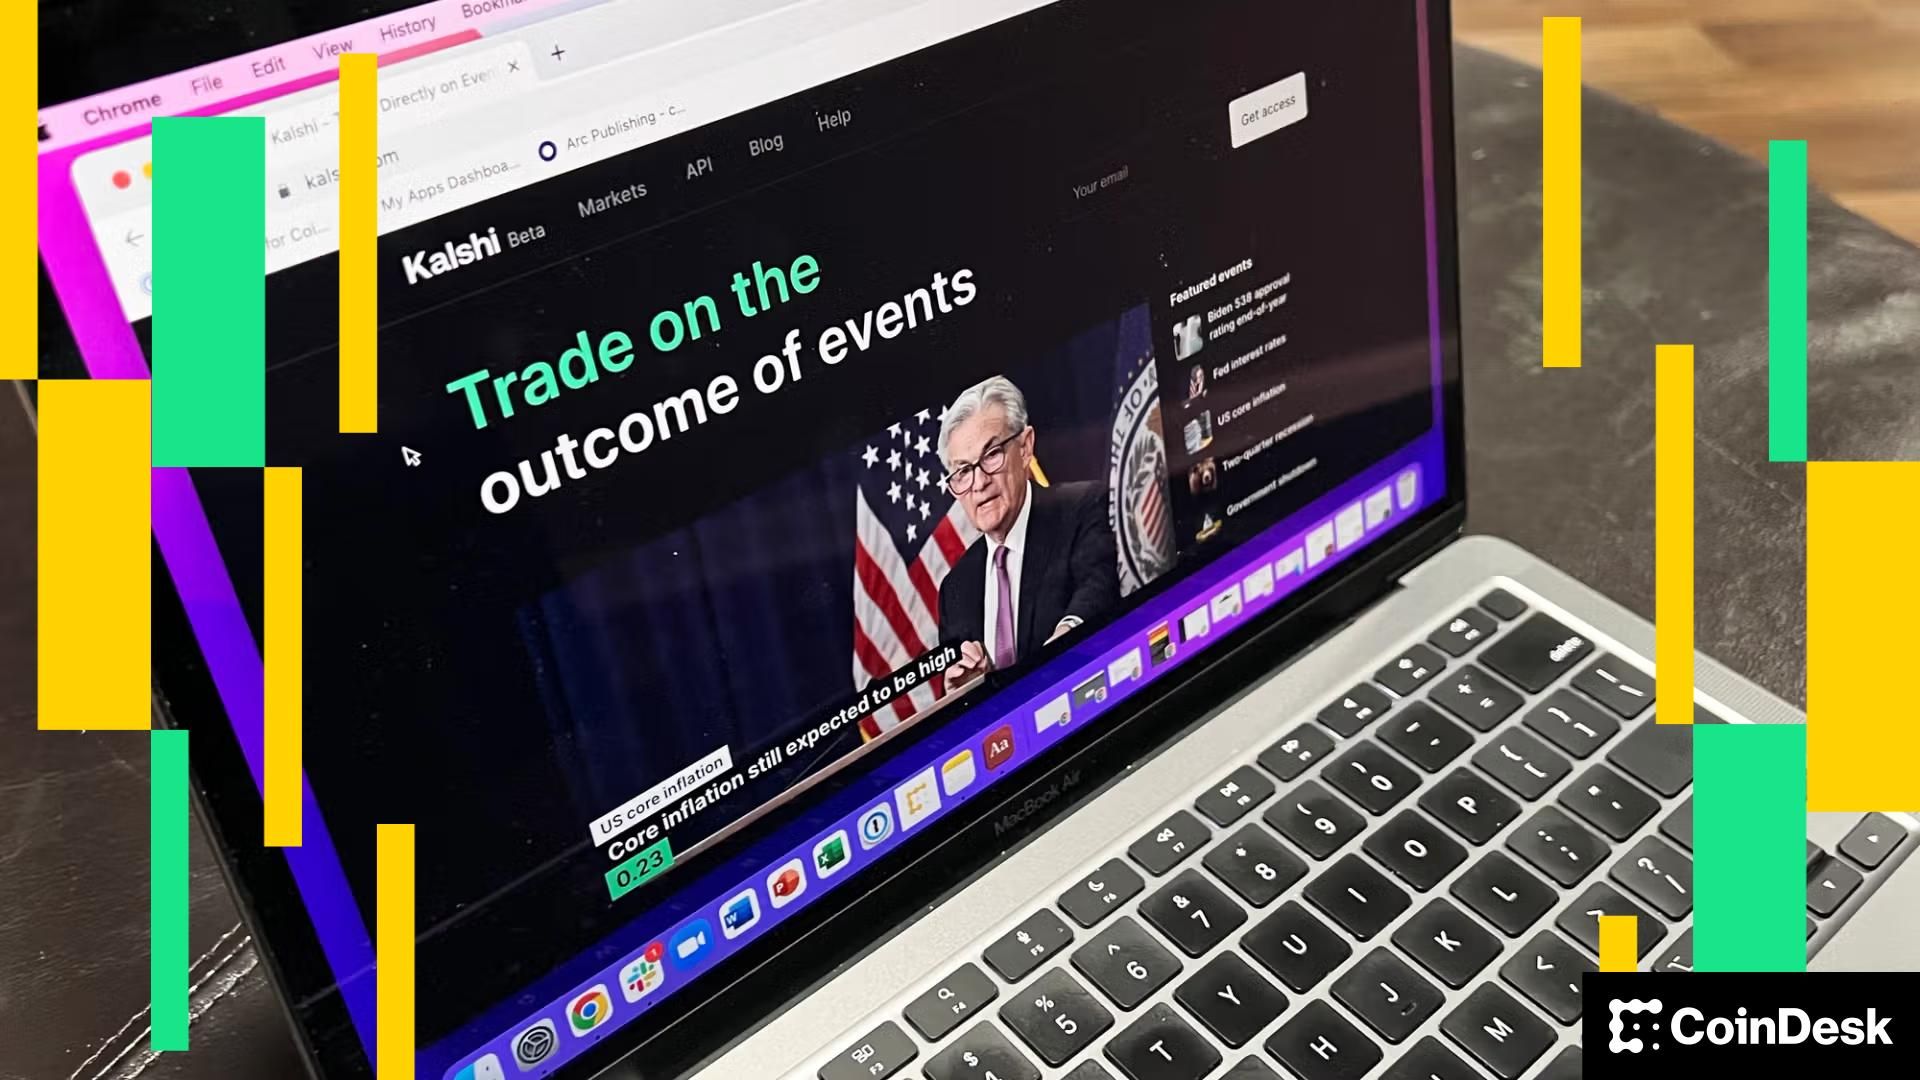
Prediction market provider Kalshi may be hit with a temporary restraining order from the state of Nevada after a federal appeals court declined to block such a motion on Thursday.
The Nevada Gaming Control Board sent Kalshi a cease-and-desist order in March 2025, ordering it to stop offering sports-related prediction market contracts. However, Kalshi said a later temporary restraining order application by Nevada “sought to prohibit Kalshi from offering all its event contracts.” Kalshi tried to move the case to federal court, but the case was set to go back to a state court if the appeals court did not grant it an administrative stay.
On Thursday, a Ninth Circuit Court of Appeals panel denied Kalshi’s motion for an administrative stay in a federal case, clearing the way for the case to get thrown back to a state court.
In its appeal filed on March 13, Kalshi warned that it “faces imminent harm” if the appeals court did not grant its motion, as “the state court proceedings would undermine Kalshi’s appellate rights in this appeal” and a related action.
The platform said that it might find itself litigating the same issue — namely, the question of whether state regulators in Nevada have any jurisdiction — in four different venues, including a Nevada state court, Nevada federal court and two different appeals court cases.
“Allowing that to happen would create an untenable risk of subjecting Kalshi to conflicting federal and state court decisions,” the filing said. “For example, the state court could enter judgment against Kalshi, finding that the CEA does not preempt state gambling laws, while this Court in Assad [another case] arrives at exactly the opposite conclusion.”
Dan Wallach, a gaming lawyer, said in a post on X that a temporary restraining order would push Kalshi out of Nevada entirely for at least two weeks, pending a hearing on a preliminary injunction.
The temporary restraining order could come in the next day or so, he said.
Kalshi and other prediction market providers are facing pushback in over a dozen state actions, with state-level regulators arguing that they have jurisdiction over at least sports-related betting products. The Commodity Futures Trading Commission has argued that it has sole jurisdiction over prediction market providers, and filed an amicus brief in one of the federal cases to defend that position.
The CFTC even signed a memorandum of understanding with Major League Baseball, announced at the same time as MLB’s announcement it had partnered with Polymarket.

The negotiation to get a crypto market structure bill through its next stages in the Senate have hovered over an almost-there status for weeks, and Republican lawmakers met on Thursday to figure out how to bridge the final gaps.
The White House was expected to get some updated legislative language on Thursday, reflecting the ongoing work on the Digital Asset Market Clarity Act, according to people familiar with the situation. But the talks are still going, and even if the previously uncertain senators (such as Republican Thom Tillis) become satisfied with the bill’s stablecoin yield treatment, other distinct compromises (such as the approach to decentralized finance) also need to be secured before the Senate would be able to send the crypto industry’s top policy priority to President Donald Trump for a signature.
The longstanding debate that had focused on stablecoin yield — on which bankers and crypto businesses have been divided over the structure of stablecoin rewards programs — is close to a finish, the people said, though lawmakers have been discussing what else the community bankers might be offered to get their support while resolving some of their other priorities. That could include some unrelated provisions tied to Congress’ recent housing legislation, according to reporting from Politico.
Officials from Trump’s administration were said to be involved with the meeting of Republican members of the Senate Banking Committee, which is the second panel that needs to advance the bill before it would be repackaged into a final version that can get a vote of the overall Senate. Even if the effort advances from the committee by the end of April, as Senator Cynthia Lummis predicted this week, a couple of further hurdles may be out of lawmakers’ hands.
Democrats involved in the talks have said they still want senior government officials and lawmakers from profiting off of personal crypto interests — most pointedly aimed at Trump. And they want Democrats appointed to the party’s vacant seats at the Commodity Futures Trading Commission before the agency adopts new crypto rules. Those are both points that could require concessions from the White House, and crypto insiders are expecting those controversial points to be the last matters settled once the lawmakers are working on a final bill.
On the yield issue, Lummis has said that stablecoin rewards programs that steer clear of bank-line language on savings and interest may survive the compromise, insisting they’re more akin to credit-card rewards than interest from bank-account deposits.
Lummis said Coinbase CEO Brian Armstrong, whose opposition to a previous draft bill helped derail an earlier effort to get to a Senate hearing, has been more flexible in recent talks. The company didn’t immediately respond Thursday to a request for comment on its position.
As Congress works, the Securities and Exchange Commission spent much of the week issuing and discussing new crypto policy points, including a first-ever taxonomy that sets out regulatory definitions for U.S. crypto assets. In a CoinDesk op-ed on Thursday, Chairman Paul Atkins and the two Republican commissioners suggested they’re eager to have a new law back up the policy they’re working on.
“Only Congress can rewrite the law, and we stand ready to work with [Commodity Futures Trading Commission] Chairman Michael Selig to implement the CLARITY Act,” they wrote. “In the meantime, we are providing the responsible regulatory approach that markets demand.”


JPMorgan cuts its S&P 500 target and warns investors are dangerously complacent about Iran war risks, oil above $110, and the hit to growth, earnings, and stocks.
Summary
- JPMorgan trims its year-end S&P 500 target from 7,500 to 7,200, arguing markets are making a high-risk bet on a quick Middle East resolution.
- With Brent crude above $110 and shut-ins near record levels, the bank warns each sustained 10% oil rise can shave 15–20 bps from GDP and cut S&P earnings 2–5%.
- Strategists say a deeper selloff could push the S&P 500 below its 200-day moving average toward 6,000–6,200 as demand destruction and wealth effects bite.
JPMorgan became the latest — and most prominent — Wall Street institution to sound the alarm on Thursday, cutting its year-end S&P 500 price target from 7,500 to 7,200 and warning that equity markets are making a “high-risk assumption” by pricing in a quick resolution to the Middle East conflict. The downgrade, issued as Iranian strikes on Gulf energy infrastructure sent Brent crude surging above $110 per barrel, signals a growing conviction among institutional analysts that the war’s economic fallout has been systematically underpriced.
“We believe the market is pricing in a quick end to the Middle East conflict and reopening of the Strait, giving a low probability to a potential demand hit,” JPMorgan wrote in its note. “This is a high-risk assumption given that S&P 500 and oil correlations typically turn increasingly more negative after a ~30% oil spike.”
Oil prices have surged more than 46% since the U.S. and Israel launched their initial strikes on Iran, yet the S&P 500 has fallen less than 4% — a divergence that JPMorgan’s strategists view as a sign of dangerous market complacency rather than genuine resilience. While high-risk segments such as software stocks, South Korean equities, and crypto have sold off, broad equity positioning has barely shifted, with investors hedging rather than derisking in earnest.
The bank’s core warning centers not on inflation — the conventional oil shock narrative — but on demand destruction. JPMorgan argues that if the supply disruption persists, “GDP, demand, and revenues will adjust lower through forced demand destruction.” The bank estimates that each sustained 10% increase in oil prices shaves 15 to 20 basis points off GDP growth. If Brent holds near $110, consensus S&P 500 earnings estimates could fall by 2 to 5%.
The structural supply picture compounds the concern. Oil supply shut-ins have already climbed to 8 million barrels per day — the highest on record — and JPMorgan warned that cuts could reach 12 million barrels per day, equivalent to roughly 11% of global production.
JPMorgan Private Bank strategists Joe Seydl and Kriti Gupta laid out the transmission mechanism in stark terms earlier this week: oil sustained above $90 per barrel risks a 10–15% correction in the S&P 500, with international and emerging markets facing even larger spillover losses due to their higher sensitivity to global growth shocks. At $120 oil, the selling could intensify materially.
The wealth effect adds a secondary channel. With U.S. households holding over $56 trillion in stocks and mutual funds, a sustained equity drawdown would feed back into consumer spending — JPMorgan estimates a 10% drop in the S&P 500 could reduce U.S. consumer spending by approximately 1%. “The combined impact of persistently high oil prices and a bear market in the S&P 500 has a detrimental effect on demand, significantly amplifying the negative impact on growth,” the bank concluded.
If the S&P 500 selloff extends below the 200-day moving average near 6,600, the bank said meaningful support may not emerge until the 6,000–6,200 range. For now, with the war entering a dangerous new energy-infrastructure phase and no diplomatic off-ramp in sight, JPMorgan’s revised target may prove optimistic rather than cautious.
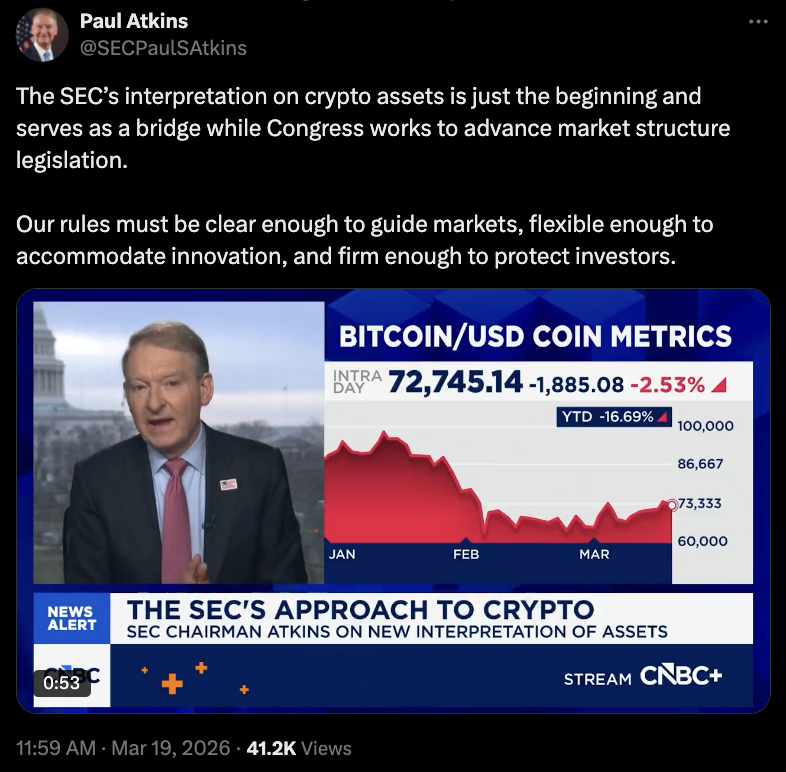
US Securities and Exchange Commission (SEC) Chair Paul Atkins has clarified how the agency intends to approach digital asset regulation following an interpretative notice issued this week.
In prepared remarks for a Thursday speech at the Practising Law Institute, Atkins said that the SEC would take a different approach to digital assets than its previous “regulation by enforcement” campaign. According to the SEC chair, the agency would first focus on its interpretation of how federal securities laws apply to crypto following the signing of a memorandum of understanding with the Commodity Futures Trading Commission (CFTC) last week.
“[…] While the interpretation provides long-needed clarity, I should like to assure this audience that it amounts to a beginning, not an end,” said Atkins.

The agency’s interpretation, released on Tuesday, specified that most cryptocurrencies were likely not securities under federal law, with the chair telling attendees at the DC Blockchain Summit that “only one crypto asset class remains subject to the securities laws” under the agency’s interpretation: namely, “traditional securities that are tokenized.”
Atkins later clarified that digital commodities, digital tools, digital collectibles including non-fungible tokens (NFTs), and stablecoins were digital assets typically not falling under the SEC’s purview.
Related: SEC gives go-ahead to Nasdaq for tokenized trading trial
While the SEC interpretation could significantly change how the agency approaches crypto regulation and enforcement, a market structure bill working its way through Congress is also expected to give the CFTC more authority in regulation and oversight of digital assets. The bill, called the CLARITY Act when it passed the House of Representatives in July 2025, had not been scheduled for a markup in the Senate Banking Committee as of Thursday.
White House meets with US lawmakers behind closed doors
A spokesperson for Wyoming Senator Cynthia Lummis confirmed with Cointelegraph that Republican senators met with White House crypto adviser Patrick Witt on Thursday to discuss advancing the market structure bill. While the Senate Agriculture Committee advanced its version of the legislation in January, concerns over how to address stablecoin yield in the crypto and banking industry have effectively stalled progress in the Senate Banking Committee.
According to Lummis’ team, the meeting was “very productive and positive,” adding that lawmakers were “99% of the way there on stablecoin yield,” and “negotiations on the digital asset portions of the bill are in a good place.”
Magazine: Are DeFi devs liable for the illegal activity of others on their platforms?
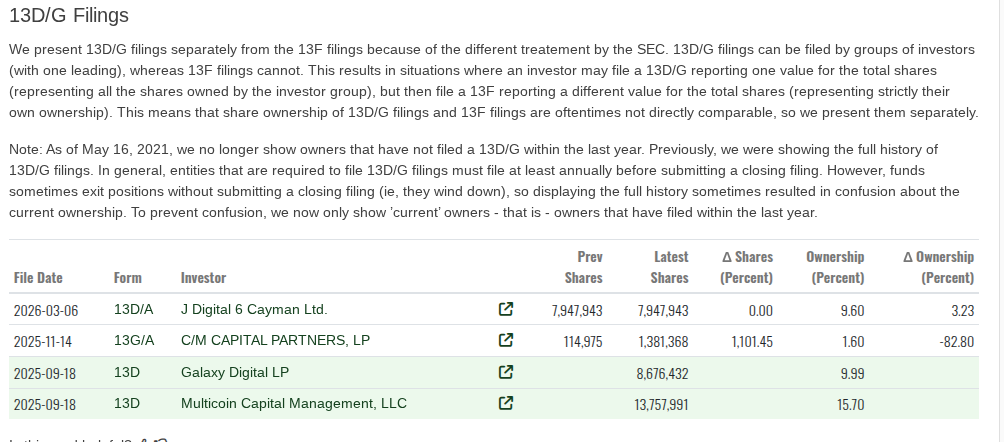
Forward Industries, a publicly traded company with a Solana-focused treasury strategy, has launched a share repurchase program funded through a crypto-backed loan from Galaxy Digital LLC, underscoring how digital assets are increasingly being used in traditional corporate finance.
The company said Thursday it will repurchase 6,164,324 shares of its common stock from an unnamed institutional investor for approximately $27.4 million, reducing total shares outstanding to 76,977,809.
Cointelegraph’s email to Forward seeking further information on the identity of the selling institutional investor was not answered prior to publication.

Public filings indicate that only six institutional investors in Forward Industries hold enough shares to sell that volume back to the company. According to filings data compiled by Fintel.io, one of those holders is Galaxy Digital LP (8.68 million shares, as of Sept. 18, 2025) and another is Galaxy Group Investments LLC (8.11 million shares, as of Feb. 18, 2026.)
To fund the buyback, Forward secured a $40 million loan from Galaxy Digital LLC at an interest rate of 3.4%. The loan is collateralized by the company’s Solana (SOL) holdings, which total 7,013,536 SOL — valued at approximately $613 million at current market prices.
The structure allows Forward to access liquidity without liquidating its crypto reserves, while continuing to generate yield through staking. The move reflects a broader trend of companies leveraging digital asset treasuries to optimize capital structure and potentially enhance shareholder returns.
The share repurchase appears to be part of Forward Industries’ November authorization to buy back up to $1 billion of its stock on an ongoing basis. At the time, the company said the program would provide financial flexibility amid heightened volatility in the crypto market.
That volatility has intensified in recent months, with Solana’s price falling below $90. The buyback may also help support Forward Industries’ stock, which is down 87% from its September peak.

Related: Crypto’s 2026 investment playbook: Bitcoin, stablecoin infrastructure, tokenized assets
Crypto treasury strategies face pressure
Forward Industries began aggressively accumulating Solana last year, when crypto treasury strategies gained traction during the bull market. The company has since built the largest publicly traded SOL treasury, with at least 18 other public companies adopting similar strategies, according to industry data.
By February, these companies collectively held more than $1.5 billion in unrealized losses tied to the broader crypto market downturn. A significant portion of those losses is attributed to Forward Industries, which is down roughly $972 million.

The sector’s volatility is likely to result in broad consolidation among crypto treasury companies, Wojciech Kaszycki of crypto infrastructure company BTCS told Cointelegraph.
Many treasury companies are under pressure as declining crypto prices push their valuations below the value of the digital assets they hold, while limited cash flow makes it harder to sustain operations.

Cardano advances toward its protocol 11 upgrade, with a key node release expected within days. The network continues structured preparations for the van Rossem hard fork. Developers now focus on testing, integration, and performance validation across the ecosystem.
Node Release Drives Upgrade Timeline
Cardano plans to release Node 10.7.0 as a critical step toward the protocol 11 upgrade. This version follows the earlier 10.6.2 release, which began the preparation phase. The upcoming release introduces features beyond hard fork readiness.
Moreover, developers expect Node 10.7.0 to trigger wider ecosystem upgrades across tools and services. Teams will integrate the node into existing infrastructure and begin coordinated testing efforts. This process ensures compatibility before any major network transition.
However, performance results will determine the next steps in the rollout sequence. Additional minor updates may follow if testing reveals areas needing refinement. This staged approach helps maintain network stability during the transition.
Testing Phase Expands Across Ecosystem
Cardano’s ecosystem will begin integration testing once the new node version becomes available. Developers aim to validate performance, stability, and compatibility across various applications. This phase plays a central role in preparing for the hard fork.
Besides node integration, supporting tools such as DBSync will align with the new version. The updated DBSync release will match Node 10.7.0 without introducing serialization changes. This decision reduces the risk of disruptions for hardware wallet users.
Meanwhile, prerelease versions allow developers to test new features in controlled environments. These tests provide early feedback and highlight potential issues before broader deployment. Consequently, the network can address concerns before reaching mainnet activation.
Protocol 11 Introduces New Capabilities
Protocol version 11 will introduce several new Plutus built-in functions to enhance smart contract performance. These additions include array types, modular exponentiation, and multi-scalar cryptographic operations. Each feature aims to improve efficiency and expand developer capabilities.
Furthermore, the upgrade will refine ledger rules while maintaining compatibility with existing contracts. The changes avoid altering transaction structures, which simplifies adoption across the ecosystem. This approach reduces the need for extensive modifications by developers.
SanchoNet has already upgraded to support these new built-ins for testing purposes. Additionally, smart contract tools such as Scalus now support the updated functionality. These preparations ensure developers can experiment before the main network transition.
Intra-Era Upgrade Minimizes Disruption
The van Rossem upgrade represents a small intra-era change rather than a major structural shift. It focuses on performance improvements and added functionality without disrupting existing operations. This design allows smoother adoption across the network.
Moreover, the upgrade enhances cryptographic capabilities while maintaining system consistency. Developers gain access to more efficient tools without needing to rebuild deployed applications. This balance supports innovation while preserving stability.
Consequently, Cardano positions protocol 11 as a measured upgrade with targeted benefits. The network strengthens performance and expands functionality without introducing major risks. This strategy reflects a controlled and incremental development approach.

Bybit has unveiled a yield-bearing tokenized gold product built on Tether Gold (XAUT), enabling users to earn interest on their XAUT holdings while staying exposed to gold’s price movements. The offering marks a concrete step in Bybit’s broader push into tokenized real-world assets (RWAs) and signals growing industry interest in turning traditionally non-yielding assets into income-generating instruments.
Marketed as the largest tokenized gold product, the Bybit service centers on XAUT, a tokenized form of gold intended to provide on-chain exposure with the potential for yield. Bybit described the arrangement as a way for holders to generate passive income without relinquishing their exposure to gold prices. Earlier this month, CoinMarketCap data placed Tether Gold’s market capitalization at just under $3 billion, underscoring the scale of tokenized gold as a tradable, on-chain asset.
The introduction sits within a wider industry move to tokenize real-world assets and harness capital markets mechanics on blockchain rails. Bybit’s move is part of a broader expansion into tokenized RWAs, a trend that includes specialized investment structures and yield strategies designed to monetize asset classes traditionally viewed as buy-and-hold stores of value. Industry trackers have highlighted a rapid rise in tokenized RWAs in recent years, with DeFiLlama data showing growth in 2026 and continued momentum into this year.
In another notable development this week, tokenization platform Theo disclosed a $100 million structured investment facility backing its gold-linked yield-stablecoin thUSD. The arrangement combines tokenized gold acquisitions with hedging via gold futures to lock in financing and arbitrage-driven returns, rather than depending solely on outright price appreciation. The approach illustrates a broader appetite for finance-on-rails strategies that use tokenized gold as a collateral or reference asset while attempting to harvest spreads from markets beyond simple price moves.
Gold’s recent price action provides a complex backdrop for these products. After a historic rally that propelled the metal to multi-decade highs, gold has experienced pronounced volatility as macro expectations shift. Prices remain elevated relative to historical norms, even as they pulled back from peaks. The market’s positioning has also drawn attention: in January, Bank of America’s global fund manager survey identified long gold as the most crowded trade, reflecting crowded bets as participants weighed inflation, rate trajectories, and geopolitical risk alongside the metal’s traditional role as a hedging asset. Bloomberg has also noted that gold’s premium versus its long-term trend reached its highest level since 1980, underscoring a disconnect between price levels and macro fundamentals in the near term.
Beyond individual assets, the broader tokenized commodities landscape continues to expand. Cointelegraph reported that the market for tokenized commodities surpassed $6 billion in February, driven in large part by gold’s historic rally and ongoing demand for on-chain exposure to traditional assets. The surge in tokenized RWAs—already a focus for Bybit and others—highlights a shift toward more sophisticated, yield-oriented wrappers around real-world assets as participants seek new sources of income in a market environment of rising yields and evolving regulatory frameworks.
Key takeaways
- Bybit launches a yield-bearing product on Tether Gold (XAUT), enabling holders to earn passive income while maintaining gold exposure.
- XAUT is described as the largest tokenized gold offering, with Tether Gold’s market cap approaching $3 billion earlier this month.
- The move aligns with a broader push into tokenized real-world assets (RWAs) as crypto platforms explore income-generating wrappers around traditional assets.
- Theo’s $100 million structured facility backing thUSD illustrates a parallel model: tokenized gold assets financed with hedging and derivatives to capture spreads, not just price moves.
- Gold remains volatile after a historic rally; long gold was flagged as the most crowded trade by Bank of America, and Bloomberg notes the metal’s premium to trend at a multi-decade high, complicating the outlook for tokenized gold strategies.
Bybit’s yield model and the RWAs push
Bybit’s yield-bearing on XAUT represents a practical application of tokenized gold beyond passive price tracking. By converting tokenized gold into an income-generating instrument, Bybit aims to attract yield-oriented investors who want exposure to gold’s price dynamics without forgoing potential returns from the lending, financing, or staking-like mechanics embedded in the token’s structure. While the precise mechanics—such as how yields are generated, risk controls, and withdrawal terms—were not exhaustively disclosed, the product fits a pattern of increasingly sophisticated RWAs that blend traditional asset classes with on-chain liquidity and structured finance concepts.
The broader RWAs trend, already visible in research noting growth in tokenized RWAs and the acceleration of tokenized commodities, suggests that institutions and retail users alike are testing whether blockchain rails can support more complex financial products. The Theo facility underscores the appetite for gold-linked yield strategies, pairing physical collateral with derivative hedges to seek returns from financing markets. If these structures prove robust at scale, they could broaden the menu for asset owners seeking liquidity and for traders seeking yield opportunities in a market that has historically rewarded patience over quarterly income streams.
Gold’s path and what it means for tokenized assets
The gold market’s volatility remains a central factor for investors in tokenized gold vehicles. While the metal’s ascent captured broad attention, the subsequent pullback has reminded market participants that macro dynamics—rising real yields, a stronger dollar, and evolving expectations for monetary policy—continue to shape gold’s risk-reward profile. The crowded-long-position signal from Bank of America’s survey highlights a potential risk of a sharp shift in sentiment if macro catalysts shift again. Meanwhile, Bloomberg’s observation that gold’s premium to its long-term trend is at levels not seen since 1980 adds another layer of watchfulness for investors weighing tokenized versions of the metal against conventional futures and spot markets.
Industry data also reinforces a broader shift toward tokenized assets as viable income streams. The February milestone of tokenized commodities crossing the $6 billion mark points to persistent demand for on-chain access to traditional asset classes. As tokenized RWAs become more commonplace, observers will be watching how risk management, regulatory clarity, and interoperability across chains influence the speed and scope of adoption. Bybit’s move into yield-bearing XAUT sits at the intersection of these trends—demonstrating both the appeal of yield opportunities and the ongoing need to manage price risk in a connected, asset-backed crypto economy.
What readers should watch next
Market participants should monitor how yield-bearing tokenized gold products perform across different market regimes, especially as macro conditions evolve and as liquidity and risk controls mature. Investors will want clarity on fee structures, collateral arrangements, and redemption terms, as well as how these products fare during periods of heightened volatility or stress in traditional capital markets.
As tokenized RWAs continue to mature, the coming quarters could reveal whether yield-based structures around gold and other real-world assets become mainstream tools for portfolio construction, or whether they remain specialized instruments used by a subset of traders and institutions. The evolving regulatory backdrop will also shape which models gain traction and how quickly durable, scalable offerings can emerge.

Premier League Darts 2026 results: Luke Littler stuns Gerwyn Price after two 170 finishes
HDFC Bank crashes 9% in one day. Which mutual funds have highest exposure to this stock in February

Bitcoin Sell-off Capped At $70K But Data Points To Rebound

Smart energy pays enters the US market, targeting scalable financial infrastructure

Why Israel is blocking foreign journalists from entering

Bitcoin: We’re Entering The Most Dangerous Phase

Crypto Futures Trading Full Course | Crypto Futures Trading For Beginners | SAGAR SINHA

How to Start Investing with Rs. 500 in Pakistan | Financial Literacy for Beginners

LIVE: BlackRock Partners with Ripple for Massive Asset Tokenization! Game Changer for XRP Holders!
-
 Crypto World6 days ago
HYPE Token Enters Net Deflation as HyperCore Buybacks Outpace Staking Rewards
-

 Tech4 days ago
Your Legally Registered ‘Motorcycle’ Might Not Count Under Proposed US Law
-

 Fashion6 days ago
Weekend Open Thread: Addict Lip Glow
-
 Tech2 days ago
Are Split Spacebars the Next Big Gaming Keyboard Trend?
-
Sports5 days ago
Why Duke and Michigan Are Dead Even Entering Selection Sunday
-

 Business4 days ago
Search for Savannah Guthrie’s Mother Enters Seventh Week with No Arrests
-

 Business5 days ago
US Airports Launch Donation Drives for Unpaid TSA Workers as Partial Government Shutdown Enters Fifth Week
-
Crypto World5 days ago
Coinbase and Bybit in Investment Talks: Could Bybit Finally Enter the US Crypto Market?
-

 Business3 days ago
Australian shares drop as Iran war enters third week
-

 Business5 days ago
Country star Brantley Gilbert enters growing non-alcoholic beer market
-

 Crypto World4 days ago
Crypto Lender BlockFills Enters Chapter 11 with Up to $500M in Liabilities
-

 Sports6 days ago
College Basketball Best Bets: Conference Tournament Semifinal Picks
-

 Politics2 days ago
The House | The new register to protect children from their abusers shows Parliament at its best
-

 Fashion3 days ago
25 Celebrities with Curly Hair That Are Naturally Beautiful
-

 News Videos1 day ago
RBA board divided on rate cut, unusually buoyant share market | Finance Report | ABC NEWS
-

 Crypto World1 day ago
Canada’s FINTRAC revokes registrations of 23 crypto MSBs in AML crackdown
-

 Crypto World5 days ago
Crypto Losses Drop 87% in February, But Hackers Are Now Targeting People, Not Code
-
 Politics2 days ago
Real-time pollution monitoring calls after boy nearly dies
-
 NewsBeat1 day ago
Residents in North Lanarkshire reminded to register to vote in Scottish Parliament Election
-
 Entertainment6 days ago
Blake Lively Fights To Keep Justin Baldoni Case Alive


You must be logged in to post a comment Login