
Crypto World
Bybit Debuts Yield-Generating Tokenized Gold, Expands RWA Yields

Bybit has unveiled a yield-bearing tokenized gold product built on Tether Gold (XAUT), enabling users to earn interest on their XAUT holdings while staying exposed to gold’s price movements. The offering marks a concrete step in Bybit’s broader push into tokenized real-world assets (RWAs) and signals growing industry interest in turning traditionally non-yielding assets into income-generating instruments.
Marketed as the largest tokenized gold product, the Bybit service centers on XAUT, a tokenized form of gold intended to provide on-chain exposure with the potential for yield. Bybit described the arrangement as a way for holders to generate passive income without relinquishing their exposure to gold prices. Earlier this month, CoinMarketCap data placed Tether Gold’s market capitalization at just under $3 billion, underscoring the scale of tokenized gold as a tradable, on-chain asset.
The introduction sits within a wider industry move to tokenize real-world assets and harness capital markets mechanics on blockchain rails. Bybit’s move is part of a broader expansion into tokenized RWAs, a trend that includes specialized investment structures and yield strategies designed to monetize asset classes traditionally viewed as buy-and-hold stores of value. Industry trackers have highlighted a rapid rise in tokenized RWAs in recent years, with DeFiLlama data showing growth in 2026 and continued momentum into this year.
In another notable development this week, tokenization platform Theo disclosed a $100 million structured investment facility backing its gold-linked yield-stablecoin thUSD. The arrangement combines tokenized gold acquisitions with hedging via gold futures to lock in financing and arbitrage-driven returns, rather than depending solely on outright price appreciation. The approach illustrates a broader appetite for finance-on-rails strategies that use tokenized gold as a collateral or reference asset while attempting to harvest spreads from markets beyond simple price moves.
Gold’s recent price action provides a complex backdrop for these products. After a historic rally that propelled the metal to multi-decade highs, gold has experienced pronounced volatility as macro expectations shift. Prices remain elevated relative to historical norms, even as they pulled back from peaks. The market’s positioning has also drawn attention: in January, Bank of America’s global fund manager survey identified long gold as the most crowded trade, reflecting crowded bets as participants weighed inflation, rate trajectories, and geopolitical risk alongside the metal’s traditional role as a hedging asset. Bloomberg has also noted that gold’s premium versus its long-term trend reached its highest level since 1980, underscoring a disconnect between price levels and macro fundamentals in the near term.
Beyond individual assets, the broader tokenized commodities landscape continues to expand. Cointelegraph reported that the market for tokenized commodities surpassed $6 billion in February, driven in large part by gold’s historic rally and ongoing demand for on-chain exposure to traditional assets. The surge in tokenized RWAs—already a focus for Bybit and others—highlights a shift toward more sophisticated, yield-oriented wrappers around real-world assets as participants seek new sources of income in a market environment of rising yields and evolving regulatory frameworks.
Key takeaways
- Bybit launches a yield-bearing product on Tether Gold (XAUT), enabling holders to earn passive income while maintaining gold exposure.
- XAUT is described as the largest tokenized gold offering, with Tether Gold’s market cap approaching $3 billion earlier this month.
- The move aligns with a broader push into tokenized real-world assets (RWAs) as crypto platforms explore income-generating wrappers around traditional assets.
- Theo’s $100 million structured facility backing thUSD illustrates a parallel model: tokenized gold assets financed with hedging and derivatives to capture spreads, not just price moves.
- Gold remains volatile after a historic rally; long gold was flagged as the most crowded trade by Bank of America, and Bloomberg notes the metal’s premium to trend at a multi-decade high, complicating the outlook for tokenized gold strategies.
Bybit’s yield model and the RWAs push
Bybit’s yield-bearing on XAUT represents a practical application of tokenized gold beyond passive price tracking. By converting tokenized gold into an income-generating instrument, Bybit aims to attract yield-oriented investors who want exposure to gold’s price dynamics without forgoing potential returns from the lending, financing, or staking-like mechanics embedded in the token’s structure. While the precise mechanics—such as how yields are generated, risk controls, and withdrawal terms—were not exhaustively disclosed, the product fits a pattern of increasingly sophisticated RWAs that blend traditional asset classes with on-chain liquidity and structured finance concepts.
The broader RWAs trend, already visible in research noting growth in tokenized RWAs and the acceleration of tokenized commodities, suggests that institutions and retail users alike are testing whether blockchain rails can support more complex financial products. The Theo facility underscores the appetite for gold-linked yield strategies, pairing physical collateral with derivative hedges to seek returns from financing markets. If these structures prove robust at scale, they could broaden the menu for asset owners seeking liquidity and for traders seeking yield opportunities in a market that has historically rewarded patience over quarterly income streams.
Gold’s path and what it means for tokenized assets
The gold market’s volatility remains a central factor for investors in tokenized gold vehicles. While the metal’s ascent captured broad attention, the subsequent pullback has reminded market participants that macro dynamics—rising real yields, a stronger dollar, and evolving expectations for monetary policy—continue to shape gold’s risk-reward profile. The crowded-long-position signal from Bank of America’s survey highlights a potential risk of a sharp shift in sentiment if macro catalysts shift again. Meanwhile, Bloomberg’s observation that gold’s premium to its long-term trend is at levels not seen since 1980 adds another layer of watchfulness for investors weighing tokenized versions of the metal against conventional futures and spot markets.
Industry data also reinforces a broader shift toward tokenized assets as viable income streams. The February milestone of tokenized commodities crossing the $6 billion mark points to persistent demand for on-chain access to traditional asset classes. As tokenized RWAs become more commonplace, observers will be watching how risk management, regulatory clarity, and interoperability across chains influence the speed and scope of adoption. Bybit’s move into yield-bearing XAUT sits at the intersection of these trends—demonstrating both the appeal of yield opportunities and the ongoing need to manage price risk in a connected, asset-backed crypto economy.
What readers should watch next
Market participants should monitor how yield-bearing tokenized gold products perform across different market regimes, especially as macro conditions evolve and as liquidity and risk controls mature. Investors will want clarity on fee structures, collateral arrangements, and redemption terms, as well as how these products fare during periods of heightened volatility or stress in traditional capital markets.
As tokenized RWAs continue to mature, the coming quarters could reveal whether yield-based structures around gold and other real-world assets become mainstream tools for portfolio construction, or whether they remain specialized instruments used by a subset of traders and institutions. The evolving regulatory backdrop will also shape which models gain traction and how quickly durable, scalable offerings can emerge.


Bitcoin (BTC) dipped under $69,000 on Thursday, sliding back into its six-week range after briefly touching highs above $76,000. The retreat comes as futures selling accelerates and demand from U.S.-based investors shows signs of stalling, though analysts argue the market could still mount a renewed rally if key levels hold and the broader setup unfolds in a favorable way.
The shift reflects a shift in market dynamics where derivatives activity increasingly dominates spot flows, underscoring the ongoing tug-of-war between leveraged traders and cash-based demand. While the immediate move raised questions about momentum, a familiar chart pattern suggests a potential path back toward the region’s previous highs if the balance of risk and reward tips back in favor of buyers.
Key takeaways
- BTC briefly fell below $69,000, pulling the price back into a six-week range after testing above $76,000 in recent sessions.
- Derivatives activity has regained influence over spot demand, with the Coinbase premium turning negative and cumulative volume delta (CVD) shifting toward sellers on both spot and perpetual contracts.
- Funding rates turned modestly positive (about 0.05%), signaling a shift toward a net long bias in the futures market even as spot liquidity wanes in the near term.
- Technical patterns echo a prior bounce in early March: lower daily lows accompanied by bullish RSI divergences, bolstering case for a retest of higher levels if the price can reclaim key pivots.
- Key levels to watch include reclaiming $70,000, a possible move to $72,000–$76,000, and protection above $68,300 to prevent a slide toward $65,000–$62,000 in a downside scenario.
Derivatives leadership matches fluctuating spot demand
Recent data from on-chain analytics show a notable shift in the relationship between spot volumes and derivatives activity. After a period of robust demand for BTC on spot venues, the Coinbase Premium gap turned negative, suggesting that U.S.-based buyers did not sustain the previous pace of purchases into the dip. That pattern aligns with observations from traders watching the balance between cash markets and the leveraged side of the market.
Analysts highlighted a stark divergence in flow across the two market segments. The cumulative volume delta (CVD) for spot BTC declined by about $40.64 million, while the CVD for perpetual futures fell by roughly $506.75 million. The discrepancy indicates stronger selling pressure from leveraged traders relative to spot buyers over the same period, a dynamic that can amplify short-term price swings even when long-term bias remains mixed.
Despite the softer near-term spot demand, the funding rate has shifted into positive territory, around 0.05%. This implies long-position holders are now paying shorts, a sign of more constructive sentiment within the derivatives market and a potential tilt toward a bullish bias if funding pressures persist in favor of long exposure.
Order-book data further shows stubborn bid support around the $70,000 mark, with market depth hinting at buyers stepping in at or near that level in both spot and perpetual markets. The dynamic suggests that even as selling pressure arises from leveraged traders, a floor exists where demand can reassert itself should prices approach the pivot region.
For context, market watchers also flagged a broader pattern tying into a Bitcoin-centric DeFi push that aims to unlock native liquidity and yield on BTC without resorting to wrapped assets. While not a certainty, such developments could contribute to deeper buyers’ interest at critical levels.
Fractal pattern hints at a potential rebound
On shorter timeframes, Bitcoin’s price movement has formed a fractal pattern reminiscent of early March, when a dip and a sweep of internal liquidity levels preceded a decisive reversal higher. The current setup mirrors that sequence: successive lower lows followed by signals that momentum may be fading and buying pressure could reemerge.
From a momentum perspective, a bullish RSI divergence is unfolding. In the previous instance, the RSI held higher than its own prior low while price dipped, signaling that selling pressure was waning even as price trended downward. A comparable divergence is developing now, reinforcing the case for a fractal rebound rather than a deeper retreat.
Liquidation activity has also framed the narrative in both episodes. In each instance, long-side liquidations have briefly reduced open interest and flushed out overleveraged positions, which can set the stage for a swift reallocation of risk once buyers regain conviction. A breach of the fractal’s boundary would be a red flag, but the current data tilt toward potential stamina in the near term.
Looking ahead, reclaiming the $70,000 area is depicted as a pivotal moment. If bulls push past $72,000 and sustain the move, the door could open to retesting the higher band near $76,000. A key risk sits at $68,300: breaking below this level would widen the path toward liquidity pockets around $65,000 and $62,000, where larger time-frame orders may offer support but where the risk of a more protracted downside expands.
Industry observers have also flagged a practical anchor for bulls: the $73,000 level as a base. Ryan Scott, founder of Trading Stables, emphasized that failure to stabilize above this threshold could signal weak buyer response and raise the odds of a test of range lows around $62,000 in a less favorable scenario.
For readers tracking market sentiment and potential catalysts, these dynamics sit within a broader context. Prediction market chatter has floated scenarios where BTC could revisit declines in the mid-to-high $50,000s in more adverse cycles, but the present fractal framework suggests a more conditional path—one that hinges on continued support near $70,000 and a successful reentry into the higher rung of the range.
Related: OP_NET launches native DeFi push for Bitcoin highlights the broader trend of on-chain options aimed at expanding BTC’s utility beyond traditional spot trading, a development that could help anchor more robust demand in the event of protracted volatility.
What this means for traders and builders
The current setup underscores a broader theme in crypto markets: price action is increasingly shaped by the tug-of-war between leveraged bets and real-money demand. While the near-term risk remains tilted toward a retest of the range’s lower boundary if liquidity dries up, the structural signals favor a rebound scenario as long as price holds above the critical supports and rotating demand persists into the next session.
From an investor standpoint, the situation calls for careful risk management around the $68,300–$70,000 area. Traders aiming for a breakout to the $76,000 vicinity should monitor the 72,000–73,000 zone as a potential pivot, watching for solid acceptance in that band that could fuel a short squeeze if weak shorts get trapped. Conversely, a break below $68,300 could shift the focus to the mid- to lower-$60,000s where higher-timeframe liquidity sits, complicating a quick recovery.
Next steps to watch
Market participants should keep a close eye on bid-ask dynamics around the $70,000 mark and the flow of funding rates in the coming sessions. A sustained positive funding environment and renewed spot demand would bolster the case for a renewed ascent toward recent highs, while a renewed deterioration in derivatives positioning could reassert the range-bound dynamic. In addition, broader adoption and on-chain DeFi developments around Bitcoin may offer extra support should buyers look to deploy capital in more diverse BTC-enabled protocols.
Readers should stay tuned for how the price responds to the pivotal $70,000 to $72,000 zone and whether the fractal pattern continues to unfold. As always, ongoing monitoring of liquidity, funding, and on-chain signals will be essential to gauge whether the market is leaning toward continuation of the uptrend or a renewed test of lower bands.


Opinion by: Arthur Azizov, founder of B2 Ventures
Transaction cost analysis (TCA) has long been an important tool in equity trading. With this instrument, traders can see the hidden costs that a transaction carries and minimize the difference between the expected and the actual price.
As crypto matures, it begins to resemble traditional financial markets and functions like other tradable instruments. Crypto transactions also come with costs: fees that investors pay every time they buy or sell crypto.
Yet there is one thing that is clearly not keeping pace with this development. Execution costs for crypto analyzed systematically. Understanding how much it actually costs to execute a deal leaves much to be desired.
This opacity demands the crypto industry urgently adopt transaction cost analysis before it kills market trust.
Invisible costs in the crypto market
To the untrained eye, major crypto pairs can seem liquid; order books are deep, and quoted spreads are competitive. In the end, however, the final execution price can deviate from the expected one due to slippage.
For example, an investor wanted to buy 1 Bitcoin (BTC) for $90,000, but because of the sudden market volatility, the final price was $90,900. The slippage, in this case, would be $900, or 1% of the intended trade amount.
This problem is inherent not only in crypto; it also exists in traditional finance. In equity markets, however, these costs are measured precisely, compared and analyzed with the use of TCA, coupled with best execution.
In contrast, for crypto, the real price of entry or exit is often hard to calculate or predict manually. This is precisely where TCA becomes valuable, as it can allow crypto traders to break down the true cost of execution, knowing exactly bid-ask spreads, market effect and order routing fees.
With TCA tools, crypto transactions can become more transparent, and traders can easily identify the sources of costs associated with executing trades.
Crypto transactions can be hard to price
If it were that easy in real life, however, TCA analysis would already be an integral part of crypto markets. The main issue is that cryptocurrency prices are highly volatile, changing every millisecond and trading happens around the clock. It has a significant influence on trade execution costs, as sometimes investors are simply not on time when making purchases.
The liquidity is low, and the fragmentation, due to the existence of a number of exchanges, remains high. This situation worsens as some platforms may have outages or less available liquidity, which causes even more slippage.
Speaking of costs, things get opaque in crypto. Some costs can often be included quietly within the trade prices, complicating the “total consideration.” It’s difficult to really know the full cost of a trade.
There is an issue of a lack of data as well. A meaningful transaction cost analysis requires standardized data. For example, in equity markets, information is typically available from centralized sources. As cryptocurrencies have a decentralized nature, trading activity is fragmented across numerous exchanges and platforms, making it difficult to aggregate data and perform reliable analysis.
The crypto market also suffers from the absence of regulation and a universal definition of TCA or best execution. As a result, the portfolio performance is highly dependent on external factors such as the speed of a trade or the “health” of the venue and not on the capabilities of an asset manager or investor.
Toward measurable execution
Regulators are beginning to recognize this gap in execution. For example, in 2025, the European Securities and Markets Authority updated its standards, including best execution, to extend beyond equities to include asset classes such as foreign exchange, commodities and, most importantly, crypto.
Related: Temple Digital Group launches 24/7 institutional trading built on Canton
This does not introduce a transaction cost analysis per se and does not prescribe specific performance indicators, but it’s an important precedent. Execution transparency becomes more mandatory for digital assets.
Although regularization alone cannot solve the problem of invisible trading costs, it still makes investors think more about the need for TCA. If market participants can see how much trading really costs and how these additional fees differ between exchanges, the market will become more efficient.
The dilemma of scattered data and lack of standardization is now being solved with cloud computing and big data analysis that made it significantly easier and more cost-effective to collect large volumes of data and process it. Powered by machine learning, platforms can conduct transaction cost analysis across venues and identify patterns that were previously inaccessible.
The massive use of TCA would help traders reduce costs and increase liquidity. Trading volume flows would gradually move to a place where there are better conditions, which would stimulate competition between the exchanges and assets.
Opinion by: Arthur Azizov, founder of B2 Ventures.
This opinion article presents the author’s expert view, and it may not reflect the views of Cointelegraph.com. This content has undergone editorial review to ensure clarity and relevance. Cointelegraph remains committed to transparent reporting and upholding the highest standards of journalism. Readers are encouraged to conduct their own research before taking any actions related to the company.
Bitcoin drops below $70,000 as the Fed raises its inflation forecast and oil-driven price pressures cloud the outlook for rate cuts.
Crypto markets deepened their losses on Thursday after the Federal Reserve left interest rates unchanged and raised its 2026 inflation forecast yesterday, compounding a selloff triggered by hotter-than-expected wholesale inflation.
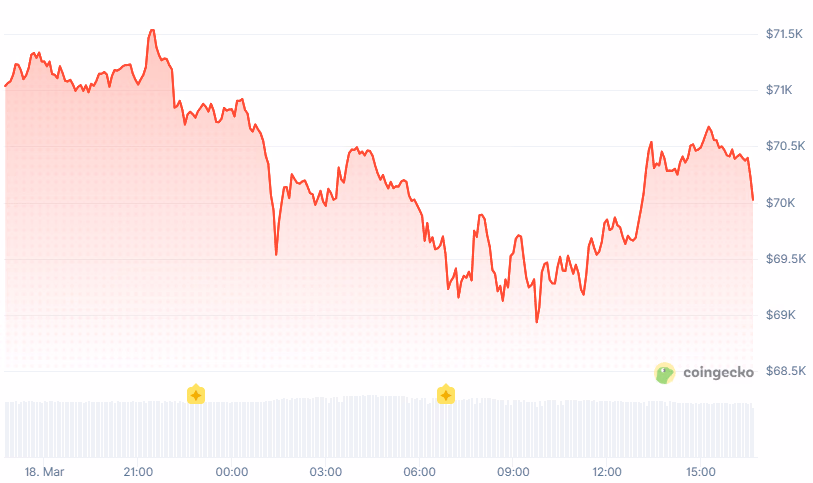
Bitcoin (BTC) is trading at around $70,000, down 1.3% over the past 24 hours. ETH and SOL fell 2% to $2,135 and $88.5, respectively. Meanwhile, Ripple (XRP) slipped 1%.

Total crypto market capitalization is down 1.5% to $2.48 trillion, according to Coingecko.
Fed Raises Inflation Outlook
Yesterday, the Federal Reserve held rates steady as widely expected, but the accompanying projections delivered a hawkish surprise. Policymakers raised their 2026 PCE inflation forecast to 2.7% from 2.4%, with Chair Jerome Powell acknowledging that rising oil prices “for sure showed up” in the committee’s updated outlook.
The dot plot still shows a median expectation of one 25-basis-point cut this year, but seven of the 19 FOMC members now project zero cuts in 2026, up from six in December.
Big Movers
Nearly all of the Top 100 digital assets posted losses over the last 24 hours.
Today’s top gainers are Quant (QNT) and Pi Network (PI).
Worldcoin (WLD) and PUMP are the biggest losers, down 10% and 6%, respectively.
Around 118,000 leveraged traders were liquidated for $405 million in the past 24 hours, according to CoinGlass. Bitcoin accounted for $145 million, while ETH made up $98 million.
Bitcoin exchange-traded funds (ETFs) recorded outflows of $163.5 million on Tuesday, snapping a seven-day winning streak.

Key Takeaways
- Micron’s fiscal Q2 2026 results topped forecasts with $23.86 billion in revenue and adjusted EPS of $12.20
- The company’s Q3 2026 revenue projection of approximately $33.5 billion significantly exceeded analyst estimates
- Capital expenditure plans for fiscal 2026 now surpass $25 billion, representing a roughly $5 billion increase from earlier projections
- Shares declined following the earnings announcement as market participants digested the elevated investment requirements
- Analyst sentiment continues overwhelmingly positive, with 34 Buy/Strong Buy recommendations and no Sell ratings according to MarketBeat data
When Micron Technology unveiled its earnings results on March 19, the numbers looked impressive on paper. Yet exceptional revenue performance and unprecedented free cash flow generation couldn’t prevent the shares from sliding, as market attention fixated on substantially increased capital investment requirements.
The memory chip manufacturer reported fiscal second-quarter 2026 revenue reaching $23.86 billion alongside adjusted earnings of $12.20 per share. Management also disclosed that the period concluded with $16.7 billion in cash and investments, representing a company record for free cash flow.
The financial metrics were undeniably strong. However, the forward-looking statements captured market attention — triggering mixed reactions.
Micron projected fiscal Q3 2026 revenue approaching $33.5 billion. This forecast substantially exceeded Wall Street consensus expectations. Management attributed the robust outlook to accelerating demand for high-bandwidth memory (HBM) deployed in artificial intelligence data centers and computing accelerators.
HBM represents the most sought-after product category in memory semiconductors currently. Micron holds position among just three principal global suppliers, alongside Samsung and SK hynix. This concentrated supply landscape has provided support for pricing power and profit margins.
Understanding the Post-Earnings Decline
Notwithstanding the impressive financial performance, Micron shares retreated following the earnings disclosure. The catalyst centered on updated capital spending projections.
Micron announced that fiscal 2026 capital expenditures will now surpass $25 billion, marking an approximately $5 billion elevation from prior guidance. The company explained that expanding clean-room infrastructure and accelerating DRAM manufacturing capacity requires the additional investment to address AI-driven demand.
This represents a recognizable dynamic within semiconductor manufacturing — committing substantial resources to capture demand opportunities while navigating potential oversupply risks if market conditions shift. Memory chip producers have encountered cyclical challenges previously, and market participants retain institutional memory of those episodes.
Another consideration involves the stock’s substantial year-to-date appreciation. Micron had advanced more than 61% during 2026 prior to Thursday’s pullback, building on strong performance throughout 2025. At those valuation levels, profit-taking responses to perceived risks represent predictable market behavior.
Wall Street Maintains Positive Outlook
The analyst community demonstrated unwavering conviction. According to MarketBeat data released March 19, Micron holds five Strong Buy ratings, 29 Buy ratings, and four Hold ratings. Not a single Sell rating appears among tracked analysts.
This represents remarkably uniform bullish positioning. The four Hold recommendations suggest measured caution at prevailing price levels, yet no analysts advocate selling positions.
Price objectives adjusted following the quarterly report as analysts recalibrated their financial models. MarketBeat’s aggregated consensus range established parameters between approximately $425.62 and $446.66.
Subsequently, upward target revisions emerged. Needham elevated its price objective to $500. UBS similarly increased its target while maintaining a Buy recommendation. Both firms emphasized sustainable AI-associated memory demand as the fundamental thesis.
These $500 price targets don’t represent momentum chasing — they embody convictions that Micron’s artificial intelligence growth trajectory extends further than current market pricing reflects.
The investment narrative surrounding the stock has evolved. Questions no longer focus on whether Micron can achieve recovery. Instead, debate centers on whether the organization can sustain growth without excessive capital deployment.
Presently, analysts affirm that capability. With 34 Buy or Strong Buy ratings and zero Sell recommendations in current MarketBeat tracking, Micron remains among the most broadly endorsed equities within the AI semiconductor investment theme.
Shares declined on March 19. The analyst consensus didn’t waver.

Korean traders are pulling XRP off exchanges at a rapid pace, while whale flows signal accumulation seen ahead of past rallies.
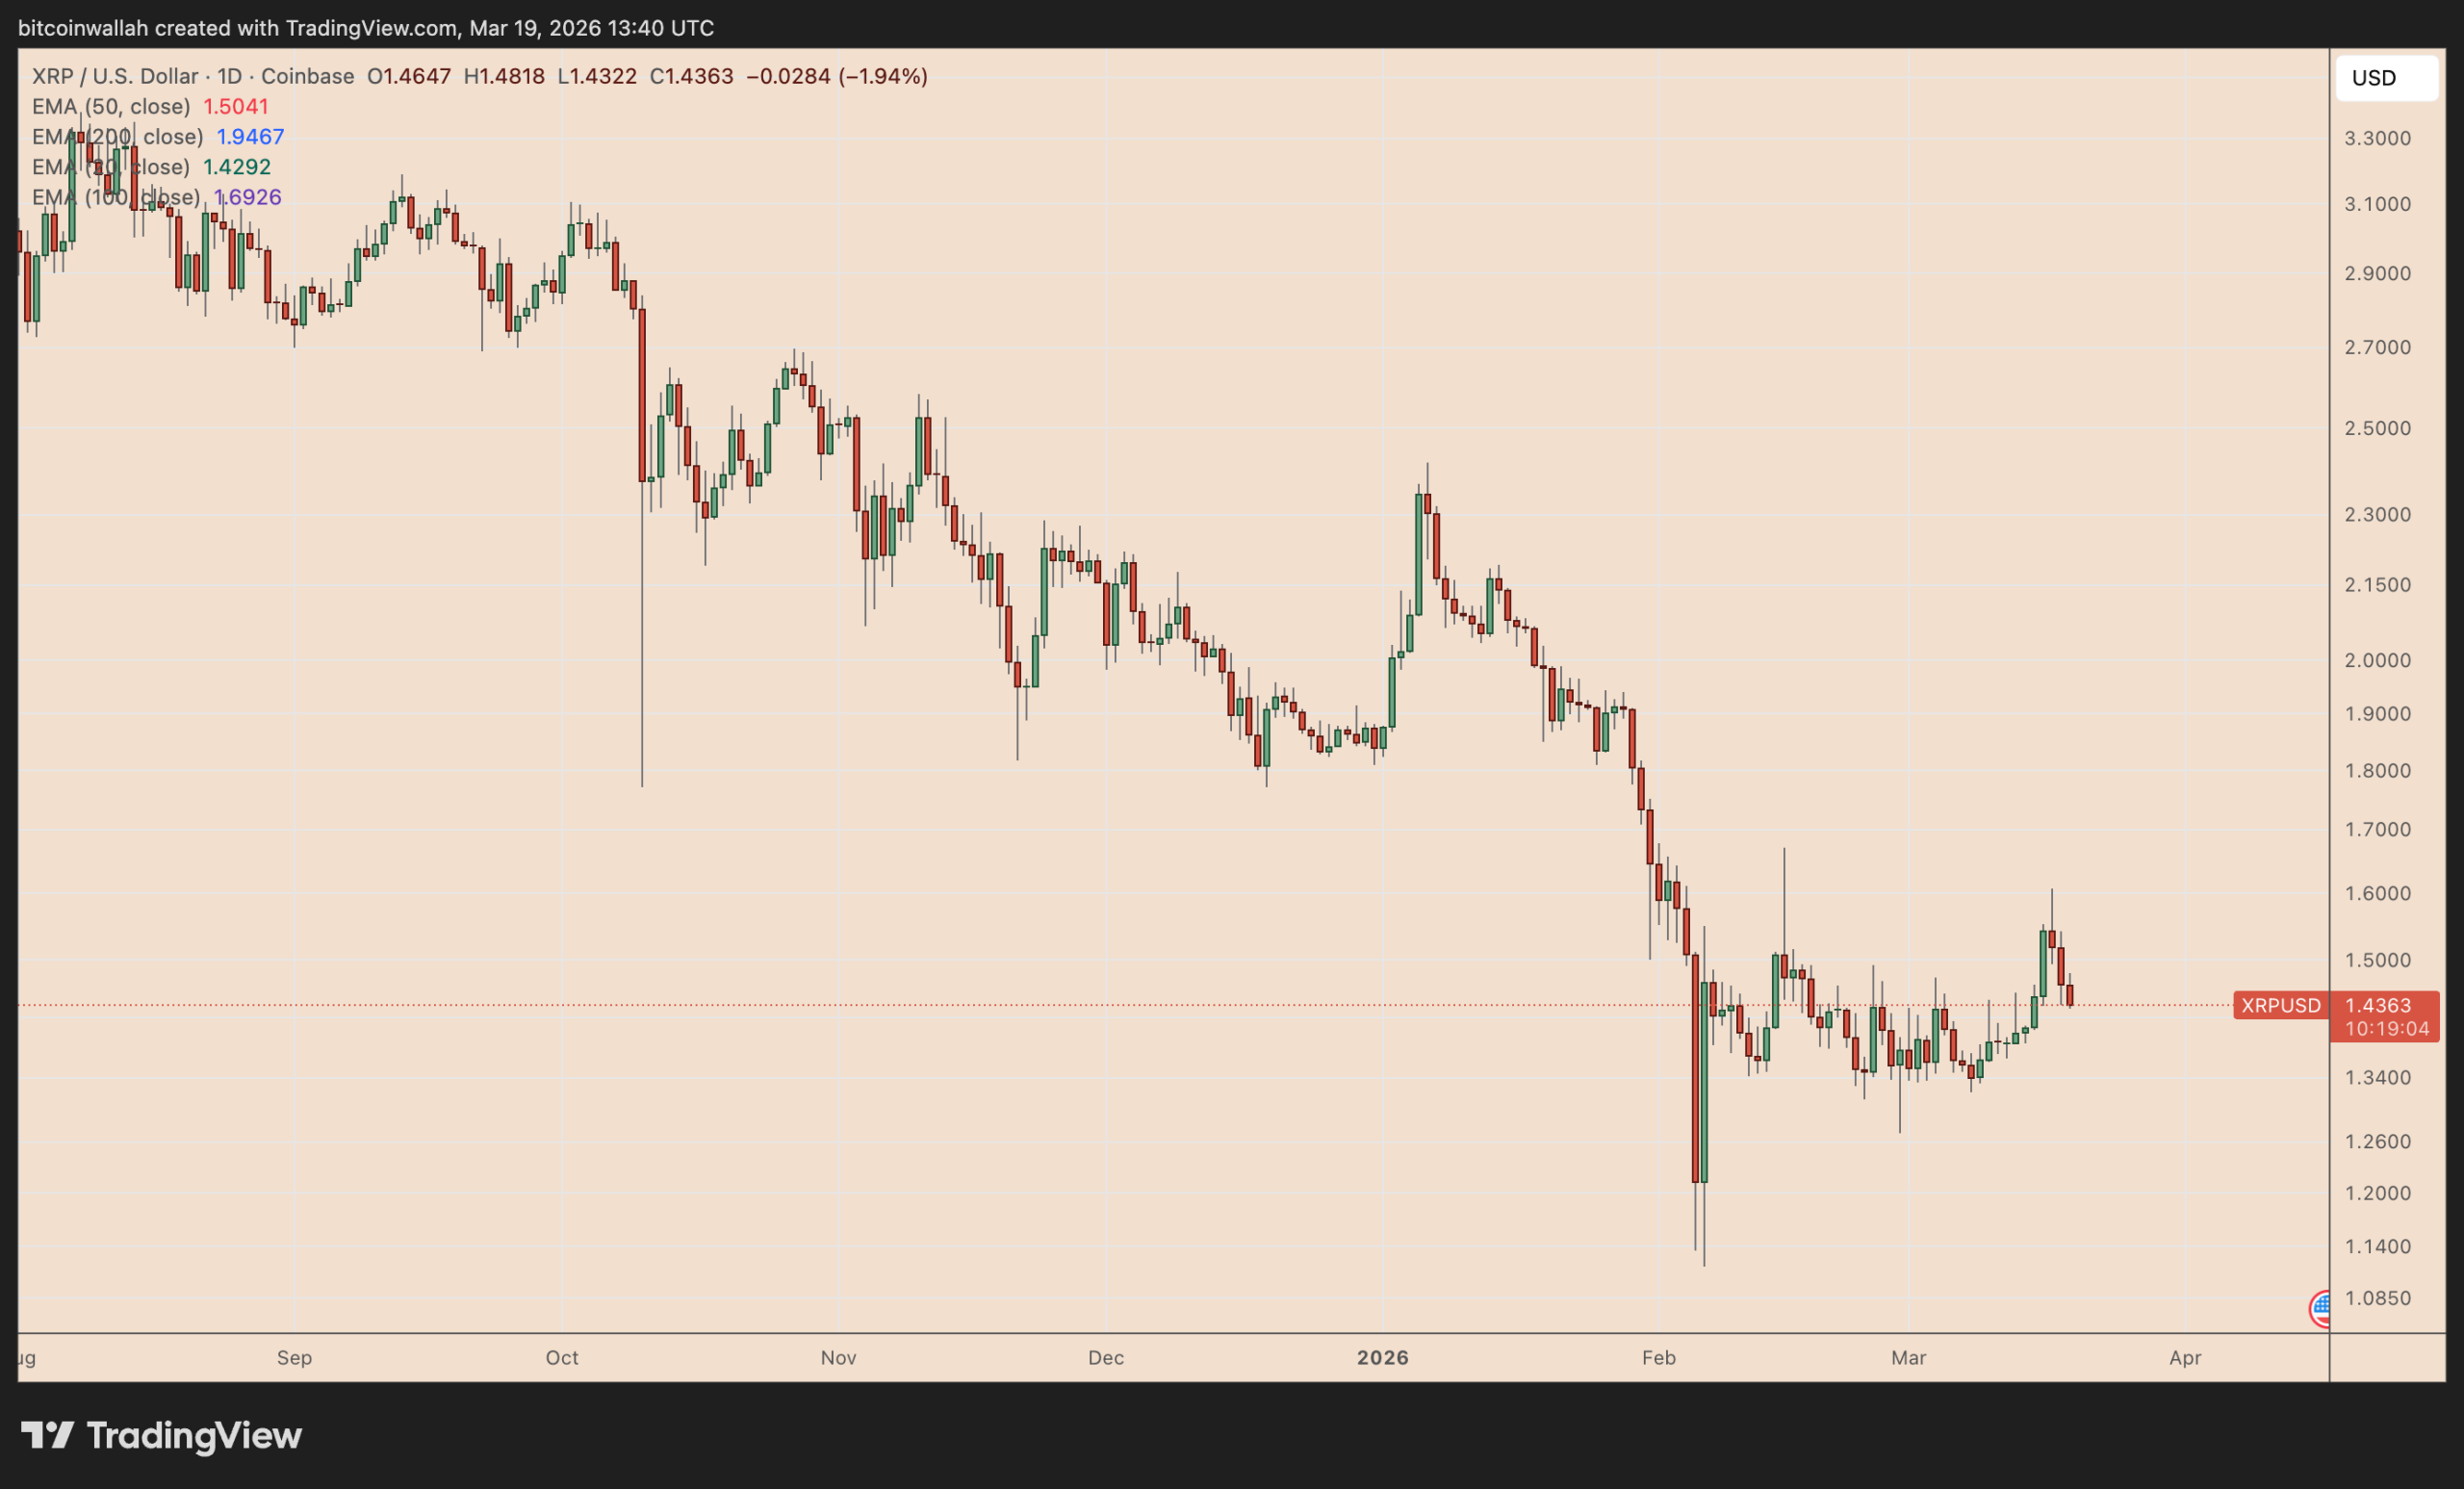
XRP (XRP) has dropped by 10.5% in the past three days, but the decline may be a typical breakout retest within a broader bullish setup, coinciding with a surge in withdrawal activity on Korea’s Upbit exchange.

Key takeaways:
XRP bull flag breakout underway
XRP broke out of its prevailing bull flag pattern last week and was pulling back on Thursday to retest the former upper trendline as new support, a common move after a breakout.

Bull flags form when price consolidates inside a downward-sloping channel following a strong rally. Once price breaks above that channel, the old resistance often becomes support on the retest.
For XRP, that key area is around the mid-$1.40s, also aligning with the 20-day exponential moving average (20-day EMA, the green line).
Holding above it would keep the breakout intact and maintain the bull flag’s upside target near $1.70–$1.72, or about 20% above current levels.
XRP record withdrawals from Upbit
XRP’s bullish technical setup aligns with a recent surge in withdrawal activity on South Korea’s Upbit, according to CryptoQuant data.
Since December 2025, wallets across nearly all size cohorts have steadily moved XRP off exchanges, reducing immediate sell-pressure. This trend is typically associated with accumulation phases.

On-chain analyst CW pointed to a similar structure between 2021 and early 2023, when elevated XRP withdrawals from Korean exchanges coincided with a broader accumulation phase.
That period preceded a sharp rally, with XRP climbing from below $1 to above $3, an increase of roughly 500%.
Related: XRP holders hit a record 7.7M: Will price break through $1.60 next?
Upbit has long been an active trading venue for XRP traders, often serving as a barometer to gauge retail sentiment. As of Thursday, XRP trades in South Korean Won (KRW) were the fourth-largest in a 24-hour rolling period.

XRP whale flows signal renewed accumulation
XRP’s whale activity is also starting to support the bullish case.
As of Thursday, the 90-day average whale flow had turned positive after staying negative for most of 2024 and early 2025, a period that saw persistent large-holder selling.

The latest reversal suggests whales are no longer distributing as aggressively and may be shifting back toward accumulation.
Historically, moves from negative to positive whale flow have appeared during the early stages of trend reversals and accumulation-led consolidations. That includes XRP’s climb to $3.55 from around $2.20 during the April–September 2025 period.
This article does not contain investment advice or recommendations. Every investment and trading move involves risk, and readers should conduct their own research when making a decision. While we strive to provide accurate and timely information, Cointelegraph does not guarantee the accuracy, completeness, or reliability of any information in this article. This article may contain forward-looking statements that are subject to risks and uncertainties. Cointelegraph will not be liable for any loss or damage arising from your reliance on this information.

Key Highlights
- TSEM shares have climbed approximately 14% Thursday and surged over 33% following Monday’s Oriole Networks announcement
- The collaboration targets deterministic, ultra-low latency networks for AI systems leveraging Tower’s silicon photonics capabilities
- Tower introduced its new BCD Gen3 power management solution designed for AI data center applications
- A separate partnership with Salience Labs advances optical circuit switching innovation
- Shares have skyrocketed more than 300% in the trailing twelve months
Tower Semiconductor (TSEM) experienced a substantial rally of approximately 14% during Thursday’s trading session, defying broader market weakness. This upward momentum continues a rally that started early this week following the company’s strategic partnership announcement with Oriole Networks.
Tower Semiconductor Ltd., TSEM
From Monday’s announcement through recent trading, TSEM has advanced more than 33%. The stock most recently traded near $161.90.
The collaboration with Oriole Networks emphasizes deterministic, ultra-low latency networking solutions built upon Tower’s established silicon photonics infrastructure. This technology addresses critical needs in AI systems, where networking performance and efficiency face mounting demands.
During the initial announcement, Oriole CEO James Regan emphasized that AI expansion is compelling the sector to reimagine conventional network designs. “As models scale, traditional architectures encounter an inflexible latency barrier — whereas Oriole’s deterministic, low-latency approach seamlessly overcomes it,” he stated.
The optical networking sector Tower is pursuing could achieve $80 billion in value by decade’s end, based on projections referenced during the partnership announcement.
Power Management Innovation Strengthens Growth Narrative
Alongside the Oriole collaboration, Tower unveiled its BCD Gen3 power management solution this week. This platform addresses AI data center requirements and mobile power applications, with Tower claiming best-in-class LDMOS capabilities.
The introduction establishes Tower’s presence in the AI power management sector, an area experiencing rising demand for efficient, high-capability semiconductor solutions.
Tower reported approximately $1.44 billion in quarterly revenue during its latest period, demonstrating the company’s breadth across diverse semiconductor segments.
Advancing Photonics Innovation with Salience Labs
Tower maintains an ongoing collaboration with Salience Labs centered on optical circuit switching technology — transmitting information via light signals instead of traditional electrical pathways.
This initiative has transitioned from research phases into pre-production stages, based on recent company communications. The approach substitutes conventional electronic switching with photonic architecture, offering enhanced capability for managing data throughput in large-scale AI computing environments.
Combined, the Oriole and Salience collaborations establish Tower’s position across multiple dimensions of AI networking technology.
TSEM has appreciated more than 300% during the past year, positioning it among the top-performing semiconductor stocks over this timeframe.
Thursday’s 14% advance occurred despite weakness across major market indices, highlighting the substantial investor focus generated by the Oriole partnership since Monday’s revelation.

Ryde Group, a Singapore-based ride-hailing and carpool platform listed on the NYSE American, said on Wednesday that it will formalize a crypto treasury strategy for its corporate reserves. The plan contemplates allocating a portion of Ryde’s treasury to Bitcoin (BTC), Ether (ETH), and Solana (SOL), with exact allocations and timing to be determined by a governance team within the company, per its announcement.
The company argues that the evolving macroeconomic environment warrants a more flexible approach to treasury management, and says holding digital assets could offer additional options for optimizing capital and liquidity. Ryde emphasized that its crypto holdings will be stored with a third-party custodian, and that it has established an investment committee to oversee portfolio decisions and a separate risk management committee to ensure safety and regulatory compliance. These governance layers are designed to balance potential upside with prudent oversight.
Ryde’s stock, which trades on the NYSE American, traded down roughly 13% in early Thursday afternoon trading, trimming a year-to-date gain of more than 122% per Yahoo Finance. The company did not immediately respond to a request for comment by publication time.
Historically, Ryde began accepting Bitcoin as an in-app payment method in 2020 and later broadened support to include some altcoins. It remains unclear whether the platform currently accepts cryptocurrency for payments, but RydePay historically allowed users to convert supported cryptocurrencies into Ryde tokens to pay for services on the platform.
The move to crypto treasuries is noteworthy as the broader sector faces mounting headwinds. Industry data cited by Cointelegraph shows that digital-asset treasury firms have struggled with a challenging environment, including a September 2025 multi-asset net asset value (mNAV) collapse that left many treasuries trading below the value of their crypto holdings. In February 2026, monthly inflows into crypto treasury firms slowed to their lowest levels since October 2024, reaching about $555 million for the month. The sector’s fragility is also reflected in corporate actions like GD Culture Group (GDC) authorizing the sale of portions of its Bitcoin reserve to finance a share buyback, and in the challenges faced by Ether-backed treasuries such as BitMine Immersion Technologies, which reported substantial paper losses as Ether prices remained far from its average acquisition price.
Key takeaways
- Ryde Group plans a formal crypto treasury, allocating reserves to BTC, ETH, and SOL, with allocations and timing set by an internal governance team.
- Assets would be held with a third-party custodian, supported by an investment committee and a separate risk management committee to oversee compliance and risk.
- The development follows Ryde’s prior crypto usage for payments (BTC in-app payments started in 2020), though current acceptance for payments is not clearly stated.
- Ryde’s stock fell about 13% in Thursday trading, after a strong year-to-date rally, highlighting the market’s sensitivity to treasury-related disclosures and crypto volatility.
- Industry-wide data show a difficult environment for corporate digital-asset treasuries, with an mNAV collapse in 2025 and subdued inflows in early 2026, alongside corporate strategies to rebalance holdings (e.g., GD Culture Group and Ether treasuries).
Ryde’s treasury pivot and the path forward for corporate crypto strategies
Ryde’s announcement positions the company within a growing, albeit cautious, cohort of corporate treasuries embracing digital assets as part of their capital management playbooks. By formalizing a governance-driven framework, Ryde aims to navigate crypto volatility while seeking potential upside from long-hold assets like BTC, ETH, and SOL. The use of a custodian and dedicated governance structures points to a desire for regulatory compliance and risk containment, two features that have separated blue-chip treasuries from opportunistic trades in the sector.
Analysts and investors will want to watch several developments in the coming quarters. First, the allocation mix and the size of the crypto position will indicate how aggressively Ryde leans into digital assets relative to traditional cash holdings. Second, governance and risk-management processes will be tested as crypto markets move through cycles of volatility and regulatory inquiry. Finally, the company’s broader treasury strategy could influence investor sentiment around Ryde’s balance sheet resilience and capital allocation priorities in a sector where market dynamics and macro factors can trigger rapid revisions in corporate crypto plans.
Industry backdrop: what the broader market is telling treasuries
The trajectory of corporate digital-asset treasuries in 2025–2026 has been a study in contrasts. After a period of rapid expansion, the sector experienced a notable mNAV collapse in September 2025, with several treasuries trading below the net value of their crypto holdings. In February 2026, monthly inflows into crypto-treasury products slowed to about $555 million—the lowest since October 2024—signaling tighter appetite among corporate treasuries despite renewed interest in blockchain-enabled treasury solutions. This environment has also seen firms take measured actions, such as GD Culture Group authorizing the sale of Bitcoin reserves to finance a share-repurchase program, while others grapple with unrealized losses tied to ether prices in the market.
Observers emphasize that these conditions complicate the decision to deploy capital into crypto while underscoring the importance of robust governance, transparent reporting, and clear regulatory alignment for corporate treasuries. The Ryde move, if executed with discipline, could serve as a case study in how mid-cap, non-crypto-specific companies approach digital assets as part of a broader treasury strategy rather than as a speculative bet.
For readers, the next milestones to monitor include the specific asset allocations Ryde approves, the cadence of rebalancing, and the outcomes of its risk-management oversight. The evolving regulatory framework around corporate crypto holdings and the development of custodian standards will also shape how aggressively other non-crypto firms contemplate digital-asset treasuries in the future.
Sources linked in coverage and sector data provide a broader context for Ryde’s move: the company’s own announcement on the crypto-treasury shift, public stock-trading records such as Yahoo Finance for Ryde’s share movement, and sector analysis detailing mNAV developments and inflows data from Cointelegraph-reported industry metrics and CoinGecko-tracked treasury charts. These inputs help frame the decision as part of a wider re-examination of how companies balance risk, liquidity, and potential upside in a volatile macro environment.
What remains uncertain is how Ryde will calibrate its crypto exposure over time, how it will adapt to any regulatory changes, and what this means for user payments and partner ecosystems if the strategy yields meaningful reserve-driven flexibility. Investors and industry watchers will be paying close attention to whether Ryde’s framework can deliver tangible treasury resilience without compromising financial stability.


Animoca Brands has made a strategic investment in Ava Labs and entered a partnership to support projects building on the Avalanche blockchain, focusing on capital deployment, advisory support and expansion in Asia and the Middle East.
According to Thursday’s announcement by the Hong Kong-based Web3 company, the collaboration will target sectors including real-world assets, digital identity and entertainment, with Animoca providing business development support and access to regional networks to help Avalanche-based projects scale and reach institutional users.
Projects pursued under the partnership may also tap into the broader ecosystem of portfolio companies, Animoca said.
The effort is aimed at strengthening Avalanche’s position in markets where digital asset activity is growing, particularly by supporting deployments that require scalable infrastructure and compatibility with existing blockchain standards.
Animoca will also work with Avalanche developers on product integrations and funding opportunities, with an initial focus on projects seeking to launch and expand in the Middle East and Asia.
The initiative centers on connecting builders with capital and distribution channels, particularly for use cases such as tokenized assets and identity systems that target institutional and government-backed deployments.
Animoca Brands manages a portfolio of more than 600 blockchain projects, according to the company. In February, it secured a Virtual Asset Service Provider license from Dubai’s Virtual Assets Regulatory Authority, allowing it to expand crypto services in the region.
Ava Labs is a blockchain development company and core contributor to the Avalanche network, a layer 1 blockchain designed for high-speed, low-cost applications, with its native token AVAX (AVAX) used for transactions, staking and securing the network.
Neither company disclosed the size of the investment or specific projects that will receive funding under the initiative.
Related: VanEck expands crypto ETF lineup with spot Avalanche product
Hong Kong emerges as a regulated crypto hub
The expansion comes as Hong Kong, a special administrative region of China, continues to position itself as a digital asset hub.
In 2023, the city introduced a new licensing regime requiring crypto trading platforms to register with the Securities and Futures Commission, opening the door to regulated retail access under stricter investor protection rules.
In April 2024, Hong Kong approved its first spot Bitcoin (BTC) and Ether (ETH) exchange-traded funds, and in October 2025 okayed a spot Solana (SOL) ETF, becoming one of the first markets to do so ahead of the United States.
The city’s push into digital assets has since broadened beyond trading, with authorities and financial institutions advancing initiatives across stablecoins, tokenized bonds and blockchain-based trade finance.
In February, officials said a new digital asset platform would support the issuance and settlement of tokenized bonds, with plans to connect it to regional tokenization infrastructure and extend it to other assets.
Earlier this month, Hong Kong and Shanghai authorities agreed to collaborate on blockchain-based trade finance and cargo data, exploring a cross-border platform for digitizing trade documentation under the HKMA’s Project Ensemble initiative.
Magazine: Are DeFi devs liable for the illegal activity of others on their platforms?
Crypto World
DeepSnitch AI Price Prediction 2026: Why Analysts Are Calling 300x to 500x Before March 31

S&P Dow Jones Indices just licensed the S&P 500 to a crypto platform so traders can trade the world’s most-watched stock index on Hyperliquid 24 hours a day without touching a traditional stock exchange.
For traders who understand that move, the DeepSnitch AI price prediction story makes more sense than it ever has, because the tools that help you navigate a market that never sleeps are super important.
DeepSnitch AI is already running five live AI surveillance tools before the presale has even closed. River and QNT round out this list as two of the strongest cycle ROI plays for traders who want fundamental exposure alongside the parabolic entry.

The S&P 500 went on-chain 24/7
On March 18, S&P Dow Jones gave permission to Trade[XYZ] to use the S&P 500, so they can launch a perpetual futures version of it on the Hyperliquid blockchain.
The S&P 500 used to be something you could only trade during NYSE hours. Now it is a 24/7 on-chain position sitting next to your crypto portfolio, settling in stablecoins, with no broker in the middle.
And in a market that operates around the clock across both equities and crypto, the tools that tell you whether a contract is malicious before you sign it, where the whale money is moving in real time, and what the risk profile on a new token looks like before you size in are super important.
That is exactly the problem the DeepSnitch AI token forecast is built around solving, and the presale that gives traders access to those tools closes March 31 with no extension.
DeepSnitch AI price prediction: The only presale running live AI tools before listing
The current DeepSnitch AI price prediction from analysts sits at 300x to 500x from the presale entry price of $0.04487, and the case for that range is not built on hype, it is built on the fact that five AI surveillance tools are already running for traders every day before a single token has traded on a public exchange.
SnitchFeed helps you track whale activity in real time, so you see accumulation before the crowd catches on. AuditSnitch checks contracts before you approve anything, adding a layer of protection against rugs. SnitchGPT simplifies on-chain research, giving you clear data so you actually know what you are buying.
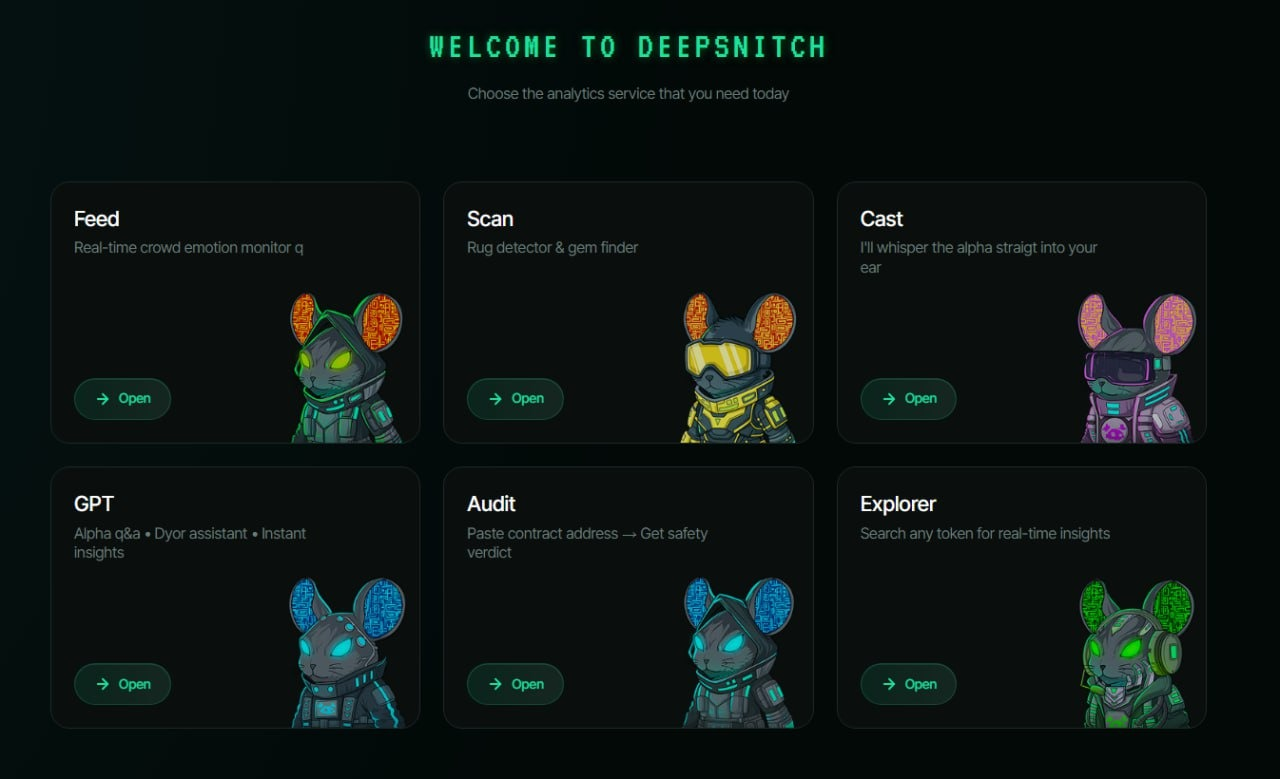
SnitchCast keeps you updated with live market insights, so you are never entering trades blind. Token Explorer breaks down any token in seconds, showing risk, holders, and liquidity before you put money in.
On top of that, the entire platform has been rebuilt for speed and clarity, so you can move fast under pressure without missing key information.
Over $2 million raised and early holders already sitting on 197% gains before the Uniswap listing has even opened, giving this presale a foundation that most traders spend entire cycles looking for and never find at this price.
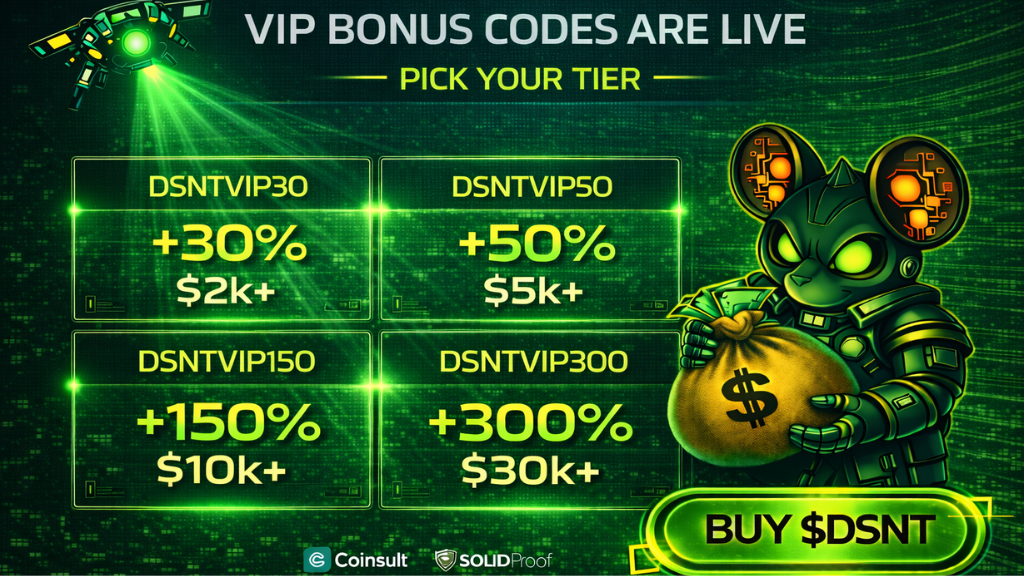
At $0.04487, the entry math is still working heavily in your favor, because your $15,000 through the 150% checkout bonus builds 835,748 $DSNT tokens in your wallet today. At the 300x analyst projection, that position is worth over $11.2 million.
Quant (QNT) price update for 2026
For a Deepsnitch AI price forecast trader looking for a foundational cycle hold with genuine enterprise traction behind it, QNT deserves a serious look right now.
QNT trades around $75 on March 19, down significantly from its all-time high of $428 reached in September 2021, and the 2026 price range puts the high at $280 from a current entry that is still well below the prior peak.
If you want a cycle hold with real government-level institutional adoption already confirmed and a fixed maximum supply of just 14.6 million tokens, QNT at current levels is one of the more asymmetric infrastructure plays available before the broader market connects those dots.
River (RIVER) price update for 2026
RIVER trades around $27 on March 19, down 71% from its all-time high of $87.73, and has already posted a 95% gain in the prior seven days against a broader market that moved just 2%, signalling that capital is beginning to rotate into the chain-abstraction narrative before the retail crowd recognises the setup.
The 2026 target sits at $50.38 and the long-term case for returning toward the $90 to $110 range depends on satUSD adoption across chains continuing at the current pace.
Bottom line
QNT sitting around $75 with CBDC pilots tied to big players like Barclays, HSBC, and the ECB, plus a tight supply, makes it a solid long-term hold. Some are even eyeing a $280 target for 2026.
RIVER at $27 is getting attention too, with satUSD expanding across multiple chains, a confirmed Justin Sun investment, and a strong 7-day run while the rest of the market stayed flat. It’s one of those early narrative plays traders like to catch before it gets crowded.
Both are legit holds with real backing. But they are already out there trading. No presale window, no bonus stacking, and no early-stage edge like getting in before everything goes live.
The DeepSnitch AI price prediction story is still at $0.04487 and March 31 is the close that locks that entry out permanently.
Go to the official DeepSnitch AI presale website, lock in your entry today, and follow X and Telegram to catch the listing as it happens.
FAQs
What is the DeepSnitch AI price prediction analysts are putting out ahead of the March 31 presale close?
The DeepSnitch AI price prediction sits at 300x to 500x from the $0.04487 presale price, backed by five live AI tools already running daily, dual audits from Coinsult and SolidProof, and 197% gains already confirmed for early holders before listing.
Is the DeepSnitch AI coin price prediction realistic, given that QNT and River are also bullish plays this cycle?
The DeepSnitch AI coin price prediction of 300x to 500x is grounded in a presale entry price that closes permanently on March 31, while QNT and River, both solid cycle plays, but neither offers the asymmetric ground floor math that $DSNT delivers before the Uniswap listing opens.
How does the DeepSnitch AI price forecast compare to holding QNT or River into the 2026 cycle?
QNT and River both are credible 2x to 13x plays, but the DeepSnitch AI price forecast of 300x to 500x from $0.04487 is on a completely different scale for traders who want the parabolic entry and can act before March 31.
Disclaimer: This is a Press Release provided by a third party who is responsible for the content. Please conduct your own research before taking any action based on the content.
Crypto World
Coinbase Commerce seed phrase page alarms security community ahead of March 31 shutdown


Coinbase Commerce’s seed phrase withdrawal page is drawing fierce criticism from security researchers, who warn it normalizes typing 12-word recovery phrases into a website just days before the March 31 shutdown deadline.
Summary
- A Coinbase Commerce subdomain at withdraw.commerce.coinbase.com/seed-phrase asks merchants to type 12-word seed phrases into a plain-text web form to recover funds.
- SlowMist’s Cos, CISO 23pds and on-chain sleuth ZachXBT say the page and its cloneable front end create a powerful phishing template, especially as Commerce is wound down into Coinbase Business by March 31, 2026.
- Critics argue the flow trains users to ignore the industry rule to never enter a seed phrase online, reviving fears after earlier Coinbase impersonation scams stole about $2 million from users.
A subdomain page belonging to Coinbase Commerce — the company’s merchant payments product — has drawn sharp criticism from leading blockchain security researchers after it was found to be prompting users to enter their 12-word seed phrases, also known as mnemonic or recovery phrases, directly into a web form in plain text. The controversy erupted on Wednesday and intensified Thursday morning, with the discovery coming at a particularly sensitive moment: Coinbase is winding down Commerce entirely by March 31, 2026, as part of a broader platform consolidation under Coinbase Business — meaning tens of thousands of merchants have a narrow window to withdraw their funds.
The page in question, hosted at withdraw.commerce.coinbase.com/seed-phrase, was referenced in a now-deleted Coinbase Commerce help document that directed users to recover funds by importing their recovery phrases into compatible wallets such as Coinbase Wallet or MetaMask. SlowMist founder Yu Xian (known online as Cos) described the practice as demonstrating an “unbelievable lack of security awareness” from a major industry player, having received multiple user reports about the page. On-chain investigator ZachXBT independently flagged the page, warning that its existence creates a direct attack surface for social engineering campaigns targeting Coinbase users.
The concerns go beyond the page itself. SlowMist’s Chief Information Security Officer, known as 23pds, escalated the alarm by pointing out that the page’s sitemap contains structural flaws that make it trivially easy for malicious actors to replicate. Using tools such as ResourcesSaver, attackers can download the front-end code and deploy visually identical phishing sites — particularly dangerous when combined with Coinbase-lookalike domains that could credibly deceive even experienced users.
The fundamental problem is one of normalisation. Every legitimate security protocol in the cryptocurrency industry is built on a single, non-negotiable principle: a seed phrase should never be entered into any website, form, or app under any circumstances — not even an official one. Seed phrases are the master cryptographic keys to a wallet; whoever possesses them owns the funds. By building a recovery workflow that requires users to type their phrase into a browser, Coinbase has — whether intentionally or through oversight — trained users to accept a behaviour that scammers routinely exploit. Coinfomania noted that the tool even suggests copying phrases from Google Drive as an intermediate step, compounding the risk.
ZachXBT’s warning carries particular weight given his track record. In January 2026, he exposed a Coinbase support impersonation scam that resulted in approximately $2 million in stolen crypto — a scheme that relied on users being conditioned to trust Coinbase-branded interfaces. The Commerce seed phrase page represents a ready-made template for a follow-up attack of potentially far greater scale.
As of Thursday, Coinbase had not publicly responded to the criticism, despite multiple requests for comment. The company has offered alternative withdrawal methods — including a separate commerce withdrawal tool considered safer by researchers — but has not removed or modified the seed phrase page. With twelve days remaining until Commerce is permanently disabled, the pressure on the exchange to act is mounting rapidly. For the crypto industry’s most prominent publicly listed company, the reputational stakes of a mass phishing event triggered by its own migration tooling could scarcely be higher.
Fidelity Imports and Playback Distribution Head to the Great White North With True North Distribution Launch in Canada
TikTok ‘mum on the run’ who bragged about UK benefits jailed in Thailand for drug offences

RCI Hospitality Holdings, Inc. (RICK) Q4 2025 Earnings Call Transcript

Smart energy pays enters the US market, targeting scalable financial infrastructure

Why Israel is blocking foreign journalists from entering

Bitcoin: We’re Entering The Most Dangerous Phase

How to Build a Career in Core Finance | Best Courses to Build a Career in Core Finance | TWSS

Rs.12,000 Per Acre Financial Aid for Farmers Under Rythu Bharosa Scheme | Latest updates | DAR FOCUS

PAKE LOT KECIL KAPAN KAYANYA? #belajarforex #forex #bitcoingold #tradingcuan #cryptocurrency
-
 Crypto World6 days ago
HYPE Token Enters Net Deflation as HyperCore Buybacks Outpace Staking Rewards
-

 Tech4 days ago
Your Legally Registered ‘Motorcycle’ Might Not Count Under Proposed US Law
-

 Fashion6 days ago
Weekend Open Thread: Addict Lip Glow
-
 Tech2 days ago
Are Split Spacebars the Next Big Gaming Keyboard Trend?
-
Sports5 days ago
Why Duke and Michigan Are Dead Even Entering Selection Sunday
-

 Business4 days ago
Search for Savannah Guthrie’s Mother Enters Seventh Week with No Arrests
-

 Business5 days ago
US Airports Launch Donation Drives for Unpaid TSA Workers as Partial Government Shutdown Enters Fifth Week
-
Crypto World5 days ago
Coinbase and Bybit in Investment Talks: Could Bybit Finally Enter the US Crypto Market?
-

 Business4 days ago
Australian shares drop as Iran war enters third week
-

 Business6 days ago
Country star Brantley Gilbert enters growing non-alcoholic beer market
-

 Crypto World4 days ago
Crypto Lender BlockFills Enters Chapter 11 with Up to $500M in Liabilities
-

 Sports6 days ago
College Basketball Best Bets: Conference Tournament Semifinal Picks
-

 Politics2 days ago
The House | The new register to protect children from their abusers shows Parliament at its best
-

 Fashion4 days ago
25 Celebrities with Curly Hair That Are Naturally Beautiful
-

 News Videos1 day ago
RBA board divided on rate cut, unusually buoyant share market | Finance Report | ABC NEWS
-

 Crypto World1 day ago
Canada’s FINTRAC revokes registrations of 23 crypto MSBs in AML crackdown
-

 Crypto World5 days ago
Crypto Losses Drop 87% in February, But Hackers Are Now Targeting People, Not Code
-
 Politics2 days ago
Real-time pollution monitoring calls after boy nearly dies
-
 NewsBeat1 day ago
Residents in North Lanarkshire reminded to register to vote in Scottish Parliament Election
-

 Business3 days ago
Meta planning major layoffs as AI spending and automation reshape workforce


You must be logged in to post a comment Login