
Crypto World
S&P 500 Analysis: Index Falls to Year-to-Date Low
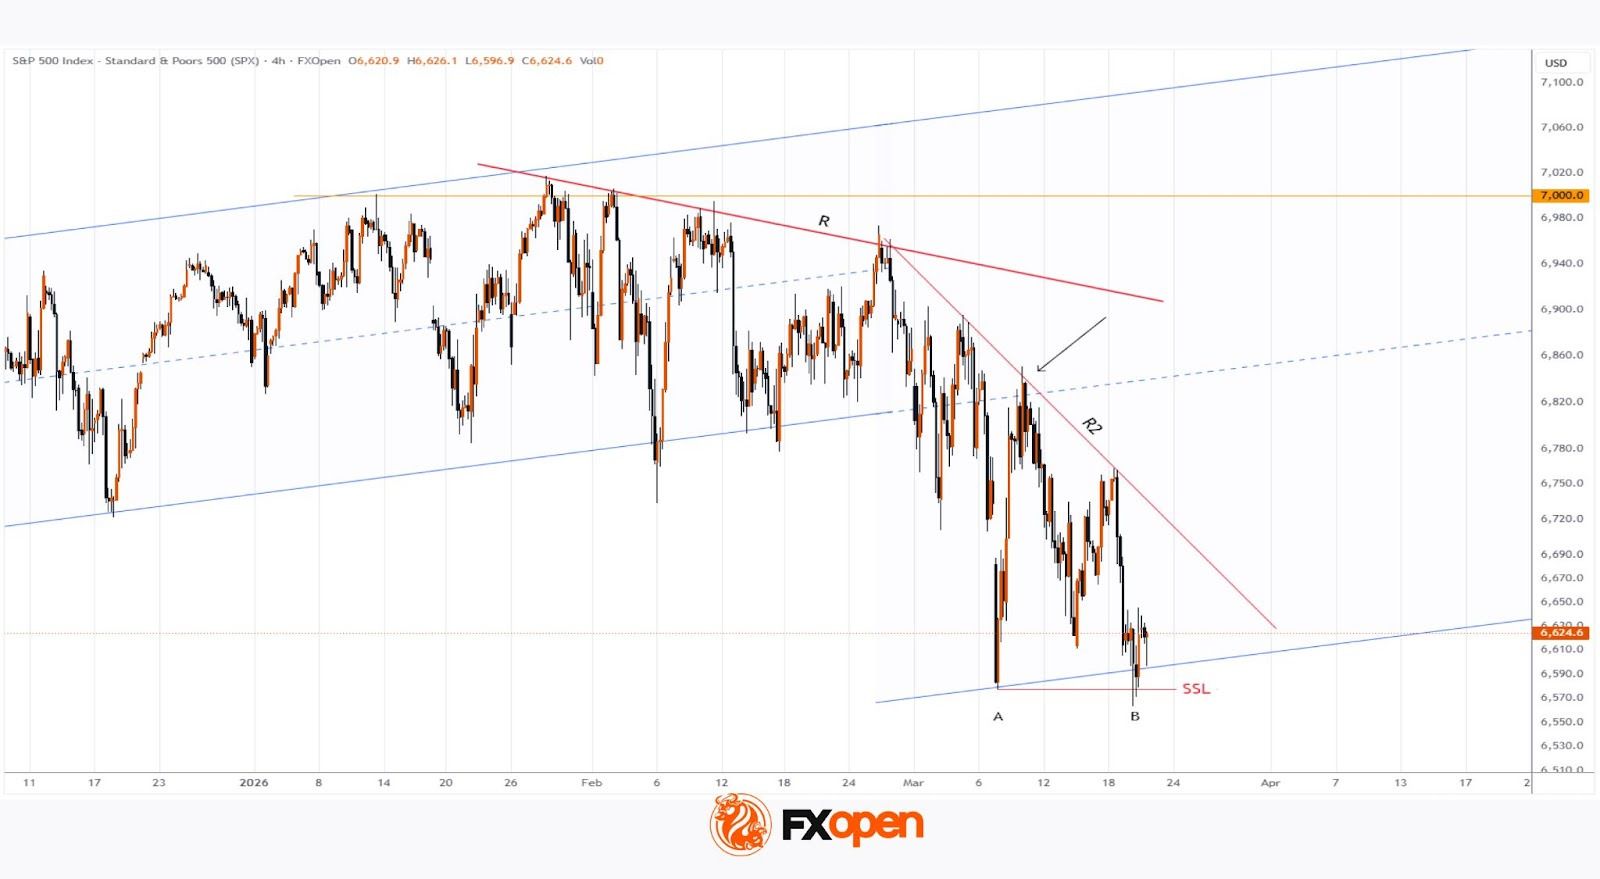
As the S&P 500 chart (US SPX 500 mini on FXOpen) shows, the index dropped below the 6,570 level yesterday for the first time in 2026. As a result, the equity market may be on track to post a fourth consecutive weekly decline, closing below its 200-day moving average.
Why Are Equities Falling?
Bearish sentiment is likely being driven by the ongoing military conflict in the Middle East:
→ Elevated oil prices are fuelling expectations of a renewed inflationary surge. This suggests the Federal Reserve will keep interest rates higher for longer (as reinforced by Powell’s remarks this week), putting pressure on both the economy and corporate performance.
→ Investors are also concerned that the United States could become drawn into a prolonged conflict with Iran, which may pose significant challenges for the country, despite efforts by officials to calm market sentiment.
According to Trading Economics:
→ US President Donald Trump stated that the US is not considering deploying ground troops to the Middle East;
→ Treasury Secretary Scott Bessent noted that the Iranian regime could face internal collapse;
→ Israeli Prime Minister Benjamin Netanyahu said Israel may refrain from further strikes on Iran’s energy infrastructure, suggesting the conflict could end sooner than expected.

Technical Analysis of the S&P 500
On 11 March, we analysed the index chart and noted that the lower boundary of the broader channel was acting as support (point A), while the median line served as resistance (as indicated by the arrow).
Since then, selling pressure has led to:
→ the formation of a steeper descending trendline (R2);
→ a move down to a new low at point B, below the previously mentioned channel boundary.
From a Smart Money Concepts perspective, it is reasonable to assume that price has entered a Sell-Side Liquidity zone. If so, traders should consider the possibility that the recent bearish breakout below the channel may prove to be false. In that case, the S&P 500 could stage a recovery in the coming sessions, potentially moving back towards the R2 trendline.
Trade global index CFDs with zero commission and tight spreads (additional fees may apply). Open your FXOpen account now or learn more about trading index CFDs with FXOpen.
This article represents the opinion of the Companies operating under the FXOpen brand only. It is not to be construed as an offer, solicitation, or recommendation with respect to products and services provided by the Companies operating under the FXOpen brand, nor is it to be considered financial advice.


Ledger has appointed a new chief financial officer and opened a New York office as the crypto security firm expands its U.S. presence ahead of a planned public listing.
The company said John Andrews, a former Circle (CRCL) executive, will take on the CFO role. Andrews spent more than two decades in finance and most recently led capital markets and investor relations at the stablecoin issuer. His appointment comes as Ledger positions itself for closer engagement with institutional investors and public markets.
The New York office, backed by a multi-million dollar investment, will serve as a hub for Ledger’s enterprise business. The firm is hiring across institutional and marketing roles as it builds out services for banks, asset managers and other financial firms entering digital assets.
Ledger said the move reflects growing demand for secure infrastructure as more institutions hold and manage crypto.
The expansion lands as Ledger explores an initial public offering in the United States. The company is reportedly working with major banks including Goldman Sachs, Jefferies and Barclays on a listing that could value the firm at more than $4 billion. CEO Pascal Gauthier has previously pointed to rising revenue tied to an increase in crypto hacks, which has driven demand for secure storage.
Ledger is best known for its hardware wallets, but it has pushed deeper into enterprise services in recent years. Its platform offers tools for institutions to store, manage and trade digital assets with internal controls, similar to how a bank might oversee client funds across multiple approvals.
The company says it secures a large share of retail-held stablecoins and has sold more than 8 million devices globally. Still, its track record includes setbacks. A 2020 data breach exposed customer information, and a later exploit in 2023 affected decentralized finance integrations tied to its ecosystem.
Ledger’s U.S. push follows a broader shift in the crypto sector, where firms are again testing public markets after a volatile period. Custodian BitGo (BTGO) recently went public, marking one of the first listings in the sector this year. Tokenization firm Securitize has plans to IPO as soon as it receives the green light from regulators. Meanwhile, crypto exchange Kraken has paused its IPO plans as it waits for better market conditions, CoinDesk reported earlier this week.

Key Takeaways
- Jefferies elevated SolarEdge from Underperform to Hold while increasing the price target from $30 to $49
- European TTF natural gas prices have jumped approximately 94% amid recent geopolitical tensions
- During the previous energy crisis, SolarEdge’s European sales expanded from $630M in 2020 to $1.9B by 2023
- The firm boosted its 2027 and 2028 revenue projections by 17% and 19% respectively
- SEDG shares have surged roughly 60% year-to-date, approaching the 52-week peak of $48.60
SolarEdge (SEDG) shares advanced approximately 4% during Friday’s premarket session following an analyst upgrade and improved price outlook from Jefferies.
SolarEdge Technologies, Inc., SEDG
Jefferies shifted its stance on SEDG from Underperform to Hold while boosting the price objective from $30 to $49 — representing approximately 7.3% potential upside from Thursday’s closing price.
The catalyst behind Jefferies’ revised outlook centers on energy market dynamics. Natural gas prices in Europe, measured by the TTF benchmark, have climbed roughly 94% since the onset of the latest Middle Eastern conflict. Such dramatic price increases historically incentivize consumers and enterprises to transition toward solar and energy storage solutions as hedges against volatile energy expenses.
This scenario has played out previously. During 2022, when Russian natural gas supply disruptions triggered soaring European energy costs, solar installations accelerated significantly. SolarEdge‘s revenue from European markets expanded from $630 million in 2020 to $1.9 billion by 2023.
Jefferies acknowledges that a complete replay of that surge seems unlikely. Europe’s renewable energy infrastructure has matured considerably, and electricity prices have remained comparatively stable despite rising gas costs. Any uptick in demand will likely be more gradual this time around.
Nevertheless, the investment firm believes SolarEdge is better positioned than before. Inventory adjustments that previously pressured financial performance have largely resolved, and SEDG has expanded its footprint in commercial and industrial segments while maintaining residential market share.
Updated Revenue Projections
Jefferies increased its revenue expectations for 2027 by 17% and for 2028 by 19%. The 2026 forecast remained essentially flat, with the firm noting continued customer hesitancy amid prevailing macroeconomic uncertainty.
Despite the upgrade, Jefferies refrained from issuing a Buy recommendation. Valuation concerns remain central to this cautious stance. SEDG has rallied approximately 60% in 2026 thus far and currently trades around 18x projected 2027 EV/EBITDA — marginally above comparable companies. Jefferies suggests the market has already incorporated expectations of improved demand and competitive positioning into current pricing.
The wider analyst community maintains a reserved posture. Among 25 analysts tracking SEDG, just one recommends buying, 18 rate it a Hold, and six suggest selling. MarketBeat’s consensus lands at “Reduce” with an average price target of $29.09 — substantially below current trading levels.
Latest Quarterly Performance
SolarEdge’s latest quarterly results exceeded Wall Street expectations. The company reported EPS of -$0.14, surpassing the consensus estimate of -$0.19. Revenue reached $333.8 million against forecasts of $330.3 million, marking a 70.9% year-over-year increase.
Net margin remains in negative territory at -34.23%, and analysts anticipate full-year EPS of -$4.54 for the current fiscal period.
Institutional investors control approximately 95% of outstanding shares. Multiple major stakeholders expanded their holdings in recent quarters, with UBS Group notably increasing its position by 234.8% during Q3.
SEDG commenced Friday trading at $45.66, marginally below its 52-week high of $48.60.

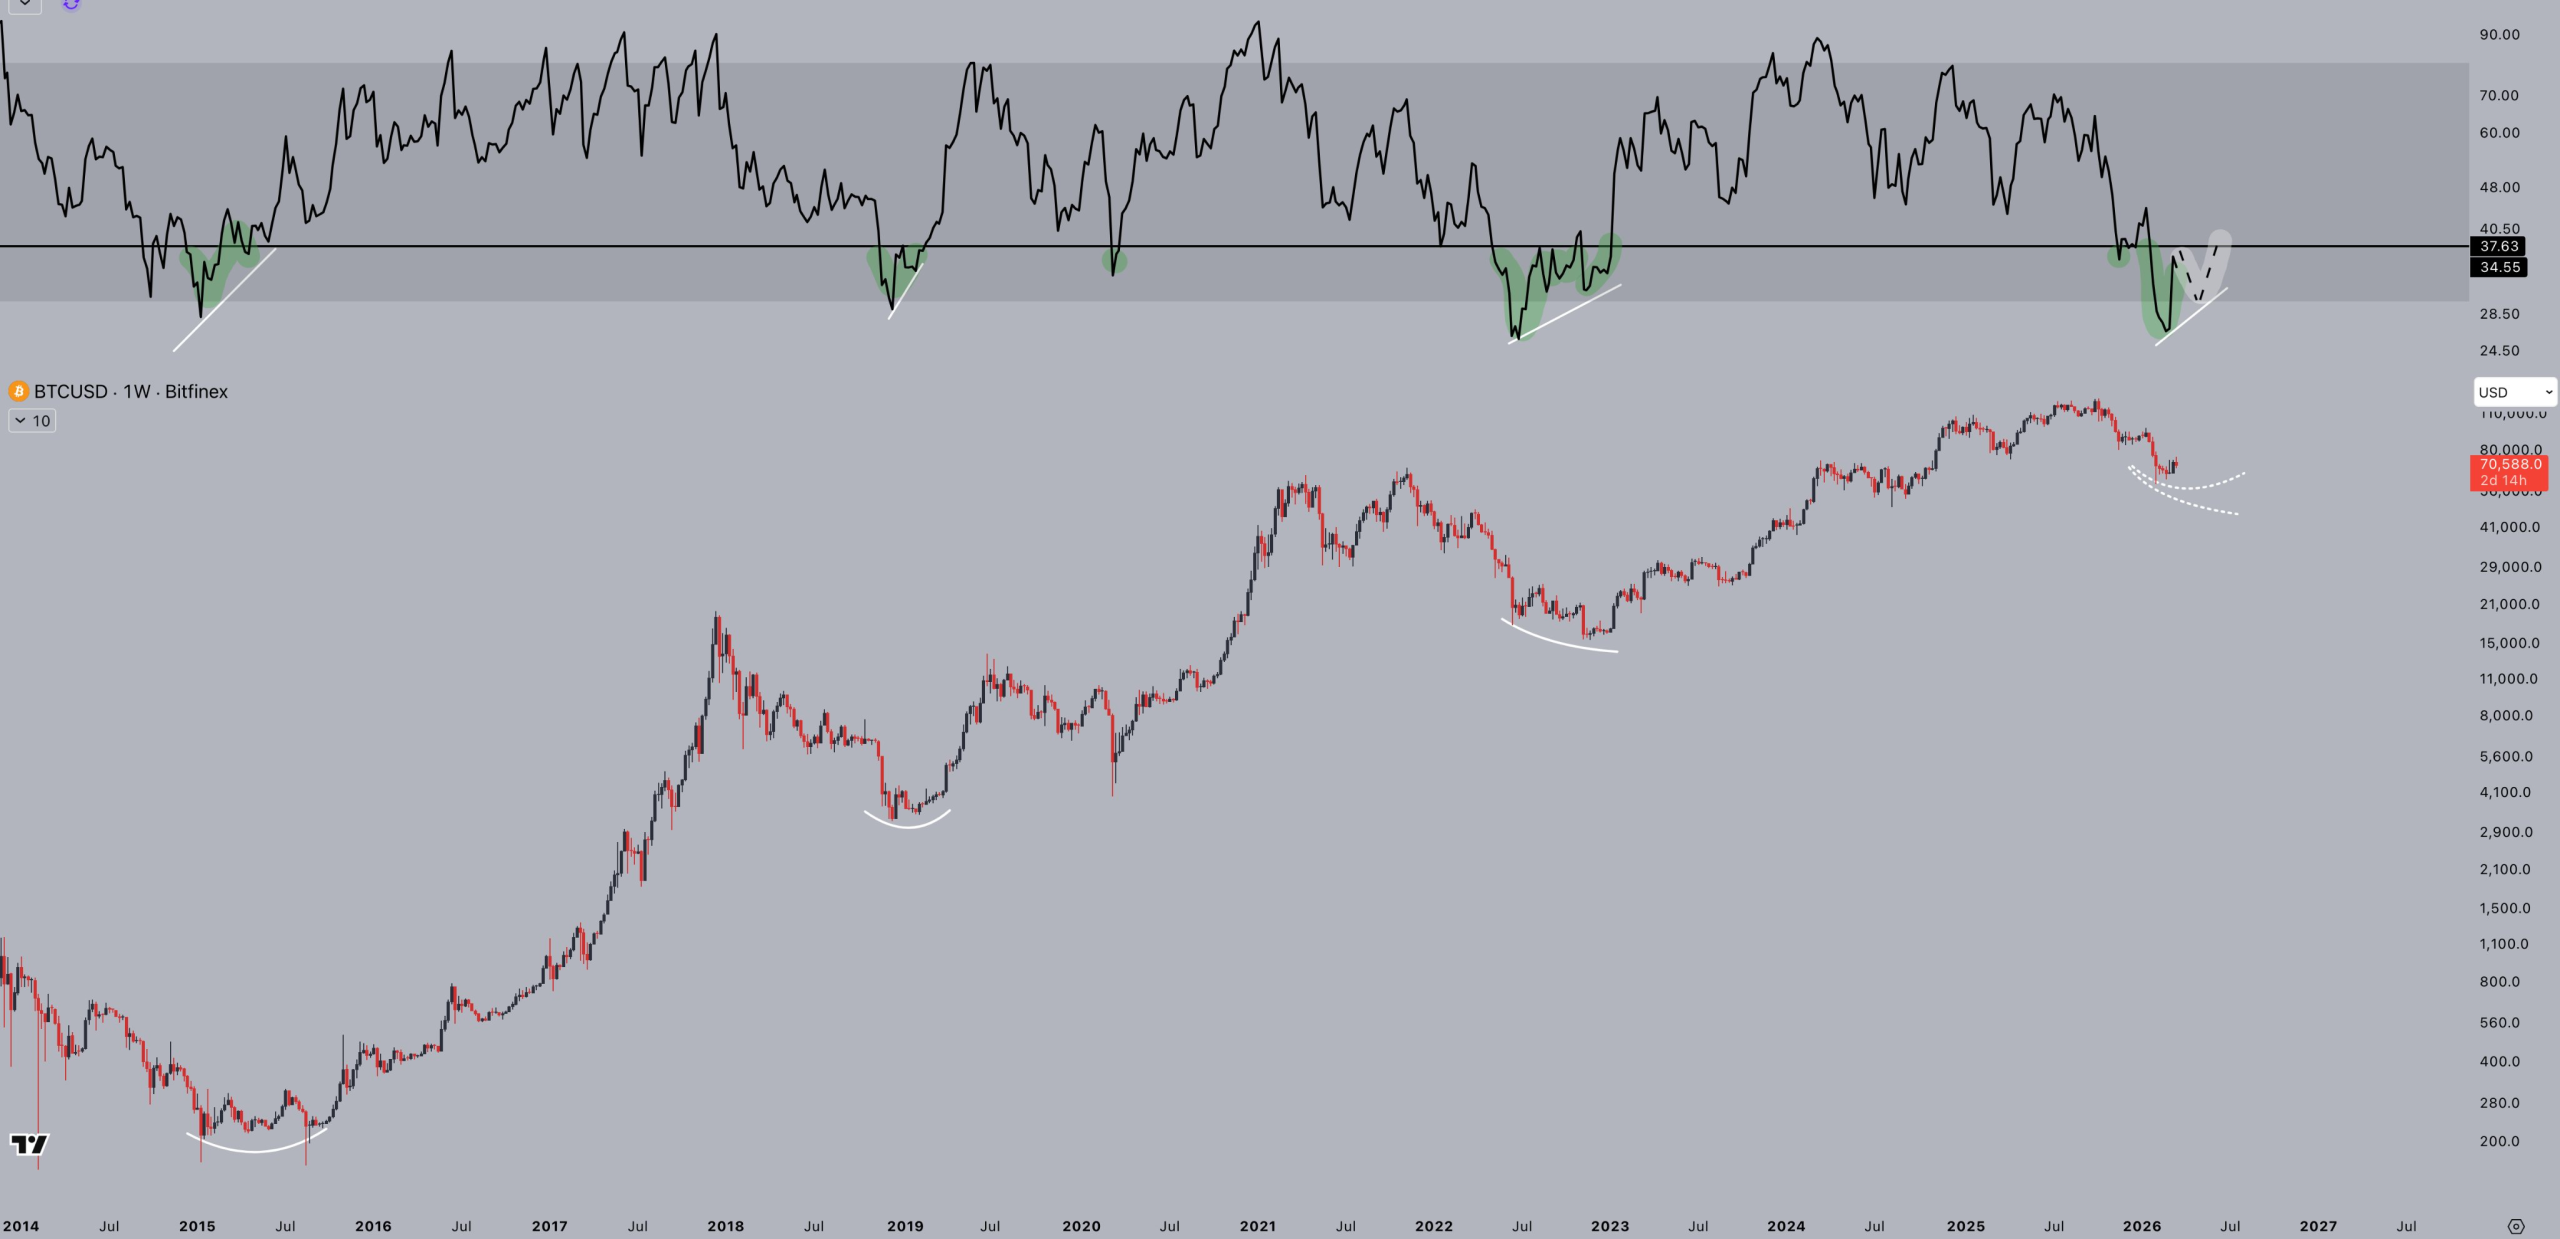
Bitcoin RSI signals approached a key moment as analysis said that a higher low was needed next to allow bullish BTC price continuation.
Bitcoin (BTC) is hinting at its next long-term bottom as a key leading indicator preps a higher low.
Key points:
-
Bitcoin RSI is approaching a critical long-term position for the fate of the bear market.
-
RSI needs a weekly bullish divergence to repeat its early-2023 rebound.
-
A trader says he is “not in a rush” to reenter the market with the comedown from all-time highs just a few months old.
Bitcoin RSI: All eyes on higher low
New analysis covering relative strength index (RSI) data on BTC/USD concludes it could soon be “time to pay attention.”
Bitcoin bear-market bottoms often follow the start of a bullish divergence with RSI on weekly time frames.
For trader Jelle, current market behavior is following historical trends, and Bitcoin’s next inflection point may be around the corner.
“When $BTC’s weekly RSI makes a higher low again, it’s time to pay attention,” he wrote on X.
A classic bullish divergence locks in when RSI makes a higher low while price makes lower lows. Jelle, however, says that price has room to maneuver and still preserve the emerging recovery.
“Doesn’t matter if BTC makes a higher low, equal low, or lower low,” he continued.
“When RSI starts moving higher again, the bottom is very close – or already in.”

BTC price bear flag still in play
RSI last flipped bullish at the end of Bitcoin’s 2022 bear market, and its signals preceded a period of upside that continued for over a year.
Related: Bitcoin tests old 2021 top as gold falls to six-week lows under $4.7K
At the time, talk also focused on reclaiming the 200-week exponential moving average (EMA) as support, something that occurred in March 2023.
As Cointelegraph reported, the 200-week EMA was only lost again last month, with analysis calling the trend line “unreliable.”

Jelle, meanwhile, is among those speculating that previous cycles demand a much longer bear market than the few months that have elapsed so far.
“Previous bear markets all lasted around a year. $BTC topped just 23 weeks ago, and looks like this,” he told X followers.
“I’m not in a rush to buy back in.”

A separate chart drew attention to a possible bear flag formation under development — a sign of weakness that could result in a fresh support failure in a manner similar to January.
This article does not contain investment advice or recommendations. Every investment and trading move involves risk, and readers should conduct their own research when making a decision. While we strive to provide accurate and timely information, Cointelegraph does not guarantee the accuracy, completeness, or reliability of any information in this article. This article may contain forward-looking statements that are subject to risks and uncertainties. Cointelegraph will not be liable for any loss or damage arising from your reliance on this information.
Crypto World
Dell (DELL) Stock Climbs 3% While Super Micro (SMCI) Crashes 25% Following Export Violation Charges

Key Points
- US authorities charged Super Micro co-founder Wally Liaw and two associates with allegedly orchestrating the diversion of approximately $2.5 billion in Nvidia-based servers to China in breach of export regulations.
- Following revelations of alleged involvement, Super Micro suspended two staff members and terminated a contractor’s agreement.
- Super Micro (SMCI) shares tumbled more than 25% during Friday’s premarket session.
- Dell (DELL) shares advanced approximately 3% in premarket activity as Super Micro’s main competitor.
- Industry analysts at Bloomberg Intelligence cautioned that reputational harm could trigger extended customer attrition for Super Micro.
Shares of Dell Technologies (DELL) advanced approximately 3% during Friday’s premarket session following a dramatic collapse in Super Micro Computer (SMCI) stock, which plummeted over 25% after federal prosecutors charged a company co-founder with violations of export regulations related to Nvidia technology.
Federal prosecutors on Thursday made public criminal charges against Yih-Shyan “Wally” Liaw — who serves as Super Micro’s senior vice president for business development and holds positions as co-founder and board member — alleging he orchestrated the unlawful transfer of billions of dollars in artificial intelligence servers to Chinese entities.
Prosecutors allege that Liaw, along with two accomplices, arranged sales of export-restricted Nvidia-equipped servers through an Asian intermediary, with full knowledge that the hardware would ultimately reach China in contravention of federal export restrictions.
The additional defendants named in the case include Ruei-Tsang “Steven” Chang, who managed sales operations at Super Micro’s Taiwan facility, and Ting-Wei “Willy” Sun, an independent contractor whom federal prosecutors characterized as a facilitator who allegedly coordinated elements of the operation.
Throughout 2024 and into 2025, the Asian intermediary entity acquired roughly $2.5 billion in server equipment, which was subsequently repackaged and transported to destinations in China, according to Justice Department filings.
Super Micro acknowledged the charges and announced it has placed both employees on administrative suspension while terminating its relationship with the contractor upon discovering the allegations.
Notably, Super Micro itself was not designated as a defendant in the criminal proceedings.
Super Micro Issues Official Statement
In a Thursday evening statement, Super Micro declared that “the conduct by these individuals alleged in the indictment is a contravention of the Company’s policies and compliance controls.”
The technology firm emphasized its operation of a “robust compliance program” and reaffirmed its dedication to full adherence to American export and re-export regulations. The company further noted its ongoing cooperation with federal investigators.
This represents another chapter in Super Micro’s recent regulatory challenges. The company experienced significant stock volatility in August 2024 when a short-selling firm questioned its financial reporting practices, coupled with the firm’s postponement of its mandatory annual 10-K disclosure.
An independent review commissioned by the board subsequently cleared the company of fraud or wrongdoing, and the outstanding filing was completed in February 2025 — allowing Super Micro to avoid potential removal from Nasdaq listing.
Dell Positioned to Capture Market Share
As Super Micro’s primary rival in the artificial intelligence server sector, Dell emerged as the clear market winner in Friday’s trading activity.
Woo Jin Ho, an analyst with Bloomberg Intelligence, observed that “given the reputation damage, risks for share losses to Dell are heightened long term” — suggesting Super Micro may experience significant customer migration.
Ho further commented that the criminal indictment underscores what he perceives as insufficient advancement by Super Micro in strengthening its internal financial oversight mechanisms.
Super Micro’s stock declined more than 25% in premarket activity and extended losses beyond 27% following the opening bell Friday. Meanwhile, Dell registered gains of approximately 2–3% during the corresponding period.


Ripple said a new 2026 survey shows digital assets are moving closer to the center of financial services strategy.
- Ripple found stablecoins lead demand as finance firms seek faster treasury tools and working capital efficiency.
- Banks and asset managers ranked custody and secure storage among top tokenization infrastructure priorities.
- Most respondents said security certifications and trusted providers matter most when choosing digital asset partners.
Meanwhile, the company polled more than 1,000 finance leaders across banks, asset managers, fintechs, and corporates, with 72% saying firms must offer digital asset solutions to stay competitive.
Ripple said stablecoins ranked as the top digital asset use case in the survey. About 74% of respondents said stablecoins can boost cash-flow efficiency and unlock trapped working capital, showing that many firms now view them as tools for treasury and liquidity management, not only payments.
The report linked that demand to wider market growth. Ripple noted that the stablecoin market cap moved above $300 billion in early March, as adoption expanded across payments, trading, and business settlement.
The survey also showed rising interest in tokenization. Among banks and asset managers looking at tokenization partners, 89% said custody and secure storage were a main priority. Banks ranked token lifecycle management at 82%, while asset managers placed primary distribution at 80%.
Ripple said the results show that many firms are now focused on the systems needed to support digital assets. “The key takeaway here is that finance leaders want more from the crypto companies offering these solutions,” the company wrote, adding that institutions want a provider that can support current and future needs.
Additionally, security ranked as the top factor in partner selection. Ripple said 97% of respondents viewed certifications such as ISO and SOC II as important or very important. Post-integration technical support followed at 88%, while industry experience and financial strength also ranked highly.
The survey also found that many firms prefer one provider for several digital asset services. Ripple said 71% of corporates favor a one-stop-shop model, while slightly more than half of fintechs and financial institutions do the same.
Ripple expands as adoption grows
The findings match broader adoption trends, where firms are moving from early testing to live digital asset plans. Ripple said,
“Most finance leaders aren’t debating digital assets anymore. They’re figuring out how to build with them and who to build with.”
As previously reported by Crypto News, that shift also comes as Ripple expands in Latin America. The company recently said it plans to apply for a VASP license in Brazil, adding to its push in payments and tokenization in the region.
Disclosure: This article does not represent investment advice. The content and materials featured on this page are for educational purposes only.

Key Takeaways
- Spotify (SPOT) dropped 6.62% Thursday following a significant technical malfunction that caused Premium subscribers to experience advertisements and had their accounts appear as free-tier memberships.
- The technical failure sparked worries about customer retention and system dependability.
- Institutional shareholder Alecta Tjanstepension Omsesidigt reduced its SPOT holdings, contributing to downward momentum.
- Evercore ISI lowered its SPOT price target from $700 down to $650, while maintaining an Outperform designation.
- SPOT shares have declined 11.02% since the beginning of the year, with InvestingPro analysis indicating the stock trades above its Fair Value estimate.
Shares of Spotify tumbled 6.62% Thursday, weighed down by a perfect storm of platform malfunction, reduced Wall Street expectations, and institutional investor exits.
Trouble emerged when Premium-tier subscribers experienced an unexpected technical failure that began displaying advertisements and downgraded their account status to resemble free memberships. For a streaming giant whose revenue engine runs on premium subscriptions, such a malfunction represents far more than a minor inconvenience.
The technical mishap eroded investor confidence in the platform’s stability during a critical period, with the company’s quarterly financial report on the horizon. Even subtle indications that premium customers might reassess their membership decisions capture immediate market attention.
Selling momentum accelerated throughout Thursday’s trading session. News surfaced that institutional stakeholder Alecta Tjanstepension Omsesidigt had reduced its SPOT stake. Additional shareholders appeared to secure profits, amplifying the day’s losses.
Evercore ISI Reduces Price Expectations
Evercore ISI adjusted its price objective for SPOT downward this week, revising it from $700 to $650. Despite the reduction, the firm maintained its Outperform designation and simultaneously increased its financial forecasts for the streaming company.
The adjustment stems from recalibrated assumptions regarding currency strength and taxation rates rather than diminished faith in Spotify’s core operations. Evercore ISI currently anticipates gross margins reaching 35.4% by 2028, surpassing the consensus Wall Street estimate of 34.9%.
According to the firm, market participants continue to undervalue Spotify’s Two-Sided Marketplace — the suite of promotional and advertising tools offered to musicians and record companies for platform visibility.
Other Wall Street firms have similarly recalibrated their forecasts. Cantor Fitzgerald maintains a $525 target with a Neutral stance. Guggenheim positions at $600 with a Buy recommendation. Jefferies and Benchmark both carry Buy ratings at $650 and $760 respectively.
This broad range in analyst perspectives highlights the ongoing discussion surrounding how to properly assess Spotify’s expansion potential against its current valuation.
Valuation Questions Persist
InvestingPro analysis indicates the stock currently trades above its Fair Value calculation, despite Thursday’s selloff. SPOT has surrendered 11.02% of its value since January began.
Five Wall Street analysts have recently upgraded their earnings projections, and the streaming giant carries a PEG ratio of 0.47, indicating the market may be underestimating anticipated growth rates.
Spotify’s gross profit margin stands at 32% across the trailing twelve months. Management has prioritized margin expansion, and analyst models suggest upward potential.
Fourth-quarter operating income exceeded previous projections by 8%, or 1% when excluding social charges, based on Cantor Fitzgerald’s analysis of the financial results.
Regarding artificial intelligence developments, Jefferies observed that Google’s introduction of the Lyria 3 music generation capability within the Gemini application warrants monitoring, though the firm retained its Buy rating, implying confidence that Spotify can navigate the competitive threat.
Shares concluded Thursday’s session with a market capitalization of $106.4 billion, accompanied by typical daily trading volume around 2.86 million shares.

Key Takeaways
- ASML’s American depositary shares have declined 7% over the last 30 days amid a broader retreat from AI-linked semiconductor equities.
- TD Cowen’s Krish Sankar maintains a Buy recommendation with a €1,500 price objective (approximately $1,735).
- The company’s valuation multiple relative to semiconductor equipment competitors has contracted from 120% to roughly 20% since Q4 2022.
- Next-generation logic processors and DRAM memory chips are projected to demand increased EUV lithography layers.
- Nvidia CEO Jensen Huang recently projected $1 trillion in cumulative AI chip orders extending through 2027, reinforcing ASML’s growth trajectory.
ASML shares have retreated from their recent peak levels, creating what TD Cowen analyst Krish Sankar characterizes as a “very attractive” entry point for investors. His optimistic stance centers on compressed valuation metrics and robust long-term expansion potential linked to surging AI semiconductor demand.
The company’s U.S.-traded shares have fallen 7% during the past month. This decline occurred as market participants shifted capital away from AI-adjacent chip stocks, despite ASML posting record-breaking orders for its advanced lithography equipment.
ASML occupies a strategic position within the semiconductor manufacturing ecosystem. The Dutch firm maintains an effective monopoly on extreme ultraviolet (EUV) lithography technology, which remains essential for producing cutting-edge microchips. No competing vendor currently offers comparable systems.
Since late 2022, ASML’s valuation premium compared to semiconductor equipment manufacturers such as Applied Materials, Lam Research, and KLA Corp has narrowed dramatically from 120% to approximately 20%. Sankar attributes this compression to current chip production techniques that utilize fewer EUV processing steps.
However, Sankar contends this dynamic is poised to shift. Upcoming generations of both logic semiconductors and memory technology — particularly DRAM — will require additional EUV layers during fabrication. He emphasizes that the memory sector implications remain “underappreciated” among investors.
High-NA EUV Technology: Emerging Growth Catalyst
ASML’s latest High-NA EUV equipment remains in the initial stages of commercial deployment. The company reported revenue from only two High-NA units during Q4 2025, contrasted with 94 conventional lithography systems delivered during that same quarter.
TSMC has demonstrated reluctance in publicly embracing High-NA EUV adoption. The foundry giant has indicated it can maximize existing equipment capabilities. Nevertheless, Sankar expects enhanced system reliability will ultimately drive broader customer adoption.
TD Cowen’s financial models project 60 lithography system shipments in 2026, expanding to 68 units in 2027 as High-NA equipment volumes double and legacy platforms transition to upgraded variants.
Sankar rates ASML’s Amsterdam-traded shares as Buy with a €1,500 price objective, calculated at 48 times his 2027 earnings per share projection. ASML’s European-listed equity closed Thursday at €1,165. The U.S.-listed American depositary shares traded down 1.4% at $1,347.40 during premarket hours.
AI Capital Expenditure Underpins Long-Range Demand
The fundamental demand environment for ASML remains robust. Nvidia CEO Jensen Huang, presenting at GTC 2026 on March 16, elevated his AI chip order projection to at least $1 trillion through 2027. Broadcom CEO Hock Tan has independently forecasted $100 billion in AI semiconductor revenue for fiscal year 2027.
Amazon, Microsoft, Google, and Meta are anticipated to deploy nearly $600 billion in combined capital expenditures throughout 2026, with substantial portions allocated to AI infrastructure investments.
ASML also generates predictable recurring revenue. Maintenance and service contracts for its deployed equipment base represented approximately 25% of total 2025 revenue.
ASML currently commands a forward price-to-earnings ratio of 39.8, exceeding its 10-year median of 35.8. The company’s market capitalization stands at approximately $527 billion.

Key Takeaways
- DarkSword compromises iOS versions 18.4 through 18.7, exfiltrating cryptocurrency assets and sensitive information.
- Ghostblade spyware focuses on popular exchanges like Coinbase, Binance, Kraken, and wallets such as Ledger and MetaMask.
- Infection occurs through malicious websites requiring zero user interaction to compromise devices.
- Malware payloads automatically erase themselves after successfully extracting victim data.
- iOS 26.3 update addresses vulnerabilities; Lockdown Mode provides additional defense against DarkSword.
Cybersecurity researchers have uncovered DarkSword, a sophisticated exploit chain compromising Apple devices running iOS versions 18.4 to 18.7. This attack framework utilizes six previously unknown zero-day security flaws to deploy surveillance malware on targeted iPhones. Active campaigns have been detected across Saudi Arabia, Ukraine, Malaysia, and Turkey, indicating widespread deployment.
The DarkSword framework installs data-stealing malware capable of harvesting authentication credentials, communication records, and geolocation data. Cryptocurrency applications and digital wallets represent primary targets for this malicious campaign. Victims become infected simply by visiting weaponized web pages, requiring no clicks or downloads.
Security analysts have documented three distinct malware variants delivered via DarkSword: Ghostblade, Ghostknife, and Ghostsaber. These payloads rapidly extract targeted information before automatically removing themselves from infected systems. Evidence suggests both commercial surveillance companies and government-sponsored hacking groups are utilizing DarkSword in their operations.
Ghostblade Malware Hunts Cryptocurrency Applications
The Ghostblade payload distributed through DarkSword systematically scans compromised iOS devices for cryptocurrency exchange apps. Its target list encompasses leading trading platforms: Coinbase, Binance, Kraken, Kucoin, OKX, and MEXC. Additionally, it searches for prominent wallet software including Ledger, Trezor, MetaMask, Exodus, Uniswap, Phantom, and Gnosis Safe.
Beyond digital currency theft, Ghostblade harvests text messages, iMessages, phone logs, and contact lists from infected devices. The spyware extracts Wi-Fi passwords, Safari browser cookies, web history, and GPS coordinates. It further accesses Apple Health records, photo libraries, and conversations from messaging platforms like Telegram and WhatsApp.
Ghostblade executes a hit-and-run strategy, removing temporary artifacts and self-destructing after completing data exfiltration. This rapid execution minimizes forensic evidence left on compromised devices. The deployment of Ghostblade through DarkSword demonstrates escalating threats facing cryptocurrency holders.
Worldwide Campaign Distribution and Technical Operation
DarkSword deployment has been documented through weaponized websites and hijacked government web portals. Saudi Arabian victims were lured through a counterfeit Snapchat-themed page hosting the DarkSword exploit. The attack framework generates hidden iframes and retrieves remote code execution modules to inject malware payloads.
Various remote code execution exploits within DarkSword target distinct iOS versions, exploiting memory handling flaws and pointer authentication bypass weaknesses. The loader mechanism occasionally struggles with device version identification, suggesting accelerated development timelines. Nevertheless, DarkSword successfully delivers terminal payloads including Ghostknife and Ghostsaber across affected devices.
Security teams disclosed these vulnerabilities to Apple during late 2025, with remediation patches released in iOS 26.3. Domains associated with DarkSword distribution have been incorporated into browser Safe Browsing databases. iPhone owners should immediately install iOS updates or activate Lockdown Mode to defend against DarkSword exploitation.
DarkSword represents a critical security challenge for iOS cryptocurrency users worldwide. The exploit’s swift proliferation among diverse threat actors demonstrates heightened risks to digital financial holdings. Its comprehensive targeting of exchanges, wallets, and personal information emphasizes the urgency of applying available security patches.


Oil volatility triggered by the Iran conflict is pushing traders onto decentralized exchanges (DEXs) like Hyperliquid, where markets never close, Wall Street investment bank JPMorgan said in a Wednesday report.
The bank flagged a surge in activity from non-crypto investors using perpetual futures, derivatives with no expiry, to gain round-the-clock oil exposure. Unlike traditional venues, these contracts trade 24/7 and use funding rates to track spot prices.
“In particular, oil trading exploded on the Hyperliquid exchange early this month when the Iran war erupted as CME traders were unable to react when Iranian infrastructure strikes broke over the weekend,” wrote analysts led by Nikolaos Panigirtzoglou.
Market volatility spiked following the outbreak of war in the Middle East, with oil prices leading sharp moves as traders reacted to supply risks and geopolitical uncertainty. The initial shock was amplified by thin liquidity outside traditional trading hours, driving wider price swings and pushing investors toward venues offering continuous, 24/7 market access.
A decentralized exchange (DEX) is a peer-to-peer marketplace where users trade crypto directly without intermediaries. Unlike centralized exchanges, DEXs are non-custodial, meaning users retain control over their private keys and funds.
Rather than relying on a central operator, DEXs use smart contracts to automatically execute trades and settle them onchain. These trustless systems are a fast-growing part of the crypto market and are driving new types of financial products.
With CME markets shut over the weekend, traders turned to Hyperliquid’s CL-USDC perpetual, which stayed open for price discovery. The contract, margined in USDC with up to 20x leverage, hit $1.7 billion in peak daily volume and is now the platform’s third-most traded product, the bank said. Open interest has climbed to about $300 million.
More broadly, the analysts said demand for 24/7 access to traditional assets is accelerating interest in DEXs. Platforms like Hyperliquid use onchain order books rather than automated market makers, offering tighter spreads and more precise execution closer to traditional markets.
Features such as sub-second finality and portfolio margining are further attracting institutional traders by enabling faster execution and more capital-efficient strategies.
As a result, DEXs are taking share from mid-tier centralized exchanges in crypto derivatives, driven by speed, liquidity, self-custody and continuous market access, according to the analysts.
The trend is likely to expand beyond commodities as DEXs capitalize on a key gap in traditional finance: markets that don’t close, the report added.
Hyperliquid’s HYPE token is up roughly 25% year-to-date, outperforming much of the broader crypto market.
Read more: Iranian crypto outflows jump 700% minutes after U.S.-Israeli airstrikes, Elliptic says


Coinbase (COIN) said it began offering perpetual stock futures to eligible non-U.S. retail and institutional traders, extending its derivatives product line into U.S. equities.
The contracts let traders take leveraged positions on a group of large-cap U.S. stocks, colloquially known as the Magnificent 7: Apple, Microsoft, Alphabet, Amazon, Nvidia, Meta and Tesla. Perpetual futures tied to the SPY and QQQ exchange-traded funds, which track the S&P 500 and Nasdaq 100 indices, are also available in some jurisdictions, the exchange said in a Friday blog post.
Unlike standard futures contracts, perpetual futures have no expiry date. Coinbase’s contracts are cash-settled in USDC, a dollar-pegged stablecoin issued by Circle Internet (CRCL).
Coinbase said traders can use up to 10-times leverage on single-stock contracts and up to 20-times on ETF products. Demand for round-the-clock equity exposure, it added, has been growing rapidly, and most of the offerings have been concentrated on decentralized platforms.
The largest such decentralized platform is Hyperliquid, which earlier this week introduced S&P 500 perpetual futures contracts. The platform has become a hotbed for contracts tied to traditional financial instruments, including oil-linked contracts that are trading round-the-clock as war erupts in the Middle East.
Coinbase also said the product uses the same risk engine that supports its crypto derivatives markets, with cross-margining across perpetual futures and spot positions.
The move comes as the exchange expands the range of assets available on its platform as part of a bid to become the “Everything Exchange.”

O’Brien backs Getta Good Feeling for 2026 Alexandra Stakes distance rise

Sidewalk scooter riders, beware: AI-powered ‘Lime Vision’ will soon call you out

Here’s how the White House wants Congress to regulate AI

Smart energy pays enters the US market, targeting scalable financial infrastructure

Why Israel is blocking foreign journalists from entering

Bitcoin: We’re Entering The Most Dangerous Phase

Crypto Trading LIVE: BTC Live Trading Bitcoin Analysis | 19 MAR #crypto #bitcoin #btc

AO VIVO: CAMINHONEIROS ADIAM GREVE; ANP COBRA PETROBRAS POR MAIS OFERTA – 20/03/2026 | CNN MONEY

Bitcoin: Der Crash kommt schneller als du denkst!
-
Crypto World6 days ago
HYPE Token Enters Net Deflation as HyperCore Buybacks Outpace Staking Rewards
-

 Tech5 days ago
Your Legally Registered ‘Motorcycle’ Might Not Count Under Proposed US Law
-

 Fashion7 days ago
Weekend Open Thread: Addict Lip Glow
-
 Tech3 days ago
Are Split Spacebars the Next Big Gaming Keyboard Trend?
-
Sports6 days ago
Why Duke and Michigan Are Dead Even Entering Selection Sunday
-

 Business5 days ago
Search for Savannah Guthrie’s Mother Enters Seventh Week with No Arrests
-

 Business6 days ago
US Airports Launch Donation Drives for Unpaid TSA Workers as Partial Government Shutdown Enters Fifth Week
-
Crypto World6 days ago
Coinbase and Bybit in Investment Talks: Could Bybit Finally Enter the US Crypto Market?
-

 Business4 days ago
Australian shares drop as Iran war enters third week
-

 Business6 days ago
Country star Brantley Gilbert enters growing non-alcoholic beer market
-

 Crypto World4 days ago
Crypto Lender BlockFills Enters Chapter 11 with Up to $500M in Liabilities
-

 Sports7 days ago
College Basketball Best Bets: Conference Tournament Semifinal Picks
-

 Politics2 days ago
The House | The new register to protect children from their abusers shows Parliament at its best
-

 News Videos2 days ago
RBA board divided on rate cut, unusually buoyant share market | Finance Report | ABC NEWS
-

 Fashion4 days ago
25 Celebrities with Curly Hair That Are Naturally Beautiful
-

 Tech9 hours ago
inKONBINI Lets You Spend Summer Days Behind the Register
-

 Crypto World2 days ago
Canada’s FINTRAC revokes registrations of 23 crypto MSBs in AML crackdown
-
 Politics3 days ago
Real-time pollution monitoring calls after boy nearly dies
-

 Crypto World6 days ago
Crypto Losses Drop 87% in February, But Hackers Are Now Targeting People, Not Code
-
 NewsBeat2 days ago
Residents in North Lanarkshire reminded to register to vote in Scottish Parliament Election


You must be logged in to post a comment Login