
Crypto World
XLM price forecast: is $0.20 next amid confluence of bullish factors?


- Stellar price hovered near $0.16 as bulls looked for a bounce despite the recent sell-off.
- XLM is among the coins designated as digital commodities under SEC and CFTC interpretations.
- €2.3 trillion asset manager Amundi launched a $100 million tokenized fund on Stellar.
Stellar Lumens (XLM) trades near $0.16 as bulls eye a rebound to month-to-date highs following recent sell-off.
Could this outlook materialize amid renewed investor attention on Stellar, with multiple potential catalysts in place? Developments across the ecosystem suggest so, and immediate targets include the psychological $0.20 mark.
Stellar gets key boost alongside Ethereum
The XLM token has pared recent gains to $0.18, and market data shows bulls are 41% down since touching highs of $0.50 in July 2025.
An overall downtrend puts bulls at risk of new pain.
However, the Stellar blockchain network is headlining crypto market sentiment amid a significant regulatory tailwind.
A Europe-based asset manager has also shown confidence in Stellar.
On the regulatory front, XLM is among several coins to receive official designation as digital commodities.
This follows a joint interpretation by the US SEC and CFTC, which listed XLM among other coins as digital commodities.
This clarity positions XLM favorably for compliant institutional adoption, reducing longstanding uncertainties that have hindered growth.
Elsewhere, Europe’s €2.3 trillion asset manager Amundi launched a $100 million tokenized fund on both Stellar and Ethereum networks.
The move reinforces the altcoin project’s potential in real-world asset tokenization.
On top of this news, on-chain data shows Stellar had a robust Q4, 2025.
The real-world asset (RWA) market cap grew 196% year-over-year to more than $890 million, and the stablecoin market cap jumped 53% to $243 million.
The other notable developments are a spike in DeFi TVL as a major US bank teased a stablecoin issuance on Stellar.
These ecosystem advancements highlight Stellar’s expanding role in bridging traditional finance and blockchain.
XLM price forecast: is $0.20 next?
Stellar price paints a bullish picture on the daily chart, with the decrease in intraday volume suggesting waning selling pressure.
According to data from CoinMarketCap, daily trading volume was down 16% in the past 24 hours to around $88 million.
Meanwhile, daily RSI reflects a neutral-to-bullish stance, hovering near 54 to indicate ample upside potential before overbought conditions.
The divergence suggests buyers are regaining control after recent consolidations around below $0.17.

If prices move higher, a breakout to $0.20 could allow bulls to revisit the 0.236 Fibonacci retracement level at $0.22.
More gains and bulls could eye $0.32 (aligns with the 0.5 Fibonacci retracement level).
However, downside risks include a drop in Bitcoin prices. XLM below $0.16 risks bearish continuation $0.13 or lower.

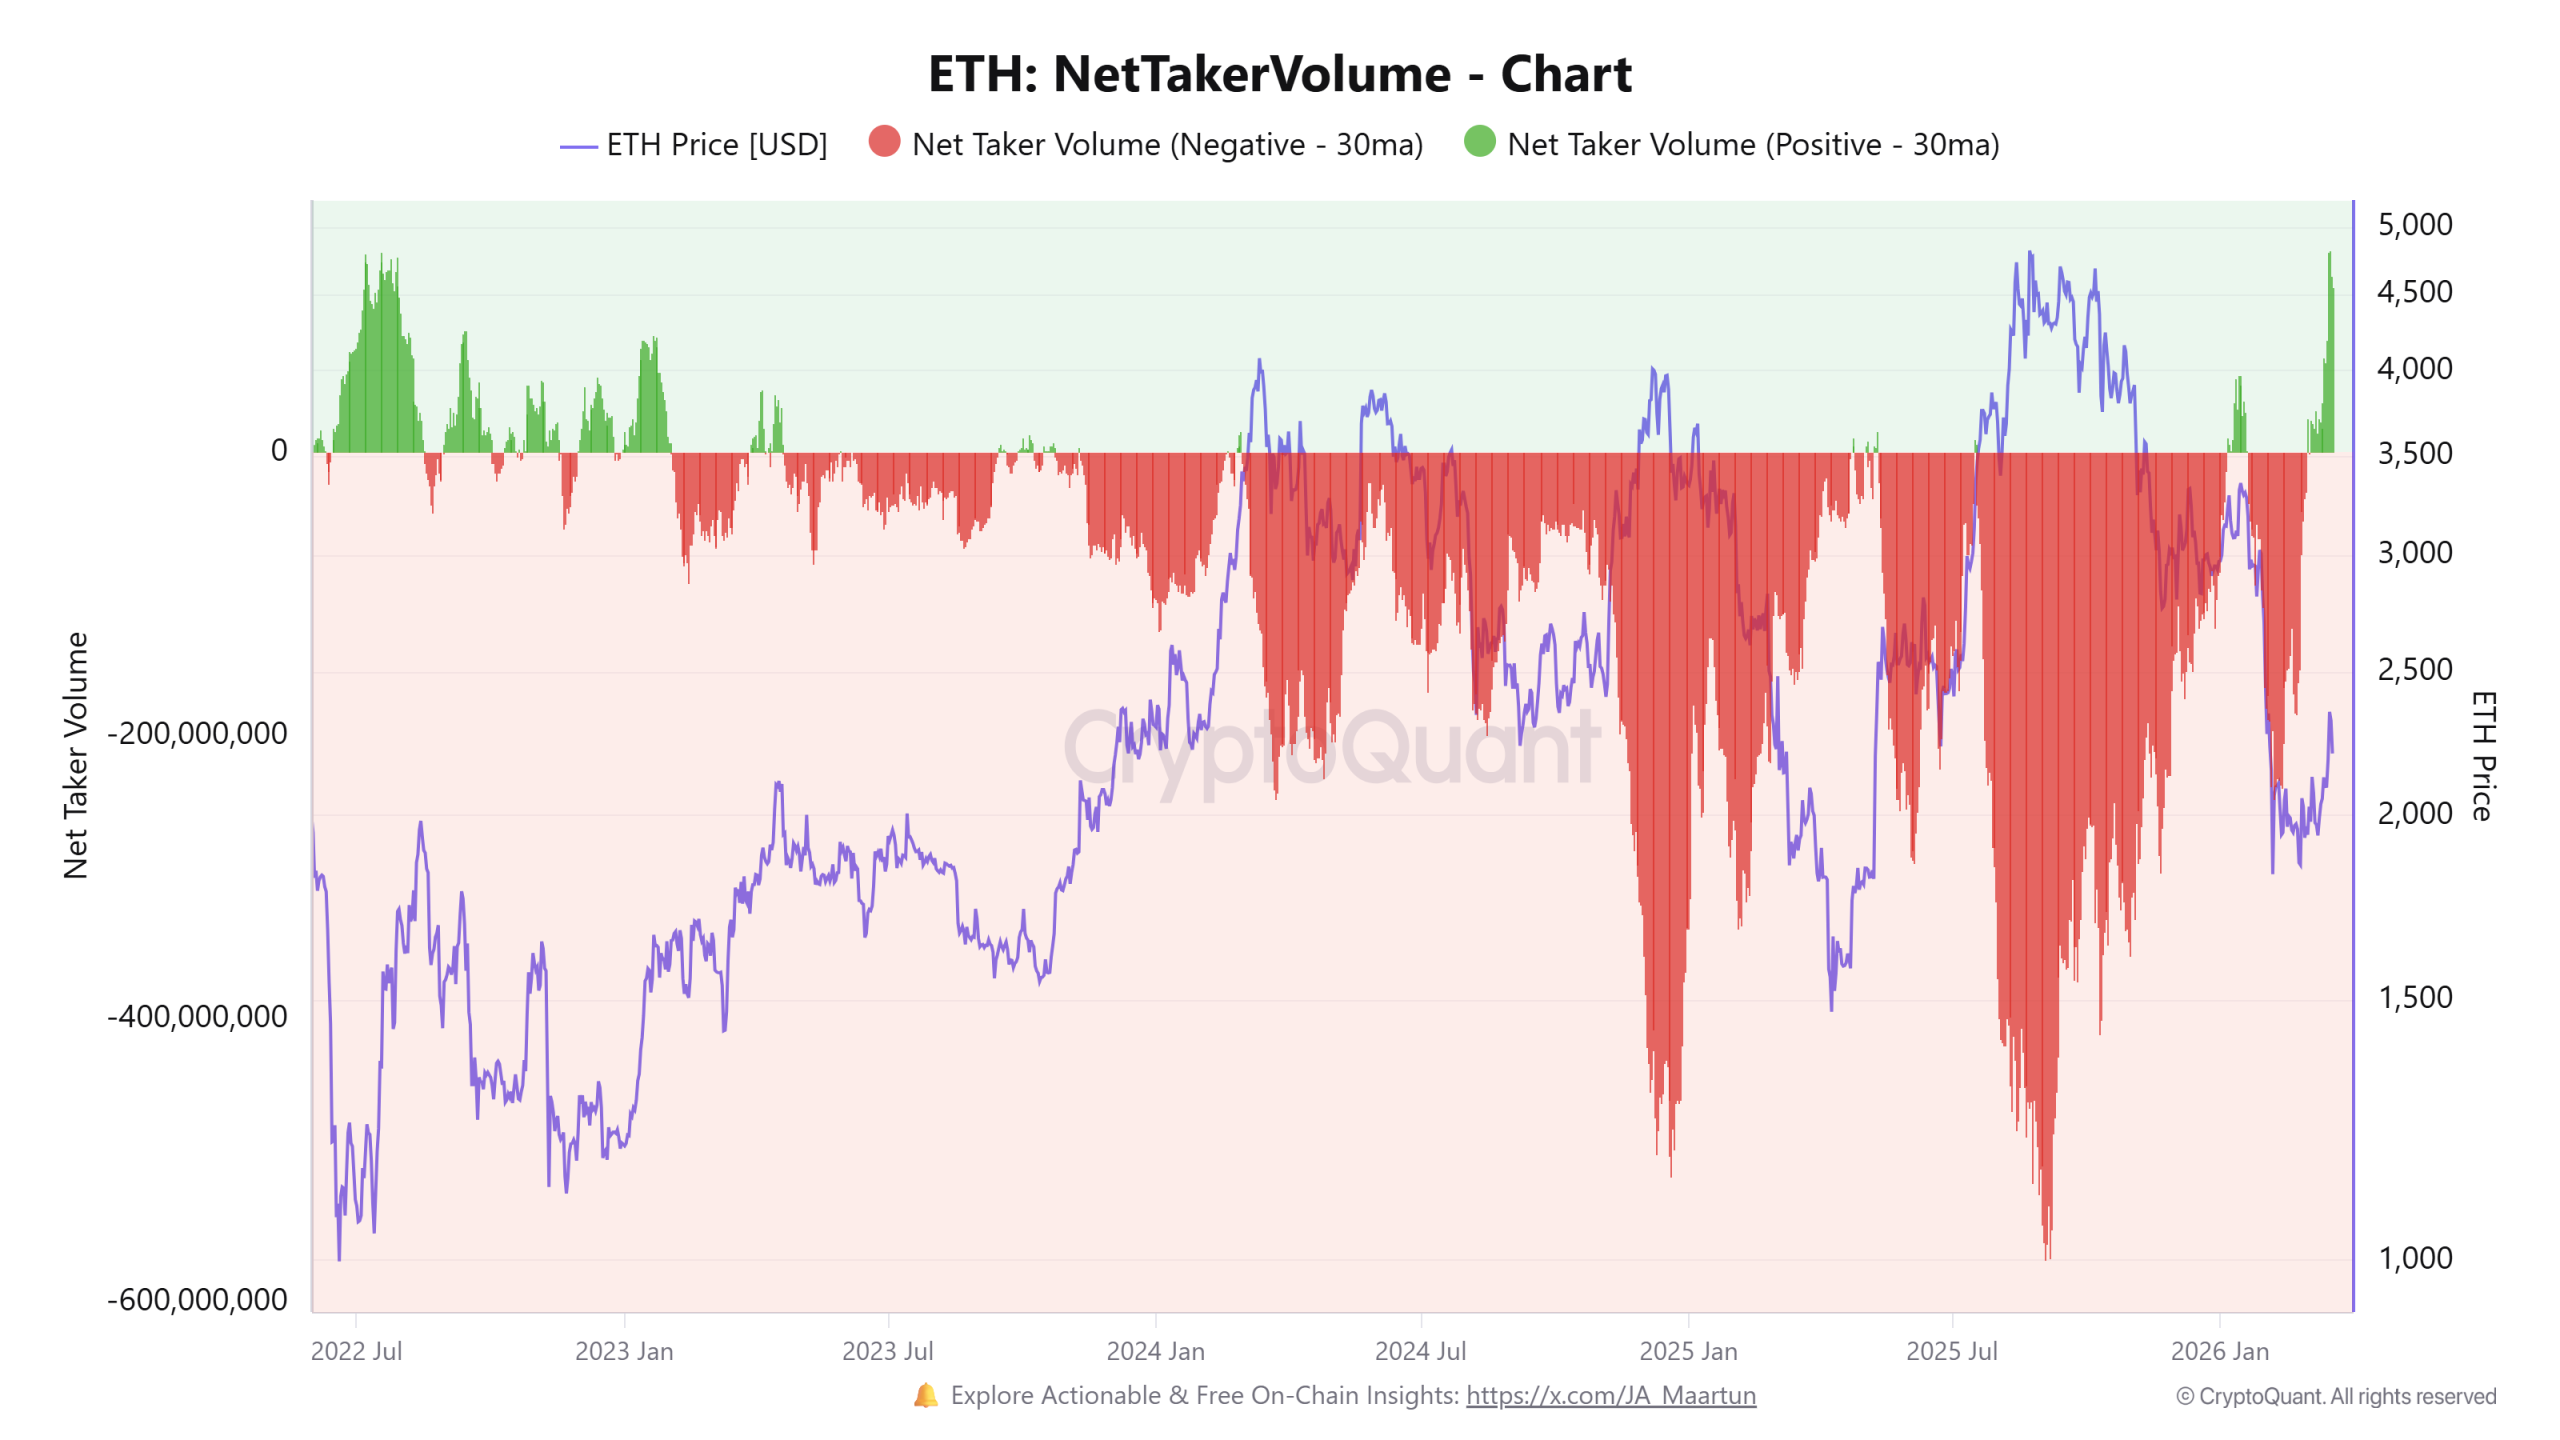
A key Ether (ETH) onchain indicator has climbed to its highest level in over three years, a level last seen when ETH bottomed during the 2022 bear market cycle.
The signal supports the case for an early bottoming phase, despite the weak spot demand and muted price action. Data suggests that ETH may stabilize near the local floor around $2,000, but a sweep of lower price levels remains possible in the coming weeks.
Ether taker flow spikes: Does this confirm the ETH bottom?
The 30-day average of positive Ether net taker volume climbed to $142 million on March 17, reaching levels last seen on July 18, 2022. The net taker volume measures the difference between aggressive buyers and sellers in derivatives markets.
A positive reading signals that market orders lean toward buyers. The recent surge aligns with prior spikes seen in mid-2022 during a correction phase.

These expansions have appeared during transitional periods where traders reposition and add exposure while the price stabilizes near a market bottom, as observed in July 2022 and August 2020.
The Ethereum Coinbase premium index has also been positive since Feb. 24, and the elevated premium levels indicate growing spot demand from US-based traders.

However, crypto analyst Pelin Ay noted that despite the drop in supply-side pressure, the price response has remained relatively muted, possibly due to a lack of dominant buy demand. The analyst said,
“The supply side is bullish, but there are no buyers. It appears that buyers still consider the current price expensive and are waiting for a new bottom.”
Related: Execution quality is the missing metric in Bitcoin and Ethereum markets
What happens if Ether falls below $2,150?
Ether’s short-term support aligns with the 100- and 200-period exponential moving averages (EMAs), but the price is compressing near an ascending trendline, with a potential breakdown placing focus on the lower liquidity zones.

The internal liquidity sits between $2,100 and $2,000 and a more pronounced cluster has formed near $1,905.
A larger liquidation cluster sits at $1,976, where over $3 billion in long positions are open. A move into this zone may trigger forced liquidations and create a short-term imbalance.

If buyers step in, this area may also act as a demand zone and support a price rebound above $2,000.
Crypto trader EliZ outlined a clear threshold at $2,000 on the daily timeframe. Holding above this level keeps the medium-term trend intact. A break below shifts the positioning toward aggressive short exposure, with the lower targets in focus.

Related: Crypto Fear and Greed rebounds off extreme lows as traders re-enter
This article does not contain investment advice or recommendations. Every investment and trading move involves risk, and readers should conduct their own research when making a decision. While we strive to provide accurate and timely information, Cointelegraph does not guarantee the accuracy, completeness, or reliability of any information in this article. This article may contain forward-looking statements that are subject to risks and uncertainties. Cointelegraph will not be liable for any loss or damage arising from your reliance on this information.
Crypto World
Pi Network’s PI token looks like a busted growth story, not a safe bet, where will price go?
Pi Network’s PI token trades around 0.17–0.19 dollars, 94% below its peak, with most serious models clustering around a 0.15–0.35 dollar, high‑risk, low‑conviction range for the next 12–18 months.
Summary
- PI changes hands near 0.17–0.19 dollars with a roughly 1.7–1.8 billion dollar market cap and about 9.8 billion coins in circulation, down around 94% from its 2.99‑dollar all‑time high.
- Gate and CoinCodex forecasts cluster around a 2026 band of roughly 0.15–0.30 dollars, while CoinStats’ more optimistic scenarios push into the 0.40–0.60‑dollar range only if adoption and sentiment improve sharply.
- A sober journalistic call puts the defensible 12–18‑month corridor at 0.15–0.35 dollars, skewed lower unless Pi delivers real usage, with 70–90% drawdowns and sharp “liquidity event” rallies always on the table.
Pi Network’s PI (PI) token is trading around 0.17–0.19 dollars today, with a market cap near 1.7–1.8 billion dollars and roughly 9.8 billion coins in circulation against a 100‑billion maximum supply. In plain terms, you are looking at a mid‑cap, highly dilutive altcoin that has already retraced sharply from its speculative peak yet still trades mostly on narrative, not cash‑flow or clear on‑chain usage.
Over the last week, Pi has been weak: spot is down more than 30% on some fiat pairs, even as today’s session shows a 7% bounce in rupee terms, a classic dead‑cat profile in crypto microstructure. Daily volume sits in the mid‑tens of millions of dollars, which is enough for short‑term traders to move price violently but nowhere near the liquidity profile of major Layer 1s. CoinStats notes Pi changing hands near 0.17 dollars in March 2026, roughly 94% below its 2.99‑dollar all‑time high from early 2025, underscoring how brutal the post‑launch repricing has been. In equity‑market language, this is what you’d call a busted growth story still trying to prove it deserves its prior multiple.
Forward‑looking models are all over the map, which tells you more about uncertainty than about destiny. Gate’s internal research sees Pi averaging about 0.18–0.21 dollars in 2026, with a band from roughly 0.16 to 0.27 dollars, effectively saying “sideways chop around current levels.” CoinCodex’s quantitative framework pushes a little higher, flagging the possibility of Pi closing 2026 closer to 0.42 dollars if sentiment and technicals co‑operate, which would be about a low‑triple‑digit percentage gain from here. CoinStats, running multi‑scenario AI modelling, sketches a conservative 2026 year‑end corridor of 0.25–0.35 dollars, a base case of 0.40–0.60 dollars, and an aggressive path that could theoretically justify 0.80–1.50 dollars if adoption and execution surprise to the upside.
Strip away the model branding and you can reduce the next 12–24 months to three simple regimes. In the bear regime, Pi stays supply‑heavy and demand‑light: unlocks continue, user activity underwhelms, the broader altcoin complex remains risk‑off, and Pi bleeds into the 0.10–0.15‑dollar zone as models like CoinCodex’s near‑term projections already hint at. In the base regime, Pi grinds sideways with a mild upward bias, respecting the 0.15–0.30‑dollar range implied by exchange research and the lower bands of CoinStats’ scenarios, tracking altcoin beta rather than generating its own idiosyncratic bid. In the bull regime, Pi converts its large user base into actual on‑chain throughput, improves liquidity and listings, and rides a risk‑on phase in crypto, which is where CoinStats’ 0.40–0.60‑dollar 2026 base case and 1‑dollar‑plus long‑term scenarios become plausible rather than laughable.
The most defensible 12–18‑month corridor is 0.15–0.35 dollars, skewed toward the lower half unless Pi starts printing real usage metrics and the wider market turns decisively bullish. Upside tails above 0.40 dollars exist, but they require both project execution and macro risk appetite; downside tails into 0.10 dollars or below remain very real if capital continues to leak out of speculative L1 narratives. Size exposure the way you would a thin, story‑stock in equities: assume 70–90% drawdowns are always on the table, treat sharp rallies as liquidity events rather than validation, and never confuse modelled price “targets” with guarantees.


Kalshi is now under a two-week restraining order barring bets in Nevada while a legal debate proceeds over the longer-term status of prediction markets there.
The First Judicial District Court of Nevada issued a 14-day order on Friday, directing the platform to cease offering event contracts in that state. A federal appeals court cleared the way on Thursday for state regulators to seek the order, which the Nevada Gaming Control Board first sought in 2025, when it told Kalshi to cease its sports contracts.
Kalshi had argued that the case should be moved to federal court, but the appeals court sent it back to Nevada, despite the company’s claim that it “faces imminent harm” from the state’s actions.
On Friday, the state court halted Kalshi’s sports, entertainment and election bets as the parties continue to argue over the relative authority of the state regulators to govern event-contract businesses.
The Nevada judge determined that the gaming board can’t properly function under these circumstances, and “an unlicensed participant beyond the Board’s control, such as Kalshi, obstructs the Board’s ability to fulfill its statutory functions.” The court is following up with an April 3 hearing.
A spokesman for Kalshi declined to comment on the Nevada development. Kalshi is being sued or prosecuted in several states on similar grounds. Earlier this week, Arizona’s attorney general charged Kalshi with running an unlicensed gambling business and offering illegal election wagering.
Meanwhile, Chairman Mike Selig of the U.S. Commodity Futures Trading Commission is insisting that his federal agency actually has proper authority over the markets, not the states. He filed a court brief stating that argument and has repeated it in a number of recent public appearances, promising he’ll fight the states on that point. He’s also begun moving on establishing CFTC policies in prediction markets.
Federal regulation generally supersedes state regulation, but the courts may need to weigh in on who is properly entitled to the jurisdiction. Major League Baseball, for one, has thrown in with the CFTC, signing a memorandum of understanding this week on oversight of prediction markets and also inking a partnership with Polymarket.
Read More: CFTC’s Selig opens legal dispute against states getting in way of prediction markets


An ongoing bear market combined with wider global economic struggles has hit crypto firms hard, causing delays, staff layoffs, and AI pivots.
This week, crypto protocol Algorand announced it was reluctantly reducing its workforce by 25%.
Algorand claimed the “tough” layoff was in response to “the uncertain global macro environment as well as the broader downturn in crypto markets.”
Indeed, as the year continues, bitcoin’s price is struggling to gain upward momentum after dropping to $63,000 in late February.
The escalating war between the US, Irael and Iran is also causing the price of oil to rocket, and threatens deeper economic turmoil across the globe.
Crypto layoffs, cuts, and delays
Firms including Gemini, Messari, Crypto.com, OP Labs, OpenSea, and Kraken, have announced various cuts to their operations, be it through trimming staff or delaying planned operations.
Meanwhile, Crypto.com announced a 12% staff layoff yesterday while citing an AI pivot. The firm’s CEO, Kris Marszalek, claimed the roles of the fired staff “do not adapt in our new world.”
Read more: Mass crypto layoffs are a short-term solution with long-term consequences
Gemini similarly let 25% of its staff go in February, claiming AI has allowed its workforce to operate more efficiently with fewer staff.
Gemini also let three of its execs go, including Chief Operating Officer Marshall Beard, Chief Financial Officer Dan Chen, and Chief Legal Officer Tyler Meade.
On Monday, crypto analytics firm Messari announced that it’s “doubling down” on becoming an “AI-first company,” and announced that it had let various team members go as new CEO, Diran Li, took the reins.
Protocol contributor OP Labs fired 20 of its staff last week in a memo that also alluded to the possibility of an AI pivot. CEO Jing Wang said, “This is about doing fewer things well, making decisions faster, and reducing coordination overhead.”
These all follow what was one of the more dramatic AI pivots from Jack Dorsey’s Block, which fired 50% of its staff (around 4,000 people) while citing the advancements AI offers to workplace efficiency.
Read more: How bombing Iran shifted oil and bitcoin prices
This week, the NFT platform OpenSea announced that it was delaying the launch of its $SEA token because of “challenging” market conditions across crypto that may affect its launch.
Another delay was announced yesterday to Kraken’s initial public offering (IPO). According to sources familiar with the matter, Kraken’s parent company, Payward, is pausing the IPO plans until “market conditions improve.”
Layoffs often come with reputational costs and further long-term consequences down the line, as staff are left burdened with the workloads of their departed teammates.
However, with more companies citing AI as a reason for workforce reduction, it’s hard to ignore its ability to mitigate the burden of cutting staff.
Got a tip? Send us an email securely via Protos Leaks. For more informed news and investigations, follow us on X, Bluesky, and Google News, or subscribe to our YouTube channel.


Bitcoin is holding just below $70k after a hawkish FOMC, ETF outflows, and a shift to Fear, with weak long conviction but easing miner selling and difficulty.
Summary
- BTC slipped roughly 5% post-FOMC, from near $74k to testing $70k, as the Fed signaled fewer 2026 cuts, ETFs flipped from $1.1b inflows to a $129m outflow, and the Fear & Greed Index fell to 28.
- Bitcoin’s 30-day correlation to the S&P 500 has climbed to 0.74, while CoinGlass data show shorts built into the $68,750 dip but open interest barely moved on the rebound, implying range-bound, low-conviction trade.
- Miner net outflows are down 82% from February peaks and a ~7.5% difficulty drop should ease cost pressure, leaving BTC parked between $66,827 long-liquidation risk and $73,757 short-squeeze resistance.
Bitcoin is trading above $69,900 on Friday evening, clinging to key support levels after a bruising week shaped by the Federal Reserve’s hawkish tone, a reversal in ETF flows, and broad risk-off sentiment across global markets. The crypto Fear & Greed Index sits at 28 — deep in Fear territory — as investors weigh the durability of BTC’s recovery against a deteriorating macro backdrop.
The week’s defining moment came on Wednesday, when the Fed held rates steady at its March FOMC meeting but signaled that fewer rate cuts are likely in 2026 than previously expected. Bitcoin fell roughly 5% in the immediate aftermath, sliding from near $74,000 to test the $70,000 level, as institutional players moved to de-risk. The reaction was compounded by a sharp reversal in ETF flows: after a highly bullish seven-day inflow streak that had brought in over $1.1 billion, US-listed spot Bitcoin ETFs recorded a $129 million net outflow on Wednesday alone — snapping the positive run and rattling sentiment.
The sell-off dragged the broader crypto market with it. Ethereum and Solana each fell 5–6% in tandem, confirming that Bitcoin’s near-term correlation with risk assets remains elevated. With BTC’s 30-day correlation to the S&P 500 sitting at 0.74 — the highest of 2026 — the asset is currently trading less like a macro hedge and more like a high-beta tech proxy, a dynamic that leaves it exposed to any further deterioration in equity markets.
Despite the fear reading, there are structural factors that have prevented a more severe breakdown. Open interest data tracked by CoinGlass shows that during yesterday’s dip to $68,750, shorts were actively adding positions — forming what the firm described as a “clean short position buildup.” The price has since rebounded, though OI has not increased meaningfully, suggesting range-bound rather than trending conditions. The lack of new long entry confirms that conviction on the buy side remains cautious, but the shorts have also not fully pressed their advantage.
On the supply side, the picture is more constructive. Miner selling pressure — a persistent headwind throughout the first quarter — is showing signs of fading, with net miner outflows down 82% from their February peak. A significant difficulty adjustment tonight, expected to drop ~7.5%, will further ease cost pressure on the mining industry and reduce near-term forced selling from that cohort.
For now, Bitcoin finds itself in a holding pattern: above the critical $66,827 level where over $1.87 billion in leveraged longs sit exposed, but well below the $73,757 resistance that would trigger a short squeeze. With macro uncertainty elevated, geopolitical tensions unresolved, and sentiment firmly in fear, the burden of proof lies with the bulls to demonstrate fresh conviction before the market can credibly call the bottom in.


Bhutan has sold over $110m in Bitcoin in 2026, cutting sovereign holdings by about 65% from their peak as Druk Holding shifts from mining-led accumulation to steady liquidation.
Summary
- Druk Holding & Investments has offloaded more than $110m in BTC this year, including a 973 BTC transfer worth about $72.3m on March 17–18 routed partly through QCP Capital and Binance.
- Bhutan’s stash has shrunk from roughly 13,000 BTC (over $1.4b and 40% of GDP at peak) to around 5,400 BTC worth about $374m, with no inflows over $100k in more than a year, implying mining has largely stopped.
- The kingdom’s methodical $5–10m clip sales, built on hydropower-funded mining since 2019, now act as a recurring sovereign overhang for Bitcoin just as macro conditions and sentiment remain fragile.
The Kingdom of Bhutan has quietly become one of the most closely watched sovereign Bitcoin sellers of 2026, with its state investment arm offloading more than $110 million worth of BTC since the start of the year — a systematic drawdown that has cut its holdings by 65% from their peak and raised questions about the future of one of crypto’s most unlikely national success stories.
The latest and largest transaction occurred on March 17 and 18, when Druk Holding & Investments — the sovereign wealth fund that manages Bhutan’s digital asset reserves — transferred 973 BTC worth approximately $72.3 million across multiple addresses. Among the recipients was QCP Capital, a Singapore-based institutional trading firm, indicating structured OTC selling designed to minimize market impact rather than distressed dumping onto open exchanges. A portion was also directed toward Binance hot wallets.
Bhutan’s Bitcoin journey began in 2019, when the country began quietly mining BTC using surplus hydroelectric power from its Himalayan rivers — a near-zero marginal cost energy source that made mining highly profitable even at modest price levels. At its peak, Bhutan held approximately 13,000 BTC, valued at over $1.4 billion — a sum representing more than 40% of the country’s entire gross domestic product at the time. Those holdings have since contracted to roughly 5,400 BTC, worth around $374 million at current prices.
A critical detail flagged by on-chain analytics firm Arkham Intelligence adds a new dimension to the story: Bhutan has not recorded a Bitcoin inflow of over $100,000 in more than a year. This strongly suggests the country has halted or severely curtailed its mining operations, shifting from an accumulation-and-hold strategy to a pure liquidation mode. The reasons remain officially unconfirmed, but analysts have pointed to declining mining profitability following the April 2024 halving, rising operational costs, and competing demands on the country’s hydropower infrastructure.
The selling pattern has been methodical rather than reactive. Bhutan typically transacts in $5–10 million clips, with occasional larger tranches when market conditions are favorable. The $72.3 million move this week is an outlier in size, suggesting either an acceleration of the drawdown timeline or an opportunistic decision to lock in prices near the $71,000 level before further deterioration.
For the broader market, the sustained presence of sovereign-scale selling at these volumes is a non-trivial headwind. Unlike retail or even institutional fund selling, sovereign liquidations tend to be price-insensitive and recurring — features that can create persistent ceiling pressure on any attempted recovery. As Bitcoin navigates a fragile macro environment with fear sentiment elevated and ETF flows recently reversing, Bhutan’s quiet but relentless selling is one more structural force the bulls must absorb on the path back to new highs.
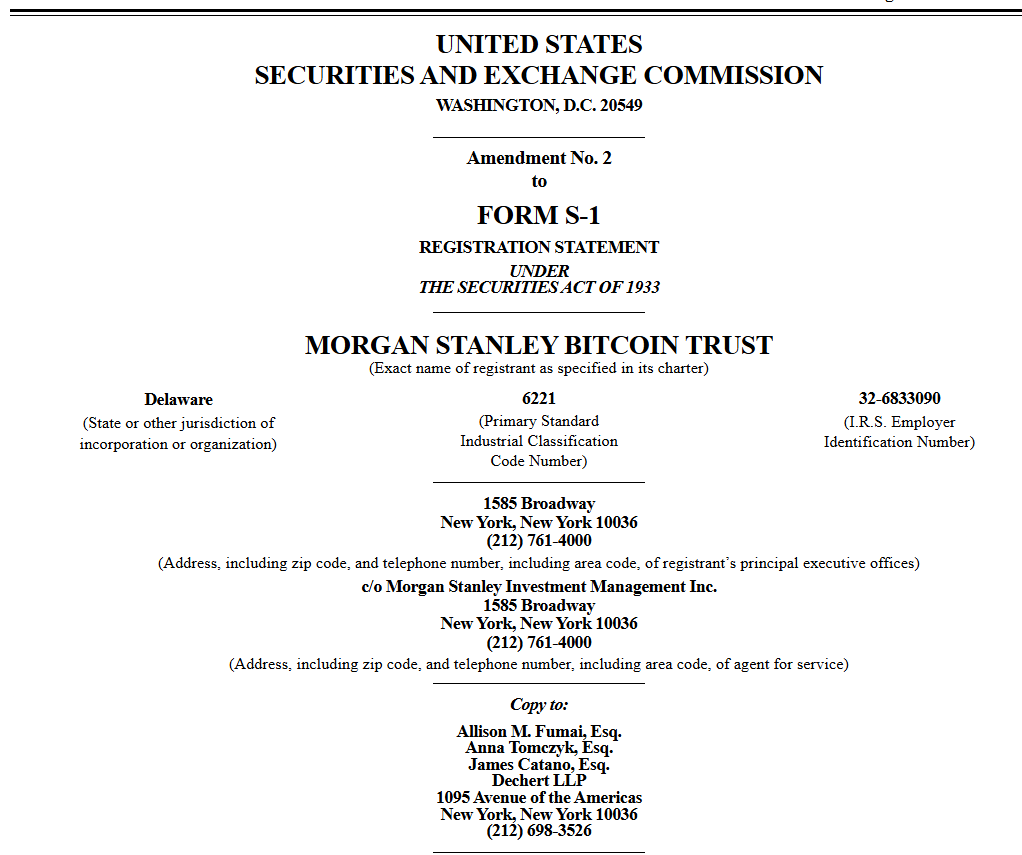
Morgan Stanley filed a second amended S-1 for its proposed spot Bitcoin exchange-traded fund (ETF), detailing seed capital, trading partners and listing plans as the Wall Street bank moves closer to launching the product under the ticker MSBT.
The amended filing says the trust expects to raise $1 million through the sale of 50,000 initial seed shares to its delegated sponsor ahead of listing on NYSE Arca, then use the proceeds to buy Bitcoin (BTC) for the fund. Morgan Stanley said the fund remains subject to regulatory approval before it can begin trading.
The filing lists Jane Street, Virtu Americas and Macquarie Capital as authorized participants, allowing them to create or redeem large blocks of shares and profit from the arbitrage between Bitcoin’s price and the ETF’s share price. This keeps the ETF’s price close to the value of Bitcoin.
Morgan Stanley recommended a 2% to 4% allocation to crypto portfolios for investors and financial advisers in October 2025 and allowed its financial advisors to recommend crypto funds to clients with individual retirement accounts (IRAs) and 401(k)s.

“Morgan Stanley is moving from distributing BlackRock’s IBIT to issuing its own product, capturing management fees directly rather than earning distribution commissions,” Marcin Kazmierczak, co-founder of RedStone, told Cointelegraph, adding that the bank’s 15,000 financial advisors will introduce a real “distribution muscle” for the ETF.
Related: Morgan Stanley, other top holders add Bitmine exposure amid sell-off
Wall Street moves closer to crypto funds
The move adds to a broader push by large US financial institutions to expand access to crypto-related products.
On Jan. 5, 2026, the second-largest US bank, Bank of America, began allowing advisers in its wealth management businesses to recommend exposure to four Bitcoin ETFs, which were previously only available upon request, Cointelegraph reported.
A day earlier, Vanguard, the world’s second-largest asset manager, enabled crypto ETF trading for its clients, reversing its previous stance on digital asset ETFs.
Related: Wells Fargo sees ‘YOLO’ trade driving $150B into Bitcoin and risk assets
BlackRock, the world’s largest asset management firm, recommended an up to 2% Bitcoin allocation to its clients in December 2024.
Magazine: Bitcoin’s ‘biggest bull catalyst’ would be Saylor’s liquidation — Santiment founder

A trader works on the floor of the New York Stock Exchange (NYSE) at the opening bell in New York on March 18, 2026.
Angela Weiss | Afp | Getty Images
The Russell 2000 has fallen more than 10% off its recent high, becoming the first of the major U.S. benchmarks to fall into correction territory.
A correction is defined as a decline of more than 10% and less than 20%.

Russell 2000, 1-year
Small caps actually outperformed to start the year, with the Russell 2000 just 1% off in 2026 as the hope of easier monetary policy and a pivot away from large caps boosted the asset class.
But the benchmark has tumbled this month amid the ongoing war in Iran, which has spurred a more than 50% spike in Brent crude oil futures. The Russell 2000, which has greater exposure to cyclical sectors, is especially sensitive to changes in oil prices and a slowdown in the economic cycle. It’s down more than 6% this month.
The small cap index could soon be joined by other of the major averages. The Dow Jones Industrial Average and the Nasdaq Composite were last more than 9% off their all-time highs. The S&P 500 was off by more than 6%.
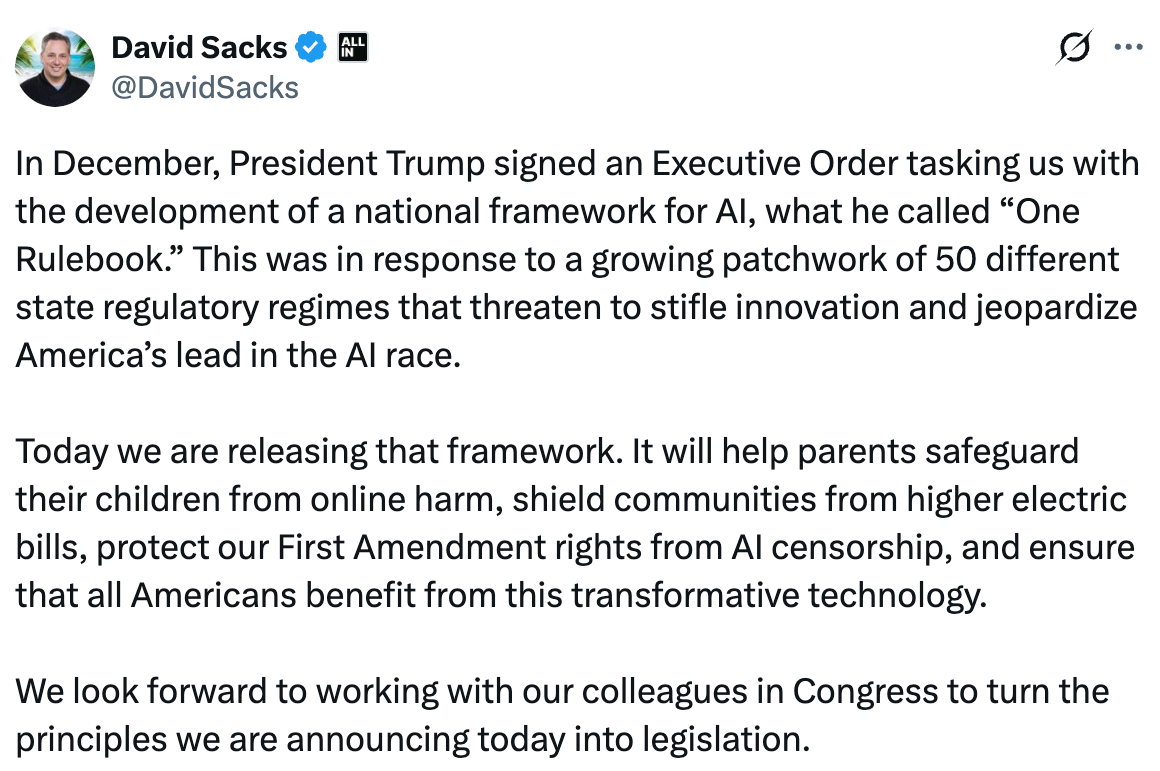
The Trump administration has released a national AI legislative framework for the United States, calling on Congress to establish a unified federal framework and warning that a patchwork of state laws could hinder innovation and competitiveness.
The framework is structured around six core policy areas: protecting children and empowering parents, strengthening communities, intellectual property and creator rights, free speech protections, accelerating AI innovation and workforce development.
At the center of the proposal is a push for a unified federal approach, with the administration urging Congress to preempt state-level AI laws it says could burden developers.

“Congress should preempt state AI laws that impose undue burdens,” the framework states, warning that “a patchwork of conflicting state laws would undermine American innovation and our ability to lead in the global AI race.”
The framework also calls for fewer barriers to AI deployment, regulatory sandboxes and expanded access to federal datasets, while opposing the creation of a new dedicated AI regulator.
On intellectual property, the proposal states:
Although the Administration believes that training of AI models on copyrighted material does not violate copyright laws, it acknowledges arguments to the contrary exist and therefore supports allowing the Courts to resolve this issue.
It also ties AI expansion to energy policy, urging faster permitting for data centers and support for on-site power generation, while saying residential ratepayers should not bear the cost of new infrastructure.
Additional measures include tools to protect minors online, efforts to combat AI-enabled fraud and workforce training initiatives aimed at preparing workers for AI-driven shifts.
The framework is nonbinding and will require Congressional action to be enacted.
Related: Super Micro co-founder arrested over alleged $2.5B AI chip smuggling scheme
Layoffs begin to mount as AI adoption accelerates across crypto
While the White House framework emphasizes workforce development and job creation in an AI-driven economy, it does not address the risk of job displacement as adoption accelerates across industries.
That shift has already become visible in the crypto sector, where companies are rapidly integrating AI across operations. Over the past two months, a growing number of fintech and crypto companies have reported layoffs.
In February, Jack Dorsey’s payments company Block said it would cut roughly 40% of its workforce, with the co-founder pointing to the rapid use of AI tools as a key driver behind the restructuring.
More recently, blockchain data provider Messari announced layoffs alongside a leadership change, as the company pivots toward an AI-first strategy following an earlier round of cuts in 2025.
The trend continued this week, with Crypto.com saying it plans to cut up to 12% of its workforce as it integrates AI across its operations. On Thursday, CEO Kris Marszalek warned on X that “companies that do not make this pivot immediately will fail.”
Volatility in the crypto market has also led to staff reductions. On Wednesday, the Algorand Foundation said it would cut about 25% of its workforce, citing broader market downturns and macroeconomic uncertainty.

Magazine: Are DeFi devs liable for the illegal activity of others on their platforms?


The FBI just issued a warning about a new crypto scam hitting Tron wallets.
Fake tokens impersonating the bureau are being airdropped directly into user wallets. The tokens mimic official seizure notices, telling holders their assets are frozen over money laundering violations. The goal is simple: panic the user into interacting with the token and hand over their credentials.
This is not a generic phishing attempt. It is a targeted social engineering campaign aimed at high-net-worth wallets, some holding 7-figure USDT balances. The FBI’s New York office issued the warning explicitly, telling users to ignore any token claiming to be from the agency.
The scam tokens were created 8 days before the warning dropped. By the time the alert went out, at least 728 wallets were already holding them.
- Impersonation Tactic: Scammers are deploying TRC-20 tokens branded as “FBI” assets to intimidate users into disclosing private keys under threat of AML investigation.
- Wallet Exposure: The campaign specifically targets active Tron wallets, with initial data showing multiple targeted addresses holding over $1 million in USDT.
- Market Impact: This tactic contributes to a 45% year-over-year increase in crypto fraud losses, signaling a shift from simple smart contract exploits to psychological coercion.
The Anatomy of the ‘FBI Token’ Scam
The attack is low cost and high volume. Tron’s cheap fee structure makes it easy to carpet-bomb wallets with fake TRC-20 tokens. One identified address executed roughly 920 transactions for just $40 in TRX fees.
The mechanic runs on fear. Tokens land in wallets with memos claiming assets are frozen over regulatory violations. From there, users are pushed toward phishing sites demanding personal details.
Others fall for address poisoning, where attackers generate addresses matching the first and last characters of legitimate contacts, banking on panic-induced copy-paste errors.
The numbers behind this kind of fraud are not small. The FBI confirmed crypto fraud losses reached billions in 2024, up 45% compared to 2022. The shift is clear. Hackers are targeting the user, not the code.
For exchanges handling TRX transactions, this federal advisory creates a direct compliance problem. A documented warning linking the network to law enforcement impersonation is not something compliance officers can ignore.
With the stablecoin bill in its final stages and pressure mounting on platforms to prove anti-fraud controls, Tron’s dominance in USDT transfers cuts both ways. It is critical infrastructure and the preferred rail for this exact type of scam.
That said, If an unverified token appears in your wallet, do not touch it.
Discover: The best new crypto in the world
The post FBI Warns of Fake Crypto Tokens Impersonating the Agency on Tron Network appeared first on Cryptonews.

‘I feel so grateful to be alive,’ Kent University meningitis survivor says
Suddenly Everyone in San Francisco Is a ‘Builder,’ Whatever That Means

Alisson: Liverpool goalkeeper to miss Brighton match and out of Brazil squad because of injury


-
 Crypto World7 days ago
HYPE Token Enters Net Deflation as HyperCore Buybacks Outpace Staking Rewards
-

 Tech5 days ago
Your Legally Registered ‘Motorcycle’ Might Not Count Under Proposed US Law
-
 Tech3 days ago
Are Split Spacebars the Next Big Gaming Keyboard Trend?
-
Sports6 days ago
Why Duke and Michigan Are Dead Even Entering Selection Sunday
-

 Business5 days ago
Search for Savannah Guthrie’s Mother Enters Seventh Week with No Arrests
-

 Business6 days ago
US Airports Launch Donation Drives for Unpaid TSA Workers as Partial Government Shutdown Enters Fifth Week
-
Crypto World6 days ago
Coinbase and Bybit in Investment Talks: Could Bybit Finally Enter the US Crypto Market?
-

 Business4 days ago
Australian shares drop as Iran war enters third week
-

 Business6 days ago
Country star Brantley Gilbert enters growing non-alcoholic beer market
-

 Politics2 days ago
The House | The new register to protect children from their abusers shows Parliament at its best
-

 Crypto World4 days ago
Crypto Lender BlockFills Enters Chapter 11 with Up to $500M in Liabilities
-

 Sports7 days ago
College Basketball Best Bets: Conference Tournament Semifinal Picks
-

 News Videos2 days ago
RBA board divided on rate cut, unusually buoyant share market | Finance Report | ABC NEWS
-

 Fashion4 days ago
25 Celebrities with Curly Hair That Are Naturally Beautiful
-

 Tech14 hours ago
inKONBINI Lets You Spend Summer Days Behind the Register
-

 Crypto World2 days ago
Canada’s FINTRAC revokes registrations of 23 crypto MSBs in AML crackdown
-
 Politics3 days ago
Real-time pollution monitoring calls after boy nearly dies
-

 Crypto World6 days ago
Crypto Losses Drop 87% in February, But Hackers Are Now Targeting People, Not Code
-
 NewsBeat2 days ago
Residents in North Lanarkshire reminded to register to vote in Scottish Parliament Election
-

 Business4 days ago
Meta planning major layoffs as AI spending and automation reshape workforce


You must be logged in to post a comment Login