
Crypto World
Analyst warns traders pricing in TACO trade could face a rude awakening

Traders are underestimating how deeply the current conflict in the Middle East could reshape the macro backdrop, with some positioning around a so‑called “TACO trade”—short for “Trump always chickens out”—dominating chatter in crypto and broader markets. Nic Puckrin, founder of Coin Bureau, popularized the term to describe a supposed tendency for U.S. leadership to back away from geopolitical flare‑ups. But he cautions that the situation is far more intricate than a single decision by any one leader, and there are no quick exits from a widening conflict.
Oil prices have become a central barometer for the scenario. If crude stays above $100 per barrel, growth in the United States could slow while Personal Consumption Expenditures inflation rises, potentially by as much as one percentage point, according to Puckrin. That dynamic would complicate the Federal Reserve’s already delicate task of steering policy in an environment where inflation remains persistent and growth is uncertain. The risk of stagflation—the painful combination of rising prices with weak growth and employment—emerges as a real possibility if energy costs stay elevated through the second and third quarters.
Key takeaways
- Oil could stay a decisive driver: Sustained prices above $100 per barrel threaten growth and lift inflation in tandem, increasing stagflation risk.
- The TACO trade is not a guaranteed play: While the term captures a belief in limited appetite for geopolitical escalation, experts warn that policymakers and markets should expect a more complex, drawn‑out conflict with no easy exit.
- Strait of Hormuz disruption compounds the risk: Prolonged disruption through the vital chokepoint raises the energy price floor and feeds into broader inflation dynamics.
- Policy path remains uncertain: The Fed held rates at 3.5%–3.75%, with market odds of a near‑term cut fading and a non‑zero probability (about 12%) of a rate increase at the next meeting.
- Crypto and risk assets face a nuanced outlook: Higher energy costs and uncertain monetary policy can dampen liquidity for risk assets, even as some traders seek hedges or tactical exposure.
Oil shocks, chokepoints, and the market’s fragile balance
The incoming energy data and geopolitical risk have pushed crude higher in recent sessions, with WTI briefly touching the high‑end of the $110s and flirting with $120 per barrel as the conflict widened. The persistent tension around the Middle East has intensified concerns that global supply flows could be constrained if oil infrastructure faces sustained disruption. Market observers point to the Strait of Hormuz as a pivotal artery—through which a sizable portion of the world’s oil shipments pass—and note that any sustained closure or damage could push prices higher for an extended period.
Analysts emphasize that even a reopening of maritime routes would not instantly restore pre‑crisis conditions. “Disruption to the Gulf’s oil-producing infrastructure will take months to rebuild,” one commentator noted, underscoring the slow‑burn impact on prices and the broader economy. The energy price surge feeds through to a wide array of goods and services, often lifting inflation broadly rather than affecting a single sector in isolation. In such a regime, inflationary pressures can push the real cost of living higher while limiting the central bank’s ability to loosen financial conditions quickly.
Beyond the immediate supply shock, energy is a fundamental input into nearly all economic activity. When energy costs rise, every sector faces higher costs, and central banks can find themselves juggling the risk of inflation against the imperative to support growth. The macro calculus becomes especially delicate if markets price in a persistent energy premium that persists through the next several quarters, complicating any hopes of an early, policy‑driven risk‑on rally for crypto and other speculative assets.
Policy uncertainty and the Fed’s calculated stance
The Federal Open Market Committee’s decision to hold the Federal Funds rate at 3.5%–3.75% in March reflected a cautious stance in the face of renewed energy‑driven inflation risks. Market observers say that near‑term rate cuts have faded from the central scenario, while a minority of traders assign a non‑negligible probability to a rate move higher in the near term, as reflected by the CME Group’s FedWatch tool, which placed the odds of a hike at around 12% for the next meeting.
Fed Chair Jerome Powell acknowledged that the economic implications of the Middle East conflict are unclear in the near term. Speaking at a press conference, he stressed that while energy prices are a potential drag on inflation and growth, it is still “too soon” to accurately gauge the full scope of the disruption’s impact on the broader economy. The central bank’s ongoing assessment will hinge on incoming data, including energy price trajectories, inflation readings, and indicators of domestic demand.
Measured against today’s macro backdrop, the risk premium for risk assets, including crypto, could be influenced by how energy costs evolve and how quickly monetary policy adapts. If energy prices remain elevated and inflation proves more persistent than anticipated, the Fed may lean toward a tighter stance for longer, which could constrain liquidity in markets and temper speculative appetites. Conversely, any signs of cooling inflation or a surprise easing in market stress could renew expectations for looser policy and a more favorable environment for higher‑beta assets.
What readers should watch next
Investors should monitor three interconnected threads in the coming weeks: first, the trajectory of global oil prices and the duration of any supply disruptions through strategic chokepoints; second, the evolving assessment of inflation and growth signals that inform Fed policy; and third, how sentiment around geopolitical risk interacts with liquidity conditions in crypto markets. With the energy‑inflation nexus likely to dominate near‑term headlines, traders would be wise to differentiate between narrative positioning and data‑driven developments as markets digest the evolving risk landscape.
In this environment, the market’s reflex to geopolitical risk could remain biphasic: periods of reprieve followed by renewed volatility as new information emerges about the conflict’s scope, energy infrastructure resilience, and policy responses. Keep an eye on energy price momentum, central bank communications, and liquidity signals across major crypto and traditional risk assets to gauge where the next phase of the cycle may lead.


Bitcoin’s mining difficulty is set to drop about 7.5% tonight, the sharpest fall since the 2022 bear, as hash rate leaves the network and miner margins get relief.
Summary
- CoinWarz estimates difficulty will fall from 145.04 trillion to 134.09 trillion at around 20:51 UTC, a roughly 7.55% drop and the steepest since the 2022 bear phase.
- The adjustment reflects slower blocks at about 10.82 minutes on average as unprofitable miners switch off, compressing hash price and forcing out higher-cost operators.
- A drop of this size often signals miner capitulation; weaker players exit while survivors gain share and margins, potentially reducing forced sell pressure on BTC down the line.
Bitcoin’s (BTC) mining difficulty is on the verge of its steepest downward adjustment in years, with the network recalibration expected to take place tonight at approximately 20:51 UTC (21:51 CET). According to live data from CoinWarz, difficulty will fall from the current level of 145.04 trillion to an estimated 134.09 trillion — a decline of roughly 7.55%.
If confirmed, this will be the largest single difficulty drop since China’s 2021 mining ban triggered a mass exodus of hash rate, and it would rival — or exceed — the severity of drops seen during the depths of the 2022 bear market, according to analysis from The Miner Mag. The adjustment covers the current 2,016-block epoch, during which average block times have stretched to approximately against the 10-minute target — a clear signal that hash rate has been leaving the network at a meaningful pace.
The timing could hardly be more pointed. Bitcoin has fallen roughly 10% from the $76,000 level it briefly tested earlier this month, and is currently trading around $69,600. For miners operating on thin margins, the combination of a lower BTC price and the same — or higher — difficulty level creates a brutal squeeze on profitability. Hash price, a key metric measuring expected revenue per unit of computing power, has been compressed for weeks, forcing less efficient operators to scale back or shut down rigs entirely.
The outgoing hash rate is the direct cause of this adjustment. When miners go offline — whether due to unprofitable economics, rising energy costs, or hardware upgrades — blocks take longer to find. The Bitcoin protocol detects this slowdown over the 2,016-block window and automatically lowers the difficulty target to bring block production back toward the intended 10-minute interval. It is a self-correcting mechanism that has operated without interruption since Bitcoin’s earliest days.
For surviving miners, the adjustment delivers immediate relief. A lower difficulty means less computational effort is required per block, reducing the effective cost of mining each BTC. All else equal, the ~7.5% drop will improve miner revenue margins proportionally — a meaningful lifeline for operations that have been grinding through a period of compressed hash price and falling BTC revenue in USD terms.
The broader market implication is also worth watching. Difficulty drops of this magnitude have historically coincided with miner capitulation phases — periods when the weakest hands exit the network, after which the remaining miners consolidate market share and cost structures improve. Historically, such capitulation events have preceded price recoveries, as the sell pressure from distressed miners eases. Whether that pattern holds in the current macro environment — marked by Middle East tensions, risk-off equity markets, and a cautious Federal Reserve — remains to be seen. But tonight’s difficulty adjustment will at minimum reset the playing field for Bitcoin’s mining industry heading into the weekend.


Robert Kiyosaki says an imminent “biggest financial bubble in history” will end in a crash that sends Bitcoin to $750k and Ethereum to $95k within a year, even as critics doubt his methods.
Summary
- Kiyosaki argues a financial bubble inflated since 2008 will soon burst and forecasts Bitcoin at $750,000 and Ethereum at $95,000 within one year of that crash, alongside gold at $35,000 and silver at $200.
- He frames BTC, ETH, gold, and silver as scarce “escape hatches” from fiat, noting he recently bought another 1 BTC around $67,000 and claims he would still buy more even if price fell to $6,000.
- Critics highlight his decade-long record of missed crash calls and say his numbers lack rigorous modeling, but his alarm now lands amid tighter Fed policy and rising geopolitical risk.
Robert Kiyosaki, the author of Rich Dad Poor Dad and one of the crypto space’s most vocal mainstream advocates, has issued his most dramatic price predictions yet — forecasting Bitcoin (BTC) at $750,000 and Ethereum at $95,000 within one year of what he describes as an imminent and catastrophic global financial crash.
Speaking on X, Kiyosaki framed his outlook around the thesis that the world is approaching the “biggest financial bubble in history” — one he argues has been inflating since the root causes of the 2008 financial crisis were papered over with stimulus and monetary expansion rather than resolved structurally. His message was unambiguous: the question is no longer whether a crash will happen, but when.
The post-crash price targets Kiyosaki outlined are striking in their scale. For Bitcoin, he projects a rise to $750,000 per coin within a year of the collapse — a roughly 10x move from current levels near $69,900. For Ethereum, his target of $95,000 implies an approximately 45x gain from where ETH trades today at around $2,130. He also projected gold reaching $35,000 per ounce and silver hitting $200 in the same post-crash window — suggesting a broad revaluation of scarce, non-sovereign assets as confidence in fiat currencies erodes.
The underlying logic Kiyosaki applies is consistent with his long-held worldview: when the traditional financial system fractures, assets with capped supply or physical scarcity — Bitcoin, gold, silver — will be the primary beneficiaries of the capital flight that follows. He has continued to put his money where his mouth is, most recently disclosing the purchase of an additional 1 BTC at approximately $67,000, and stating he would consider buying more if prices fell to $6,000.
Critics, however, are quick to note the limitations of Kiyosaki’s track record. His crash predictions span more than a decade, with calls for collapses in 2016 and 2020 that did not materialize as forecast. One response to his latest post on X summarized the skeptical view plainly: his forecasts are “big numbers to grab attention,” lacking the methodological grounding of rigorous financial analysis. Others pointed out that major crashes rarely stem from a single trigger, but rather from compounding pressures — tighter monetary policy, credit contraction, and forced asset repricing — a dynamic already partly visible in current market conditions.
That said, Kiyosaki’s warnings land at a moment when macro conditions are unusually fraught. The Federal Reserve held rates steady this week while signaling fewer cuts ahead. Geopolitical tensions in the Middle East are escalating. Bitcoin’s 30-day correlation with equities is at its highest of 2026. Whatever one thinks of his methodology, the macro backdrop he has been warning about for years looks more plausible today than at any point in recent memory.

Key Takeaways
- Coinbase generated $6.9B in total revenue for 2025 with $1.26B net profit, though Q4 showed a net loss
- Robinhood achieved all-time high 2025 revenue of $4.5B and record diluted EPS of $2.05
- Coinbase operates as a dedicated cryptocurrency exchange; Robinhood diversifies across crypto, equities, derivatives, and memberships
- Analysts assign Coinbase a Hold rating while Robinhood receives a Moderate Buy
- Average analyst price targets: Coinbase at $272.31, Robinhood at $120.59
When it comes to cryptocurrency-linked equities, Coinbase and Robinhood dominate investor conversations. However, these platforms represent fundamentally distinct investment opportunities with contrasting business models.
Coinbase operates as a dedicated cryptocurrency platform. The company’s core revenue drivers include digital asset trading, stablecoin operations, institutional custody services, and blockchain infrastructure solutions. The business thrives during bull markets but can experience significant headwinds when crypto sentiment deteriorates.
Robinhood functions as a comprehensive retail investment ecosystem. Revenue flows from equity trading, derivatives, cryptocurrency transactions, premium memberships, and interest earnings. While crypto contributes meaningfully, it represents just one component of a diversified revenue model.
Throughout 2025, Coinbase recorded approximately $6.9 billion in net revenue. Transaction fees contributed roughly $4.1 billion, while subscription-based and service offerings generated $2.8 billion. Annual net income reached approximately $1.26 billion.
Yet Coinbase’s fourth quarter 2025 performance highlighted the business’s inherent volatility. Despite annual profitability, the company posted a quarterly net loss, underscoring its continued dependence on fluctuating trading activity.
Robinhood Delivers Breakthrough Performance
Robinhood experienced an exceptional 2025 fiscal year. The platform reported all-time high revenue of $4.5 billion, with Q4 alone contributing $1.28 billion. Annual diluted earnings per share reached a record $2.05, while Q4 EPS came in at $0.66.
The company also attracted unprecedented net deposits totaling $68 billion throughout 2025. Its premium offering, Robinhood Gold, expanded to 4.2 million paying subscribers.
These metrics demonstrate a platform successfully evolving beyond simple trade execution into a comprehensive financial services provider. This diversification strategy provides insulation when individual market segments experience downturns.
Wall Street Analyst Perspectives
Current Wall Street consensus assigns Coinbase a Hold rating. According to MarketBeat tracking, the stock carries 19 Buy recommendations, 11 Hold ratings, and 3 Sell calls. The average analyst price target sits at $272.31.
Robinhood commands a Moderate Buy consensus rating. Analyst coverage includes 17 Buy ratings, 6 Hold recommendations, and 1 Sell call. The consensus target price stands at $120.59.
Essentially, the analyst community exhibits slightly greater optimism toward Robinhood presently. Coinbase receives more cautious treatment due to its concentrated exposure to cryptocurrency market fluctuations.
The bullish thesis for Coinbase centers on pure-play cryptocurrency exposure. When digital asset trading accelerates or stablecoin adoption increases, Coinbase captures upside across multiple business segments.
The bearish counterargument focuses on earnings volatility. Financial results can swing dramatically based on market conditions, exemplified by the Q4 quarterly loss despite full-year profitability.
Regarding Robinhood, the optimistic case emphasizes platform diversity. Multiple independent revenue channels reduce dependence on any single market segment.
The skeptical perspective questions valuation and growth sustainability. Should user acquisition or product innovation decelerate, the premium valuation investors currently assign may contract.
Robinhood Gold membership climbed to 4.2 million subscribers in 2025, while the platform captured record net deposits of $68 billion annually.
Bottom Line
Both equities provide cryptocurrency market exposure through distinctly different mechanisms. Coinbase represents the higher-volatility, potentially higher-return pure cryptocurrency play. Robinhood offers greater stability through diversification. The optimal selection depends on your individual risk tolerance and investment objectives.


Key Highlights
- Q4 2025 earnings scheduled for pre-market release on March 24, 2026
- Wall Street consensus: $0.37 earnings per share (compared to $0.30 last year) and $1.47 billion in revenue (15% year-over-year increase)
- Shares have gained approximately 14% in 2026, currently trading near $23.27 within a 52-week span of $19.93–$35.81
- Balance sheet features $8.8 billion cash reserves plus Bitcoin assets valued at roughly $519 million
- Insider buying totaled 517,000 shares over three months; consensus analyst rating stays at “Reduce” with $13.50 price objective
GameStop enters its fourth-quarter fiscal 2025 earnings announcement riding positive momentum. Shares have climbed about 14% since January, driven by revived retail investor interest and confidence in CEO Ryan Cohen’s transformation plan.
The financial release is scheduled for Tuesday morning, March 24, followed by a conference call at 4:00 PM Eastern Time.
Analyst consensus calls for earnings per share of $0.37, representing growth from the $0.30 figure reported in the corresponding period last year. Top-line expectations stand at $1.47 billion, which would mark a 15% year-over-year expansion, based on TipRanks compilation.
This forecast represents a notable improvement over the third quarter, when GameStop delivered adjusted earnings of $0.24 per share — surpassing the $0.18 projection — while revenue declined 4.6% year-over-year to $821 million. The revenue shortfall highlighted persistent challenges from the gaming industry’s ongoing digital transformation.
Shares currently hover around $23.27, bracketed by a 52-week trading range spanning $19.93 to $35.81. Technical indicators show the 50-day moving average at $23.34 and the 200-day at $23.11. The company carries a market capitalization of $10.43 billion, with a price-to-earnings multiple of 28.38 and volatility coefficient (beta) of 2.12.
Critical Investor Considerations
Investors are concentrating on three primary factors as the earnings date approaches. First, developments regarding GameStop’s cryptocurrency treasury initiative — specifically acquisition volumes and valuation implications. Second, evidence of sustainable top-line expansion after consecutive quarters of revenue contraction. Third, management commentary from Cohen regarding capital deployment plans, particularly potential merger and acquisition activity.
GameStop’s financial position commands attention. The retailer concluded Q3 holding $8.8 billion in cash and marketable securities, nearly doubling the $4.6 billion reported twelve months prior. Additionally, the company maintained Bitcoin holdings valued at approximately $519 million — an intentional element of its treasury management approach.
Liquidity metrics remain robust, with the quick ratio reaching 9.77 and the current ratio standing at 10.39, indicating strong financial stability despite ongoing revenue headwinds.
Wall Street Sentiment and Internal Trading Activity Show Divergence
Analyst perspectives remain conservative. Weiss Ratings elevated GME from “sell (D+)” to “hold (C-)” during February. However, the MarketBeat consensus rating continues at “Reduce,” accompanied by a $13.50 price target — substantially below present market prices.
Insider transactions paint a contrasting picture. Throughout the previous 90 days, company insiders executed net purchases totaling 517,000 shares valued at approximately $10.9 million. Director Lawrence Cheng acquired 5,000 shares at $22.87 during January. Conversely, General Counsel Mark Robinson divested 12,200 shares at $21.00 in the identical timeframe, reducing his stake by 10.4%.
Institutional investors control 29.21% of outstanding shares. Multiple asset managers — including Panagora Asset Management and UMB Bank — incrementally expanded their holdings during the third and fourth quarters.
GME concluded fiscal Q4 2025 with Bitcoin assets approximating $519 million, and investors will scrutinize whether March 24’s financial data justifies the year-to-date price appreciation.
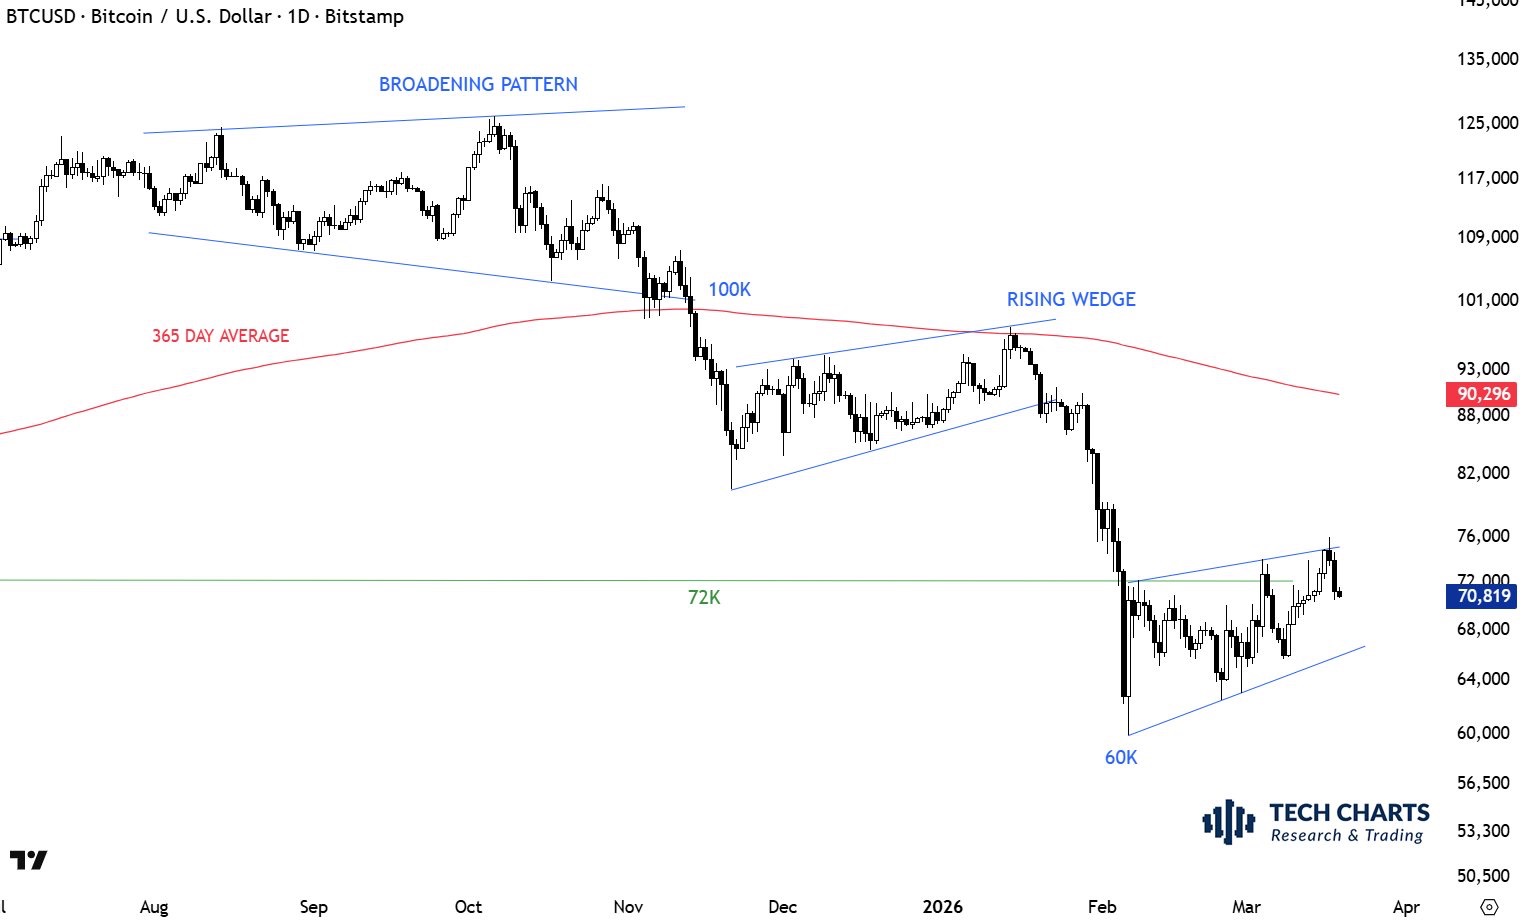
Bitcoin searches for equilibrium at $70,000 while rising crude oil prices and tanking stock markets have investors worried over the future of inflation in the US.
Bitcoin’s (BTC) swift rejection from its $76,000 range high on Tuesday, and the subsequent sell-off below $70,000, raised concerns among traders that the bottom is not in for BTC.
Chartered market technician Aksel Kibar suggested that a bearish wedge pattern similar to the one seen from December 2025 to early January 2026 may be forming again.
Kibar said,
“Breakdown of the lower boundary will be the signal for a possible move towards $52.5K.”

Kibar also referenced an X social post from Jan. 18, 2026, where he explained that BTC would need to respect its year-long average as “part of the chop and search for a base.”
Kibar said that “the pattern can become a rising wedge, usually bearish in an attempt to test $73.7K-$76.5K support area.”
Bitcoin follows US stocks as high oil prices and rising inflation rock markets
Bitcoin’s tumble below $70,000 followed sharp selling in US stocks, where traders’ concerns over crude oil prices, the cost of the US and Israel-Iran war and its impact on inflation zapped investor confidence.
Related: Bitcoin vs gold shows potential bottom signals as BTC bulls defend $70K
In a post discussing how the current decisions by the Trump administration could impact inflation, The Kobeissi Letter said,
“The market now sees a 50% chance of a US Fed rate HIKE by the end of 2026. Just months ago, markets saw as many as four rate CUTS this year.”
In its BTC Options Weekly report, Glassnode analysts concluded that “Bitcoin has reintegrated its range after a short-lived deviation above the $75K level.”
The analysts explained that within the options market, Bitcoin’s “short gamma at $75K has been unwound.”
“Beneath the pullback, the breakout has lost momentum and range conditions are returning.”
This article does not contain investment advice or recommendations. Every investment and trading move involves risk, and readers should conduct their own research when making a decision. While we strive to provide accurate and timely information, Cointelegraph does not guarantee the accuracy, completeness, or reliability of any information in this article. This article may contain forward-looking statements that are subject to risks and uncertainties. Cointelegraph will not be liable for any loss or damage arising from your reliance on this information.
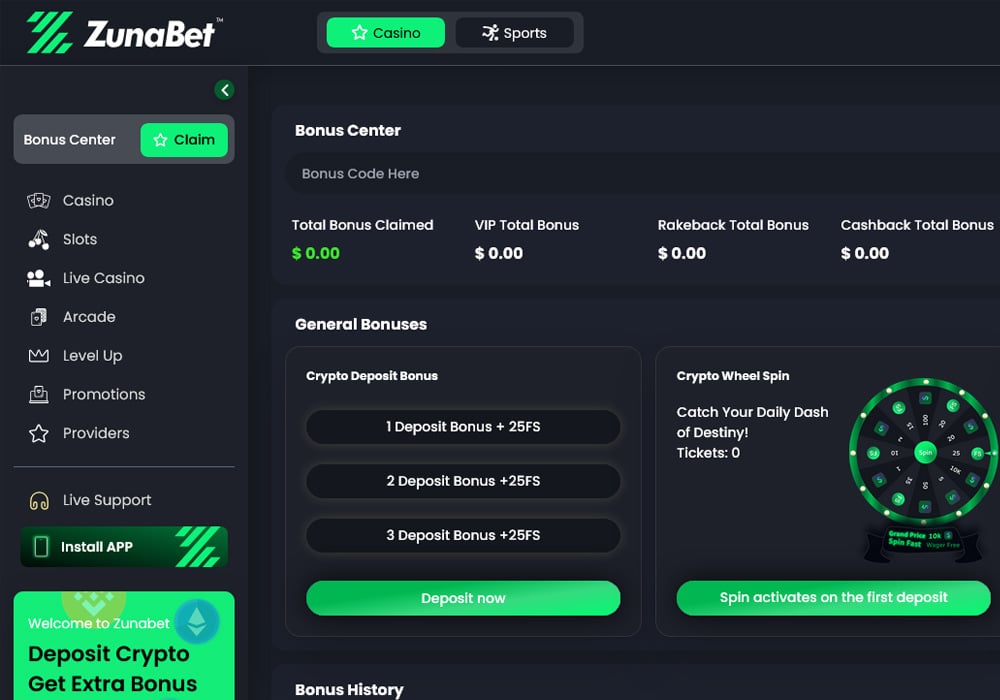
The online gambling conversation used to revolve around a small group of major operators. DraftKings, along with a few other household names, dominated headlines, advertising, and player sign-ups. That has not changed entirely, but something else is happening alongside it. A growing number of players are actively searching for crypto-native alternatives, and platforms like ZunaBet are showing up in those searches with increasing frequency.
This does not mean ZunaBet is about to replace DraftKings. They serve different audiences in different ways. But understanding how they compare reveals a lot about where different segments of the gambling market are heading. Here is what each platform brings and where the differences matter most.
DraftKings: The Household Name
DraftKings grew from a daily fantasy sports startup into one of the biggest legal gambling operators in the United States. It is publicly traded, licensed across multiple US states, and backed by partnerships with major sports leagues and media companies. Its brand recognition is enormous, built on years of advertising during live sports broadcasts and integration into mainstream sports culture.
The sportsbook is the centrepiece. DraftKings covers NFL, NBA, MLB, NHL, soccer, tennis, golf, MMA, and just about every other sport with a significant American following. Live betting, same-game parlays, and regular promotional odds boosts keep the experience engaging for bettors who follow the major leagues closely.
Casino games are available in states that permit online casino gambling. The selection includes slots, table games, and live dealer options from recognized providers. The library is solid within each approved market, but availability and game count vary from state to state based on what local regulators allow.

All transactions at DraftKings run through traditional payment channels. Bank transfers, debit cards, and approved processors handle deposits and withdrawals. Full identity verification is required before any wagering can take place. These are standard conditions for any operator working within the US legal framework.
The loyalty program operates under the Dynasty Rewards banner. Players collect Crowns through wagering, which convert into DK Dollars at fixed rates. Multiple tiers exist, and the system provides some return on play. However, the actual percentage returned to players is modest, and the structure is designed more to encourage continued betting volume than to deliver substantial cashback.
DraftKings excels at what it was built for: serving American sports bettors within a regulated, fiat-based environment. For that specific audience, it is one of the best products available. But its design leaves gaps for players who want something different.
ZunaBet: Filling Those Gaps
ZunaBet launched in 2026 and was purpose-built for a different kind of player. It is operated by Strathvale Group Ltd, registered in Belize, and holds an Anjouan gaming license (ALSI-202510047-FI2). The founding team carries more than 20 years of combined experience across the online gambling industry.
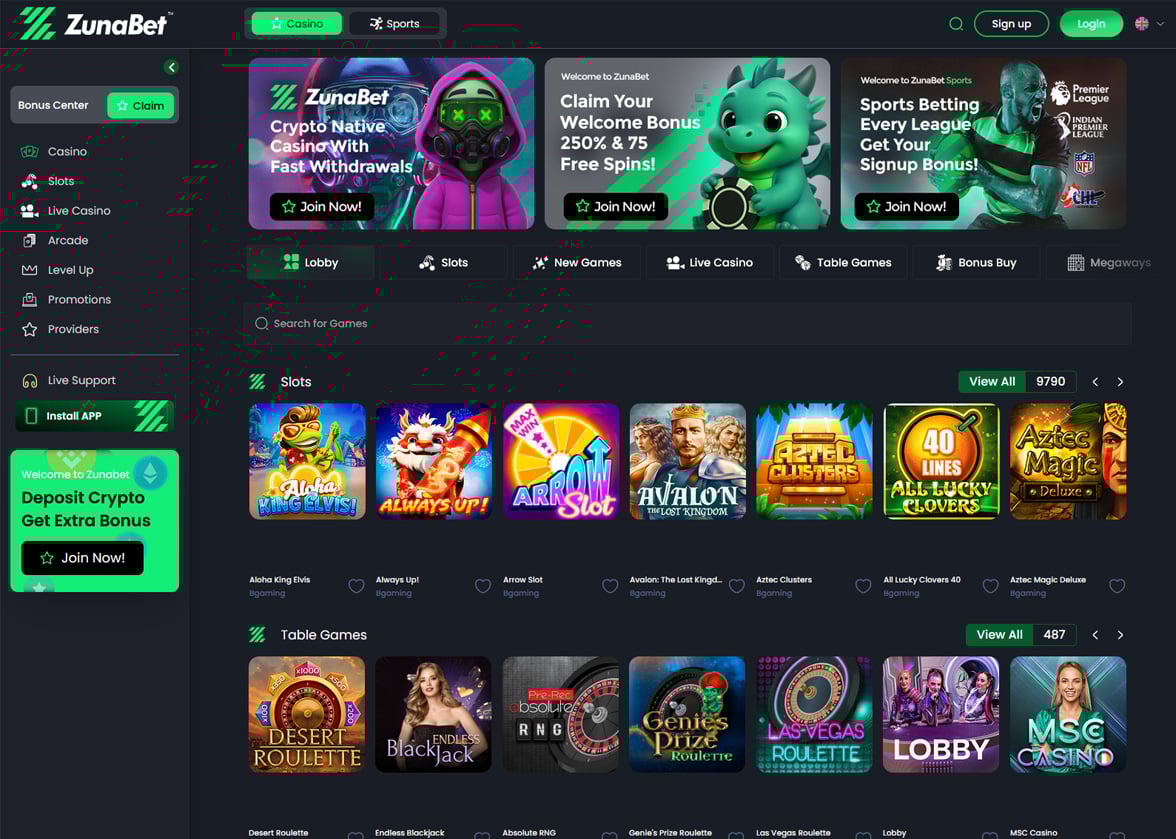
The first thing that separates ZunaBet from a platform like DraftKings is the game count. ZunaBet hosts 11,294 games from 63 different providers. That library includes titles from Pragmatic Play, Hacksaw Gaming, Evolution, Yggdrasil, BGaming, and many more. Slots lead the catalog, but RNG table games and live dealer rooms with professional hosts contribute meaningful depth. No single US-regulated platform comes close to matching this number, primarily because regulatory requirements cap what can be offered in any given state.
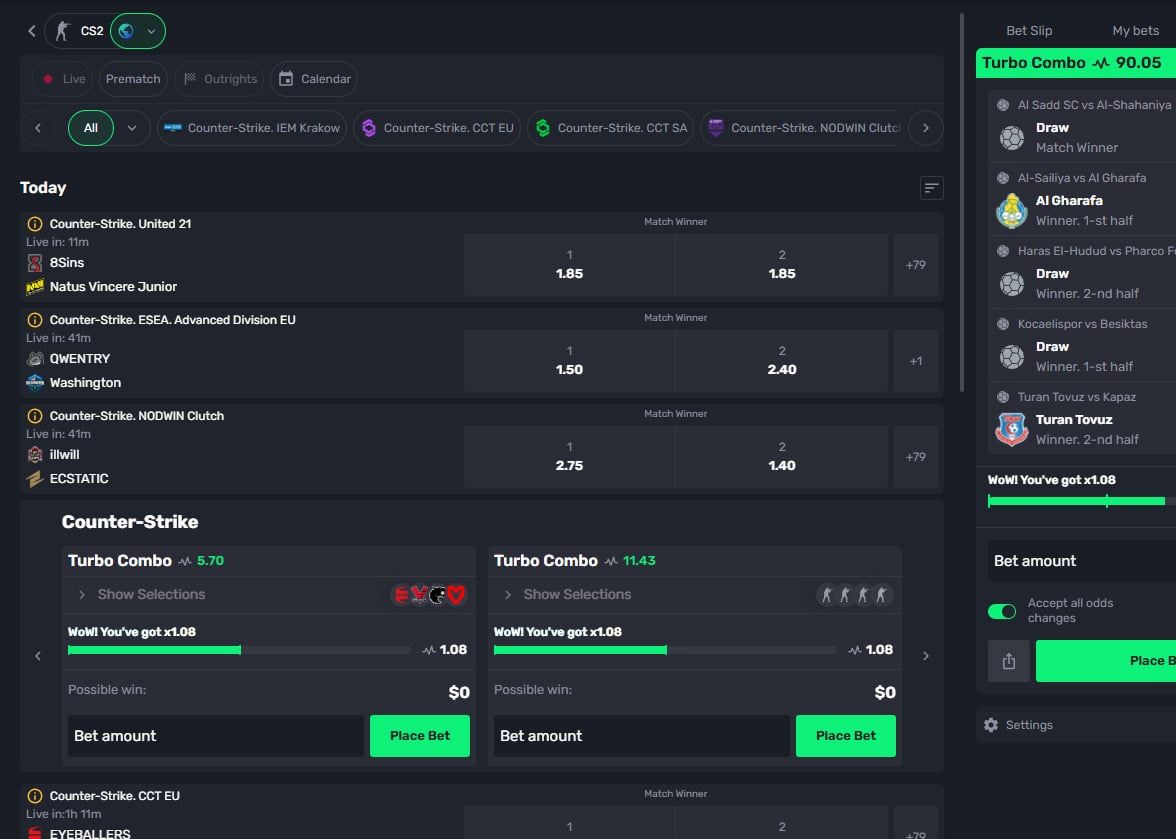
The sportsbook at ZunaBet runs as a full product alongside the casino. Coverage spans football, basketball, tennis, NHL, and other major leagues. Esports betting goes deep with markets for CS2, Dota 2, League of Legends, and Valorant. Virtual sports and combat sports add categories that traditional sportsbooks often overlook. The entire offering operates as an integrated platform where switching between a casino session and a sports bet takes seconds.
Payments are crypto-first. ZunaBet accepts over 20 cryptocurrencies: BTC, ETH, USDT across multiple blockchain networks, SOL, DOGE, ADA, XRP, and additional tokens. The platform charges no processing fees, and withdrawals move quickly. Players use whatever coin they already hold in their wallet.
The welcome bonus package reaches up to $5,000 in matched deposits plus 75 free spins over three deposits. The breakdown is clean: 100% match up to $2,000 and 25 spins on the first deposit, 50% up to $1,500 and 25 spins on the second, and 100% up to $1,500 and 25 spins on the third. No progressive unlock systems or points-based release mechanics. Just clear matched deposits spread across three visits.
Native apps exist for iOS, Android, Windows, and MacOS. The web platform runs on HTML5 with a dark interface, responsive layout, and fast performance. Live chat support is available at all hours.
Games: Regulation Creates a Ceiling
DraftKings operates under state-by-state licensing in the US. Each state has its own gaming commission that approves which providers and games can appear on the platform. The result is that game libraries differ depending on where a player is located, and the total count in any single state is a fraction of what an internationally operating platform can offer.
ZunaBet does not face those constraints. With 63 providers contributing to the platform, the game catalog runs deeper and wider than what any single regulated US market permits. Players get access to studios and titles that may never appear on DraftKings due to licensing limitations. For anyone who values having the broadest possible range of games available at any time, the structural advantage sits firmly with ZunaBet.
This is not a criticism of DraftKings. The company operates within the rules of its markets. But it does illustrate why players looking for maximum variety often end up exploring platforms outside the traditional regulatory framework.
Sportsbook: Built for Different Audiences
DraftKings has one of the best sportsbooks in the US market. Coverage of American sports is excellent, the live betting product is smooth, and the promotional calendar keeps regular bettors engaged. If you want to bet on the Super Bowl, March Madness, or the World Series within a legal, regulated environment, DraftKings handles that about as well as anyone.
ZunaBet’s sportsbook takes a more global approach. Mainstream sports are well covered, but the platform also invests heavily in esports markets. Dedicated betting options for CS2, Dota 2, League of Legends, and Valorant reflect a deliberate choice to serve the growing audience of younger bettors who follow competitive gaming as closely as traditional sports. Virtual sports and combat sports fill out the rest of the lineup.
The audiences these sportsbooks serve overlap in places but diverge in others. DraftKings is optimized for American sports culture. ZunaBet is built for a global, digitally native audience that bets across categories. Neither approach is wrong, but one is more future-facing than the other as the betting audience continues to get younger and more internationally connected.
Bonuses: Structured vs Variable
DraftKings runs frequent promotions tied to specific sporting events. Odds boosts, deposit matches on certain occasions, and free bet offers appear regularly. The specifics change often, which keeps things interesting but can also make it difficult for players to plan around a consistent offer.
ZunaBet goes with a fixed welcome structure. Up to $5,000 across three deposits plus 75 free spins. First deposit gets 100% up to $2,000 and 25 spins. Second gets 50% up to $1,500 and 25 spins. Third gets 100% up to $1,500 and 25 spins. The offer does not change from week to week. Players know what they are getting before they sign up, and the three-deposit format gives them a reason to come back without adding any confusion.
Both approaches have their logic. But for players who prefer knowing exactly what a platform will give them upfront, ZunaBet’s transparency is appealing.
Loyalty: Volume vs Value
DraftKings Dynasty Rewards tracks wagering through Crowns, which convert to DK Dollars. The system has tiers and provides incremental returns. It functions as a standard rewards program that gives something back to active players, though the actual return rate stays relatively low across all tiers.
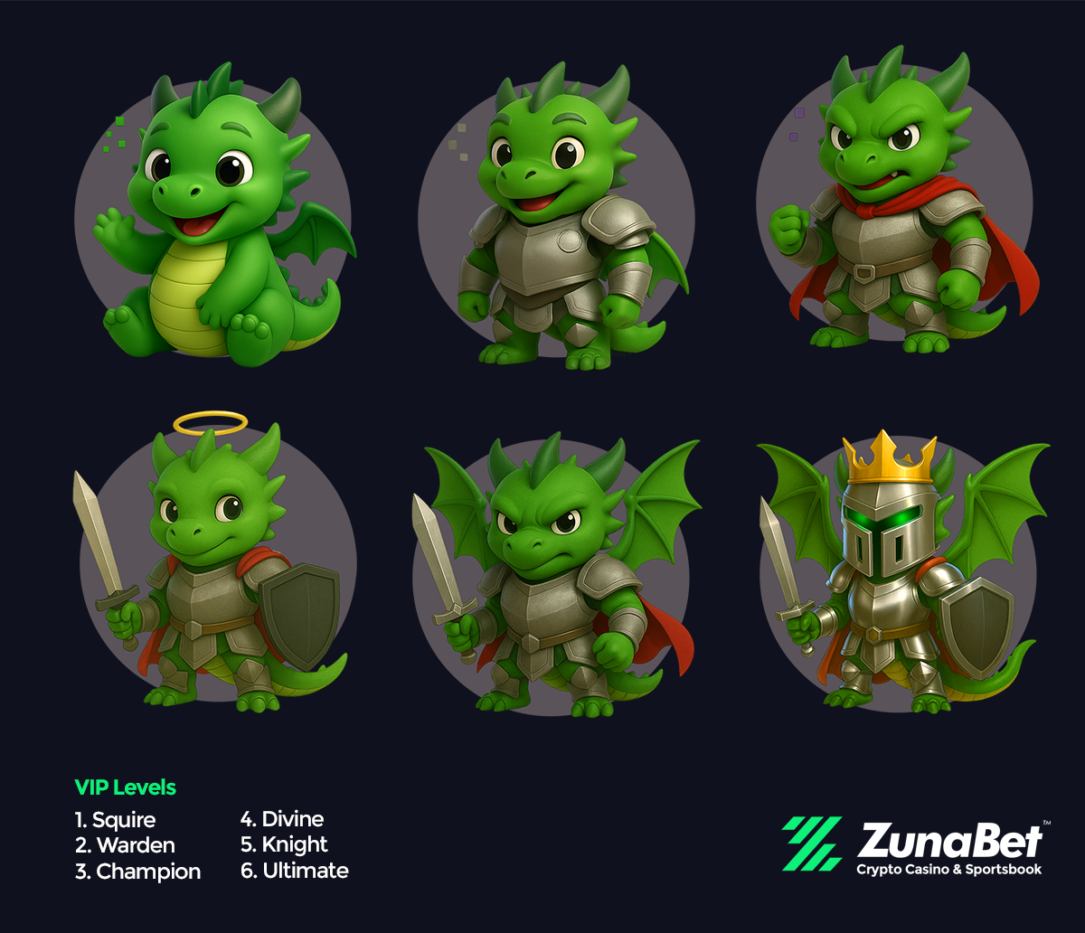
ZunaBet built its loyalty program around a dragon evolution concept featuring a mascot named Zuno. Six tiers carry defined rakeback percentages: Squire at 1%, Warden at 2%, Champion at 4%, Divine at 5%, Knight at 10%, and Ultimate at 20%. Each tier adds additional perks including free spins scaling to 1,000, VIP club access, and double wheel spins.
The contrast is significant. DraftKings rewards continued betting with modest returns. ZunaBet rewards continued betting with escalating returns that top out at 20% rakeback. For regular players comparing the long-term value of sticking with one platform, ZunaBet’s program returns substantially more at every level. That 20% ceiling is not standard in this industry. It is exceptional, and it gives serious players a financial reason to commit to ZunaBet over other options.
Payments: Two Different Worlds
DraftKings handles all transactions through traditional financial channels. Bank accounts, cards, and approved processors move money in and out. Deposits are generally quick, but withdrawals can involve waiting periods depending on the method. Identity verification is mandatory for every account.
ZunaBet runs entirely on crypto. More than 20 coins are accepted, including stablecoins on multiple chains. No platform fees are charged. Withdrawals are fast. There is no requirement to connect a bank account or go through the kind of identity verification that fiat platforms demand.
These are fundamentally different experiences. Players who operate within the traditional banking system and value regulatory oversight will naturally lean toward DraftKings. Players who hold crypto and want the speed, flexibility, and privacy that comes with it will find ZunaBet a far better fit. As crypto adoption continues to grow, the audience for platforms like ZunaBet grows with it.
What the Momentum Suggests
DraftKings has a locked-in position in the US gambling market. Its brand recognition, regulatory licenses, sports partnerships, and advertising spend ensure it will remain a dominant force for years to come. That is not in question.
What is worth watching is the growing interest in platforms like ZunaBet among a segment of the market that DraftKings was never designed to serve. Crypto-native players, international audiences, esports bettors, and players who want massive game libraries and generous loyalty returns are actively searching for alternatives. ZunaBet meets those players exactly where they are.
More games than any regulated US platform can offer. More cryptocurrency options than most crypto casinos provide. A sportsbook that covers traditional and emerging betting markets. A welcome bonus that is straightforward and generous. And a loyalty program that returns up to 20% to its most committed players.
DraftKings owns the present of mainstream American sports betting. ZunaBet is building something for the next generation of gamblers who think differently about payments, play differently across game categories, and expect more back from the platforms they choose. The search momentum suggests that audience is growing, and ZunaBet is exactly what they have been looking for.

TLDR:
- DarkSword exploits six iOS vulnerabilities, including three zero-days, requiring no user clicks to execute.
- Around 270 million iPhones running iOS 18.4 to 18.7 remain exposed until users update to iOS 26.3.
- Three threat actors, including Russian group UNC6353, are linked to the DarkSword exploit campaign.
- Apple has patched all six vulnerabilities; updating immediately is the fastest way to stay protected.
DarkSword, a newly identified iPhone exploit, is placing millions of crypto users at serious risk. Google’s Threat Intelligence Group disclosed the threat in March 2026.
The exploit targets devices running iOS 18.4 through 18.7. Estimates put the number of vulnerable iPhones at around 270 million.
The attack works silently in the background with no clicks required. A single visit to a compromised website can lead to a full device takeover.
How DarkSword Works and What Data It Can Steal
DarkSword exploits a chain of six vulnerabilities, three of which are classified as zero-days. When a user visits a fake or compromised website, hidden code activates on the device.
The process happens in the background, with no visible warnings shown to the user. There is no need for the user to click anything for the attack to succeed.
Once inside the device, attackers can access crypto wallet data and seed phrases stored on the phone. Saved passwords are also exposed, along with private conversations across Telegram, WhatsApp, and iMessage.
On top of that, the malware can extract photos, location history, and record audio through the device microphone.
Crypto Patel shared on X that attackers are specifically hunting for crypto wallet apps and seed phrases. That statement separates DarkSword from a standard espionage operation. It is a targeted financial attack designed to drain the holdings of crypto users.
The threat is especially serious for those who store seed phrases digitally. Security professionals have long advised against saving such data on a mobile device.
DarkSword now provides a concrete reason for crypto holders to reconsider how they secure sensitive information. Moving seed phrase storage offline is a practical step that reduces risk considerably.
Who Is Behind DarkSword and How to Protect Your Device
Google’s investigation linked DarkSword to three separate threat actors. Among them are Russian espionage group UNC6353, Turkish surveillance vendor PARS Defense, and an additional cluster known as UNC6748.
The presence of multiple well-resourced groups behind a single exploit makes the campaign particularly concerning.
Reported targets include users in Ukraine, Saudi Arabia, Turkey, and Malaysia. Still, because the attack spreads through websites, any iPhone user could encounter it. Location alone does not determine who is at risk. Users everywhere should treat the threat as active.
Apple acted swiftly and patched all six vulnerabilities connected to DarkSword. The fix is available through an update to iOS 26.3.
Users who delay that update remain exposed to the full scope of the exploit chain. This is the second major iOS attack reported this month, making timely updates more important than ever.
Beyond the software update, Apple’s Lockdown Mode provides an added layer of defense. Hardware wallets are the safest option for anyone holding large crypto amounts.
Avoiding suspicious websites and refraining from storing seed phrases on any phone remain practical steps every crypto user should follow.


Gold has slipped from above $5,200 while crypto bleeds and silver dumps, exposing “store of value” as a question of volatility, leverage and time horizon, not memes.
Summary
- Gold has dropped about 10–15% from its early‑March spike above $5,200 to around $4,560, but remains structurally elevated and keeps finding dip buyers near the mid‑$4,500s.
- Silver has been hit harder, sliding roughly 20% this month back toward the low‑$70s per ounce, underscoring its role as the high‑beta “altcoin” of the metals complex.
- Crypto is mirroring the direction with more violence: BTC stuck in the high‑$60,000s to low‑$70,000s, total market cap around $2.4 trillion, and Bitcoin dominance near 58% as capital hides in the least ugly risk asset.
Spot gold is trading just below $4,600 today, down roughly 10–15% from its early‑March blow‑off above $5,200, but still structurally elevated versus last year’s range. The parabolic spike has unwound, yet the metal holds a firm bid as a macro hedge, with buyers repeatedly stepping in on dips toward the mid‑$4,500s rather than capitulating en masse. Silver, by contrast, has been punished harder: spot sits around the low‑$70s per ounce after a ~20% month‑to‑date drawdown, with futures pointing to further downside if resistance near $74 holds.
Crypto is mirroring the metals’ directionality but with far more violence. Bitcoin trades around the high‑$60,000s to low‑$70,000s, off more than 4% in the last 24 hours and roughly $17,000 below its level a year ago, as leverage gets flushed out of the system. Total crypto market cap sits in the $2.4–$2.5 trillion band, with BTC dominance above 58%, underscoring how capital is crowding back into the most “respectable” corner of the asset class as altcoins underperform. The tape is classic deleveraging: failed intraday bounces, narrowing leadership, and a persistent bid for liquidity over narrative.
Set against that backdrop, the gold‑versus‑Bitcoin (BTC) framing looks less like a clean binary and more like a duration trade on macro stress. Gold below $4,600 is still signaling strong, but no longer panicked, demand for hard collateral from institutions that care about collateral rehypothecation, margin frameworks, and Basel treatment. Bitcoin around $70,000 is functioning as a high‑beta macro asset: sensitive to rates, dollar strength, and ETF flows, with predictions and technicals flagging risk of a deeper slide toward the mid‑$50,000s if support breaks. Silver, meanwhile, behaves like the altcoin of the metals complex—levered to growth and speculation, attractive on upside days, brutal when liquidity tightens.
For allocators, the positioning logic is blunt. In this regime, gold is the low‑volatility ballast: trim the chase from the $5,000 area, but keep core exposure as long as real yields and geopolitical noise stay elevated. Bitcoin is the liquid convexity leg within crypto, but it is not trading like a safe haven; sizing needs to reflect equity‑like drawdown risk, not ETF‑brochure marketing. Silver and high‑beta altcoins both belong in the same bucket: small notional, strict risk, used for targeted upside rather than any pretense of wealth preservation.
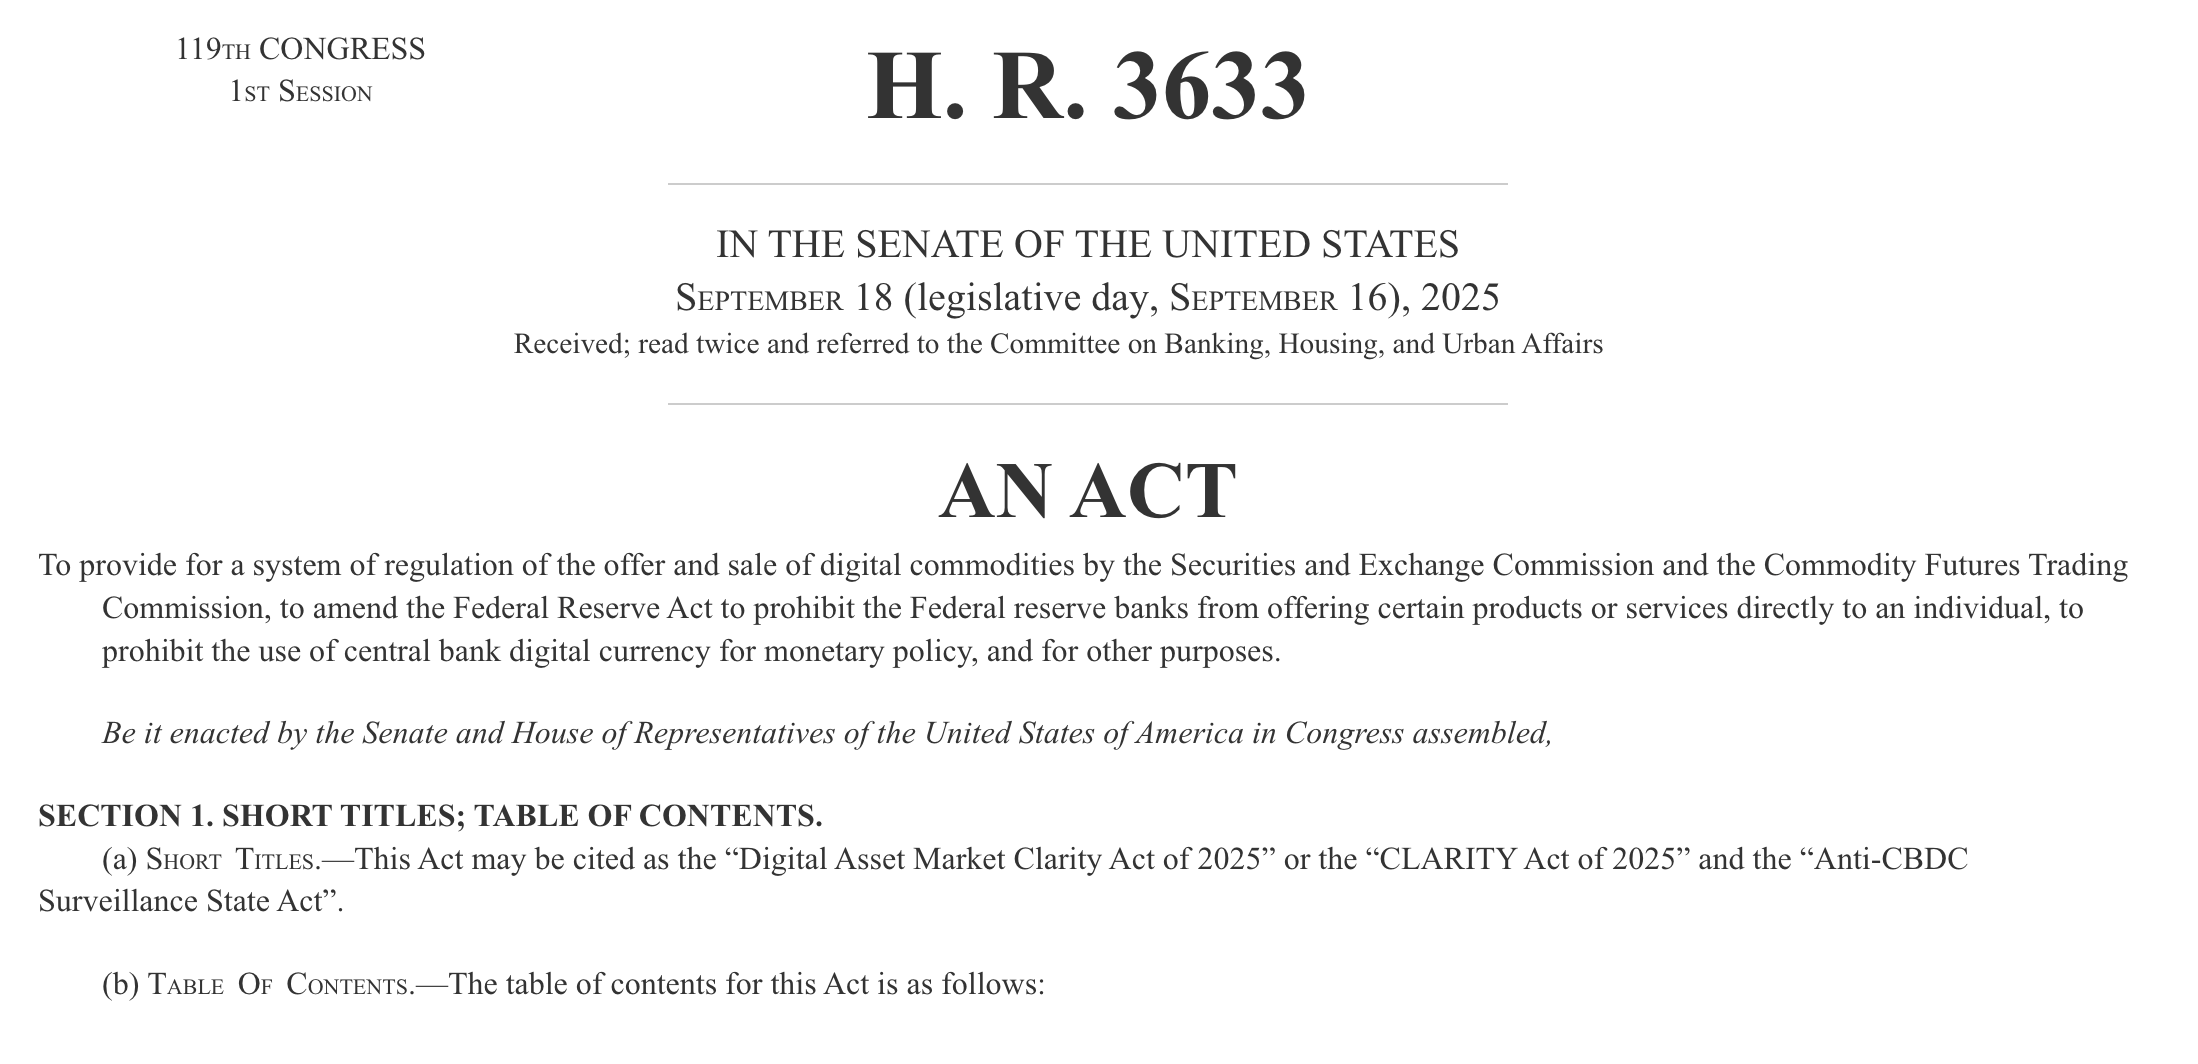
Rumors are circulating that a tentative deal has been struck between the White House and US lawmakers on stablecoin yield, potentially moving the CLARITY crypto market structure bill forward.
Republican Senator Thom Tillis and Democratic Senator Angela Alsobrooks, both members of the Senate Committee on Banking, Housing, and Urban Affairs, have reached an “agreement in principle,” according to a Friday Politico report.
“I think what it will do is to allow us to protect innovation, but also gives us the opportunity to prevent widespread deposit flight,” Alsobrooks said, adding that the deal prohibits stablecoin yield on “passive balances.”

Specific details of the prospective deal have yet to emerge, and Senator Tillis said the crypto industry must vet the agreement before it is finalized.
Cointelegraph reached out to the White House for details on the prospective deal but did not receive a response by the time of publication.
Speaking at the DC Blockchain Summit on Wednesday, Wyoming Senator Cynthia Lummis, one of the biggest advocates for digital asset policy on the Hill, said, “We are so close” to passing a comprehensive crypto regulatory framework.
A spokesperson for Senator Lummis told Cointelegraph on Wednesday that a deal is expected to materialize in “the next few days,” and that Senator Lummis is working to hammer out ethics language in the bill.

The Digital Asset Market Clarity Act of 2025, otherwise known as the CLARITY Act, is a major piece of crypto legislation and was widely anticipated to pass without issue after the GENIUS stablecoin framework was signed into law.
However, the bill stalled in January after major industry players, including crypto exchange Coinbase, voiced concerns, including whether stablecoin issuers could share yield with token holders.
Related: CLARITY Act risks handing crypto to centralized players: Gnosis exec
Banks are fearful that the bill will erode market share and cause deposit flight
The banking industry opposes yield-bearing stablecoins, citing concerns over the flight of bank deposits, which have yields far below 1%, and the erosion of banking market share.
Patrick Witt, the executive director of the White House Council of Advisors for Digital Assets, said that these concerns are overblown.
A wave of fresh capital will likely enter the US banking industry if dollar-pegged yield-bearing stablecoins are legalized and regulated, Witt said.
Magazine: Crypto wanted to overthrow banks, now it’s becoming them in the stablecoin fight

Google Threat Intelligence has flagged a new crypto-stealing malware named “Ghostblade” targeting Apple iOS devices. Described as part of the DarkSword family of browser-based tools, Ghostblade is engineered to siphon private keys and other sensitive data in a rapid, discreet burst rather than a continuous, always-on presence on the device.
Written in JavaScript, Ghostblade activates, harvests data from the compromised device, and relays it to malicious servers before shutting down. Researchers note that the malware’s design makes it harder to detect, as it does not require additional plugins and ceases operation once data extraction completes. Google’s threat intelligence team highlights that Ghostblade also takes steps to avoid detection by deleting crash reports that would otherwise alert Apple’s telemetry systems.
Beyond private keys, the malware is capable of accessing and transmitting messaging data from iMessage, Telegram, and WhatsApp. It can also harvest SIM card information, user identity details, multimedia files, geolocation data, and access various system settings. The broader DarkSword framework, which Ghostblade belongs to, is cited by Google as part of an evolving set of threats illustrating how attackers continually refine their toolkit to target crypto users.
For readers who track threat trends, Ghostblade sits alongside other components of the DarkSword iOS exploit chain described by Google Threat Intelligence. The set of tools is observed within a wider context of crypto-threat evolution, including reports on iOS-based exploit kits used in crypto phishing campaigns.
Key takeaways
- Ghostblade represents a JavaScript-based crypto-stealing threat on iOS, delivered as part of the DarkSword ecosystem and designed for fast data exfiltration.
- The malware operates briefly and non-continuously, reducing the likelihood of long-term device footholds and complicating detection.
- It can relay sensitive data from iMessage, Telegram, and WhatsApp, and can access SIM information, identity data, multimedia, geolocation, and system settings, while also erasing crash reports to evade discovery.
- The development aligns with a broader shift in the threat landscape toward social-engineering and data-extraction tactics that exploit human behavior, not just software vulnerabilities.
- February’s crypto-hacking losses dropped sharply to $49 million from $385 million in January, signaling a pivot from code-based intrusions to phishing and wallet-poisoning techniques, according to Nominis.
Ghostblade and the DarkSword ecosystem: what’s known
Google’s researchers describe Ghostblade as a component of the DarkSword family—a suite of browser-based malware tools that target crypto users by stealing private keys and related data. Ghostblade’s JavaScript core allows rapid interaction with the device while remaining lightweight and transient. This design choice is consistent with other recent on-device threats that favor quick data exfiltration cycles over prolonged infections.
In practice, the malware’s capabilities extend beyond mere key theft. By accessing messaging apps such as iMessage, Telegram, and WhatsApp, attackers can intercept conversations, credentials, and potentially sensitive attachments. The inclusion of SIM card information and geolocation access broadens the potential attack surface, enabling more comprehensive identity theft and fraud scenarios. Crucially, the malware’s ability to wipe crash reporting further obscures activity, complicating post-infection forensics for both victims and defenders.
As part of the broader DarkSword discourse, Ghostblade underscores the ongoing arms race in on-device threat intelligence. Google Threat Intelligence has framed DarkSword as one of the latest examples illustrating how malicious actors continue to refine iOS-focused attack chains, exploiting the strong trust users place in their devices and the apps they rely on for daily communication and finance.
From code-centric intrusions to human-factor exploits
The February 2026 crypto-hacking landscape reflects a marked shift in attacker behavior. According to Nominis, total losses from crypto hacks fell to $49 million in February, a steep drop from $385 million in January. The firm attributes the decline to a pivot away from purely code-based threats toward schemes that leverage human error, including phishing attempts, wallet poisoning attacks, and other social-engineering vectors that lead users to unwittingly reveal keys or credentials.
Phishing remains a central tactic. Attackers deploy fake websites designed to resemble legitimate platforms, often with URLs that mimic real sites to lure users into entering private keys, seed phrases, or wallet passwords. When users interact with these lookalike interfaces—whether by logging in, approving transactions, or pasting sensitive data—the attackers gain direct access to funds and credentials. This shift toward human-targeted exploits has implications for how exchanges, wallets, and users must defend themselves, emphasizing user education alongside technical safeguards.
The February data point aligns with a broader industry narrative: while code-level exploits and zero-days continue to mature, a growing share of the risk to crypto holdings comes from social-engineering exploits that exploit well-established human behaviors—trust, urgency, and the habitual use of familiar interfaces. For industry observers, the takeaway is not only about patching software vulnerabilities but also about hardening the human element of security through education, more robust authentication, and safer onboarding experiences for wallet users.
Implications for users, wallets, and builders
Ghostblade’s emergence—and the accompanying trend toward human-centered attacks—highlights several practical takeaways for users and developers alike. First, device hygiene remains critical. Keeping iOS up to date, applying app and browser hardening measures, and employing hardware wallets or secure enclaves for private keys can raise the bar against rapid exfiltration attacks.
Second, users should exercise heightened caution with messaging apps and web surfaces. The convergence of on-device data access with phishing-style deception means that even seemingly benign interactions—opening a link, approving a permission, or pasting a seed phrase—can become a gateway for theft. Multi-factor authentication, authentication apps, and biometric protections can help reduce risk, but education and skepticism about unexpected prompts are equally vital.
For builders, the Ghostblade case emphasizes the importance of anti-phishing controls, secure key management flows, and transparent user warnings around sensitive operations. It also reinforces the value of continuous threat intelligence sharing—especially around on-device threats that blend browser-based tools with mobile operating system features. Cross-industry collaboration remains essential to detect novel exploitation chains before they become widely effective.
What to watch next
As Google Threat Intelligence and other researchers continue to track DarkSword-linked activity, observers should monitor updates on iOS exploit chains and the emergence of similarly stealthy, short-duration malware. The February shift toward human-factor vulnerabilities suggests a future where defenders must bolster both technical safeguards and user-facing education to reduce exposure to phishing and wallet-poisoning schemes. For readers, the next milestones include any formal threat intel advisories on iOS crypto threats, new detections from security vendors, and how major platforms adapt their anti-phishing and fraud-prevention measures in response to these evolving playbooks.
In the meantime, keeping a watchful eye on threat intelligence backstops—such as Google Threat Intelligence’s reporting on DarkSword and related iOS exploits, along with ongoing analyses from Nominis and other blockchain security researchers—will be essential for assessing risk and refining defenses against crypto-focused cybercrime.

Bitcoin mining difficulty set for 7.5% drop as hash rate retreats

Taina WIlliams Reacts After Trolls Drag Emmy’s Louis Vuitton Gift

Liverpool boss Arne Slot offers fresh Alexander Isak return date after nightmare injury layoff

Smart energy pays enters the US market, targeting scalable financial infrastructure

Why Israel is blocking foreign journalists from entering

Bitcoin: We’re Entering The Most Dangerous Phase

Crypto Trading LIVE: BTC Live Trading Bitcoin Analysis | 20 MAR #crypto #bitcoin #btc

Bitcoin Live Trading: Final Warning Before The Next Big Move? Watch This Level! EP1939

Part 1 Funcionalidade Sistema Goat Ibex (Open Finance) #openfinance #vendas #erp #estoque #finance
-
Crypto World7 days ago
HYPE Token Enters Net Deflation as HyperCore Buybacks Outpace Staking Rewards
-

 Tech5 days ago
Your Legally Registered ‘Motorcycle’ Might Not Count Under Proposed US Law
-
 Tech3 days ago
Are Split Spacebars the Next Big Gaming Keyboard Trend?
-
Sports6 days ago
Why Duke and Michigan Are Dead Even Entering Selection Sunday
-

 Politics4 hours ago
Jenni Murray, Long-Serving Woman’s Hour Presenter, Dies Aged 75
-

 Business5 days ago
Search for Savannah Guthrie’s Mother Enters Seventh Week with No Arrests
-

 Business6 days ago
US Airports Launch Donation Drives for Unpaid TSA Workers as Partial Government Shutdown Enters Fifth Week
-
Crypto World6 days ago
Coinbase and Bybit in Investment Talks: Could Bybit Finally Enter the US Crypto Market?
-

 Business4 days ago
Australian shares drop as Iran war enters third week
-

 Business6 days ago
Country star Brantley Gilbert enters growing non-alcoholic beer market
-

 Politics3 days ago
The House | The new register to protect children from their abusers shows Parliament at its best
-

 Crypto World5 days ago
Crypto Lender BlockFills Enters Chapter 11 with Up to $500M in Liabilities
-

 News Videos2 days ago
RBA board divided on rate cut, unusually buoyant share market | Finance Report | ABC NEWS
-

 Fashion4 days ago
25 Celebrities with Curly Hair That Are Naturally Beautiful
-

 Tech17 hours ago
inKONBINI Lets You Spend Summer Days Behind the Register
-

 Fashion4 hours ago
Weekend Open Thread: Adidas – Corporette.com
-

 Crypto World2 days ago
Canada’s FINTRAC revokes registrations of 23 crypto MSBs in AML crackdown
-
 Politics3 days ago
Real-time pollution monitoring calls after boy nearly dies
-

 Crypto World6 days ago
Crypto Losses Drop 87% in February, But Hackers Are Now Targeting People, Not Code
-
 NewsBeat2 days ago
Residents in North Lanarkshire reminded to register to vote in Scottish Parliament Election


You must be logged in to post a comment Login