
Crypto World
Dogecoin Price Analysis: Is $DOGE’s $0.10 Level a Smart Entry or Market Trap?

Join Our Telegram channel to stay up to date on breaking news coverage
Meme coins have always lived at the edge of speculation, and Dogecoin sits right at the center of that chaos. Every cycle, headlines rush to declare the end, yet history shows that fear often peaks just before sentiment quietly shifts.
Right now, the conversation around Dogecoin feels less like celebration and more like doubt, which is exactly what makes this moment interesting. Volatility has returned, emotions are running high, and traders are once again being tested by sharp moves in both directions.
This is not a calm accumulation phase, nor is it full-blown euphoria, but something far more unstable. In this Dogecoin price prediction, the focus is on whether this uneasy middle ground signals exhaustion or lays the foundation for another unexpected move.
Dogecoin ETF Disappointment Continues as Spot Outflows Weigh on $DOGE
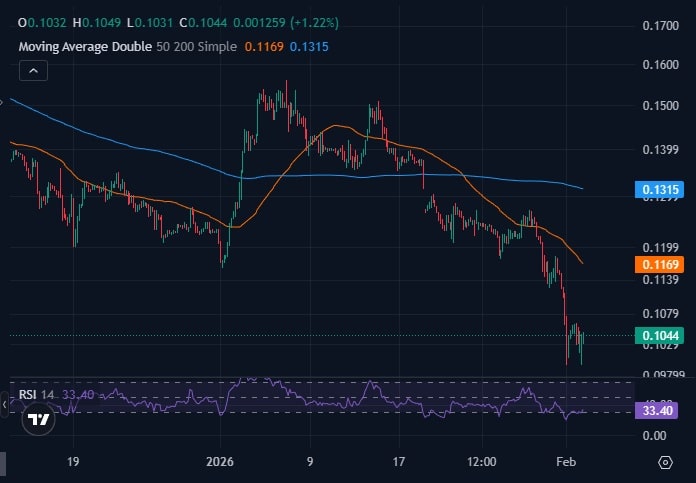
Dogecoin is trading today at $0.103, having slipped below the $0.11 level and retested a key long-term trendline that has supported the token since mid-2024. This decline comes amid stalled ETF inflows and ongoing spot outflows, leaving $DOGE without a catalyst to counter months of selling pressure.
The Dogecoin ETF narrative has yet to generate the demand bulls anticipated. According to SoSoValue, all three $DOGE spot ETFs recorded zero inflows on January 30, with total net assets at just $10.15 million. Since launch, cumulative inflows total $6.41 million, far below competing altcoin funds.
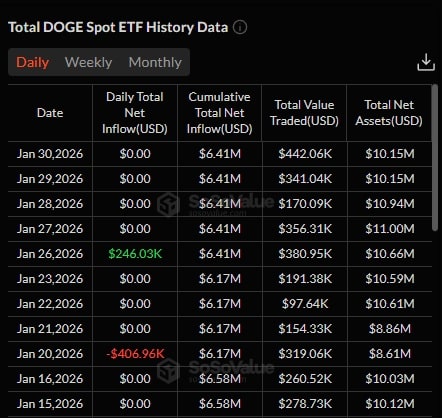
The gap compared with ETFs like XRP, Solana, or Chainlink highlights weak institutional interest in $DOGE. Without renewed ETF demand, price movement remains tied to retail sentiment and spot market activity.
Data also shows $10.88 million in net outflows on January 30, continuing a distribution trend observed over the past two months. Persistent selling suggests holders are reducing exposure rather than buying the dips.
$DOGE has lacked a major catalyst since the meme coin rally subsided in late 2024. Elon Musk, whose activity historically drove sharp moves, has stayed quiet, leaving the token without narrative support or broader market momentum. Sellers continue to dominate price action.
Expert Explains $DOGE’s $0.10 Zone and Market Sentiment
According to crypto analyst ClayBro from the 99Bitcoins YouTube channel, Dogecoin’s recent price action highlights a market dominated by emotion rather than fundamentals, with $DOGE trading near the crucial $0.10 level after a steep decline. ClayBro explains that meme coins like Dogecoin are heavily sentiment-driven, and the widespread fear seen across the crypto market could point to a developing bottom.
He emphasizes that this price zone represents a key decision area where volatility creates both risk and opportunity for traders. Instead of issuing a fixed price target, the analysis focuses on market psychology and how fear often sets the stage for renewed interest.
ClayBro also notes that Dogecoin is not dead, but moving through a volatile transition phase. For regular sentiment-based crypto analysis and market discussions, the 99Bitcoins YouTube channel remains a trusted source.
High-Potential Meme Coin Presales to Watch
Dogecoin’s recent pullback highlights a shift as the meme coin matures, losing the explosive moves that once defined it. With its large market capitalization, broad token distribution, and high brand recognition, Dogecoin now requires significant capital for meaningful price movements, making breakouts less frequent.
This environment has prompted traders to explore earlier-stage projects where volatility and potential returns are higher. Below are two meme coin presales gaining attention for their strong communities and unique features.
Bitcoin Hyper (HYPER)
Bitcoin Hyper is a Layer 2 solution built on top of Bitcoin, designed to make transactions faster, cheaper, and more versatile. By moving Bitcoin onto its own scalable network, it allows near-instant transfers, minimal fees, and supports complex DeFi operations like staking, lending, and decentralized exchanges.
The system maintains strong security by periodically committing Layer 2 states to Bitcoin’s main chain and using zero-knowledge proofs to validate transactions. Users can easily move Bitcoin in and out of the Layer 2 network, making it both flexible and accessible.
It’s time to take this L2 Interdimensional. 🔥
Something this good shouldn’t be kept all to ourselves. 😉🚀https://t.co/VNG0P4FWNQ pic.twitter.com/lzb8981WQV
— Bitcoin Hyper (@BTC_Hyper2) February 2, 2026
The project has already surpassed $31 million in funding. With a well-structured tokenomics plan allocating tokens to development, marketing, and the treasury, Bitcoin Hyper aims to support continuous growth. Its architecture leverages Solana’s virtual machine to handle high throughput efficiently.
Maxi Doge (MAXI)
Maxi Doge is a meme coin presale built as a high-energy, “jacked” version of Dogecoin, designed to appeal to a community that thrives on humor and engagement. Each token is priced at $0.00028, and early participants can earn up to 68% APY through staking.
The tokenomics allocate 25% to the Maxi Fund, 40% to marketing, 15% to development, 15% to liquidity, and 5% to staking rewards, supporting both community growth and project sustainability. Maxi Doge also integrates gamified contests, community activations, and partnerships, encouraging active participation and engagement.
Its roadmap emphasizes high-frequency trading, social campaigns, and staking incentives to create a dynamic ecosystem. With a total of $4.5 million raised so far, Maxi Doge positions itself as a bold, community-driven meme token with unique staking rewards.
Related

- Get Educational Courses & Tutorials
- Free Content & VIP Group
- Jacob Crypto Bury Market Analysis Videos
- Leverage Trading Signals on Bybit
- Next 10x Altcoin Gems
- Upcoming Presales & ICOs
Join Our Telegram channel to stay up to date on breaking news coverage


TLDR:
- Dynamix Corporation and The Ether Reserve LLC mutually terminated their Business Combination Agreement on April 8, 2026.
- Unfavorable market conditions were cited as the primary reason behind the immediate termination of the planned merger deal.
- The Payor is required to pay Dynamix $50,000,000 within 15 days of the April 8, 2026 termination effective date.
- Dynamix has until November 22, 2026 to close a new business combination or face mandatory liquidation of public shares.
Dynamix Corporation business combination termination has sent ripples through the SPAC landscape, closing the door on what was once a promising path to bringing The Ether Reserve LLC to public markets.
On April 8, 2026, both parties pulled the plug on their July 2025 merger agreement, with unfavorable market conditions bearing the blame.
The exit comes with a hefty price tag — a $50 million termination payment now due within 15 days, leaving Dynamix racing against its November 2026 deadline to find a new deal or face liquidation.
Ether Machine Cites Market Conditions in Merger Exit
The Ether Machine, a planned public company, confirmed the mutual termination of its business combination with Dynamix Corporation and The Ether Reserve LLC effective immediately.
The deal was originally signed on July 21, 2025, and was widely seen as a path to taking the company public via Nasdaq. Market conditions, however, shifted that trajectory.
The termination dissolved the Sponsor Support Agreement between DynamixCore Holdings, LLC, Dynamix, and The Ether Machine, Inc. alongside it. The ETHM Subscription Agreements and the Contribution Agreement also ended in accordance with their own terms.
These agreements were all structurally tied to the original business combination. Multiple entities were party to the Termination Agreement, including ETH SPAC Merger Sub Ltd. and ETH Partners LLC.
Three Delaware-incorporated SPAC subsidiaries were also signatories to the deal. Each played a defined role within the originally planned transaction structure.
The termination filing was submitted to the U.S. Securities and Exchange Commission as a Current Report on Form 8-K.
Dynamix, trading on Nasdaq under ticker ETHM, disclosed the full details within that report. The document is publicly available through the SEC’s filing system.
$50M Payout and a November 2026 Deadline Set the Next Clock
Under the Termination Agreement, the Payor named in Annex A must pay Dynamix $50,000,000 within 15 days of April 8, 2026. The agreement includes mutual releases for all known and unknown claims tied to the original Business Combination Agreement.
A covenant not to sue and a mutual non-disparagement clause also form part of the terms. Dynamix still has until November 22, 2026, to complete a new initial business combination.
This window was established in its final prospectus filed on November 21, 2024. Should no deal close by that date, the company must begin winding down operations and redeem public shares from its trust account.
The Sponsor and Dynamix officers have waived their rights to liquidating distributions from the trust account on founder shares. They remain entitled to distributions from assets held outside the trust account.
That pool could include portions of the $50 million termination payment remaining after company expenses are settled.

Crypto World
Justin Sun Accuses World Liberty Financial of Hidden Token Freeze Backdoor Amid $175M Dispute
TLDR:
- Justin Sun invested roughly $175 million across WLFI and TRUMP memecoin before the public fallout began.
- WLFI froze 595 million of Sun’s unlocked tokens worth $107 million, citing a breach of his investor agreement.
- WLFI borrowed $75 million in stablecoins on Dolomite against its own token, sending $40 million to Coinbase Prime.
- The WLFI token has dropped 76% from its all-time high, now trading near $0.079 amid ongoing legal threats.
World Liberty Financial and Justin Sun are locked in a public dispute over frozen tokens, alleged misconduct, and a contract backdoor claim.
Sun, the project’s largest investor with roughly $175 million in Trump-linked crypto exposure, accused WLFI of hiding a wallet freeze function from investors. WLFI denied the claims and threatened legal action.
On-chain data has made portions of both sides’ activities visible to the public, raising questions across the crypto community.
Justin Sun Alleges Hidden Freeze Function in WLFI Token Contract
Sun first invested $30 million in WLFI in late 2024. By January 2025, he scaled that position to $75 million and was named a project advisor. He also committed $100 million to the TRUMP memecoin, bringing his total exposure to roughly $175 million.
The WLFI token launched on September 1, 2025, at around $0.25 and reached a high near $0.33. Only 20% of presale tokens were unlocked at launch.
Three days after launch, Sun moved approximately 50 million WLFI tokens to HTX, an exchange where he holds an advisory role.
Around that same time, HTX began offering WLFI presale investors high yields for depositing and locking their newly unlocked tokens.
WLFI alleges that Sun was selling tokens on the back end of his own exchange, including tokens tied to locked user balances.
According to WLFI, the plan was to exit early using retail users’ locked tokens as liquidity. Sun would then use future token vestings to refill HTX user balances. WLFI says it obtained logs supporting this claim and froze his wallet on breach-of-agreement grounds.
The freeze locked approximately 595 million unlocked tokens worth $107 million, along with billions more in vesting tokens. On-chain data from Nansen showed Sun’s wallet transfer occurred after the price dropped that day, not before.
Sun publicly described himself as “the first and single largest victim” of what he called a hidden backdoor blacklisting function.
He added that governance votes used to justify the freeze had key information hidden from voters and predetermined outcomes.
WLFI’s Dolomite Loan and Coinbase Prime Transfers Draw Further Scrutiny
Starting in February 2026, WLFI’s treasury began borrowing on Dolomite, a DeFi lending platform. It deposited its own stablecoin and governance token as collateral, then borrowed real stablecoins against them.
By April 9, 2026, WLFI had deposited 5 billion tokens as collateral and borrowed around $75 million in stablecoins. Over $40 million of those funds were sent to Coinbase Prime, a platform commonly used for institutional fiat conversion.
Dolomite was co-founded by Corey Caplan, who also serves as a WLFI advisor and has been described as acting in a CTO capacity. WLFI’s own token made up roughly 55% of Dolomite’s total liquidity at that point.
The USD1 stablecoin pool on Dolomite reached 93 to 100% utilization during this period, making it difficult for regular depositors to withdraw their funds. The $40 million transfer to Coinbase Prime took place hours before Trump’s US-Iran ceasefire announcement.
WLFI responded to the criticism by calling it FUD. The project stated the position was far from liquidation and described itself as an “anchor borrower” generating yield for other lenders on the platform.
WLFI’s official account addressed Sun directly on X, stating: “See you in court pal.” Sun responded by demanding the team identify themselves publicly rather than operating behind an anonymous account. The Dolomite loan remains open, and the WLFI token was trading near $0.079 at the time of writing, down 76% from its all-time high.
Crypto World
Morpho Borrowers Generate $170M in Interest as DeFi Lending Competition With Aave Heats Up
TLDR:
- Morpho borrowers paid $170M in interest over the past year, reflecting strong borrower demand on the protocol.
- At a 10% take rate, Morpho DAO earns roughly $17M annually against a $1.7B valuation, a 1:100 revenue multiple.
- Aave generated $140M in annualized revenue against a $1.5B valuation, giving it a far stronger revenue-to-valuation ratio.
- Morpho’s modular lending structure limits DAO revenue capture, making its take rate model a key factor for token pricing.
Morpho borrowers have paid approximately $170 million in interest over the past year, new data from Token Terminal shows.
This figure places the lending protocol in direct comparison with Aave, one of the longest-standing decentralized finance platforms.
The numbers have drawn attention from analysts tracking on-chain revenue metrics. Both protocols are now being evaluated side by side, giving investors a clearer picture of where value is being generated in DeFi lending.
Morpho’s Revenue Math at a 10% Take Rate
Token Terminal recently shared data showing Morpho’s borrower interest payments over a 12-month period. Based on a 10% take rate assumption, the Morpho DAO would have generated around $17 million in annualized revenue. That revenue figure sits against a current protocol valuation of approximately $1.7 billion.
Token Terminal posted on X, noting that “borrowers on Morpho have paid ~$170M in interest during the past year.”
The post further stated that at a 10% take rate, the DAO would have generated roughly $17M in annual revenue. That framing gave markets a concrete way to assess the protocol’s earnings relative to its size.
The revenue-to-valuation ratio for Morpho currently stands at roughly 1:100. For context, that means the protocol is valued at about 100 times its estimated annual revenue.
This kind of multiple is common in early-stage crypto protocols but remains a key figure for fundamental investors watching the space.
How Aave Stacks Up Against Morpho
Aave, by contrast, has generated approximately $140 million in annualized revenue. Its current valuation sits at around $1.5 billion, which places it at a revenue-to-valuation ratio closer to 1:11.
That gap between the two protocols is notable for anyone comparing lending platforms on a fundamentals basis.
Token Terminal’s post drew a direct comparison between the two, stating that “Aave has generated ~$140M in annual revenue against a ~$1.5B valuation.”
The contrast makes clear that Aave is generating far more revenue relative to its market cap than Morpho. However, Morpho’s total interest paid by borrowers is higher at $170M, showing strong borrower activity on the platform.
The difference in take rates between the two protocols drives much of the revenue gap. Morpho’s modular lending structure means the DAO captures a smaller portion of total interest paid.
As the protocol matures, its revenue capture model will likely be a key factor in how the market continues to price MORPHO tokens going forward.
TLDR:
- Sei Network daily active users dropped from over 2M to between 1M and 1.2M in April 2026.
- Sei Network TVL fell sharply to $41.6M from a peak of $626M recorded in July 2025.
- Sei Network DEX and perpetuals volumes hit $6.55M and $12.25M respectively in 24 hours.
- Sei Network FDV of $549M exceeds its $369M market cap, signaling more token supply ahead.
Sei Network is currently navigating a consolidation phase marked by steady user retention but softening capital inflows.
On-chain data from April 2026 shows the network maintaining a functional base of activity while key growth metrics trend downward.
Trading volumes remain active across decentralized exchanges and perpetuals markets. However, liquidity and new user acquisition have slowed, painting a picture of a network in pause rather than decline.
User Engagement Holds Steady as New Growth Loses Steam
Daily active users on Sei Network have pulled back from over 2 million earlier in April to between 1 million and 1.2 million. That decline, while notable, does not point to a collapse in network participation.
Returning users continue to make up the bulk of on-chain activity, which shows the existing community remains engaged.
New user growth, on the other hand, has softened considerably over the same period. This pattern often appears when a network exhausts its initial wave of adoption and enters a slower, more organic phase. It does not signal failure, but it does mean fresh momentum has cooled for now.
As noted by crypto analyst Kingjaz on X, Sei is “showing a mix of resilience and weakness,” with user activity holding but capital inflows clearly slowing.
That balance defines where the network stands today. The core community is present, but expansion is not happening at the pace seen earlier this year.
Trading activity across the network tells a similar story. DEX volume reached $6.55 million in 24 hours, while perpetuals volume hit $12.25 million over the same window.
App fees and revenue remain thin at $11,155 and $2,872 respectively, showing usage without meaningful protocol-level earnings.
TVL Decline and Capital Rotation Raise Questions for Sei
The sharper concern within current data is the drop in total value locked. TVL on Sei sits at roughly $41.6 million, down from a peak near $626 million recorded in July 2025. That gap represents a substantial outflow of capital from the ecosystem over a relatively short time.
Bridged liquidity remains higher at approximately $251 million, and stablecoin market cap stands near $179 million.
These figures suggest capital has not entirely exited the ecosystem. Rather, it may be waiting on clearer market conditions or rotating into other opportunities.
Sei’s current price ranges between $0.055 and $0.057, with a market cap of around $369 million. The fully diluted valuation sits at approximately $549 million, meaning a portion of the total token supply has yet to enter circulation. That gap could add selling pressure down the line.
The network, therefore, sits at a crossroads between holding its ground and rebuilding momentum. Consistent trading and a loyal user base offer a stable floor, while weak inflows and limited revenue remain the metrics to watch going forward.
TLDR:
- TAO is trading at $261, below the critical 200-day moving average resistance level near $281.
- A lower high at $390 after November’s $475 peak signals a potential bearish distribution phase.
- The $143 Fibonacci support held earlier in 2025, producing a near tripling of TAO’s price value.
- Real subnet usage and institutional interest in Bittensor keep the bullish fundamental case alive.
Bittensor’s TAO token is navigating a pivotal technical crossroads at $261, drawing sharp attention from traders and analysts.
The asset sits below its 200-day moving average while red volume spikes signal rising selling pressure. A lower high at $390 following November’s $475 peak adds to growing concern.
Yet strong subnet fundamentals continue to challenge the purely bearish reading of the chart.
TAO Bears Point to Distribution Pattern After Lower High
The March lower high has become the central talking point among TAO watchers. Price ran from the $143 Fibonacci floor to $390, a move that nearly tripled in value.
However, that rally failed to reclaim the 200-day moving average sitting near $281. That failure now stands as a textbook warning signal for trend traders.
Analyst @2xnmore laid out the concern plainly, stating that “a lower high after a failed 200 MA reclaim is one of the cleanest bearish signals in technical analysis.”
That pattern, combined with today’s volume spike to the downside, raises valid questions about who is actually selling. Distribution phases often look exactly like this before price rolls over completely.
Below the current $261 level, the next visible support sits between $200 and $220. A breakdown through that zone opens the door to a retest of the $143 lows.
That would represent a near 45% drop from current prices, a scenario that would reset the entire 2025 narrative around TAO.
Smart money often exits into retail momentum. The dTAO narrative and subnet expansion attracted fresh buyers in Q1.
If institutions used that interest to offload positions, the lower high becomes more than just a technical signal. It becomes evidence of a completed distribution cycle.
Fundamentals Offer a Counter Case for TAO Bulls
On the other side of the argument, TAO’s underlying ecosystem has not deteriorated. Real usage on Chutes, growing subnet activity, and institutional interest in Bittensor infrastructure remain active. These are not paper narratives. They reflect building utility across the network.
@2xnmore acknowledged this tension directly, noting that “the fundamentals on this subnet ecosystem are unlike anything else in crypto right now.”
That kind of divergence between price and utility has historically preceded strong recoveries in emerging crypto sectors. The 0.618 Fibonacci level at $143 held earlier in the year and produced a near tripling of price.
A clean reclaim of the $281 moving average, supported by above-average volume, would structurally shift the chart back to bullish.
That level now acts as both resistance and a defining line for trend direction. Bulls need that reclaim to invalidate the lower high pattern.
Until that happens, TAO trades in a zone where both outcomes remain technically valid. The chart and the fundamentals are currently pointing in opposite directions.
Crypto World
WLFI Token Controversy: $5B Collateral Move, Withdrawal Crisis, and Justin Sun Blacklist Claim
TLDR:
- WLFI deposited $5B of its own token on Dolomite, borrowing $75M and sending $40M to Coinbase Prime.
- Dolomite’s utilization hit 100%, blocking ordinary depositors from withdrawing their stablecoins on the platform.
- Justin Sun alleged WLFI used a smart contract backdoor to blacklist his wallet, freezing $107M of his funds.
- Investor losses reached $3.87B across 600,000 wallets while related entities collected $350M in fees total.
World Liberty Financial (WLFI) is back at the center of crypto controversy following a series of financial moves that have raised serious questions about governance, transparency, and conflict of interest.
The token, currently trading at $0.07, has seen social activity surge sharply even as its price falls 18% this week and 67% from September highs.
With 600,000 wallets holding the token, losses now stand at $3.87B while related entities have collected $350M in fees.
Conflict of Interest Raises Questions Over WLFI’s Dolomite Transaction
WLFI deposited $5 billion worth of its own token as collateral on Dolomite, a DeFi lending protocol. Against that collateral, it borrowed $75 million in stablecoins. Shortly after, $40 million of those funds moved directly to Coinbase Prime.
The transaction structure drew immediate scrutiny due to the relationships involved. Dolomite was co-founded by Corey Caplan, who also holds an advisory role at World Liberty Financial. Essentially, the borrower had direct ties to the lender, the collateral, and the protocol itself.
When WLFI deposited the $5B in tokens, Dolomite’s utilization rate hit 100% almost immediately. That spike left ordinary depositors unable to withdraw their stablecoins, even though their balances appeared intact on paper.
This kind of arrangement has led many in the crypto community to question whether the transaction served the broader user base.
LunarCrush reported that social mentions, engagements, and crypto market share for WLFI are all climbing sharply, driven largely by these controversies.
Justin Sun Blacklist Claim Adds Another Layer to WLFI’s Growing Troubles
Beyond the Dolomite situation, WLFI now faces a separate and equally serious allegation. Justin Sun, founder of TRON, publicly claimed that WLFI blacklisted his wallet using a backdoor function embedded in the project’s smart contract.
According to Sun, this action froze approximately $107 million of his holdings without notice or recourse. The claim raised immediate concerns about centralized control within what was marketed as a decentralized finance project.
A backdoor function capable of freezing wallets runs counter to core DeFi principles. It suggests that specific parties may hold override authority over the protocol, which is not a standard feature in genuinely decentralized systems.
Meanwhile, WLFI’s circulating supply has reached 31.7 billion tokens. That growth in supply, combined with a price drop of 67% from its September peak, points to ongoing pressure on token value.
The Trump family and associated business entities have reportedly collected $350M in fees throughout this period, while investor losses have reached $3.87 billion across 600,000 wallets.
Crypto World
Could the XRP Price Prediction Break $2 After Leading ETF Inflows With $120M While Pepeto Might Offer Much More Returns
The xrp price prediction just got a new catalyst. XRP led all crypto assets in weekly ETF inflows with $120 million while whale wallets hit a 10-month accumulation high, adding over 11 million XRP per day, according to Yahoo Finance. But XRP still sits at $1.35 after six straight monthly losses.
The xrp price prediction benefits from whale buying and ETF flows, but the wallets building real wealth this cycle have already moved past large caps. They are in the presale where over $8.9 million raised, a SolidProof audit, and a Binance listing ahead mean the 100x math works before the first trade opens.
XRP led all crypto assets in weekly ETF inflows with $120 million, according to Yahoo Finance. CryptoQuant data from April 6 shows whale accumulation at a 10-month high with large wallets adding 11 million XRP per day on a 30-day average.
The CLARITY Act markup targeting late April could permanently classify XRP as a digital commodity under federal law, and Polymarket gives 72% odds of the bill passing in 2026. The xrp price prediction now sits in a better regulatory setup than any point in XRP’s history, and the presale entries positioned before institutional capital fully arrives will capture the strongest returns.
XRP, Pepeto, and the Exchange Presale Where the Listing Math Delivers
Pepeto
Institutional money is flowing into XRP ETFs at record pace. That is the Wall Street playbook, and it produces returns measured in percentages on assets with $82 billion market caps. Pepeto was designed for the investors who know what comes after that headline: the early-stage exchange where the triple-digit multiples sit before the advisory networks even know it exists.
PepetoSwap settles every order without a fee so your capital stops getting chipped away. The risk tool reviews contracts before your money goes near them. The bridge sends tokens across chains at full value. The creator who turned Pepe into an $11 billion token with no utility is behind Pepeto, and a Binance veteran on the dev team steers the exchange toward its listing date.
SolidProof finished a full code review before the first dollar entered. Over $8,920,333 raised because the wallets entering verified everything first. Staking at 185% APY builds daily for holders inside. The institutional wave is here, and it raises every position, including the early-stage ones that got in before the crowd notices.
The presale sits at $0.000000186 with 420 trillion supply. Pepe hit $11 billion on the same supply and the same creator but had no exchange tools at all, and reaching that level from here is 100x. The Binance listing will blow open the price, and Pepeto holders will be the breakout stories of this cycle. The xrp price prediction targets $2 to $3 over months. Pepeto targets 100x on one listing day, and it is close.
XRP Price Prediction at $1.35 as Whales Stack 11M XRP Per Day and CLARITY Act Nears
XRP trades at $1.35 with commodity status confirmed, according to CoinMarketCap. Whale wallets are adding 11 million XRP daily while ETF inflows hit $120 million in one week. Resistance sits at $1.40 with $1.65 as the next target.
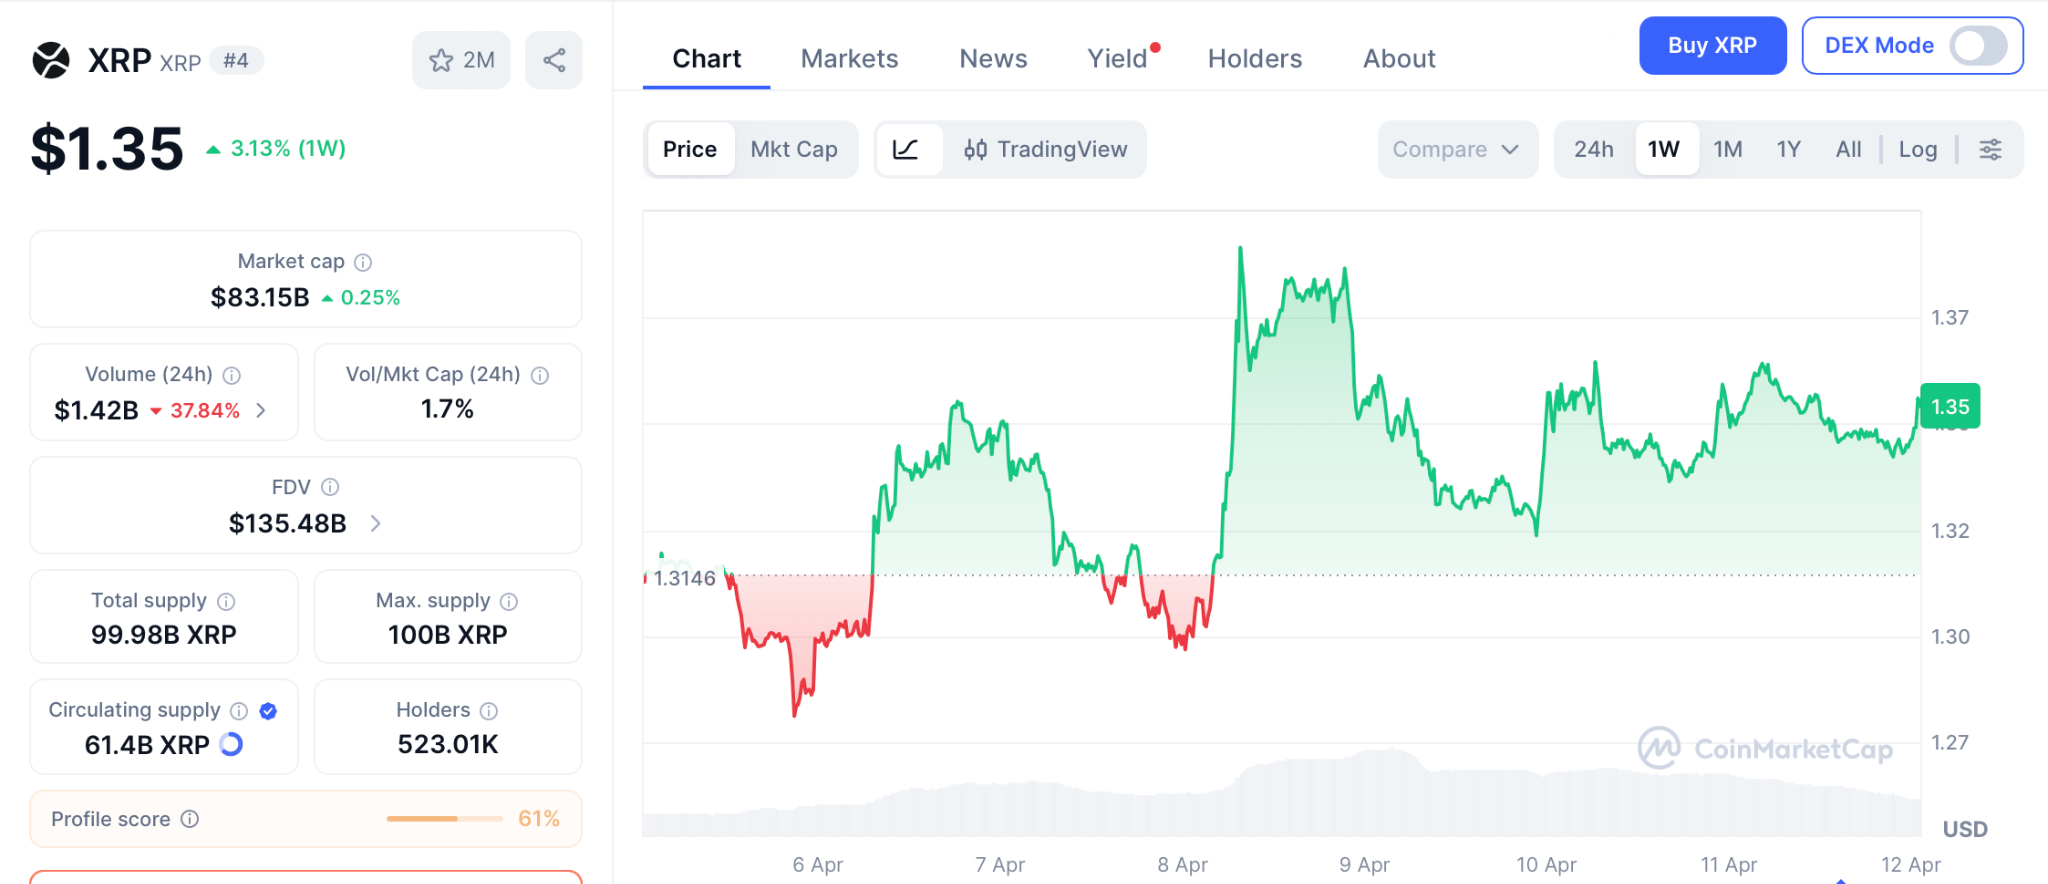
A break above $1.65 opens $2.00, a 48% move from here. Wall Street targets range from $2 to $3, with aggressive calls reaching $8 if banks scale settlement. If $1.28 breaks, $1.10 is the floor. Even the all-time high of $3.84 is only 2.8x from current levels.
The xrp price prediction is bullish, but 2.8x over months does not change a life the way one presale listing does.
Conclusion
The institutional wave that $120 million in weekly XRP ETF inflows represents is arriving in full force, and the early-stage presale entries positioned ahead of it are where the biggest returns sit. The xrp price prediction is bullish with commodity clarity, whale accumulation at a 10-month high, and the CLARITY Act markup weeks away.
But the wallets building real wealth this cycle are inside Pepeto at presale pricing. Visit Pepeto’s official site because the entry is still open, and the ones who act now will hold the positions this entire cycle talks about while everyone who waited watches from the outside wondering what their life would look like if they had moved.
Click To Visit Pepeto Website To Enter The Presale

FAQs
What is the xrp price prediction after leading $120M in weekly ETF inflows?
XRP targets $1.65 near term with $2 to $3 for 2026 as whale accumulation hits a 10-month high and the CLARITY Act markup approaches in late April.
How does the xrp price prediction compare to Pepeto’s listing return?
XRP at $1.35 targets 2.8x to the all-time high over months. Pepeto at presale pricing offers 100x from a single Binance listing that is approaching fast.
Disclaimer: This is a Press Release provided by a third party who is responsible for the content. Please conduct your own research before taking any action based on the content.
TLDR:
- Ethereum posted a -3.19% daily move, rejecting near $2,300 and closing lower within the range
- Price remains range-bound between $2,000 and $2,300 after exiting a prolonged downtrend phase
- Momentum indicators show weakening strength as MACD histogram shrinks and lines converge
- Key support at $2,110 faces pressure, while resistance near $2,300 continues limiting upside attempts
Ethereum began the second quarter with mild gains, yet recent price action shows hesitation near key resistance levels.
A daily chart shared by analyst Daan Crypto Trades points to weakening momentum, as ETH struggles to sustain upward movement within a defined consolidation range.
What Does Current Price Action Reveal About Ethereum’s Market Structure?
A tweet from Daan Crypto Trades outlines Ethereum’s current position on the ETH/USD 1D chart from Bitstamp. The latest candle opened at 2,285.1 and reached a high of 2,289.3.
The price later dropped to a low of 2,176.6 before closing at 2,212.8. This marks a decline of 72.8 points, representing a 3.19% loss on the day.
This daily candle reflects a strong rejection near the upper boundary of the range. The close near the lower half of the candle suggests that sellers regained control during the session. As a result, upward attempts faced resistance, limiting further gains in the short term.
Looking at the broader structure, Ethereum remains in a recovery phase after a prolonged decline. From November to February, the market formed consistent lower highs and lower lows. During that period, price dropped from above 4,000 to around 1,700.
Since March, the structure has shifted into sideways movement. Price has been trading between 2,000 and 2,300, forming a consolidation range.
This range reflects a balance between buyers and sellers after the earlier decline. While higher lows have formed since February, resistance continues to cap upward movement near 2,300 to 2,400.
How Do Indicators and Key Levels Shape Ethereum’s Next Move?
Volatility bands on the chart provide further context for current price action. The upper band sits near 2,295.8, while the middle band stands at 2,112.8.
The lower band is positioned around 1,941.7. Price recently tested the upper band but failed to break above it. This rejection pushed the price back toward the mid-band level.
The mid-band near 2,110 now acts as a short-term pivot zone. Holding above this level may support continued consolidation.
However, a break below could expose the lower range near 2,000. The lower band at 1,940 remains a deeper support level if selling pressure increases.
Momentum indicators also show a shift in strength. The MACD-style oscillator remains positive, with the histogram reading at +0.86%.
The fast line stands near 1.71%, while the signal line is around 0.86%. Although momentum turned positive recently, the histogram is shrinking, and the lines are converging.
This pattern often signals slowing upward momentum. As a result, buying pressure appears to be fading near resistance levels. This aligns with the recent rejection near 2,300, where sellers stepped in again.Source: TradingView
Resistance remains clearly defined between 2,295 and 2,320. A break above this zone would open the path toward 2,400 and beyond.
On the downside, immediate support lies between 2,110 and 2,120. Below that, the 2,000 to 2,050 range continues to act as a strong floor.
Current conditions suggest a market still searching for direction. Short-term movement leans toward the downside following the recent rejection. However, the broader structure remains range-bound, with no confirmed breakout yet.
If price drops below 2,110, a move toward 2,000 becomes more likely. On the other hand, reclaiming 2,300 could shift momentum back toward higher targets between 2,500 and 2,700.
Crypto World
Trump Moves to Choke Iran’s Ports Without Closing the World’s Oil Lifeline, CENTCOM Confirms


U.S. Central Command (CENTCOM) will begin enforcing a blockade on all maritime traffic entering and exiting Iranian ports on April 13 at 10 a.m. ET, according to an official announcement issued in line with a presidential proclamation.
The directive applies to all vessels, regardless of flag or ownership, operating in Iranian coastal waters, including ports in the Arabian Gulf and the Gulf of Oman.
U.S. to Enforce Blockade on Iranian Ports as CENTCOM Announces Maritime Clampdown
However, CENTCOM emphasized that the measure will not impede freedom of navigation for ships transiting the Strait of Hormuz to or from non-Iranian ports, a critical distinction aimed at maintaining global energy flows.
“The blockade will be enforced impartially against vessels of all nations entering or departing Iranian ports and coastal areas, including all Iranian ports on the Arabian Gulf and Gulf of Oman,” the CENTCOM articulated.
Officials said the operation will be enforced impartially and that commercial mariners will receive additional guidance through formal “Notice to Mariners” communications ahead of implementation.
Vessels operating in the Gulf of Oman and approaches to the Strait of Hormuz are being advised to monitor maritime broadcasts and maintain contact with U.S. naval forces on bridge-to-bridge VHF channel 16.
The move marks a significant escalation in maritime pressure on Iran amid ongoing regional tensions that have already disrupted shipping routes and heightened global energy market volatility.
Analysts note that while the Strait of Hormuz remains open, restricting access to Iranian ports could intensify economic strain on Tehran.
CENTCOM did not provide details on the duration of the blockade but indicated further operational updates will follow as conditions evolve in the region.
Shipping operators and energy traders are expected to closely monitor developments as enforcement begins, with maritime risk assessments likely to be revised in real time.
Insurance premiums for Gulf-bound cargoes could also fluctuate depending on the scope of enforcement and any Iranian response.
The situation remains fluid, with governments and commercial fleets awaiting further clarification from U.S. naval authorities in the coming hours and days ahead of scheduled rollout begins period.
“Enjoy the current pump figures. With the so-called ‘blockade’, Soon you’ll be nostalgic for $4–$5 gas,” wrote Ghalibaf, Speaker of the Islamic Republic of Iran’s Parliament.
The post Trump Moves to Choke Iran’s Ports Without Closing the World’s Oil Lifeline, CENTCOM Confirms appeared first on BeInCrypto.
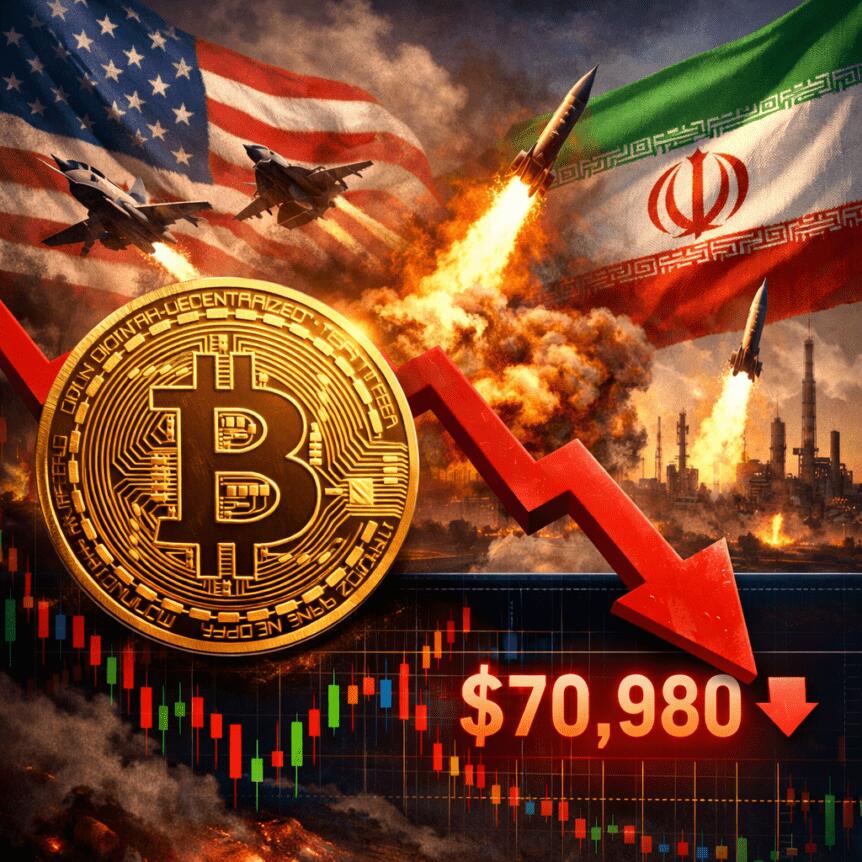
Bitcoin fell below $71,000 on Sunday as talks between the United States and Iran stalled, underscoring how geopolitical tensions are seeping into crypto markets even as traders weigh liquidity and inflation factors. Data from TradingView showed BTC trading under the key threshold as a weekly close approached, highlighting the asset’s sensitivity to the ebb and flow of risk appetite amid flare-ups in the Strait of Hormuz and diplomatic deadlock.
Key points:
- BTC softens after news that US–Iran negotiations in Islamabad broke down, reviving risk-off pressure.
- US threats to reopen and police the Strait of Hormuz amplified concerns about energy prices and inflation dynamics.
- Bitcoin-long positions faced notable liquidations, signaling renewed volatility in the immediate term.
Diplomatic setback reverberates through crypto markets
In the wake of stalled talks aimed at curbing Iran’s nuclear ambitions, negotiations between the US and Iran were left unfinished as delegations left Islamabad without an agreement. The breakdown coincided with President Donald Trump’s explicit threat to blockade the Strait of Hormuz and to interdict vessels that pay for passage, a move that would directly affect global oil flows and prices. Trump later amplified the stance via Truth Social, reiterating calls for fully operational transit through Hormuz.
The geopolitical headline set the stage for a broader market assessment: if the conflict escalates or oil supply becomes more constrained, inflation pressures could intensify and complicate the policy path for central banks. The Kobeissi Letter, a market commentary that authors follow closely on X, framed the immediate macro risk thus: “If the path forward is continued war, escalation, and a prolonged closure of the Strait of Hormuz, then the Iran War has just entered a new era.” The note further tied inflation dynamics to energy prices, warning that CPI inflation could spike higher if geopolitical tensions persist.
Meanwhile, financial markets prepared for a stream of inflation data and policy commentary. The March CPI print had shown a notable jump in inflationary pressures, though the month’s headline figure landed slightly below consensus expectations; what mattered more for markets was the oil-price component’s surprise surge—the strongest in six decades—within the CPI release. Analysts argued that a sustained rise in energy costs could sustain higher inflation readings, complicating the Federal Reserve’s balancing act between taming inflation and supporting growth.
Against this backdrop, market participants questioned whether the escalation would push policymakers toward stimulus or liquidity measures if risk assets continued to wobble. On X, veteran trader Michaël van de Poppe argued that a longer flare-up in the Iran situation would likely hamper risk-on assets, prompting discussions about possible Fed intervention. He suggested that a weak economy could force the central bank to reassert its unconventional toolkit, potentially rekindling the liquidity wagon that has historically buoyed risky assets during periods of stress.
Bitcoin liquidity metrics echo renewed volatility
Bitcoin’s price reaction unfolded as a mixed bag of risk signals and technical pressure. In the lead-up to the opening of futures markets, BTC’s move below $71,000 represented a retreat from recent highs and highlighted a potential trigger for late-long positions to unwind. Market data from CoinGlass indicated heightened volatility, with long liquidations climbing toward the $350 million mark over the preceding 24 hours. The liquidation heat map pointed to a tremor in speculative bets as traders repositioned in response to a shifting macro and geopolitical backdrop.
For traders, the impulse to seek safer harbors clashed with the crypto market’s own risk profile. Crypto traders often respond quickly to macro headlines because crypto markets are still highly sensitive to liquidity conditions and the stance of global financial policy. The latest data underscored that even a single, loud geopolitical cue can cascade into material downside pressure for long positions, especially when paired with concerns about energy prices and inflation expectations.
“Volatility remains high, and there won’t be a path forward where risk-on assets perform well if this remains the consensus,” wrote a notable market observer in response to the current environment.
Those who watch the broader macro canvas note an emerging tension: a weaker real economy could prompt a renewed dose of monetary accommodation, which historically has supported risk assets in the short term but could complicate inflation trajectories over the longer horizon. The question traders are tracking is whether the Fed and other major central banks will lean into more expansive policy if geopolitical risk sustains its grip on markets, or if tighter financial conditions will reassert themselves as inflation drivers remain in focus.
Inflation risk, policy expectations, and what comes next
Beyond the immediate price action, the narrative around inflation and policy remains central to crypto’s risk-reward calculus. The March CPI data had shown a notable oil-price component spike, underscoring how energy dynamics can tilt inflation readings and, by extension, central-bank guidance. Kobeissi’s analysis linked these dynamics to the Iran scenario, arguing that a protracted conflict could push inflation higher, potentially prompting renewed monetary support or liquidity measures to cushion real-economy weakness.
Looking ahead, investors will be watching the upcoming suite of inflation indicators, including the March Producer Price Index (PPI) release, for signals about the breadth of price pressures. Additionally, speeches from senior Federal Reserve officials will likely frame the near-term policy outlook more clearly. In that context, Bitcoin and other crypto assets could continue to act as a barometer for how traders interpret the risk of policy missteps amid geopolitical stress and energy-price volatility.
What to watch next
The immediate focus remains on how geopolitical tensions evolve and what that means for energy markets, inflation, and central-bank responses. If talks resume or a de-escalation path emerges, crypto traders could reassess risk appetites, potentially stabilizing prices as liquidity conditions normalize. Conversely, further escalation—whether through renewed sanctions, renewed missile rhetoric, or supply-chain disruptions in energy markets—could keep volatility elevated and drive continued attention on liquidity dynamics and macro forecasts.
Investors should also monitor how long the current risk-off mood persists and whether the market receives a clearer signal from policy makers about their tolerance for inflation versus economic growth trade-offs. The next few weeks promise to be data-rich, and the balance of macro signals—oil prices, inflation readings, and central-bank communications—will likely set the tone for Bitcoin and broader crypto markets as they navigate a geopolitically unsettled environment.
This editorial summary reflects observed market reactions and publicly available data points from TradingView, CoinGlass, and market commentary circulating around the geopolitical narrative surrounding US–Iran tensions and Hormuz-related risks. As always, readers should perform their own due diligence and consider multiple scenarios as the macro landscape evolves.
Next up, traders will scrutinize inflation trajectories and policy guidance to assess whether crypto assets gain or lose traction in a macro environment increasingly shaped by energy prices and geopolitical risk.
Ether Machine Merger Collapses as Dynamix Exits $50M SPAC Deal
This Forgotten 12-Part Sci-Fi Show Was ABC’s Wildest ‘Tron’ Knockoff

Bolton dad jailed after drug deal in Halliwell car park


-

 Business7 days ago
Three Gulf funds agree to back Paramount’s $81 billion takeover of Warner, WSJ reports
-

 Politics2 days ago
US brings back mandatory military draft registration
-

 Fashion2 days ago
Weekend Open Thread: Veronica Beard
-

 Tech5 days ago
How Long Can You Drive With Expired Registration? What Florida Law Says
-

 Politics8 hours ago
World Cup exit makes Italy enter crisis mode
-
 Sports2 days ago
Man United discover Nico Schlotterbeck transfer fee as defender reaches Dortmund agreement
-

 Fashion6 days ago
Massimo Dutti Offers Inspiration for Your Summer Mood Board
-

 Crypto World3 days ago
Canary Capital Files SEC Registration for PEPE ETF
-

 Fashion5 days ago
Let’s Discuss: DEI in 2026
-

 Business2 days ago
Tesla Model Y Tops China Auto Sales in March 2026 With 39,827 Registrations, Beating Cheaper EVs and Gas Cars
-

 Crypto World4 days ago
Bitcoin recovers as US and Iran Agree a Ceasefire Deal
-

 Politics3 days ago
Malcolm In The Middle OG Turned Down ‘Buckets Of Money’ To Appear In Reboot
-

 Business2 days ago
OpenAI Halts Stargate UK Data Centre Project Over Energy Costs and Copyright Row
-

 Business1 day ago
Ireland Fuel Protests Enter Day 5 as Blockades Spark Shortages and Government Prepares Support Package
-

 Tech7 days ago
Italian court says Netflix must refund customers up to $576 over price hikes
-

 Tech7 days ago
Haier is betting big that your next TV purchase will be one of these
-

 Tech7 days ago
Gamer Restores the Original PlayStation Portal From Two Decades Ago
-

 Tech7 days ago
The Xiaomi 17 Ultra has some impressive add-ons that make snapping photos really fun
-

 Tech7 days ago
Samsung just gave up on its own Messages app
-

 Politics3 days ago
LBC Presenter Mocks Trump Over Iran War Failures
You must be logged in to post a comment Login