

Crypto World
HBAR price gains amid crypto uptick: where’s the major resistance?


- HBAR rose to above 0.095 as crypto sentiment improved following recent macro‑driven swings.
- The $0.13-$0.15 zone could be a major resistance region for bulls.
- Hedera price must reclaim and hold above $0.10 to confirm a potential trend reversal.
Hedera (HBAR) price jumped more than 5% in 24 hours as cryptocurrency markets flipped green, with bulls eyeing momentum amid optimism that the US-Iran war could end soon.
But as Hedera’s native token targets a breakout above the $0.10 mark, what resistance cluster is likely to derail buyers? The technical chart provides the outlook.
Here’s why HBAR price rose, testing a key level
Hedera’s HBAR rose to intraday highs near $0.095 on Monday as Bitcoin and the broader market reacted to geopolitical developments.
The move followed comments from Donald Trump suggesting easing tensions with Iran, which helped lift sentiment across risk assets.
Bitcoin climbed above $71,000 during the session, while BNB also moved higher toward $650, supporting gains in altcoins.
Despite the initial relief, underlying uncertainty remains. Ongoing tensions linked to the Iran conflict and broader macroeconomic headwinds continue to limit upside across the crypto market.
Adding to the uncertainty, reports cited Iranian state media disputing Trump’s claims, stating that no negotiations are underway and rejecting his remarks.
Against this backdrop, HBAR’s near-term direction remains tied to broader market movements.
A renewed decline in Bitcoin could push the token back below the $0.09 level.
On the other hand, sustained buying above current levels could open the door for further short-term gains, with a key resistance zone likely to define the next move.
Hedera price forecast: can bulls extend rally?
Analysts tracking Hedera highlight $0.10 as a key near-term pivot, with potential upside targets in the $0.13–$0.15 range.
This zone has recently acted as a ceiling for price advances, capping bullish attempts.
A sustained move higher would require HBAR to break above the 50-day exponential moving average near $0.098 and the 100-day EMA around $0.11.
Clearing these levels would bring the token toward a primary resistance area near the 200-day EMA, around $0.13, which has marked recent rejection points.
Previous attempts to push higher have struggled to hold gains beyond the $0.15 level.
At present, HBAR is retesting the middle band of the Bollinger Bands on the daily chart.
The bands are tightening, indicating reduced volatility and suggesting that a breakout may be approaching, although confirmation is still needed.

Hedera HBAR chart by TradingViewFailure to clear this zone could see HBAR revert into a consolidation corridor within a long-term downward channel.
Conditions across the market could then mean an extended sideways action before clarity from macro or fundamentals becomes the next upside catalyst.
Bears may eye $0.07 and $0.06 as major support levels.


The company behind the popular cryptocurrency XRP made a prestigious list alongside major private companies such as SpaceX.
The news has failed to trigger a price resurgence in its native token, which remains in the red for the day. However, certain indicators suggest it might be gearing up for a rally.
Another Acclamation for Ripple
Ripple has earned recognition as one of the top 10 entities included in the Prime Unicorn Index, highlighting its strong position in the private-company landscape. Specifically, it ranks sixth on the list with a valuation of over $26 billion.
The undisputed leader is Space Exploration Technologies Corporation (better known as SpaceX), which is valued at more than $1.2 trillion. The second position goes to OpenAI, with a valuation of around $917 billion, while Anthropic comes in third at roughly $332 billion. It is important to note that Ripple is the only crypto company part of that prestigious club.
The index tracks the performance of US private companies valued above $1 billion. It uses a modified capitalization model and serves as a benchmark for financial products tied to such entities. Currently, the index includes 232 companies with a combined valuation of more than $3.4 trillion.
This is hardly the first time Ripple has been featured in a prestigious ranking. In 2024, CNBC and Statista ranked it among the top 250 fintech companies worldwide. In 2022, People’s Magazine positioned Ripple as the 4th Best Workplace for Parents and the 21st Best Workplace in Technology.
No Reaction From XRP
The company’s cross-border token experienced little to no volatility following the disclosure and has been trading at around $1.40, representing a 1.5% daily decline.
At the same time, the solid institutional interest signals that the asset could be on the verge of a price increase. Inflows into spot XRP ETFs have dominated outflows over the last few weeks, indicating that pension funds, hedge funds, and other investors have increased their exposure to the asset, which could support a potential bullish momentum.
For his part, the renowned analyst Ali Martinez claimed that XRP’s TD Sequential indicator has flashed a new buy signal on the four-hour chart.
“I pay close attention to this setup because it has accurately anticipated every major trend shift in XRP recently. For instance, on May 6, I noted the indicator flashed a sell signal at the $1.46 high. That call perfectly timed the local top, leading to the 5.5% correction we’ve seen over the last 48 hours. Today, the indicator has flipped to a buy signal. To me, this suggests the local exhaustion is over, and XRP is ready to rebound,” he said.
Earlier this week, Martinez argued that a confirmed close above $1.45 could open the door to a rise to as high as $1.80.
The post Ripple (XRP) Joins an Exclusive Club Next to SpaceX, OpenAI: Details Inside appeared first on CryptoPotato.

TLDR:
- XRP remains range-bound between $1.22 and $1.55, with no confirmed breakout on higher timeframe charts.
- A short-term B-wave rally toward $1.78–$2.87 is possible but would not confirm a new bullish trend for XRP.
- Analysts warn a C-wave decline could push XRP down to between $0.98 and $0.48 if the structure holds.
- High-leverage long positions face liquidation risk if XRP sees even a slight drop below current price levels.
XRP continues to trade within a well-defined range as analysts monitor its price structure closely. The cryptocurrency has shown limited momentum compared to Bitcoin, which has already posted stronger rallies in recent sessions.
Market observers note that the current movement appears corrective rather than impulsive. As long as XRP remains trapped between key levels, the broader bearish outlook stays intact for traders watching the charts.
XRP Remains Stuck Between $1.22 and $1.55 Support and Resistance
XRP has been unable to break out of its local range between $1.22 and $1.55. According to MCO Global Español, the structure on higher timeframes has not changed much. The movement continues to look corrective, consistent with a broader ABC pattern.
The ABC structure is a common corrective wave sequence tracked in Elliott Wave analysis. It involves two downward legs separated by a temporary counter-rally. Analysts who follow this framework suggest XRP may still be in its middle phase.
While a short-term rally toward the $1.78 to $2.87 resistance zone remains possible, that move would still fit within a corrective B-wave. That outcome would not confirm a new bull trend for XRP. Instead, it would set the stage for a deeper C-wave decline.
Momentum Weakness and Leverage Risk Add to Bearish Pressure
Momentum remains the central concern for XRP bulls at this stage. MCO Global Español noted that Bitcoin has already delivered stronger B-wave rallies, while XRP lags behind. This divergence raises questions about XRP’s short-term strength relative to the broader market.
A potential C-wave drop could push XRP down to between $0.98 and $0.48, based on the current corrective count.
That would represent a substantial move lower from current levels. Traders are watching closely to see whether the range holds or breaks in either direction.
Adding to the concern, analyst CW pointed out that a slight further decline in XRP could liquidate most high-leverage long positions.
This creates additional downside pressure since forced liquidations tend to accelerate price drops. The concentration of leveraged longs near current levels makes the $1.22 support area particularly sensitive.
If liquidations trigger below that level, a cascade effect could push price toward the lower end of the projected C-wave target. However, the range between $1.22 and $1.55 has held so far.
Until a clear break occurs in either direction, the corrective structure remains the dominant framework analysts are working with.


Bitcoin (BTC) shed around 245,000 wallet holders in just five days, the fastest rate of wallet exits in nearly two years, according to on-chain analytics firm Santiment.
The last time this happened at a comparable pace, in the summer of 2024, it foreshadowed one of the more notable bull runs in recent memory.
Wallet Exits Pile Up
According to Santiment, the drop was likely tied to retail traders taking profit, and it explained what such wallet exits mean in practice:
“When holders leave, the remaining supply consolidates into the hands of those with the highest conviction. These are participants who have already decided they are not selling at current prices, which means the effective liquid supply available to the market shrinks.”
The analytics firm also referenced a June to July 2024 episode that saw over 964,000 wallets exit across five weeks. Rather than triggering a sustained downturn, that period laid the groundwork for the bull run that followed.
Santiment’s read on the current situation is similar, and its analysts have said that should history repeat, the wallets exiting right now would be handing their positions to “precisely the kind of long-term holders who tend to fuel the next leg up.”
This latest pullback in holders has come when Bitcoin has dropped below the $80,000 level it jumped over at the beginning of the week. Before the dip, it jumped to a multi-month peak near $83,000, but the correction sent it back near $81,000, where it found some support.
BTC Needs to Go Back Above $80K
The sequence described above is important considering that analyst Ali Martinez identified $80,300 as the average cost basis for wallets that bought BTC in the last 155 days.
At the time of writing, the asset was changing hands at about $79,500, down about 2% in the last 24 hours and still almost 37% below its all-time high set in October 2025.
It means, therefore, that the new whales are currently underwater, which may push them to sell just to break even, and according to Martinez, such panic exits could create a wave of selling pressure that could pull prices even lower.
On a monthly basis, it is up about 11%, and the seven-day range sits between $77,000 and $82,500, which gives a reasonable sense of where the market has been bouncing.
If it manages to flip $80,300, it puts the large holders back in the green, making them stop selling and start chasing higher targets, which, in the words of Martinez, “is exactly how new uptrends begin.”
The post Bitcoin Wallets See Largest Drop Since 2024, Hinting at Market Rebound appeared first on CryptoPotato.


The US April jobs report showed 115,000 positions added in April, nearly doubling the consensus forecast of 62,000.
Summary
- The Bureau of Labor Statistics reported 115,000 nonfarm payroll jobs added in April, well above the 62,000 consensus estimate.
- Unemployment held at 4.3%, with gains concentrated in healthcare, transportation, warehousing, and retail trade.
- The strong April jobs report reduces pressure on the Federal Reserve to cut rates, a headwind for crypto and risk assets.
The US April jobs report showed 115,000 positions added in April, nearly doubling the consensus forecast of 62,000, according to data the Bureau of Labor Statistics released on May 8. The unemployment rate held unchanged at 4.3%, marking the second consecutive month that payroll growth significantly outpaced expectations.
Healthcare led job creation with 37,000 new positions, followed by gains in transportation, warehousing, and retail trade. Federal government employment continued to decline.
Average hourly earnings rose 0.2% for the month and 3.6% year on year, coming in below the 0.3% and 3.8% forecasts respectively, suggesting that wage pressures remain contained even as hiring holds firm.
What the report means for markets
A stronger-than-expected labor market typically pushes out expectations for Federal Reserve rate cuts, as policymakers see less urgency to ease with unemployment low and hiring robust.
As crypto.news reported, fewer expected rate cuts in 2026 mean higher terminal funding costs for leveraged players and a slower normalization of real yields, both headwinds for the crypto bull cycle.
The White House called the result “yet another sign that the American economy remains on a solid trajectory,” while analysts noted the report arrives against a backdrop of Iran-war-related uncertainty and oil price pressure.
As crypto.news tracked, labor data surprises this year have consistently pushed Treasury yields higher and reduced the rate-cut expectations that typically fuel crypto liquidity rallies.

Bitcoin advanced to a fresh three-month high, even as on-chain metrics signal a growing wave of profit-taking among short-term holders. CryptoQuant analyst Julio Moreno highlighted a notable distribution event on Monday, with holders realizing 14,600 BTC in profits — roughly $1.1 billion — in the wake of Bitcoin’s April rally. The move comes as BTC and broader risk assets attempt to extend a recent uptrend after a challenging start to the year.
Moreno pointed to the Short-Term Holder Spent Output Profit Ratio (STH-SOPR), an indicator tracking profit-taking by wallets that have been dormant for less than 155 days. The metric rose above 1, a signal that those newly moved coins were being realized at a profit. He also noted that the 30-day rolling window shows more than 20,000 BTC in net profits realized, the first positive reading since December 22, 2025, following a stretch of losses in February and March that pushed net losses to as high as 398,000 BTC. While profit-taking has intensified, Moreno cautioned that demand has not kept pace, leaving Bitcoin in a broader bear market even as the price trades higher.
Bitcoin holders’ realized profits spike after the April rally. Source: CryptoQuant
Key takeaways
- Bitcoin hit a three-month high as on-chain metrics show a surge in profit-taking, including 14,600 BTC realized profits on Monday (~$1.1 billion).
- The STH-SOPR metric moved above 1, signaling active profit-taking among short-term holders; the 30-day window shows over 20,000 BTC in net profits realized, the first positive reading since late 2025.
- Bitcoin-focused ETF inflows remain robust—four days of positive inflows this week push weekly gains over $1 billion, though a Friday outflow of about $268.5 million trimmed some of the week’s momentum.
- Analysts remain divided on whether BTC has bottomed or if the bear market will deepen, with some forecasting a mid-2026 bottom and others warning that momentum could stall without stronger demand.
On-chain signals and the price narrative
The latest on-chain signals underscore a familiar tension in a market that has endured a protracted downcycle. Realized profit spikes often accompany bear-market rallies or sideways action, and the current pattern appears consistent with a market that lacks conviction among buyers despite a rising price. While the short-term holder cohort is realizing gains, the broader demand side has yet to accelerate meaningfully, leaving the price path susceptible to shifts in liquidity and macro sentiment.
The Bitcoin Short-Term Holder Spent Output Profit Ratio signals that short-term holders are realizing profits. Source: CryptoQuant
ETF inflows show continued institutional interest, but sentiment remains mixed
Investor appetite for Bitcoin exposure via exchange-traded funds remains resilient. Data from Farside shows a continuation of positive ETF inflows for four consecutive days this week, contributing to weekly inflows surpassing $1 billion. However, the week ended with a Friday outflow of approximately $268.5 million, illustrating how liquidity flows can ebb even amid broader buying interest.
Analysts remain divided on whether the market has found a floor. Some market observers argue that the bear-market dynamics persist until demand strengthens across both retail and institutional channels. Others see the recent resilience as a signal that a longer-term bottom could be forming, albeit with considerable uncertainty about the trajectory in the near term.
Context from current coverage shows a broader discussion among traders about whether Bitcoin is in a bear-market rally or entering a new cycle. For example, veteran traders have offered divergent views on the path to mid-2026 and beyond, with forecasts ranging from modest recoveries to more skeptical assessments about the likelihood of a rapid ascent back toward previous highs. Related analyses continue to emphasize the gap between on-chain profit realization and actual buying demand as a critical factor shaping near-term moves.
In related perspective pieces, industry voices have mulled whether BTC could reassert bullish momentum in 2026, with opinions spanning a potential bottom around mid-year to scenarios where a sustained push toward higher levels remains contingent on broader market catalysts. For readers seeking a broader commentary, Cointelegraph has highlighted the ongoing debate among traders about whether BTC is bottoming or entering a longer bear-market phase, alongside coverage of market cycles and sentiment indicators.
Additionally, readers can explore broader market context through specialist commentary and magazines that examine long-term price narratives and veteran trader viewpoints on Bitcoin’s possible trajectories through the coming years.
What to watch next: traders will be paying close attention to whether ETF inflows stay resilient and whether on-chain profit-taking cools as price momentum persists. If demand strengthens alongside price, Bitcoin could extend its recovery; if not, the market may test the lower bounds of the current bear cycle.
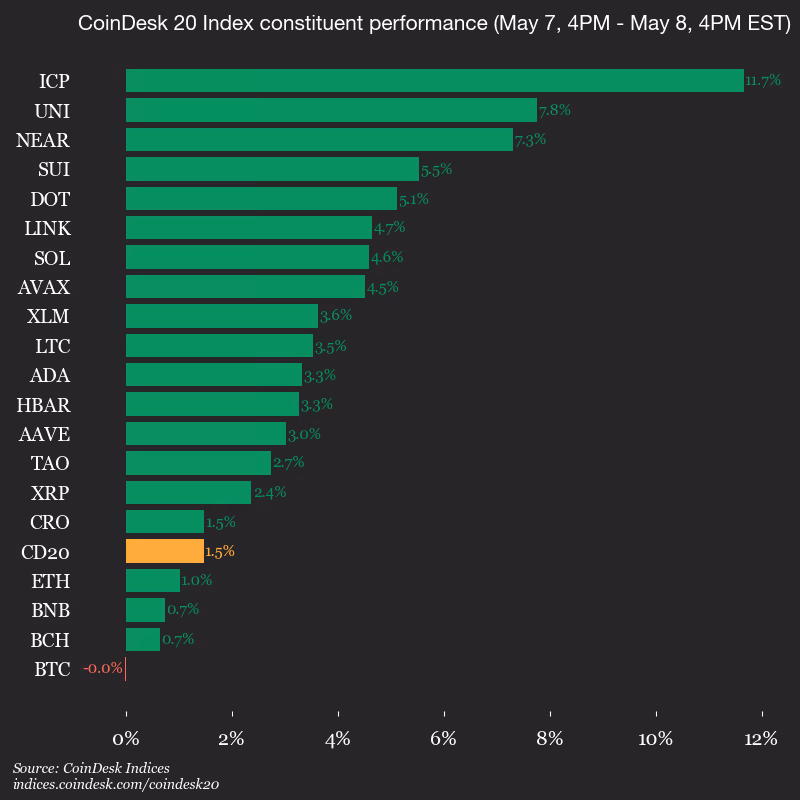
With bitcoin holding above $80,000 and stocks pushing to fresh record highs, risk appetite spilled deeper into crypto markets Friday, lifting altcoins and blockchain infrastructure plays.
Solana (SOL), Chainlink , and rose around 5%, while Near Protocol (NEAR) and Uniswap (UNI) gained roughly 7%. Internet Computer Protocol’s ICP jumped nearly 12%, leading majors higher.

The move came alongside another strong session for equities. The tech-heavy Nasdaq climbed 2.2% to fresh record highs, while the S&P 500 added 0.85%, also closing at an all-time high.
Friday’s U.S. labor market data added to the constructive backdrop. The economy added 115,000 jobs in April, comfortably above expectations for 62,000, while the unemployment rate held steady at 4.3%.
Crypto-linked equities also rebounded, led by Coinbase (COIN). Shares of the crypto exchange recovered 10% from session lows after Thursday’s earnings report showed a $398 million quarterly loss with softer trading activity. The firm’s trading platform also suffered early Friday a several hours long outage due to an AWS failure that was fully resolved later.
Despite the weak quarter, several Wall Street analysts focused on longer-term tailwinds tied to stablecoins and crypto regulation.
That narrative gained momentum after SEC Chair Paul Atkins said Friday that the agency is weighing new rulemaking around onchain trading systems, crypto custody infrastructure and blockchain-based settlement rails as finance increasingly converges with AI and distributed ledger technology.
Atkins also reiterated support for congressional efforts to advance crypto market structure legislation, comments investors viewed as supportive for tokenization and blockchain-based financial infrastructure.
The theme drove gains in related equities. Bullish (BLSH), CoinDesk’s parent company, that this week announced a deeper push into tokenization, rose 6%. Digital asset infrastructure firm BitGo (BTGO) surged 10%, while Cantor Equity Partners II (CEPT), which plans to merge with BlackRock-backed tokenization firm Securitize, gained 4.3%.
Estonia’s financial regulator has issued an investor warning against BB Trade Estonia OÜ, the operator behind the Zondacrypto digital asset exchange, citing a missing white paper for the TeamPL token. The Financial Supervisory and Resolution Authority (FSA) says the absence of a published white paper on the exchange’s site violates the EU’s Markets in Crypto-Assets (MiCA) framework, which requires ongoing disclosure for crypto assets offered to the public.
According to the FSA, the warning rests on Article 9, Section 1 of MiCA, which obligates issuers and those seeking admission to trading to keep crypto-asset white papers available on their websites for as long as the assets are held by the public. The FSA’s action signals renewed EU-wide emphasis on disclosure and investor protection as MiCA preparations unfold for a broader set of firms, including smaller exchanges operating across member states.
Cointelegraph reached out to Zondacrypto for comment by publication time but did not receive a response. The warning arrives as Zondacrypto has faced a string of operational and regulatory headwinds, including withdrawal difficulties that have prompted law-enforcement scrutiny in Poland.
The regulatory development comes amid elevated attention to MiCA’s impact on smaller crypto firms, a topic Cointelegraph has previously explored in the context of Europe’s evolving regime for crypto assets and market participants.
The investor warning for Zondacrypto and its parent company. Source: Estonia FSA
In April, Polish authorities opened an investigation into Zonda/ Zondacrypto after users reported withdrawal problems and difficulties accessing their funds. The case has layered regulatory scrutiny across jurisdictions, underscoring cross-border enforcement challenges in a MiCA-enabled Europe.
Related: Europe’s MiCA regime puts smaller crypto firms under pressure
Key takeaways
- The Estonian regulator issued an investor warning to BB Trade Estonia OÜ for lacking a publicly available white paper for the TeamPL token, invoking MiCA Article 9(1).
- The action highlights MiCA’s ongoing disclosure obligations and the heightened regulatory risk for EU-based exchanges and issuers.
- The warning follows withdrawal issues at Zondacrypto and a Polish law-enforcement probe, illustrating cross-border regulatory risk and enforcement coordination within the EU and its neighborhood.
- Company leadership has presented competing narratives about operational solvency and control of key crypto assets, amid questions over governance and long-standing management challenges.
- The case underscores broader MiCA implications for smaller firms, licensing considerations, AML/KYC obligations, and the evolving cross-border regulatory framework in Europe.
Zondacrypto under heightened regulatory and operational scrutiny
Estonia’s FSA stated that BB Trade Estonia OÜ operates Zondacrypto, and the regulator’s warning focuses on the absence of a white paper for the TeamPL token. The FSA asserted that the white paper must remain accessible on the issuer’s site for as long as the token is publicly held, reflecting MiCA’s emphasis on investor protection through transparent disclosures. The regulator’s document links to MiCA’s requirement for ongoing disclosure and reinforces the supervisory stance that even smaller platforms must maintain accessible documentation to inform investors and potential participants.
The FSA’s action comes amid broader questions about how MiCA will reshape the behavior and governance of crypto platforms with EU-based market access. As the European regime continues to take shape, regulators across member states are scrutinizing compliance practices that affect marketing, issuance, and trading of crypto assets. The exact regulatory consequences for BB Trade Estonia OÜ remain to be seen, but the warning could carry potential remedial demands, enforcement action, or other supervisory measures if non-compliance persists.
Withdrawal turmoil, governance questions, and cross-border investigations
Separately, Zondacrypto’s governance and asset-access issues have attracted attention from Polish authorities. In April, Przemysław Kral, the company’s CEO, publicly claimed that the exchange did not have access to a cold wallet containing approximately 4,500 BTC, valued at hundreds of millions of dollars at the time. Kral attributed the problem to a failure to obtain private keys from Sylwester Suszek, the founder and former chief executive, who has reportedly been missing since 2022. While Kral denied insolvency, he asserted that customer obligations would be met, notwithstanding the ongoing access problems.
Subsequent reporting indicated that Kral ceased posting on X in mid-April, and local media suggested he relocated to Israel amid the Polish investigation. Earlier in February, Kral had described Zondacrypto as a Polish-rooted enterprise operating outside Poland’s borders to align with MiCA standards, signaling strategic considerations about where the firm can legally and operationally function within the EU’s regulatory perimeter.
Polish investigators began examining the exchange after users reported withdrawal issues and concerns about accessing funds. The development illustrates how cross-border enforcement and regulatory differences—MiCA implementation in the EU versus national crypto rules in non-EU states—can complicate enforcement, asset recovery, and investor protection when platforms encounter liquidity or custody challenges.
These dynamics place additional pressure on firms to maintain robust custody arrangements, formalized governance structures, and transparent disclosures, particularly as authorities increasingly view cross-border operations through a MiCA-centric lens. The situation also emphasizes the need for clear procedures around loss of keys, governance handovers, and communications with customers during periods of stress, given the potential investor impact and regulatory scrutiny.
Broader policy context and implications for market participants
Analysts monitoring the case note that MiCA is designed to harmonize disclosure standards and supervisory expectations across the European Union, potentially compelling smaller actors to shore up compliance, licensing, and risk management frameworks. The Estonia FSA’s action is consistent with a broader regulatory push to ensure that investors can access critical information about crypto assets offered to the public and traded on EU platforms. In parallel, authorities in Poland and other jurisdictions demonstrate that enforcement will continue to traverse borders, requiring cooperation and information-sharing to address operational failures, custody risks, and potential misappropriation concerns.
For exchanges seeking to operate under MiCA, the case underscores several practical implications: maintaining up-to-date white papers and disclosures; ensuring custody arrangements are verifiable and resilient; and maintaining clear lines of communication with customers and regulators. It also highlights the enduring tension between national regulatory regimes and EU-wide directives, particularly for entities with roots in one jurisdiction but active service across multiple member states.
From a compliance perspective, the episode reinforces the importance of AML/KYC frameworks, licensing status, and ongoing regulatory reporting. For investors and institutional clients, the development serves as a reminder to assess counterparty risk, governance quality, asset custody arrangements, and the credibility of information disclosed by platforms operating within or outside EU borders.
Looking ahead, authorities may pursue further clarifications, corrective actions, or sanctions related to the MiCA-compliance shortfall identified by the Estonian regulator. The cross-border nature of Zondacrypto’s challenges—combining MiCA obligations with Polish enforcement activity—will likely keep regulators attentive to lessons learned about transparency, custody risk, and the resilience of digital-asset trading platforms in the EU ecosystem.
Closing perspective: As MiCA continues to shape regulatory expectations for crypto firms, the Zondacrypto case illustrates how disclosure requirements, governance standards, and cross-border investigations intertwine to influence operational viability and investor protection in Europe’s evolving crypto market.

AI Hosting Revenue Becomes TeraWulf’s Main Business
TeraWulf generated $21 million from HPC leasing during the quarter, while Bitcoin mining produced less than $13 million. The company achieved this milestone after expanding operations at its Lake Mariner facility in New York. As a result, AI infrastructure became the company’s largest source of revenue for the first time.
The company continued building dedicated HPC facilities during the quarter and expanded capacity for enterprise computer workloads. TeraWulf confirmed that 60 megawatts of HPC capacity already generate recurring revenue at Lake Mariner. Meanwhile, additional infrastructure projects remain under construction throughout 2026.
Core42 remained a major contributor to quarterly revenue because the company leased AI compute capacity at the site. TeraWulf also continued coordinating deployments with Fluidstack and Google-linked infrastructure operations. Consequently, the company strengthened its position in the growing AI infrastructure market.
Bitcoin Mining Revenue Declines as Margins Tighten
Digital asset mining revenue declined sharply from the previous year despite stable overall quarterly revenue. TeraWulf reported that mining revenue dropped from $34.4 million in the prior-year period. At the same time, higher network difficulty continued pressuring Bitcoin mining economics across the sector.
The company also posted a quarterly net loss exceeding $427 million due to non-cash warrant revaluation charges. However, operating trends improved as recurring HPC contracts increased across existing facilities. Management stated that contracted hosting revenue now supports long-term cash generation.
Cost structures also improved significantly after the transition toward AI infrastructure operations. During the latest quarter, TeraWulf spent substantially less on operational costs relative to total revenue. Consequently, the company reduced dependence on volatile Bitcoin mining returns.
Crypto Mining Firms Expand Into AI Infrastructure
Several crypto mining firms now pursue AI hosting opportunities as traditional mining margins remain compressed. Riot Platforms recently reported revenue contributions from data center operations linked to AI and cloud customers. In addition, industry participants increasingly describe themselves as computer infrastructure operators.
TeraWulf accelerated this transition after securing long-term contracts tied to AI compute infrastructure. The company disclosed billions of dollars in contracted HPC revenue linked to future infrastructure projects. Furthermore, management continued advancing expansion plans at the Hawesville facility in Kentucky.
The company recently raised $900 million to support construction and future infrastructure growth across multiple campuses. That funding will support additional AI data center capacity and customer deployments during the coming quarters. As demand for power-dense infrastructure rises, TeraWulf continues reducing exposure to Bitcoin market cycles.
TeraWulf Expands AI Infrastructure Footprint
Lake Mariner remains central to TeraWulf’s AI infrastructure strategy because the site supports large-scale computer deployments. The company confirmed that construction of the CB-3 building approached completion during the quarter. CB-4 and CB-5 remain scheduled for delivery later this year.
TeraWulf aims to scale contracted AI hosting revenue while maintaining selective Bitcoin mining operations across existing facilities. The company stated that mining operations continue supporting the broader transition toward contracted compute infrastructure. Consequently, management expects AI hosting revenue to increase further during the remainder of 2026.
The latest results highlighted a broader transformation across the crypto mining industry as firms pursue more stable revenue streams. AI infrastructure contracts now provide recurring income opportunities compared with unpredictable mining returns. Therefore, TeraWulf continues positioning itself as a large-scale compute infrastructure provider rather than a traditional Bitcoin miner.
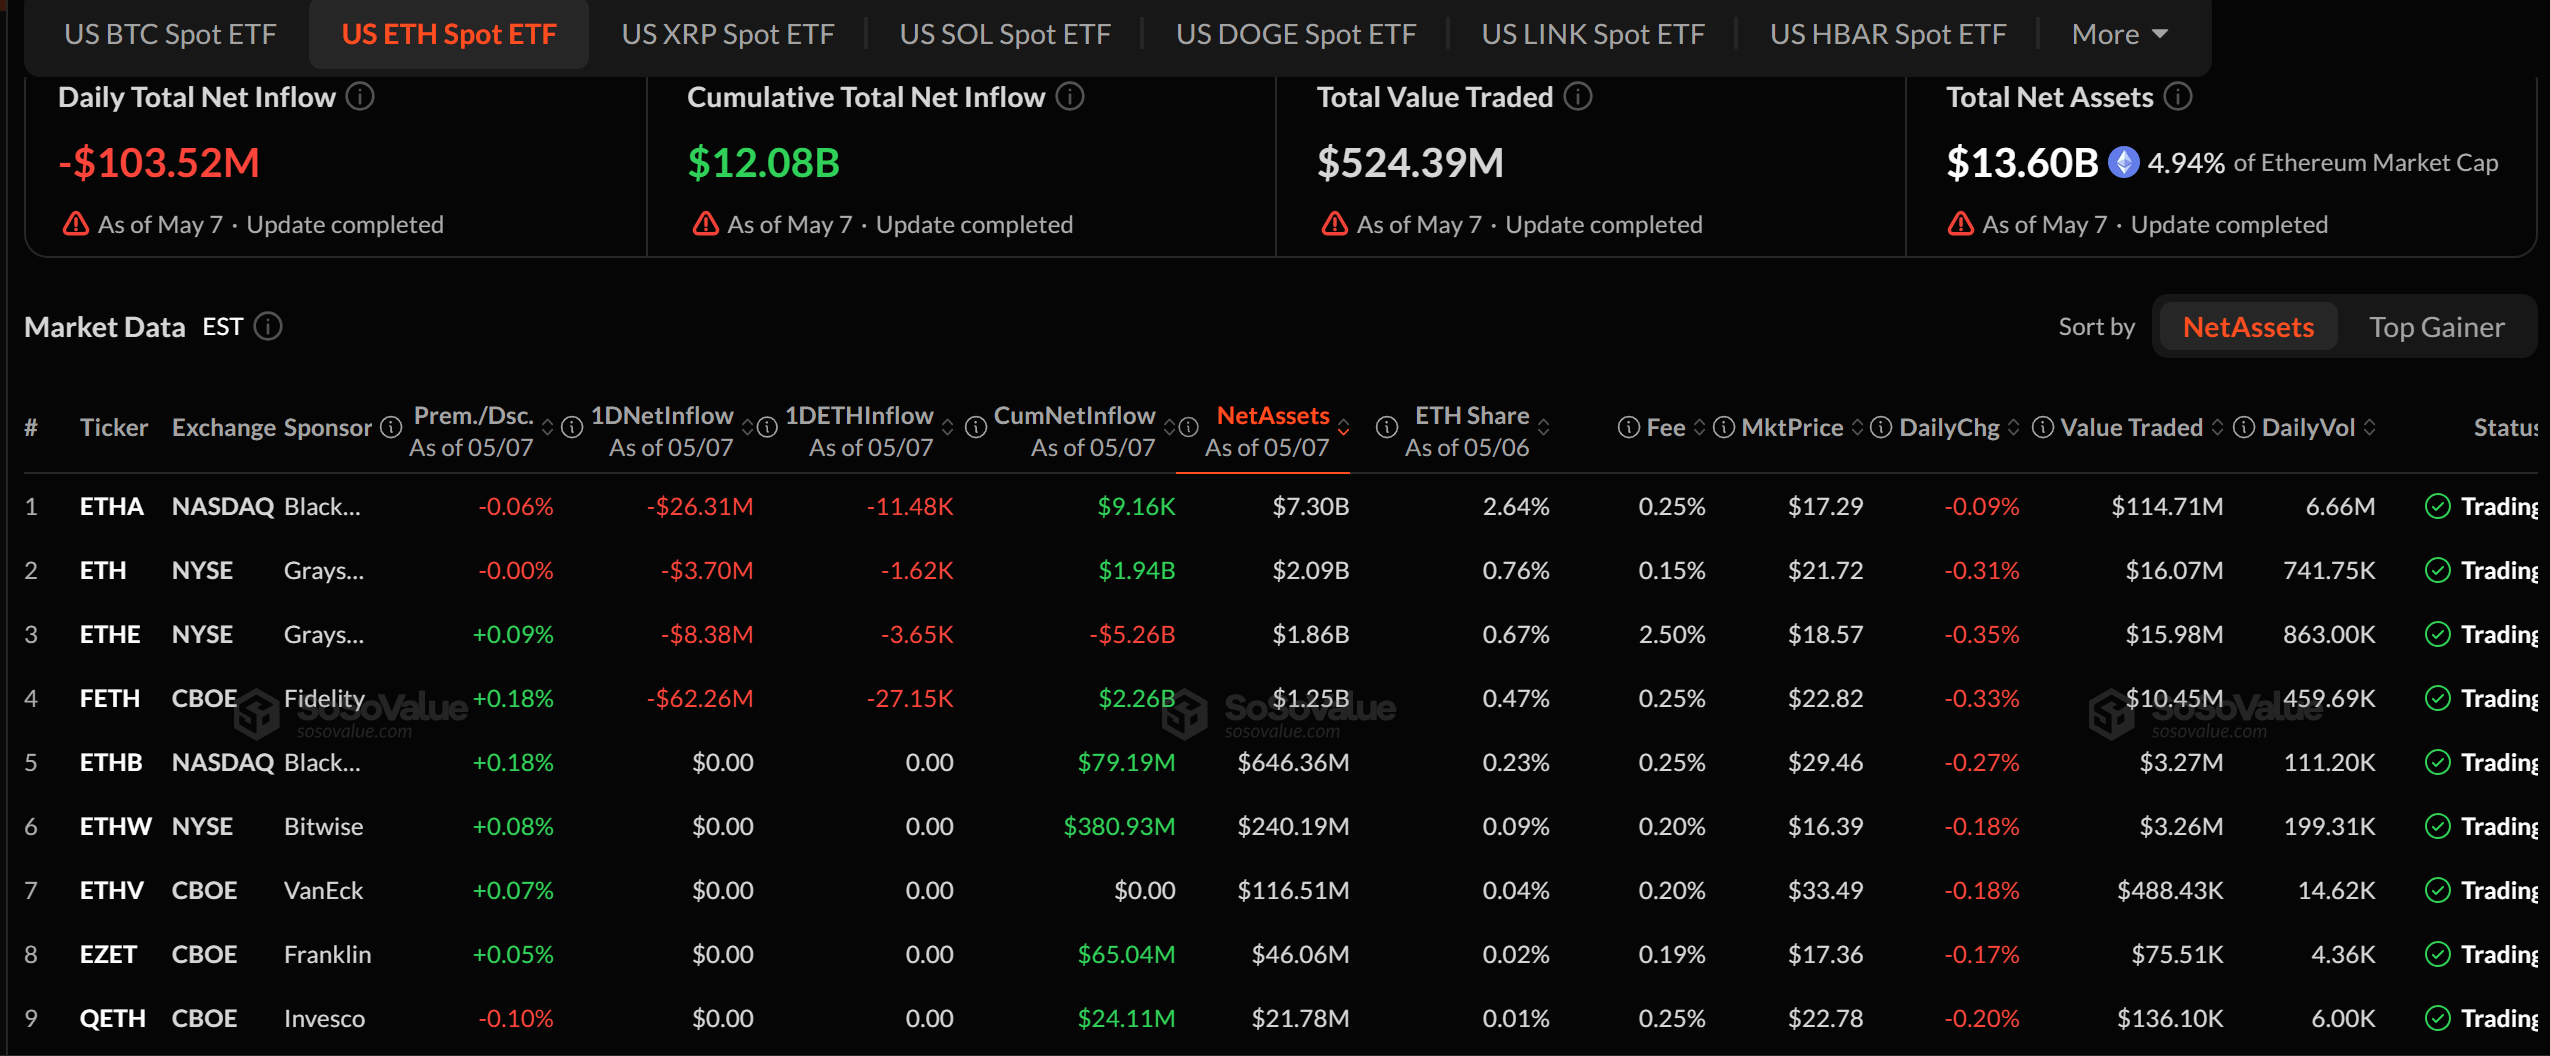
Ethereum whale Garrett Jin deposited $178 million worth of ETH into Binance on May 8. BlackRock and Fidelity also sent a combined 35,394 ETH to Coinbase Prime within hours.
The combined flow exceeded 113,000 ETH valued at nearly $260 million. The transfers hit exchange-linked platforms as US spot Ether exchange-traded funds (ETFs) absorbed $103.5 million in outflows the day before.
Garrett Jin Trims ETH Stack by Over 20%
The whale, tagged on-chain as #BitcoinOG1011, still holds 303,618 ETH worth roughly $692.5 million. The address also retains 9,343 bitcoin (BTC).
Jin moved 165,000 ETH to Binance two days earlier in a similar pattern. The former BitForex chief executive built his reputation on outsized directional bets.
His track record includes a $735 million BTC short placed before the October 2025 crash. The wallet has rotated between BTC and ETH multiple times in 2026.
Whether the latest deposit reflects spot selling, hedging, or portfolio rebalancing is not visible on-chain.
Spot ETF Issuers Add Operational Pressure
Elsewhere, BlackRock’s iShares Ethereum Trust sent 11,475 ETH worth $26.27 million to Coinbase Prime three hours before the whale move. Fidelity followed with 23,919 ETH worth $54.44 million within the next hour.
ETF deposits to Coinbase Prime do not always translate into spot sales. Issuers regularly use the platform for redemption baskets, custody shifts, and authorized participant flows tied to investor activity.
However, moving coins to exchanges may also signal intention to sell, in which case the moves by Gareth, BlackRock, and Fidelity could ultimately translate into selling.
Both moves coincide with $103.51 million in net outflows from US spot Ether ETFs on May 7. Fidelity’s FETH led with $62.26 million in redemptions, followed by BlackRock’s ETHA at $26.31 million.

ETH traded near $2,289 as of this writing. Traders will watch ETF flow updates and Binance order books for signs the deposits convert into visible spot-market selling.
The post Ethereum Price Braces For a Major $260 Million Shock appeared first on BeInCrypto.

According to Cointelegraph, Payward—the parent company of cryptocurrency exchange Kraken—has filed an application with the U.S. Office of the Comptroller of the Currency (OCC) for a national trust company charter. If approved, Payward National Trust Company would provide fiduciary custody and related services primarily for digital assets, marking a notable milestone in the push to embed crypto custody within federally supervised banking infrastructure. The filing comes as the OCC has already granted similar national trust charters to Coinbase, Ripple Labs, BitGo, Circle, Fidelity Digital Assets and Paxos, signaling a regulatory tendency toward formalized custody oversight for digital assets.
In its disclosure, Payward indicated that the OCC charter would build on the firm’s existing Wyoming Special Purpose Depository Institution (SPDI) framework established through Kraken Financial, as well as its Federal Reserve master account that enables access to the U.S. payment system. The national trust charter would, if approved, expand Payward’s ability to offer fiduciary custody and related services on a national scale, aligning Kraken’s custody offering with other federally regulated financial services providers.
“A national trust company provides the certainty institutions require and establishes the infrastructure to build the next generation of custody,” Kraken co-CEO Arjun Sethi said. “This is not about being first; it is about getting the framework right so markets can scale with clarity, interoperability, and long-term vision for what clients will demand as these systems mature.”
The OCC—led by Jonathan Gould, the regulator appointed under the Trump administration—approved similar charter applications for Ripple Labs, BitGo, Circle, Fidelity Digital Assets and Paxos in December. The agency’s approvals have generated scrutiny as it weighs other applications, including World Liberty Financial, a crypto-focused firm co-founded by former President Donald Trump and his sons, highlighting ongoing regulatory vigilance over the pace and direction of federally chartered crypto custody.
Payward states that the OCC application would complement its Wyoming SPDI framework and Federal Reserve account by enabling a nationwide fiduciary custody service for digital assets. The company has described the combination as strengthening the infrastructure institutions require to custody digital assets with formal supervisory oversight and interoperability within the regulated payments system.
Kraken’s broader regulatory and market-building agenda
Beyond custody, Kraken’s corporate trajectory includes strategic acquisitions and a potential public listing. Payward has recently completed deals and announced plans that would expand the firm’s footprint in the U.S. derivatives and broader crypto services markets. Kraken’s leadership has signaled a pathway toward a U.S. initial public offering, with co-CEO Sethi stating in May that the company was “about 80% ready” to go public by 2027, alongside reinforcing partnerships designed to broaden customer access to on- and off-ramp services.
From a regulatory perspective, the national trust charter question sits at the nexus of custody governance, anti-money laundering (AML) and know-your-customer (KYC) controls, and integration with traditional banking rails. A federally chartered custodian would be subject to OCC oversight, capital adequacy standards, internal control requirements, and ongoing supervisory examinations. For institutional clients—including banks, asset managers, and other custodians—the availability of a federally chartered digital-asset custodian could influence risk management frameworks, vendor due diligence, and licensing strategies across state and federal lines.
Regulatory context and implications for market structure
The OCC’s recent actions reflect a broader trend toward formalizing the custody and settlement infrastructure for digital assets within the U.S. financial system. As crypto custody transitions from purely private arrangements to regulated custodial services, institutions acquire clearer protection mechanisms, standardized compliance expectations, and more transparent risk governance. This evolution interacts with other U.S. regulators and policy discussions, including potential alignment with national standards for AML/KYC, licensing regimes for crypto businesses, and the ongoing development of a coherent cross-border regulatory regime that differentiates U.S. rules from European frameworks like MiCA.
The landscape remains nuanced. While federally chartered status can confer perimeters of regulatory certainty, it also entails intensified supervisory scrutiny, potential capital and liquidity requirements, and the need to maintain robust internal controls and cyber risk defenses. The attention directed at World Liberty Financial demonstrates that the OCC’s chartering decisions continue to draw public and congressional interest, underscoring the importance of rigorous, well-documented risk management and compliance programs for applicants and counterparties alike.
For exchanges, banks, and institutional investors, the emergence of federally chartered crypto custodians could affect counterparty selection, settlement reliability, and the interoperability of crypto services with traditional financial rails. Institutions may increasingly favor counterparties that can demonstrate formal oversight, standardized custody practices, and robust operational resilience—areas where a national trust charter would be designed to provide assurance.
In the near term, the regulatory process remains select and iterative. Applicants face not only the completion of technical and governance reviews but also the need to satisfy evolving supervisory expectations on custody protections, data security, and risk management. If Payward’s OCC application progresses to approval, Kraken would join a small but growing cadre of federally supervised custody providers, potentially shaping both product design and regulatory dialogues across the crypto sector.
Looking ahead, observers will monitor the OCC’s decision timeline, the outcome of any competing applications, and how federal custody charters influence the broader policy conversation on crypto banking, custody standards, and the integration of digital assets into mainstream financial markets. The evolution of this framework will have tangible implications for crypto firms’ licensing strategies, AML/KYC compliance programs, and the likelihood of further consolidation around well-regulated custody solutions.
Copyright 2026 Cointelegraph. This reporting aligns with ongoing regulatory and policy developments and aims to inform compliance, legal, and institutional analysis. Readers are encouraged to review official regulatory filings and statements for precise legal interpretation.

10 Things You Must Know About Canvas Hack Impacting Thousands of Schools Nationwide
Ripple (XRP) Joins an Exclusive Club Next to SpaceX, OpenAI: Details Inside

Jaylan Banks Reacts After Simon Guobadia Calls Out Falynn Pina
Manchester United reach agreement with Casemiro over contract clause amid transfer speculation

US brings back mandatory military draft registration

Steven Gerrard disagrees with Gary Neville over ‘shock’ Chelsea and Arsenal claim | Football

#trendingshorts #finance #youtube #viral #shorts #RutujaFinanceHub#job #youtubeshorts#fyp#trending

XRP PRICE PUSHING HIGHER! – BRAD DROPS BOMBS AT CONSENSUS! – XRP BOTTOM IN OR SUB $1 POSSIBLE?

FINALLY IT’S OVER !! Latest Crypto Market News Today & BTC – ETH Analysis
-
 Crypto World14 hours ago
HarrisX Poll Found 52% of Registered Voters Support the CLARITY Act
-

 NewsBeat5 days ago
Channel 5 – All Creatures Great and Small series 7 new post
-

 Crypto World2 days ago
Upbit adds B3 Korean won pair as Base token gains Korea access
-

 Tech4 days ago
Image AI models now drive app growth, beating chatbot upgrades
-
 NewsBeat2 days ago
NCP car park operator enters administration putting 340 UK sites at risk of closure
-

 Entertainment7 days ago
Kylie Jenner Hit With Second Lawsuit From Ex-Housekeeper
-

 Sports7 days ago
Cavaliers vs. Raptors Game 6 live score, updates, highlights from 2026 NBA playoffs first-round series
-

 Entertainment7 days ago
Young and the Restless Next Week: Cane Arrested & Matt’s Deadly New Scheme!
-
Entertainment6 days ago
New Netflix Movies in May 2026 — My Top 3 Picks to Stream
-

 Entertainment6 days ago
Melissa Joan Hart and More Stars Attend 2026 Kentucky Derby
-
 Sports7 days ago
David Benavidez responds to team Canelo saying the fight will never happen
-
 Sports7 days ago
IPL 2026: ‘Love you darling’- Hardik Pandya’s reaction to MS Dhoni steals the show |Watch | Cricket News
-

 Sports6 days ago
Five killed in Texas plane crash identified as Amarillo pickleball players
-
Entertainment6 days ago
Anna Nicole Smith’s Daughter Attends 2026 Kentucky Derby
-

 Crypto World6 days ago
Bitcoin mining equities rise in 2026 as BTC lags behind
-
Crypto World6 days ago
Pi Network Mandates Protocol 23 Upgrade for All Mainnet Nodes Before May 15 Deadline
-

 Business6 days ago
Luka Doncic Injury Update: Doncic’s Hamstring Recovery Slows Lakers’ Hopes Against Thunder: Can He Run Yet?
-

 Business7 days ago
Can Victor Wembanyama Bring the NBA Ring to Spurs in 2026? Historic Playoff Run Fuels Title Dreams
-

 Sports7 days ago
Plane crash in Wimberley, Texas kills 5 pickleball players at tournament
-
Entertainment6 days ago
Venus Williams’ Best Met Gala Looks Over the Years
You must be logged in to post a comment Login