
Crypto World
Retail FUD Sentiment Rises as Bitcoin Falls Below $70,000: What Are The Implications?
After a brief improvement in sentiment, fear has returned to the crypto market and continues to dominate social discussions. Bitcoin has dropped back below $70,000, raising concerns among retail investors.
Although negative sentiment is spreading across social media, on-chain data paints a more complex picture of retail investors’ actual role.
Retail FUD Sentiment Surges. Will Bitcoin Recover?
Blockchain analytics platform Santiment recently recorded a spike in negative Bitcoin-related keywords on social media.
Terms such as “dip” and “crash” appear frequently in BTC discussions. This reflects a significantly elevated level of FUD (Fear, Uncertainty, Doubt) among retail investors.
Santiment notes that extreme pessimism among retail investors often serves as a contrarian signal. When negativity becomes overwhelming, the market tends to recover as selling pressure nears exhaustion.
“Words like #dip, #pullback, #rejection, #crash, or #bloodbath, it’s usually a safe time to BUY,” Santiment stated.
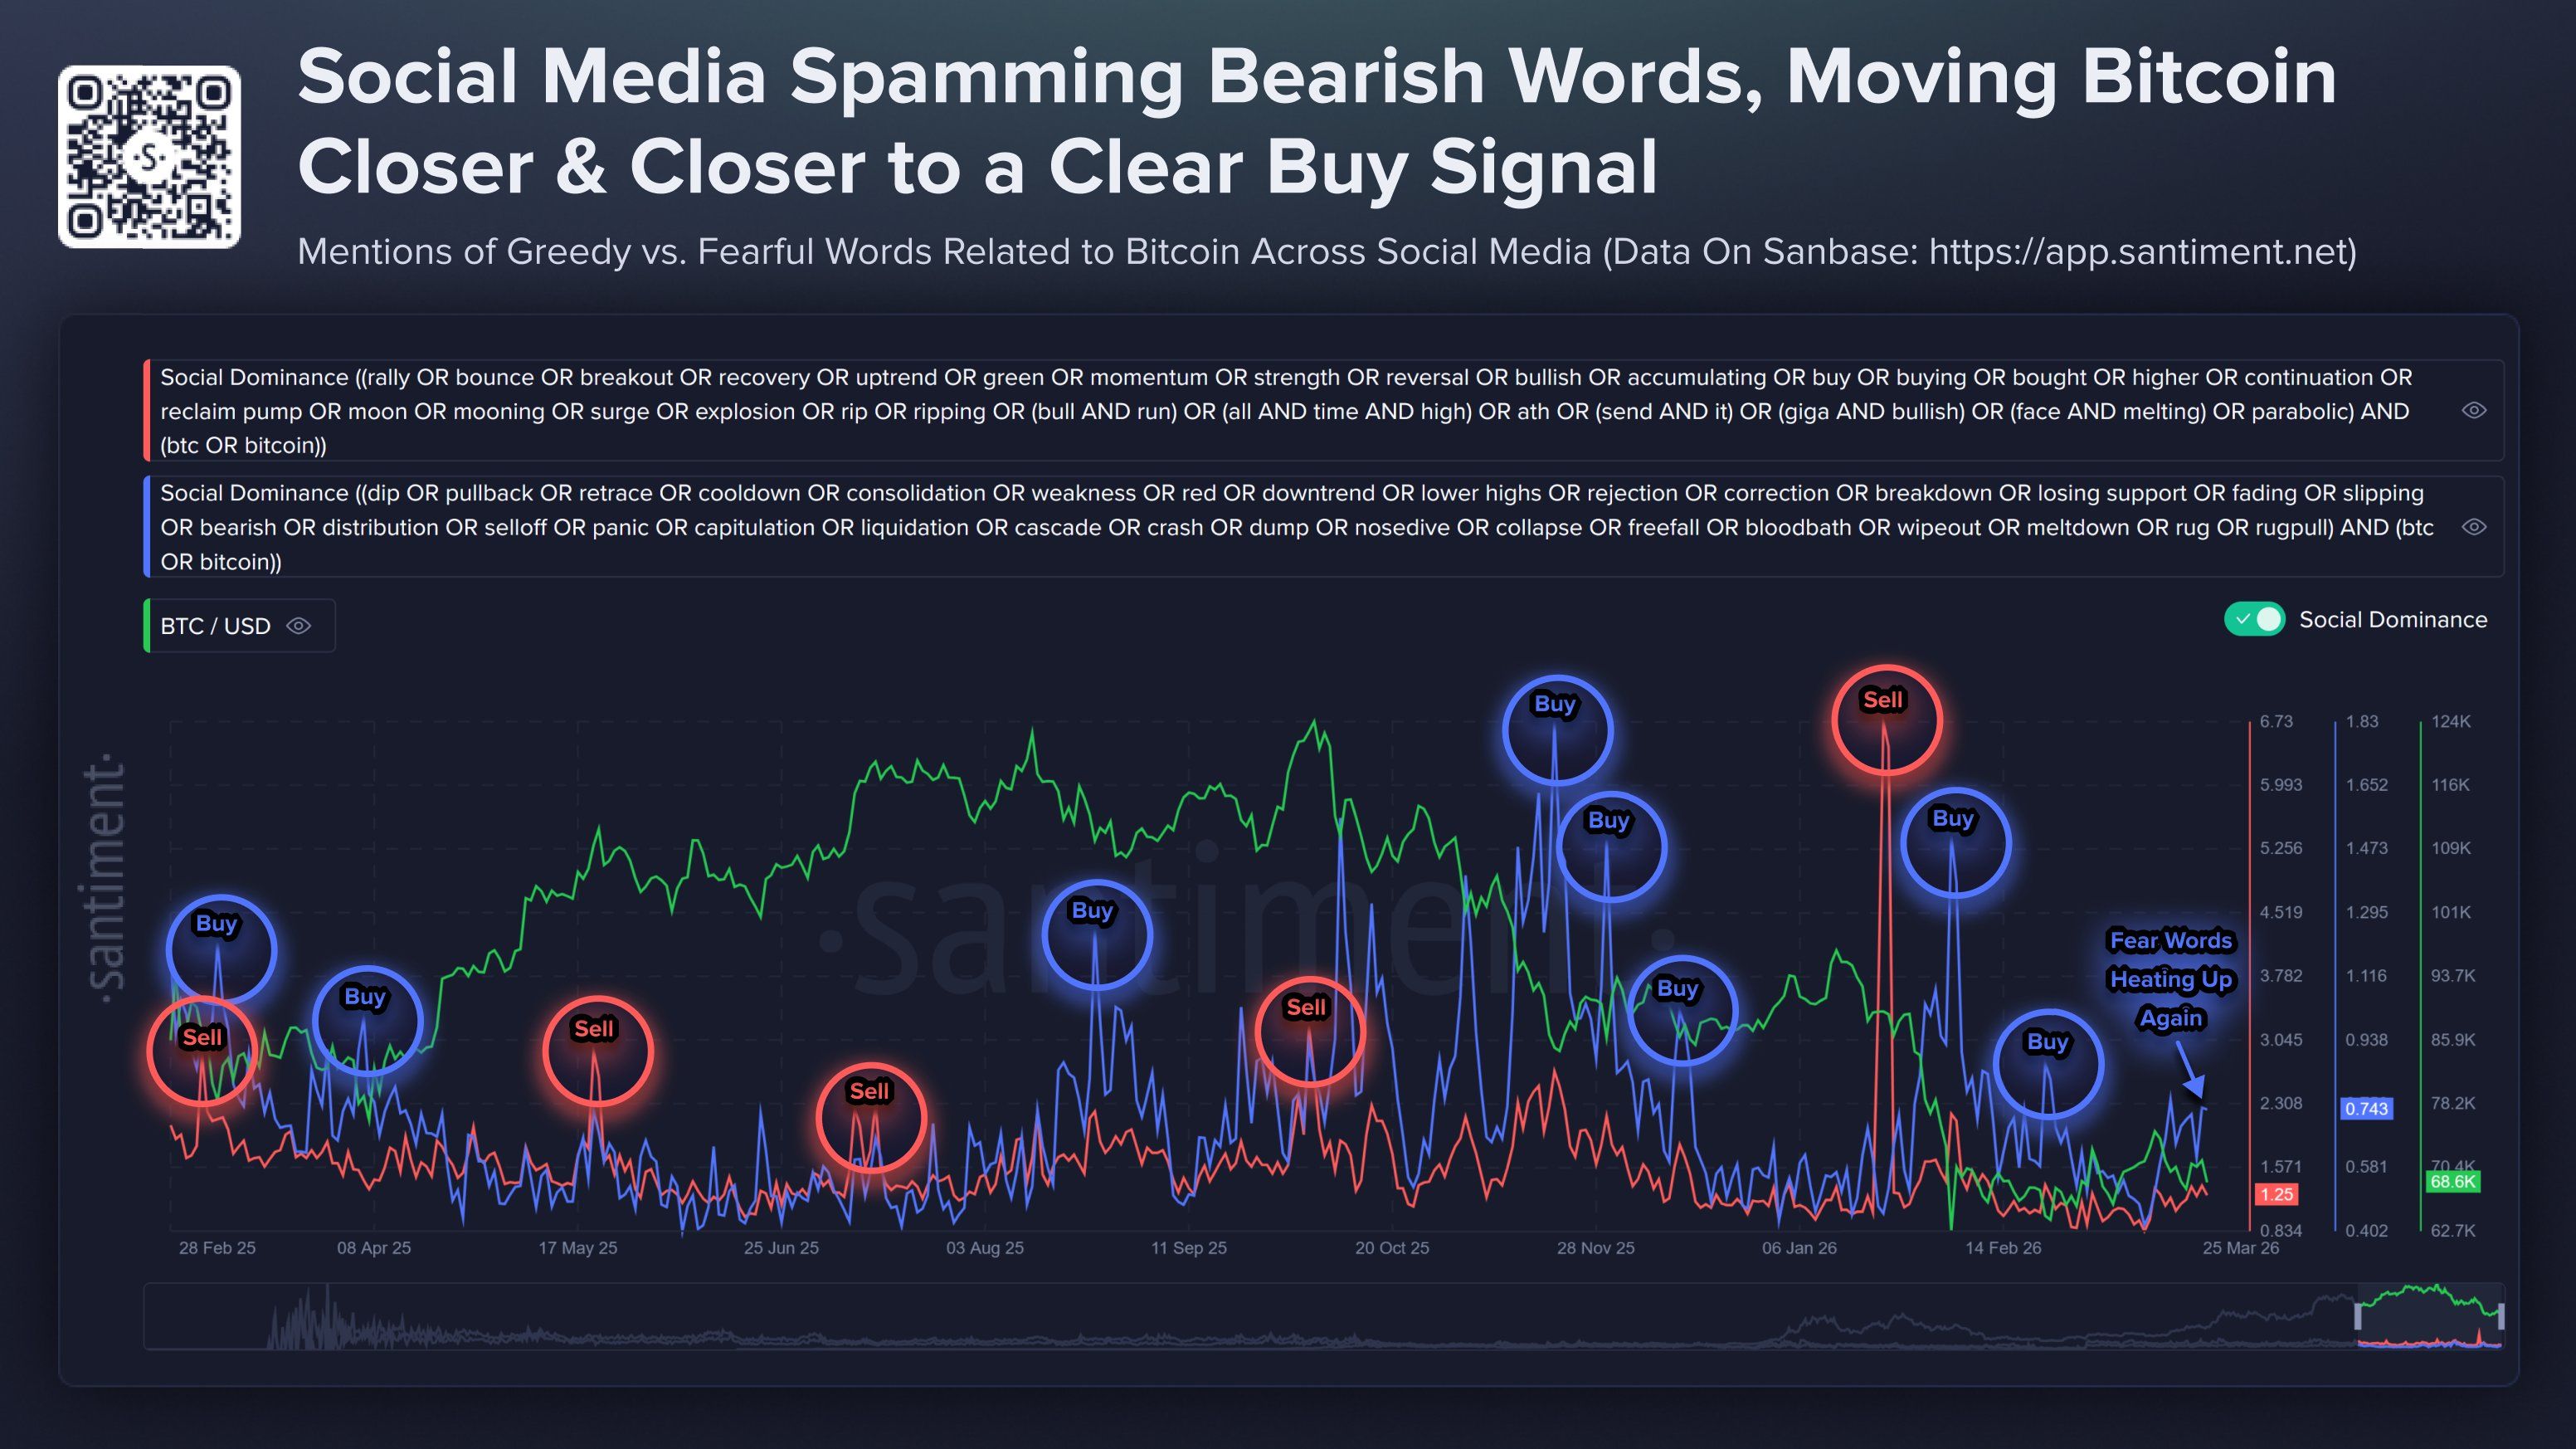
Santiment’s chart illustrates this logic over the past year.
However, the picture goes beyond sentiment alone. A report from CryptoQuant reveals a concerning divergence between trading volume and the actual market share of retail investors.
Zizcrypto, an analyst at CryptoQuant, reported that the 30-day average small trade volume (0–$1,000) from retail stands at $96 million. This level aligns with the market bottom in early 2023.
Meanwhile, retail trading share (0–$10,000) has steadily declined since early 2023. It has dropped from over 2.4% to ~0.7% and has now stabilized.
The divergence between trading volume and market share suggests that retail investors remain active, but their structural role in the market is no longer expanding.
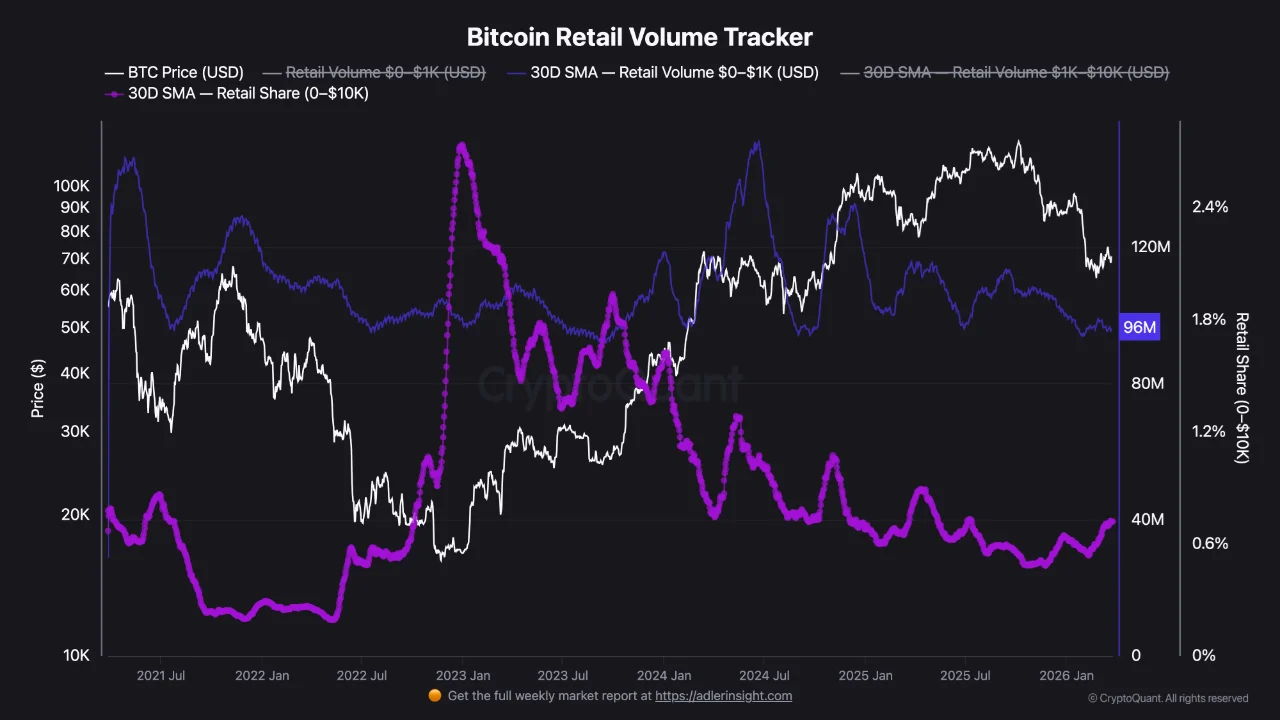
“In this context, retail participation is primarily concentrated in short-term reactive flows rather than sustained engagement,” Zizcrypto stated.
Therefore, Santiment’s view may hold in the short term. However, it is difficult to use it as a basis for predicting a reversal similar to early 2023.
The latest analysis from BeInCrypto indicates that if Bitcoin closes a daily candle below $68,930, the price could continue to decline toward $65,550.
The post Retail FUD Sentiment Rises as Bitcoin Falls Below $70,000: What Are The Implications? appeared first on BeInCrypto.

Bitcoin (BTC) dropped toward $67,000 during the European trading session on Friday despite an increase in long-term buying. Exchange withdrawals also increased to 16-month highs, suggesting reduced “immediate selling pressure,” a new analysis said.
Key takeaways:
-
Bitcoin withdrawals from exchanges increases, reducing BTC available for sale.
-
Long-term holders accelerate accumulation, adding 155,450 BTC over the past 30 days.
-
Bitcoin analysts view $65,000–$66,000 as a potential support zone for a bounce.
Bitcoin supply tightens as long-term buying accelerates
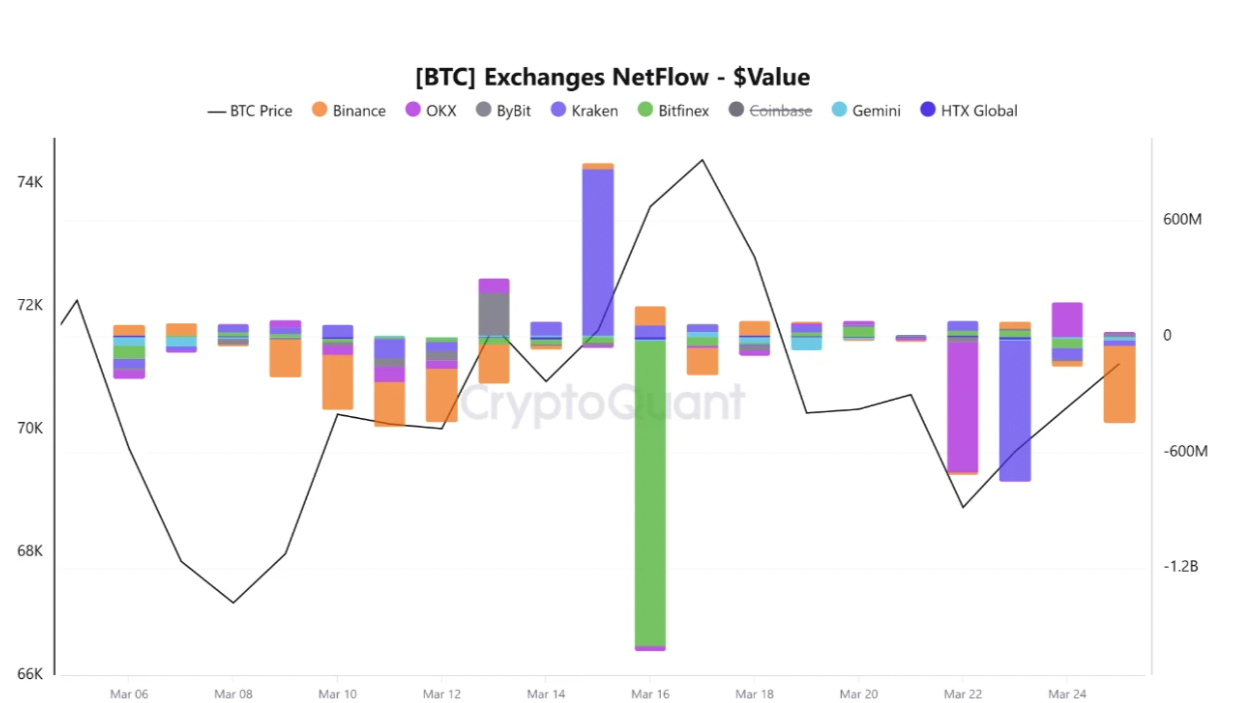
CryptoQuant’s exchange flow data highlighted “renewed signs of supply tightening,” as large Bitcoin withdrawals continue across major exchanges.
The chart below shows that investors withdrew nearly $1.6 billion of BTC from Bitfinex on March 16, as shown by the orange bar in the chart below.
Related: Bitcoin floor ‘near $70K’ as TradFi returns: Will war, inflation break their belief?
Since then, the trend has expanded across other major exchanges, with a $678 million withdrawal from OKX on Sunday, a $728 million withdrawal from Kraken on Monday, and another $400 million in BTC leaving Binance on Wednesday.
“This pattern suggests that the latest wave of withdrawals is no longer isolated to one platform,” CryptoQuant analyst Amr Taha said in his latest QuickTake analysis.

The figures support the latest data showing Bitcoin whales and sharks have been accumulating over the last two months, a pattern that could trigger an eventual breakout from the range.
Other data also reflects an accumulation phase, as long-term holders (LTHs), investors who have held Bitcoin for more than 155 days, ramped up buying.
The LTH net position change has been positive since March 5, as about 155,450 BTC has been bought over the past 30 days.
In other words, holders are buying more on the dips, including the latest one below $68,000.

When Bitcoin leaves exchanges while LTHs expand their positions, it “usually signals lower immediate sell pressure and stronger conviction from investors with a longer time horizon,” Amr Taha said.
If this trend continues, the market could be entering another phase where tightening sell-side liquidity and stronger LTH demand “create a more supportive backdrop for price,” the analyst added.
Bitcoin price to revisit $65,000 before bounce
As Cointelegraph reported, $70,000 remains the key for the Bitcoin bulls and that losing it could trigger the next leg down.
The BTC/USD pair was trading below $67,000 at the time of writing, below the 50-day simple moving average (SMA) and the 200-week exponential moving average (EMA).
Bears will attempt to push the price toward the $65,000-$63,300 demand zone, with a deeper focus on the range low below $60,000, reached on Feb. 6.

“It’s quite clear that there’s not enough strength for the markets to move higher after that rejection at $75K,” MN Capital founder Michael van de Poppe said in a recent X post.
An accompanying chart suggested that the price was seeking to print a higher low within the $65,000 to $66,000 range, failing which “we’ll start to see an acceleration downwards,” van de Poppe said, adding:
“I would be looking at longs in the lower-$60K range.”

The Glassnode liquidity heatmap highlighted “stronger” whale bid orders near $65,000, suggesting that the BTC price could retest this area before a bounce.

As Cointelegraph reported, a break and close below the ascending trend line at $68,000 could result in Bitcoin price dropping toward $60,000, where it could consolidate next.
This article does not contain investment advice or recommendations. Every investment and trading move involves risk, and readers should conduct their own research when making a decision. While we strive to provide accurate and timely information, Cointelegraph does not guarantee the accuracy, completeness, or reliability of any information in this article. This article may contain forward-looking statements that are subject to risks and uncertainties. Cointelegraph will not be liable for any loss or damage arising from your reliance on this information.

Key Takeaways
- On Friday, Hedgeye initiated a short position on AppLovin (APP), projecting a 30% downward move.
- Andrew Freedman from Hedgeye contends that MAX, the mediation platform, represents APP’s true advantage—not its AXON AI technology.
- MAX dominates more than 60% of worldwide mobile gaming ad impressions, providing critical data that powers AXON’s capabilities.
- In markets beyond gaming where MAX lacks mediation control, AXON’s performance shows significant variability.
- The firm characterizes APP as an “infrastructure monopoly” that faces mounting competitive threats while generating unsustainable margins.
AppLovin (APP) shares declined 1% Friday following Hedgeye’s announcement of a new short position on the stock, with the research firm projecting as much as 30% downside from present price levels.
Andrew Freedman, an analyst at Hedgeye, released the bearish thesis, challenging the prevailing market narrative surrounding the company’s valuation.
Freedman’s central contention is that market participants have fundamentally misunderstood AppLovin’s business model. Rather than being an artificial intelligence powerhouse as many believe, Hedgeye argues the company’s real strength originates from a different source.
“The primary competitive advantage for AppLovin isn’t AXON, its machine learning technology,” Freedman stated. “Rather, it’s MAX, the mediation infrastructure commanding more than 60% of global mobile gaming ad impressions.”
MAX functions as AppLovin’s advertising mediation infrastructure. Positioned between game developers and advertising buyers, it orchestrates the bidding mechanism for ad inventory within mobile gaming applications.
Given MAX’s commanding position in mobile gaming ad auctions, it accumulates an extensive repository of exclusive bidding intelligence. This proprietary data stream, according to Freedman, is the critical ingredient enabling AXON’s predictive accuracy.
“AXON’s effectiveness diminishes substantially without access to MAX’s data,” the analyst noted.
Performance Challenges Beyond Gaming Territory
The analysis spotlights a significant vulnerability in AppLovin’s diversification strategy. Beyond mobile gaming boundaries, MAX doesn’t maintain mediation dominance—creating a substantially different competitive landscape.
In these alternative sectors, AXON must function without the comprehensive data infrastructure it leverages within gaming environments. Freedman’s research indicates performance outcomes vary considerably under these conditions.
This observation carries weight because AppLovin has aggressively pursued expansion into e-commerce and additional non-gaming categories. Should AXON prove unable to duplicate its gaming success in other verticals, the company’s expansion narrative faces serious challenges.
Current short interest in AppLovin stands at merely 4.5%, indicating the broader market maintains a predominantly optimistic outlook.
Valuation Concerns From Hedgeye
Freedman characterized AppLovin as representing “an infrastructure monopoly narrative”—though his tone was decidedly cautionary.
According to Hedgeye’s assessment, this monopolistic position faces increasing competitive pressure, while the company currently benefits from profit margins that exceed sustainable levels. This suggests the differential between AppLovin’s present earnings and long-term capability may be larger than market participants recognize.
While Hedgeye hasn’t published a precise price objective corresponding to its 30% downside forecast, the analysis implies substantial repricing risk should investors reconsider the AI-related valuation premium.
APP shares have surged 48% during the trailing twelve months, adding substantial market capitalization throughout this period.
Friday’s modest 1% pullback appears relatively insignificant against the backdrop of that extended rally, though Hedgeye’s detailed critique introduces a noteworthy contrarian perspective to what has predominantly been an analyst community expressing bullish sentiment.
With short interest remaining at 4.5%, there isn’t yet substantial positioning against AppLovin—however, Hedgeye has now established one of the most thoroughly articulated bearish arguments on the stock to emerge publicly.

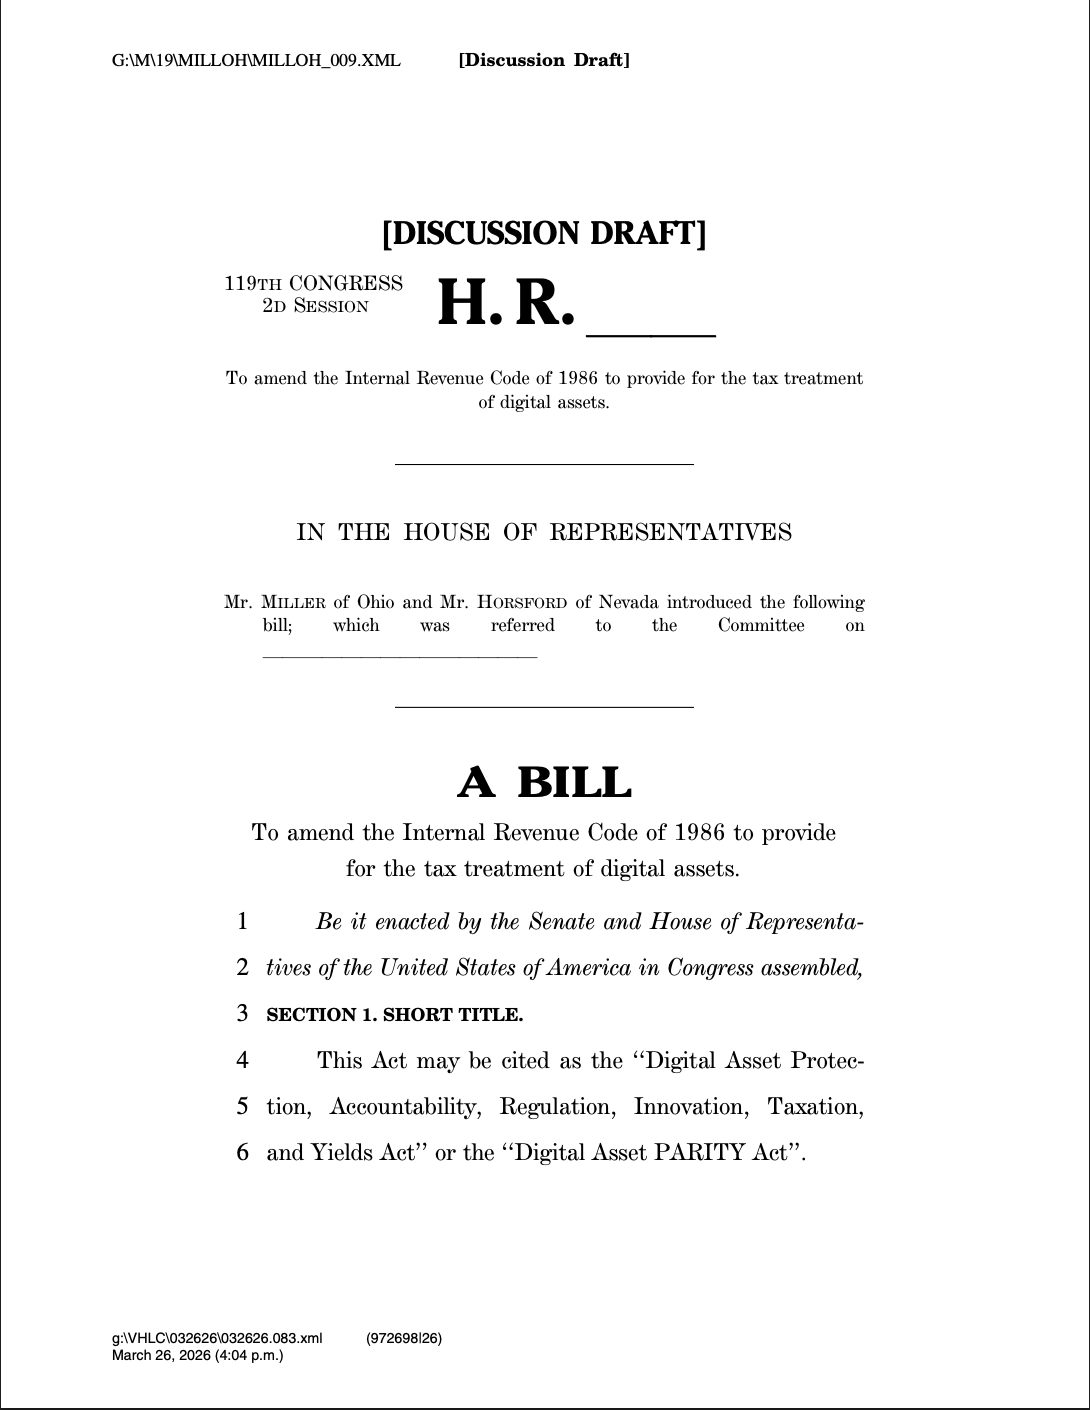
US Representatives Max Miller and Steven Horsford published a discussion draft bill on Thursday titled the ‘‘Digital Asset Protection, Accountability, Regulation, Innovation, Taxation, and Yields Act’’ or the ‘‘Digital Asset PARITY Act,” to overhaul the tax code for digital assets.
The Digital Asset PARITY Act seeks to overhaul the Internal Revenue Code of 1986 by adding provisions that would clarify the tax treatment of digital assets.
The legislation said that stablecoins are not subject to gains if the cost basis, or the amount paid by the investor, does not fluctuate by more than 1% of $1 or $0.01, according to the discussion draft.
Transaction costs incurred to acquire or move regulated dollar-pegged stablecoins cannot be counted toward an investor’s cost basis, according to the bill.

The bill also introduces a de minimis tax exemption for stablecoin transactions below $200, meaning that stablecoin transactions below the $200 threshold do not trigger tax or reporting requirements. A total annual exemption cap is yet to be determined.
Income from lending, staking or income earned through “passive” validator services is treated as part of the recipient’s gross income every year, and calculated using “fair market” value, the draft said.
The Digital Asset PARITY Act has not yet been introduced to Congress; it was published as a discussion draft to open up debate between lawmakers, stakeholders and the crypto industry about how to overhaul crypto tax policy in the US.

Related: Coinbase execs deny lobbying against Bitcoin de minimis tax exemption
Crypto tax proposal highlights schism in the crypto industry
“We need digital asset tax clarity or activity will never fully onshore,” Cody Carbone, the CEO of crypto advocacy organization Digital Chamber, said in response to the discussion draft.
However, Bitcoiners noted that the bill includes only a de minimis tax exemption for stablecoins, not Bitcoin (BTC), similar to pending legislation, including the CLARITY crypto market structure bill, which also lacks a BTC de minimis tax exemption.
“This is the wrong direction to go in,” Pierre Rochard, CEO of The Bitcoin Bond Company, a BTC financial product issuer, said about the draft.
“It’s Bitcoin that should have a de minimis tax exemption. Stablecoins are not decentralized, and they are not permissionless. They’re not real money; they’re just fiat,” he added.
Magazine: How crypto laws changed in 2025 — and how they’ll change in 2026

Key Highlights
- Google is providing construction financing for a massive Texas data center currently under lease to Anthropic
- Nexus Data Centers’ project exceeds $5 billion, with construction loans nearing completion within weeks
- The sprawling 2,800-acre complex will initially provide approximately 500 megawatts by Q4 2026, with plans to scale up to roughly 7.7 gigawatts
- Independent gas turbines connected to local pipelines will power operations, minimizing reliance on public utilities
- Google’s robust financial standing is anticipated to attract bank financing at more favorable terms
According to recent reports, Google is preparing to extend construction loans to Nexus Data Centers for their ambitious $5 billion-plus data center development in Texas, a facility that Anthropic has already secured through a lease agreement.
The Financial Times initially broke the story, referencing sources familiar with the arrangement.
Finalization of these loans is anticipated within the next several weeks. While Alphabet, Google’s parent entity, won’t directly construct the infrastructure, the company is serving as the financial underwriter. Its excellent creditworthiness is expected to facilitate additional banking partnerships with more competitive interest rates.
Multiple banking institutions are currently vying to finance the initial construction phase, with funding targeted for mid-2025.
The computing facility spans an impressive 2,800 acres and aims to provide roughly 500 megawatts of processing capacity by the conclusion of 2026. In the longer term, expansion plans envision the site reaching approximately 7.7 gigawatts — representing significant infrastructure for artificial intelligence computational requirements.
Earlier this month, Anthropic formalized its lease arrangement with Nexus Data Centers.
Energy Independence Through Direct Power Generation
The facility’s strategic positioning between multiple major natural gas pipelines represents deliberate planning. Nexus intends to operate independent gas turbines for power generation instead of drawing from regional electrical grids.
This configuration allows the operation to avoid expensive peak-hour electricity rates — an escalating challenge for facilities operating energy-intensive AI processing continuously.
Additionally, this approach provides enhanced energy supply autonomy, which has become increasingly critical for large-scale data infrastructure developments.
Expanding the Google-Anthropic Alliance
Google currently provides Anthropic with specially engineered TPU infrastructure through Google Cloud for training sophisticated language models.
This collaboration creates mutual advantages. Anthropic receives essential large-scale computing resources, while Google leverages the partnership to enhance its Vertex AI offerings.
By financing the Texas computing complex, Google elevates its role beyond cloud services provider to become a direct infrastructure financier.
Specific financial terms of the construction loan arrangement — including total amount and repayment conditions — remain undisclosed to the public.
Nexus Data Centers has declined to provide official commentary. Anthropic finalized its lease with Nexus in recent weeks, preceding the anticipated loan completion in the near future.

Ether edged below the $2,000 mark on Friday, signaling another potential leg lower for the leading smart contract token. Trading around $1,975, ETH slipped roughly 5% over the past 24 hours, according to TradingView data. The move came as traders weighed weak near-term demand against a backdrop of outflows from spot ETH funds and retreating exchange activity, raising the prospect of a deeper correction in the weeks ahead.
Market participants monitored liquidations and price structure for clues about how much further downside might be in store. Data from Coinglass showed more than $111 million in long Ethereum liquidations as the price pressed lower, underscoring how quickly leverage could unwind in a volatile move. The price action also followed a failure to clear resistance around $2,200 earlier in the week, a bottleneck that had capped any sustained recovery despite long-term bulls arguing for a fundamental case beyond price action.
Key takeaways
- ETH price has shown structural weakness, failing to sustain a move above the $2,000 psychological level and threatening a broader correction.
- Analysts see a risk of further downside toward the $1,750–$1,850 zone if buying interest remains tepid and key technical supports give way.
- Demand trends for ETH remain negative, reinforcing downside pressure even as macro uncertainty persists.
- Spot ETH ETFs and broader Ether-based ETPs have faced persistent outflows, signaling reduced institutional appetite in the near term.
Price action and near-term risk for ETH
After failing to beat back sellers near the $2,200 zone earlier in the week, Ether continued to drift lower, with the daily picture painting a softer short-term trajectory. The break below the critical $2,000 level is noted not only as a round-number psychological barrier but also as a test of longer-term momentum indicators. Analysts have pointed to the 50-day simple moving average near $2,000 as a potential fulcrum; a sustained breach could open the path toward the mid-$1,900s and then into the $1,850–$1,750 corridor that previously acted as a support band in more challenging cycles.
Onur, a trader who commented on social media this week, framed the situation as a tale of waning immediate demand despite constructive, long-horizon narratives. “ETH keeps pressing into the same resistance, but the story sits beneath price action. Even with strong long-term narratives, short-term demand still looks thin,” the analyst wrote, underscoring how a market capable of sustaining a rally requires more than macro optimism.
Another practitioner, CryptoWZRD, offered a bearish read, suggesting ETH could slide further toward the $1,800 area after a close below $2,200. Ted Pillows echoed the sentiment on social channels, calling the Friday move a sign of ongoing weakness and predicting continued downside pressure in the near term. A chart‑driven assessment associated with that view pointed to a potential pullback to the $1,800 level before any meaningful rebound materializes.
Taken together, the setup aligns with a view that a test of fresh demand could be required before ETH could mount a convincing bounce. A referenced analysis from Cointelegraph highlighted that a clean close below the 50-day moving average around $2,000 may pull ETH to the $1,900 zone, with a subsequent drift toward $1,850–$1,750 if selling accelerates. While such targets are not certainties, they reflect a structurally fragile near-term backdrop that traders will be watching in the weeks ahead.
Demand signals and the broader momentum picture
Beyond price, a gauge of demand known as Apparent Demand has shifted negative, reflecting a risk-off posture among market participants. Capriole Investments tracks this metric for Ethereum and reported that the indicator has been in negative territory since March 3, dipping to as low as −58,000 ETH on March 16. The current reading sits at roughly −23,475 ETH, illustrating a partial but not complete improvement from the precipitous declines seen earlier in the month. Negative Apparent Demand suggests that buyers have been less aggressive relative to sellers, a condition that can extend price weakness in the absence of a fundamental catalyst or liquidity-driven relief.
The demand backdrop is reinforced by spot ETH fund flows. Data tracked by SoSoValue shows seven consecutive days of net outflows from spot Ethereum exchange-traded products (ETPs), totaling about $391.8 million. In parallel, global Ether ETPs posted about $27.2 million in outflows last week. Taken together, these figures indicate sustained institutional and fund-level withdrawal of exposure to Ethereum, which can amplify selling pressure when markets navigate a risk-off environment or await clearer catalysts.
The combination of weak near-term demand signals and ongoing fund outflows fits a narrative where ETH could test lower support levels before any substantive rebalancing or accumulation resumes. While the long-term promise of Ethereum’s network and DeFi ecosystem remains, the immediate price psychology remains fragile as traders adjust their risk appetites in response to macro uncertainties.
Institutional flows, ETF dynamics, and what to watch next
From an investor flows perspective, the current pattern suggests an ongoing reassessment of ETH exposure among institutions and professional traders. The outflows from spot ETFs and broader ETPs imply that even as Ether’s network activity and development progress, the market is prioritizing capital preservation over new risk-taking in the current climate. In such environments, reported liquidity dynamics—such as the sizable long liquidations observed during Friday’s session—can dominate short-term price action, even when longer-term fundamentals remain intact.
Market participants should also weigh the interplay between ETH’s on-chain usage, derivatives dynamics, and macro developments. While ETF and ETP outflows can weigh on price, they can also precede periods of renewed interest if catalysts emerge—such as institutional staking activity, improved on-chain metrics, or regulatory clarity that fosters broader participation. Bitmine’s recent move to expand Ethereum staking infrastructure, noted in industry coverage this week, underscores a broader trend toward more institutional-grade exposure to ETH, even if the market’s near-term trajectory remains contested.
In the meantime, traders will likely focus on two anchor points: the psychological $2,000 level and the 50-day moving average around that same vicinity. A sustained dip below these levels could open a fresh wave of risk-off pressure, with the next visible supports in the $1,900 zone and the mid-to-lower $1,800s if selling accelerates. Conversely, any reversal would need to be accompanied by a pickup in demand signals, a cooling in liquidation pressure, and a renewed flow of funds into ETH-based vehicles.
For investors and builders, the unfolding dynamics spotlight a central tension: Ethereum’s technology roadmap and ecosystem benefits remain substantial, but market participation is sensitive to macro cues and fund-level risk tolerances. The current data suggest that near-term ETH price action will be driven more by liquidity and sentiment shifts than by a clear fundamental narrative. That could change quickly if liquidity returns, if staking and institutional products gather traction, or if macro conditions shift in ways that restore risk appetite for non-yielding crypto assets.
Looking ahead, observers should monitor whether demand indicators begin to recover alongside a stabilization in ETF and ETP flows. A sustained uptick in Apparent Demand or a halt to outflows could precede a more constructive price path, especially if price action begins to reflect a more convincing break above existing resistance and a rebuilding of spot and futures premium.
In the near term, however, caution remains warranted as the market tests key support levels and volatility remains elevated. The balance of risk continues to tilt toward further downside unless buyers step in decisively and the flow of institutional capital returns to ETH-focused vehicles.
Readers should keep an eye on evolving liquidity conditions, the pace of outflows or inflows into ETH ETPs, and any new developments in staking infrastructure or regulatory clarity that might tilt sentiment back toward accumulation.

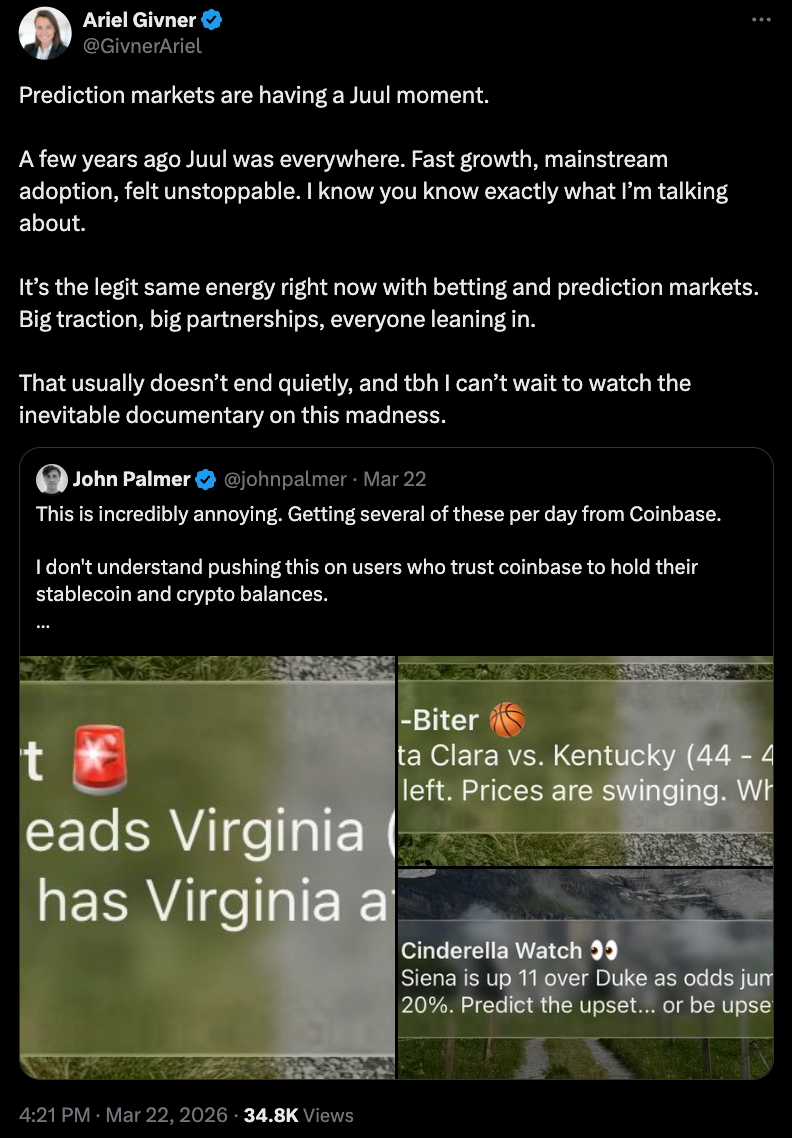
Coinbase rolled out prediction market bets for US-based users in January through a partnership with Kalshi, expanding the exchange’s product scope beyond traditional crypto trading. As March Madness unfolds, however, user feedback has highlighted a growing tension around how aggressively Coinbase is deploying event contracts and push notifications to drive engagement, with some describing the approach as akin to sports betting rather than crypto activity.
The rollout comes amid broader scrutiny of prediction markets in the United States, where regulators, lawmakers, and industry participants are navigating questions about jurisdiction, consumer protection, and potential misuse. Coinbase’s moves sit at the intersection of retail access to complex financial instruments and the evolving regulatory framework that governs how such markets should operate in the US.
Coinbase previously indicated that the Kalshi-backed service would bring a range of outcomes to the platform, from political events to sports results. In December, ahead of the public launch of its prediction market service, Coinbase filed lawsuits against regulators in Connecticut, Illinois and Michigan, arguing that the US Commodity Futures Trading Commission should have exclusive jurisdiction over its prediction markets rather than state gambling authorities. The company did not immediately respond to requests for comment on the user-reported experience during March Madness, as reported by Cointelegraph.
Key takeaways
- Coinbase’s January launch of Kalshi-backed prediction markets brought US users the ability to bet on event outcomes within the Coinbase app, bridging crypto trading with contract-based bets.
- During March Madness, some users reported an influx of push notifications urging bets on college basketball games, prompting criticism that the app is leaning toward sports gambling at a time of industry trust concerns.
- Regulatory tension surrounds prediction markets: state-level lawsuits against operators coexist with the CFTC’s push for exclusive jurisdiction over these markets.
- Legislative activity in Congress has considered curtailing use of prediction markets by politicians, amid concerns about insider information and potential conflicts of interest.
- Industry players are adopting safeguards: Kalshi bans political candidates from trading on election-related markets, while Polymarket has introduced measures to curb manipulation and insider trading.
Push notifications and the March Madness debate
Several users have voiced concerns about the frequency and framing of Coinbase’s market prompts during the March Madness window. A prominent example came from a poster on X who described receiving multiple basketball-related notifications within a single hour, arguing that Coinbase’s emphasis on sports betting reflects a broader shift toward monetizable gambling features on a platform many investors associate with crypto trading. The sentiment echoes a broader critique about trust erosion in the crypto industry and the perceived risk of platform strategies that monetize user engagement through gamified betting.
“I have received three separate notifications about College Basketball from Coinbase in the past hour alone. It is absurd that, amidst arguably the worst collapse in trust in this industry’s history, the largest American CEX has completely pivoted to trying to get their customer base hooked on sports gambling, so that they can extract even more exorbitant fees.”
Industry observers have pushed back with concerns about how such notifications might influence user behavior, especially given the sensitivity around responsible money management and the reliability of on-platform yield sources. John Palmer, co-founder of PartyDAO, voiced a closely related concern, pointing to broader questions about risk controls and the integrity of internal risk management as prediction markets push into mainstream app experiences.
These reactions occur against a backdrop of legal action and regulatory debates that complicate Coinbase’s product strategy. In December, Coinbase argued in court that the CFTC should regulate its prediction markets rather than state gambling authorities. The company’s stance mirrors a broader industry argument that federal-level oversight may provide a clearer, more consistent framework for prediction markets—but it has also drawn pushback from state regulators who view these markets as gambling activities with their own distinct consumer protections requirements.
Regulatory landscape and how it shapes the market
The regulatory environment for prediction markets in the United States is plural and evolving. Prediction market platforms have faced multiple lawsuits from state authorities, asserting various legal and regulatory oversight challenges. At the same time, the federal regulator, the U.S. Commodity Futures Trading Commission, has signaled a preference for exclusive jurisdiction over such markets, creating a jurisdictional dispute that complicates operations for platforms like Coinbase, Kalshi, and Polymarket.
The policy conversation has intensified as lawmakers consider proposals to limit or prohibit certain uses of prediction markets by public officials. Reports describe bills aimed at banning presidents or members of Congress from using these platforms, prompted in part by concerns about insider information and potential conflicts of interest. In response, Kalshi and Polymarket have taken steps to reduce risk: Kalshi announced it would ban political candidates from trading on election-related markets, while Polymarket introduced measures designed to limit manipulation and insider trading.
The headlines around regulation underscore a central tension: prediction markets could offer useful tools for forecasting and hedging, but they also raise concerns about market integrity, consumer protection, and access that policymakers are eager to address. The debate is not only about the legality of the markets themselves but about how they should be designed, who can participate, and what safeguards are necessary to prevent abuse or manipulation.
Industry safeguards, policy shifts, and what to watch next
Beyond high-level regulatory talk, the industry has begun layering practical safeguards into platform rules. Kalshi, for instance, has made an explicit policy choice to bar political candidates from participating in election-related markets, aiming to limit conflicts of interest and insider dynamics. Polymarket has rolled out updates intended to curb manipulation and insider trading, a move that some observers view as essential if prediction markets are to gain broader legitimacy among mainstream users and regulators alike.
For Coinbase, the strategy remains a test of how to merge traditional crypto trading narratives with newer, non-crypto product lines without eroding trust or prompting regulatory backlash. The company’s December lawsuits against state regulators, followed by January market rollout and ongoing user feedback, reflect a high-stakes balancing act: deliver value and diversification to users while navigating a maze of regulatory constraints that could redefine what constitutes a permissible service on a US platform. The tension between innovation and compliance will likely continue to shape both product design and public perception in the months ahead.
Investors, traders, and builders should monitor regulatory developments, particularly any moves by the CFTC or Congress that could standardize or constrain prediction markets in the near term. In parallel, observers will watch for how Coinbase and other operators adjust notification strategies, user onboarding, and risk disclosures to align with evolving expectations around responsible gaming, data privacy, and financial risk management.
The evolving landscape suggests that the next phase of prediction markets in the US will be defined less by a single breakthrough and more by a gradual harmonization of innovation with clear guardrails. Whether Coinbase’s approach will be seen as a model for responsibly integrating event contracts into mainstream financial apps or as a cautionary tale about flashy monetization remains contingent on regulatory clarity, user experience, and demonstrated safeguards against abuse.
Readers should keep an eye on potential policy updates, court decisions, and platform-level changes to betting and disclosure practices as the market seeks a stable path forward amid competing regulatory and commercial interests.
Negative reactions to cryptocurrency exchange Coinbase using its notifications to push bets on event contracts amid the March Madness basketball tournament range from “annoying” to “absurd.”
In January, Coinbase rolled out prediction market bets for US-based users as part of a partnership with Kalshi. However, for some users, the last two months have been seen as an opportunity for the exchange to get people “hooked on sports gambling” using an app that many had devoted to crypto trading.
“I have received three separate notifications about College Basketball from Coinbase in the past *hour* alone,” said X user AvgJoesCrypto on Thursday. “It is absurd that, amidst arguably the worst collapse in trust in this industry’s history, the largest American CEX has completely pivoted to trying to get their customer base hooked on sports gambling, so that they can extract even more exorbitant fees.”

Like sports event contract betting on platforms such as Kalshi and Polymarket, Coinbase Prediction Markets offers US-based users the chance to bet on the outcomes of a variety of events.
Prediction market platforms already face several lawsuits filed by state-level authorities, even as the federal regulator, the US Commodity Futures Trading Commission (CFTC), pushes for “exclusive jurisdiction” over the market.
John Palmer, co-founder of PartyDAO, expressed a similar sentiment over the Coinbase notifications, pushing bets on March Madness games:
“This is essentially encouraging me to gamble. What does that say about the internal philosophy around money management? Can I trust the yield sources on USDC interest, can I trust internal risk management, etc.”
In December, before the launch of its prediction market service, Coinbase filed lawsuits against regulators in Connecticut, Illinois and Michigan. The exchange argued, likely in anticipation of its prediction market launch, that the CFTC, not state-level gambling authorities, should regulate the platform.
Cointelegraph contacted Coinbase for comment on the user complaints, but had not received a response at the time of publication.
Related: Coinbase launches token-backed down payments for Fannie Mae loans
Congress seeks to ban politicians from using prediction markets amid insider information allegations
Amid user feedback and state-level lawsuits, many US lawmakers have also been calling for legislation to address issues in prediction markets. Allegations of someone in government using Polymarket to profit from a bet on the removal of Venezuelan President Nicolás Maduro have led to bills seeking to ban any US President or member of Congress from using the platforms.
Both Kalshi and Polymarket have introduced separate policies to curb insider trading. Kalshi said it would ban political candidates from trading on event contracts related to their campaigns, and Polymarket introduced measures to limit easily manipulated or ethically sensitive markets.
Magazine: Nobody knows if quantum secure cryptography will even work
Solana price just fell to $85, down 4% from the $89 area in a single session, and the $90 level that held as a prediction floor through much of Q1 has now flipped to hard resistance. What happens next depends on whether bulls can defend $80 before the chart pattern currently forming delivers its full verdict. Derivatives positioning data shows unusual imbalances that may be accelerating the move.
The March 26 decline extended a broader altcoin rout driven by macro risk-off sentiment, elevated rates, sticky inflation, and geopolitical friction all weighing simultaneously. Solana’s share of global on-chain transactions slipped to 44%, down from earlier peaks, raising questions about the quality of throughput given that validator votes, arbitrage bots, and automated systems inflate headline counts.
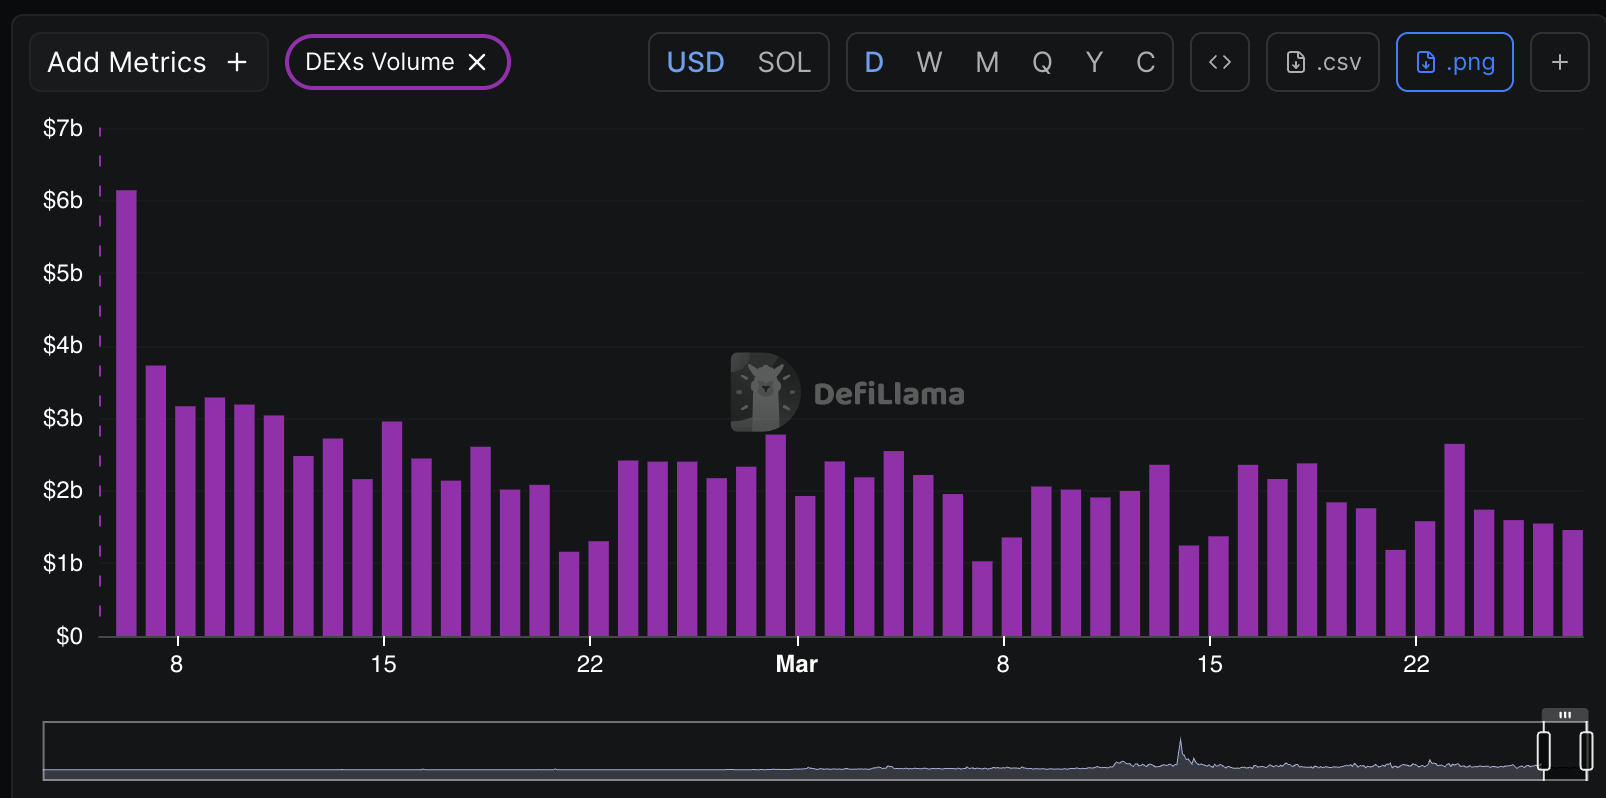
Weekly DEX volume on Solana has cratered, dropping by the day, so is its total value locked that sees 1.3% drop today.

Here’s our Solana price prediction:
Discover: The best pre-launch token sales
Solana Price Prediction: Can SOL Recover Before the Head-and-Shoulders Triggers?
SOL’s technicals are not pretty. The 14-day RSI reads a neutral 55.21, but short-term moving averages (10–30-day) still flash buy signals while the 50-day and 200-day MAs both signal sell, a classic split that signals indecision with a bearish lean. Only 24% of technical indicators currently point bullish, according to aggregated signal data.
Key levels define the battlefield. Immediate support clusters at $84 below that, $80 is the line bears need to crack to validate the head-and-shoulders pattern forming on the three-day chart, a setup that targets $59 on a confirmed breakdown. Resistance sits at $90–$92, with a meaningful recovery requiring a reclaim of $96.

The Alpenglow upgrade, targeting sub-second finality, remains the most credible near-term catalyst, with Q1 2026 mainnet timing potentially imminent. Whether it’s enough to shift sentiment in this macro environment is the question nobody can answer confidently right now.
Discover: The best crypto to diversify your portfolio with
Maxi Doge Targets Early Mover Upside as Solana Tests Key Levels
When a layer-1 blue chip trades 69% off its all-time high, and the dominant chart pattern targets a further 30% drawdown, some capital doesn’t wait; it rotates. Speculative flows have been extending into early-stage presales, where entry prices haven’t already been priced in years of hype. That dynamic is exactly where Maxi Doge ($MAXI) is positioned.
$MAXI is an Ethereum ERC-20 meme token built around a trading community identity—a 240-lb canine juggernaut embodying 1000x leverage mentality (the tagline is “Never skip leg-day, never skip a pump,” which is either brilliant or unhinged, possibly both).
The presale has more than $4.7 million at a current price of $0.000281. Features include holder-only trading competitions with leaderboard rewards, a Maxi Fund treasury for liquidity and partnerships, and huge 66% staking APY for early buyers. The meme-first marketing leans hard into viral gym-bro culture, a strategy that has worked for comparable projects when community momentum builds early.
This article is for informational purposes only and does not constitute financial advice. Crypto assets are highly volatile. Always do your own research before investing.
The post Solana Price Prediction: $90 Support Flipped to Resistance as Volume Drops appeared first on Cryptonews.

When one of the world’s largest card networks pays a significant premium over a company’s last valuation to acquire it, that is worth paying attention to. When the company in question builds stablecoin settlement infrastructure, it tells you something fundamental about where the payments industry believes it needs to be – and how urgently it needs to get there.
Mastercard had options. It could have partnered with BVNK. It could have taken a minority stake. It could have acquired a smaller stablecoin infrastructure player for a fraction of the price. Instead, it paid $1.8 billion – more than double BVNK’s $750 million Series B valuation from just over a year ago – for a company that has spent years doing the unglamorous work of building enterprise–grade stablecoin rails across 130 jurisdictions.
That number tells you more about where Mastercard sees payments heading than any strategy deck or earnings call ever could. And it eclipses Stripe’s $1.1 billion acquisition of Bridge, making it the largest stablecoin infrastructure deal in history.
More than $190 trillion moves cross–border annually through correspondent banking rails designed half a century ago. Those rails still function – in the same way a fax machine still functions. They carry the money, eventually, but they do so through layers of intermediaries that add cost, delay and opacity at every step. Mastercard has clearly concluded that patching this system is no longer a viable strategy. The question worth asking is why they reached that conclusion now, and what it means for the rest of the industry.
Compliance was worth the premium
Mastercard has no shortage of engineering talent. It could build a stablecoin settlement layer from scratch – and it would probably be a good one. So why pay a 140% premium for someone else’s?
Because the technology was never the hard part. BVNK’s value lies in its multi-jurisdictional licensing framework – painstakingly assembled over years of regulatory engagement across more than 130 countries. Walking into that many regulators’ offices and emerging with approval takes the kind of time that a card network competing for the future of settlement simply does not have. In payments, the compliance framework is the product. Everything else can be rebuilt.
This is what separates the companies that legacy finance acquires from the ones it ignores. The firms that treated licensing as a core investment – not an afterthought – are now the ones commanding billion-dollar valuations. Mastercard did not pay for BVNK’s code. It paid for the years it would have lost trying to replicate BVNK’s regulatory footprint. That distinction matters because it tells you exactly what the next acquirer in this space will be looking for, too.
The emerging market dividend
Most coverage of this acquisition will focus on what it means for Western payments modernisation. But the more consequential implications are in the corridors where BVNK’s infrastructure will matter most – and where Mastercard’s distribution can do the most good.
Remittance fees still average six to eight per cent in corridors serving Africa and Southeast Asia. A worker in Dubai sending $500 home to the Philippines loses $30 to $40 per transfer to intermediaries. Across the $685 billion in remittances flowing to low- and middle-income countries each year, that represents an extraordinary transfer of value away from the people who can least afford it.
This is precisely where stablecoin–native settlement changes the equation. The underlying rails do not require the chain of correspondent banks that traditional cross-border payments demand. Strip out those intermediaries and flat fees of one to two per cent become structurally possible – not as a promotional offer, but as a reflection of what settlement actually costs when the plumbing is modern.
Mastercard now owns that plumbing. Combined with its merchant network and distribution across emerging markets, this acquisition has the potential to reshape financial access for the 1.3 billion adults still outside the formal banking system. When a network of Mastercard’s scale plugs stablecoin settlement into corridors where people have been paying eight per cent to move their own money, the impact is not incremental. That is a far bigger story than a card network hedging its bets on crypto.
The regulated rails race
Stripe acquired Bridge. Mastercard has acquired BVNK. By all accounts, Visa is evaluating its own move. Within eighteen months, every major card network will have a stablecoin settlement strategy – or will be explaining to shareholders why it does not.
The interesting tension here is not between traditional finance and crypto. That framing is already outdated. The real contest is between regulated stablecoin infrastructure and the unregulated alternatives growing in corridors where compliant options remain inaccessible. Unregulated rails can move faster precisely because they bypass the licensing work that enables institutional adoption. But speed without regulatory legitimacy is fragile – and the sector has enough scar tissue from high-profile collapses to know where that leads.
Every month that regulated infrastructure remains unavailable in a given corridor is a month that shadow systems gain ground. Mastercard’s acquisition significantly compresses that timeline. With BVNK’s licensing across 130 countries and Mastercard’s global reach, the gap between regulated capability and market demand has just narrowed, benefiting everyone operating on the right side of compliance.
The premium Mastercard paid was never about the technology. It was about time – the time it would take to build a regulatory footprint from scratch while the market moves on without you. That calculus now applies to every legacy payments company that has been watching from the sidelines. The window for building is closing. The window for buying is getting more expensive by the quarter.
When the next acquisition in this space lands – and it will – nobody will treat it as a surprise. They will treat it as inevitable. That shift in expectation is the clearest sign that stablecoin infrastructure has moved from the periphery of global payments to its centre.

Quick Overview
- Citigroup experiences 3.9% decline to $108 during trading session
- Bank evaluates regional institutions with $500B in assets for acquisition
- Recent asset sales generate $6.5B in capital for strategic initiatives
- Share price trails targets despite 78% surge in corporate banking revenue
- Digital asset infrastructure development continues with Bitcoin custody services
Shares of Citigroup retreated to $108.01, marking a 3.91% decline as market participants reacted to the financial institution’s strategic expansion initiatives. The stock experienced consistent downward momentum throughout the session, signaling investor uncertainty regarding the bank’s growth trajectory. Nevertheless, this pullback occurred against a backdrop of solid capital reserves and comprehensive organizational transformation.
Regional Banking M&A Strategy Takes Center Stage
Citigroup is actively assessing opportunities to acquire a US-based regional banking institution or wealth management firm to enhance its domestic footprint. This strategic initiative targets improved deposit gathering, expanded physical presence, and enhanced credit distribution capabilities. As a result, management seeks to narrow the competitive gap with dominant American banking rivals.
Discussions have centered on organizations managing approximately $500 billion in total assets, alongside established securities firms. Prospective candidates include wealth management platforms such as Stifel and Raymond James, both known for robust client advisory operations. Nevertheless, regulatory clearance remains a prerequisite given current supervisory restrictions.
Chief Executive Jane Fraser maintains her commitment to operational streamlining paired with targeted business expansion. The acquisition framework represents a pivot toward reinforcing American operations following extensive international portfolio optimization. Therefore, this approach complements broader objectives to amplify market presence and earnings potential.
Divestiture Program Bolsters Financial Flexibility
Citigroup has fortified its capital foundation through strategic dispositions and organizational restructuring measures. During February 2026, the institution finalized the transfer of its Russian operations to Renaissance Capital. This divestiture yielded approximately $4 billion in Common Equity Tier 1 capital enhancement.
Additionally, Citigroup divested a 49% ownership position in Banamex, its Mexican retail banking division. This transaction contributed roughly $2.5 billion while strengthening financial resources available for reinvestment. Furthermore, leadership has confirmed no additional Banamex asset sales are anticipated during the current fiscal year.
These strategic dispositions have unlocked substantial resources to finance acquisition activity and domestic market penetration. Consequently, Citigroup maintains significant capacity to allocate funds toward revenue-generating opportunities. This approach demonstrates a deliberate transition toward balance sheet optimization and prudent capital deployment.
Operational Performance and Blockchain Technology Advancement
Citigroup delivered impressive institutional banking results in its latest financial disclosure. Corporate banking revenues surged 78% on an annual basis, reaching $2.2 billion during the final quarter of 2025. This exceptional performance underscores heightened engagement from commercial and institutional client segments.
The stock continues trading substantially beneath the Wall Street consensus target of $135. The existing valuation disparity suggests a disconnect between current market pricing and analyst projections. Implementation success of strategic priorities may prove decisive for future share appreciation.
Citigroup has established foundational systems for cryptocurrency custody solutions and digital wallet capabilities. The organization intends to incorporate digital assets into conventional banking infrastructure while maintaining comprehensive risk management protocols. Beyond this, the bank is evaluating stablecoin applications and blockchain-enabled deposit instruments to enhance international payment settlement efficiency.

Europe Gets Its First Driverless Robotaxi Service Starting in Zagreb, Thanks to Uber and Pony.ai

“Most People Are Broke!” America’s #1 Wealth Killer NO ONE Talks About! | The Money Guys

Nvidia Won't Be Dead Money For Much Longer


-
 Crypto World7 days ago
NIO (NIO) Stock Plunges 6.5% as Shelf Registration Sparks Dilution Worries
-
 NewsBeat2 days ago
Manchester United reach agreement with Casemiro over contract clause amid transfer speculation
-

 Crypto World6 days ago
Best Crypto to Buy Now: Strategy Just Spent $1.57 Billion on Bitcoin During Fear While Early Investors Quietly Enter Pepeto for 150x Potential
-

 Crypto World6 days ago
Bitcoin Price News: Bhutan Sells $72 Million in BTC Under Fiscal Pressure, but the Smart Money Entering Pepeto Sees What the Market Does Not
-

 News Videos2 days ago
Parliament publishes latest register of MPs’ financial interests
-

 Sports4 days ago
Remo Stars and Kano Pillars Strengthen Survival Hopes in NPFL
-

 Sports4 days ago
Gary Kirsten Accuses Pakistan Cricket Board Of ‘Interference’, Mohsin Naqvi Responds
-

 Business5 days ago
No Winner in March 21 Drawing as Prize Rolls to $133 Million for Next
-

 Tech5 days ago
Give Your Phone a Huge (and Free) Upgrade by Switching to Another Keyboard
-

 Tech5 days ago
AI enters the chat: New Seattle dating app relies on tech to facilitate meaningful human connections
-

 News Videos4 days ago
Ch 9 Financial Management Part 1 | Detailed One Shot | Class 12 Business Studies Boards 2026
-
Business7 days ago
Columbia Sportswear enters $500 million credit agreement with JPMorgan Chase
-

 Tech6 days ago
Today’s NYT Connections Hints, Answers for March 22 #1015
-

 Business23 hours ago
Instagram, YouTube Found Responsible for Teen’s Mental Health Struggle in Historic Ruling
-

 Business5 days ago
Will Duke Basketball Win It All? Duke Basketball Enters Second Round as Third Favorite to Claim NCAA Title
-

 Sports5 days ago
2026 Kentucky Derby horses, odds, futures, preview, date: Expert who hit 12 Derby-Oaks Doubles enters picks
-
 NewsBeat5 days ago
Update on Wisbech river crash as search for teenage boy enters fifth day
-
 Entertainment4 days ago
Cynthia Bailey Dishes on ‘RHOA’ Season 17, Discusses Kandi
-
 NewsBeat2 days ago
Tesco is selling new Cadbury Dairy Milk bar and people can’t wait to try it
-

 Tech4 days ago
Samsung will soon let you control smart home devices from your car’s dashboard
You must be logged in to post a comment Login