
Crypto World
Circle calls for ‘circuit breakers’ after $270M Drift Protocol DeFi hack


Solana‑based Drift Protocol’s $270m exploit has become a live test of how Circle, DeFi builders and lawmakers share responsibility when stablecoins sit at the center of a hack.
Summary
- Drift Protocol lost roughly $270 million in a governance exploit, one of 2026’s largest DeFi hacks.
- Circle’s Dante Disparte said USDC freezes only occur under legal orders, rejecting calls for unilateral intervention.
- Disparte urged lawmakers to fast‑track the GENIUS Act and CLARITY Act and pushed DeFi to adopt on‑chain “circuit breaker” controls.
Circle’s chief strategy officer Dante Disparte has responded to the roughly $270 million exploit on Solana‑based Drift Protocol by defending how USDC is governed while demanding tougher legal and technical safeguards for DeFi. The April 1 attack saw an attacker seize Drift’s governance keys, drain an estimated $270‑$285 million in assets, rapidly swap much of the haul into USD Coin (USDC) and bridge over $230 million to Ethereum via Circle’s own Cross‑Chain Transfer Protocol. Investigators such as on‑chain analyst ZachXBT argued Circle had “roughly six hours” to freeze the stolen USDC but “took no action,” intensifying scrutiny on how centralized issuers respond in live attacks.
Responding in an X statement and subsequent commentary, Disparte stressed that Circle cannot and will not freeze USDC on mere social‑media pressure or unilateral discretion. “USDC freezing is only executed under legal mandate — not unilaterally,” he said, framing the policy as a matter of due process and financial privacy rather than operational convenience. He added that “it is indefensible and untenable that tools and software are co‑opted by bad actors who remain unchecked,” but argued that unchecked intervention by issuers would be just as dangerous for legitimate users.
Disparte used the Drift exploit to press U.S. lawmakers to accelerate the stablecoin‑focused GENIUS Act and the broader market‑structure CLARITY Act, saying both are needed “before the next major security incident.” He has previously called the GENIUS Act “the most significant US law for innovation since the 1990s,” arguing it “enshrines Circle’s way of doing business into law” by requiring full‑reserve backing, monthly disclosures and robust supervision for dollar stablecoin issuers. The CLARITY Act, currently moving through Congress, would extend that framework to trading venues and intermediaries, creating a clearer basis for when and how assets like USDC can be frozen or clawed back after hacks.
Beyond Washington, Disparte is now urging DeFi teams to import safeguards long standard in traditional markets. He called on protocols to deploy on‑chain “circuit breaker mechanisms” that can automatically halt trading or withdrawals under abnormal conditions, arguing that “risk controls, not improvisation on X, should decide how a $270 million exploit plays out.” With Drift still assessing losses across USDC, BTC, SOL and other assets, the incident has become a live‑fire test of whether stablecoin issuers, protocols and regulators can share responsibility without turning permissionless finance into a de facto banked system.

TLDR
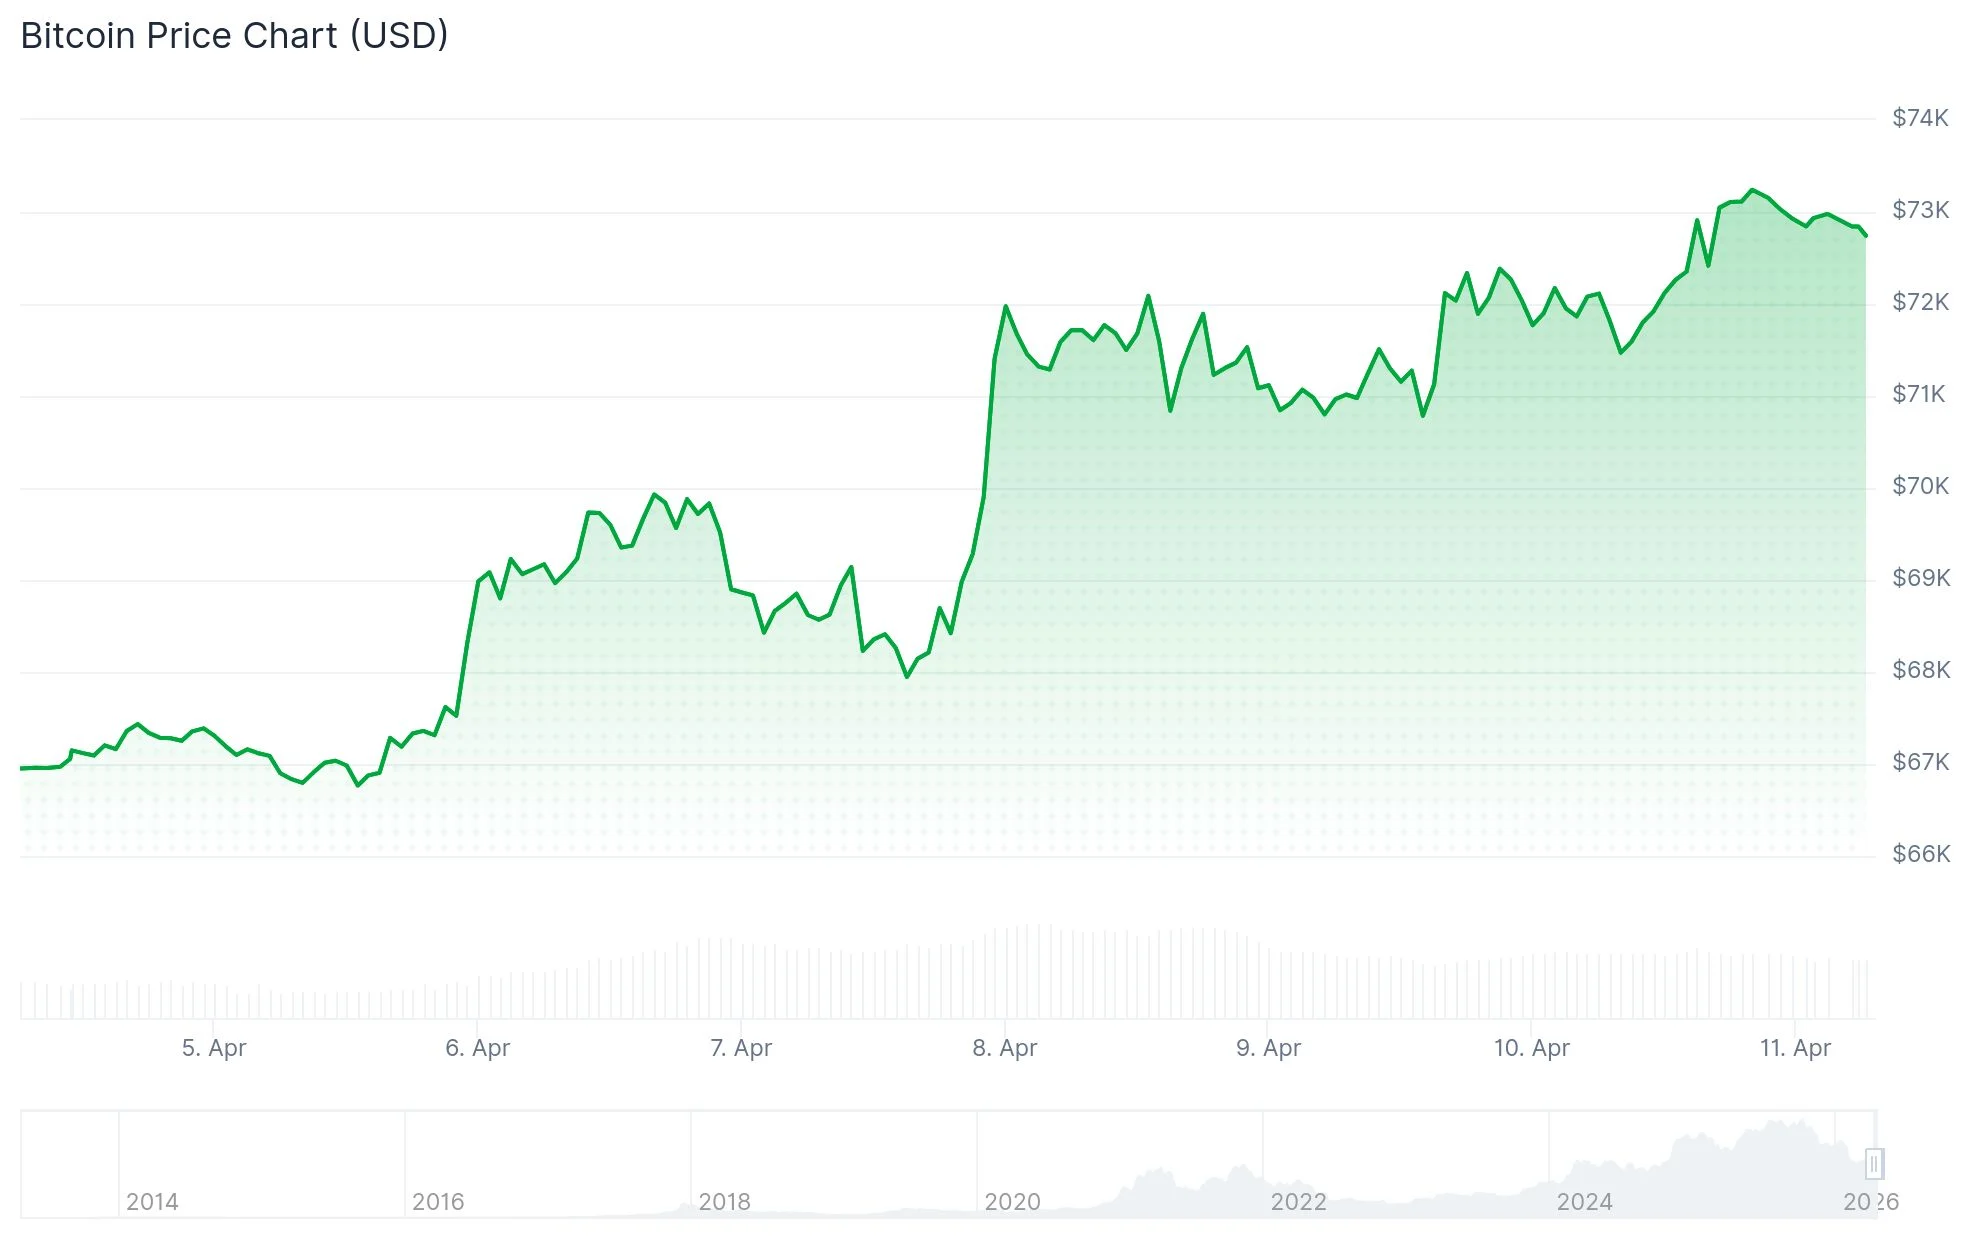
- BTC escaped a bear pennant formation, climbing to a six-week peak of $73,300
- Key resistance territory identified by Glassnode sits in the $78,000-$80,000 range
- Prediction markets on Polymarket now show 26% probability of BTC hitting $80,000 this month
- Institutional Bitcoin ETF buyers accumulated 3,350 BTC valued at $240 million on Friday alone
- Geopolitical developments including U.S.-Iran détente and improving macro sentiment drove BTC up almost 9% weekly
Bitcoin surged beyond the $73,000 threshold on Friday, touching a six-week peak at $73,300 following a decisive breakout from what technical analysts had identified as a bear pennant formation on daily timeframes. The advance occurred alongside elevated trading volumes, suggesting genuine buying conviction rather than thin market manipulation.

The cryptocurrency pierced through the pennant’s upper boundary near $70,000, delivering a 7% single-session gain. During this advance, BTC successfully recaptured multiple significant moving average levels, notably the 200-week exponential moving average positioned at $68,350 and the 50-day exponential moving average sitting at $70,580.
Technicians have also spotted a symmetrical triangle developing on daily charts. Should this pattern complete its typical trajectory, the projected upside target reaches approximately $87,000—representing roughly 20% appreciation from current pricing. Additionally, the Relative Strength Index displays bullish divergence, indicating momentum has been gradually accumulating throughout the previous two months.
The immediate technical obstacle for Bitcoin sits at the 100-day exponential moving average hovering near $75,400. Failure to overcome this barrier could compromise the strength of the present breakout attempt.
What Onchain Data Says About $80K
Glassnode analytics establishes a more defined upper boundary for the near-term advance. The analytics firm’s risk assessment tools highlight substantial resistance clustering between the true market mean around $78,000 and the short-term holder acquisition cost basis approximating $80,000.
“Any rally into this zone is likely to encounter meaningful distribution pressure from recent buyers seeking to exit at or near breakeven,” Glassnode said in its latest Week Onchain report.
Their Entity-Adjusted URPD metrics indicate BTC has penetrated a comparatively sparse zone spanning $72,000 to $82,000, featuring diminished supply overhead throughout that corridor. Nevertheless, over 1.3 million BTC were accumulated within the $82,000-$85,000 band, potentially establishing a formidable ceiling.
Market observer Ali Charts highlighted on X that $75,300 functions as a “magnet” for Bitcoin pricing, observing substantial liquidity concentration positioned just beyond $72,000. He suggested a movement toward $75,300 might eliminate approximately $80 million in short positions, potentially initiating a liquidation cascade.
ETF Demand and Macro Backdrop
Regarding institutional participation, Bitcoin Archive documented on X that spot Bitcoin ETF products absorbed 3,350 BTC worth $240 million during a single trading session. These investment vehicles collectively control 721,090 BTC, representing approximately $56.75 billion in aggregate value.
Broader macroeconomic circumstances also turned favorable for Bitcoin’s trajectory this week. Diplomatic progress toward a U.S.-Iran ceasefire agreement lifted risk-sensitive assets across markets, propelling BTC toward a weekly appreciation approaching 9%—marking its strongest weekly performance since October 2025.
March Consumer Price Index data registered 3.3%, primarily attributable to a substantial 10.9% spike in energy sector costs. Core inflation measurements, however, advanced merely 0.2% month-over-month.
On decentralized prediction platform Polymarket, participants currently assign a 26% probability to BTC achieving $80,000 during April, representing a 5% increase over the preceding 24 hours. Meanwhile, the likelihood of reaching $75,000 stands at 76%.
Bitcoin ETF products maintained holdings of 721,090 BTC valued at $56.75 billion as of Friday’s close.


TLDR:
- Japan lifted Rapidus backing to $16.3B as its 2nm AI chip production deadline remains fixed for 2027.
- New funds support Fujitsu-linked design work and strengthen Japan’s domestic AI semiconductor stack.
- Hokkaido foundry progress cleared ministry review, unlocking another ¥631.5B in state support.
- The Rapidus plan ties AI compute growth to supply chain security and sovereign chip production.
Japan has added another ¥631.5 billion to Rapidus, deepening one of the world’s largest state-backed semiconductor bets.
The new funding lifts total public support to ¥2.6 trillion, or about $16.3 billion, through March 2027. Rapidus remains central to Tokyo’s effort to rebuild domestic 2nm chip production for AI workloads and advanced computing.
The move also tightens Japan’s broader technology push around supply chain resilience and sovereign semiconductor capacity.
Rapidus AI chip funding accelerates Japan’s 2nm roadmap
According to Bloomberg, the latest capital will support Rapidus’ development work tied to Fujitsu, one of the startup’s earliest targeted customers.
The Economy Ministry said an external committee reviewed the Hokkaido foundry and approved its technical progress before the subsidy release.
Rapidus, launched in 2022, is building out a domestic 2nm manufacturing line with technology cooperation from IBM. The company still targets mass production in 2027.
The project also carries backing from major Japanese corporates, including Toyota, Sony, and SoftBank, reinforcing its strategic importance beyond pure commercial returns.
Tokyo’s funding pace shows how AI infrastructure demand now overlaps with national industrial policy. Advanced nodes increasingly underpin cloud compute, robotics, and high-performance AI inference.
Japan’s semiconductor strategy targets AI supply chain security
The additional subsidy also supports design-related work involving Fujitsu and IBM Japan through NEDO programs.
That expands the project from fabrication into a fuller domestic semiconductor design stack, a critical step for AI chip independence.
Japan’s push comes as governments seek alternatives to concentrated foundry exposure in Taiwan and South Korea. For Tokyo, the Rapidus buildout doubles as economic security policy.
The 2nm target places Rapidus directly in competition with leading global foundries serving AI chip demand, where process leadership determines power efficiency and model performance.
For crypto markets, the development matters because AI data-center expansion increasingly overlaps with GPU supply, mining hardware innovation, and tokenized compute infrastructure.
As Bloomberg reported, the latest review focused on execution milestones at the Hokkaido site, where Tokyo wants proof the 2027 manufacturing deadline remains on track.


The mines Iran scattered across the Strait of Hormuz are now preventing the country from widening access to the waterway, as Tehran cannot account for where all of them ended up, US officials say.
The revelation comes as senior delegations from both countries are set to meet in Islamabad for negotiations that will test whether any truce can survive.
Iran Can’t Find the Mines It Planted in the Strait of Hormuz
According to The New York Times, Iran used small boats to scatter mines across the strait after the US and Israel launched their strikes on February 28. US officials noted many mines may have been placed without recorded coordinates or in ways that allowed them to drift.
The haphazard placement created a problem Tehran did not anticipate. Foreign Minister Abbas Araghchi signaled that Tehran would allow vessels through the waterway, but “with due consideration of technical limitations.” American officials said that phrase referred directly to Iran’s inability to find or clear its own ordnance.
Follow us on X to get the latest news as it happens
Meanwhile, this directly undermines the toll system Iran announced. Under that framework, laden tankers must email cargo details to Iranian authorities and then pay $1 per barrel of oil in Bitcoin within seconds. The system was designed to bypass sanctions.
The Hormuz Letter highlighted that, at pre-war traffic of roughly 20 million barrels per day. This fee structure could generate approximately $7.3 billion annually. However, with uncharted mines still drifting through the strait, the toll’s revenue potential is largely theoretical for now.
US-Iran Ceasefire Talks Open Under Immense Pressure
Senior delegations from both countries have arrived in Islamabad for ceasefire talks. Vice President JD Vance leads the US team alongside Steve Witkoff and Jared Kushner. Meanwhile, Parliament Speaker Mohammad Bagher Ghalibaf and Araghchi head Iran’s delegation.
President Trump has demanded the “complete, immediate, and safe opening” of the strait as a condition for the ceasefire to hold. Yet neither side possesses mine-clearing capabilities.
“The US military lacks robust mine removal capabilities, relying on littoral combat ships equipped with mine sweeping capabilities. Iran also does not have the capability of quickly removing mines, even the ones it planted,” the report read.
The mine problem feeds into a broader economic fallout. BeInCrypto recently highlighted that the Strait’s closure has also disrupted global fertilizer and aluminum supply chains, amplifying the damage well beyond oil prices.
Whether Islamabad produces a framework for sustained mine clearance and verified strait reopening will determine whether the ceasefire survives beyond its April 22 expiration.
Subscribe to our YouTube channel to watch leaders and journalists provide expert insights
The post Iran’s Best War Tactic is Now a Liability at the Negotiating Table appeared first on BeInCrypto.
TLDR:
- Arizona must pause criminal charges against CFTC-regulated prediction markets after the federal TRO order.
- The CFTC says federal law grants exclusive authority over event contracts and market enforcement.
- Connecticut and Illinois now face similar federal lawsuits over state prediction market restrictions.
- The ruling strengthens legal momentum for federally supervised crypto-linked trading platforms.
A federal judge in Arizona temporarily halted the state’s criminal case against federally regulated prediction markets on Friday. The order came after the Commodity Futures Trading Commission asked the court to stop Arizona’s enforcement push.
The ruling preserves the status quo while a broader federal preemption fight moves forward. It also sharpens the legal divide between state gambling rules and federal event contract oversight.
CFTC Arizona TRO Freezes State Prediction Markets Charges
The U.S. District Court for the District of Arizona granted the temporary restraining order on April 10. The court barred Arizona from continuing criminal proceedings against CFTC-regulated designated contract markets.
According to the CFTC filing, the agency moved earlier this week for emergency relief. That motion followed its original complaint seeking to block Arizona from enforcing state law.
The dispute centers on whether federal law preempts state gambling and criminal statutes. The CFTC argues the Commodity Exchange Act gives it exclusive authority over event contracts.
Chairman Michael S. Selig said the order keeps the legal status quo intact while the court reviews jurisdictional questions. The agency also tied the case to broader concerns around state interference in federally supervised markets.
Arizona became the first state to pursue criminal counts tied to prediction market listings, including contracts offered by Kalshi. The restraining order now pauses that path, at least temporarily.
Federal Prediction Markets Fight Expands Beyond Arizona
The Arizona action forms part of a wider CFTC legal campaign. Last week, the agency filed related complaints against Connecticut and Illinois.
Those cases seek declaratory judgments confirming exclusive federal control over event contracts. The CFTC also wants permanent injunctions blocking states from enforcing overlapping laws.
The timing matters for crypto-linked prediction markets as well. Platforms like Polymarket and Kalshi increasingly overlap with digital asset users, stablecoin settlement, and onchain market infrastructure.
Recent court decisions have already strengthened the federal side. Earlier this week, an appeals court blocked New Jersey from shutting down Kalshi’s sports markets.
Friday’s Arizona TRO adds another legal marker in the same direction. For traders and exchanges, the immediate effect is procedural, but the broader question remains federal control over fast-growing prediction markets.
TLDR:
- Artemis stablecoin factor posted 83.6% annualized returns with minimal dependence on Bitcoin direction.
- The strategy gained 6.8% monthly across BTC down months, showing resilience during crypto market weakness.
- Mid-cap chains including Polygon and Sei generated 84% of total stablecoin factor returns over five years.
- Stablecoin flows remained Artemis’ least-correlated alpha factor with only 6.1% variance overlap.
Stablecoin flows are emerging as one of crypto’s clearest signals for layer-1 market rotation.
New research from Artemis shows capital moving through stablecoins consistently preceded stronger relative returns across major chains. The firm’s five-year backtest found the strategy remained largely detached from broad crypto market direction.
Results also showed the factor produced gains during months when Bitcoin posted losses.
Stablecoin Flows Predict L1 Returns Across Market Cycles
Artemis said its weekly rebalanced long-short factor generated a 1.67 Sharpe ratio over five years. The model delivered an annualized return of 83.6% during the test period.
The same backtest recorded a maximum drawdown of 43.9%. A volatility-targeted overlay lowered drawdown to 31.9% while reducing Sharpe to 1.17.
The data pointed to minimal dependence on Bitcoin’s broader trend. Artemis reported a market beta of -0.03 and an R² of 0.1%.
That structure became more visible during weaker crypto conditions. Across 30 BTC-negative months, the factor returned 6.8% monthly while Bitcoin fell 10.9%.
Artemis also measured annualized alpha at 73.8% after controlling for market exposure. The reported t-statistic reached 3.31 with significance at the 1% level.
The firm noted the strategy’s out-of-sample Sharpe estimate still held at 0.96 after applying a degrees-of-freedom haircut. That kept stablecoin flows among its strongest market-neutral crypto signals.
Mid-Cap Chains Drive Stablecoin Factor Alpha
Most of the gains came from the long side of the book. Artemis said 84% of returns originated from long exposure to chains attracting positive stablecoin inflows.
Mid-cap networks dominated the return profile. Polygon, Mantle, Optimism, BSC, and Sei contributed 84% of total factor returns.
The research also showed limited overlap with Artemis’ broader factor suite. Maximum pairwise correlation across the stack measured only 0.16.
Even after spanning regression against all other factors, the stablecoin signal retained a 2.54 t-statistic. Artemis said just 6.1% of variance overlapped with other models.
Performance also stayed resilient through distinct market phases. The factor returned 262% in 2021, 47% in 2022, and 315% in 2025.
Its only negative year came in 2024 with a 13% decline. Artemis linked that period to stagnant aggregate stablecoin supply growth before recovery resumed.
TLDR:
- Microsoft found the EngageLab SDK bug could expose private wallet data across 30M Android installs globally.
- The flaw abused Android intents to grant hostile apps persistent read and write provider permissions.
- EngageLab fixed the issue in v5.2.1 by changing MTCommonActivity to non-exported status.
- Google Play removed affected wallet apps, while Android added safeguards for already installed versions.
Microsoft has disclosed a severe Android SDK vulnerability that placed more than 30 million crypto wallet installs at risk. The flaw affected EngageLab’s widely used EngageSDK, which many wallet apps used for push messaging features.
According to Microsoft’s security research, the issue enabled malicious apps on the same device to bypass sandbox protections. Google Play has since removed all identified apps using the vulnerable SDK versions.
EngageLab Android SDK Flaw Exposed Crypto Wallet Attack Surface
Microsoft said the issue centered on an exported Android activity called MTCommonActivity.
The component was automatically added during manifest merging after developers imported the SDK. Because it appeared post-build, many teams likely missed it during review. That left production APKs open to hidden risk.
The vulnerable flow began when the activity received an external intent. Its onCreate() and onNewIntent() callbacks both routed data into processIntent().
That method extracted a URI string and forwarded it deeper into the SDK logic. The chain eventually rebuilt and launched a new intent.
Microsoft’s write-up noted the critical failure happened in a helper method. Instead of returning a safe implicit intent, it returned an explicitly targeted one. That changed Android’s normal resolution path and let hostile apps redirect execution.
In practice, the vulnerable wallet app launched the malicious payload with its own privileges.
The risk worsened because the SDK used Android’s URI_ALLOW_UNSAFE flag. That allowed persistent read and write URI permissions inside the redirected intent.
A malicious app could then gain access to non-exported content providers. From there, sensitive wallet files, credentials, and user data became reachable.
Microsoft Patch Timeline and Android Wallet Mitigation Guidance
Microsoft Security Vulnerability Research first identified the flaw in EngageSDK version 4.5.4 in April 2025. It then notified EngageLab under coordinated disclosure rules.
The Android Security Team also received the report because affected apps were live on Google Play. The fix arrived months later in version 5.2.1 on November 3, 2025.
In the patched release, EngageLab changed the vulnerable activity to non-exported. That single change blocks outside apps from invoking the component directly. Microsoft said it currently has no evidence of in-the-wild exploitation. Still, it urged developers to update immediately.
The report stressed that third-party SDKs can silently expand wallet attack surfaces.
Crypto apps face elevated stakes because they often store keys, credentials, and financial identifiers. Even minor upstream library flaws can ripple across millions of devices. This case pushed total exposure above 50 million installs when non-wallet apps were included.
Microsoft also said Android added automatic protections for previously installed vulnerable apps. Those mitigations reduce risk while developers migrate to the fixed SDK.
The company urged teams to inspect merged manifests after every dependency update. That review can catch exported components before release.
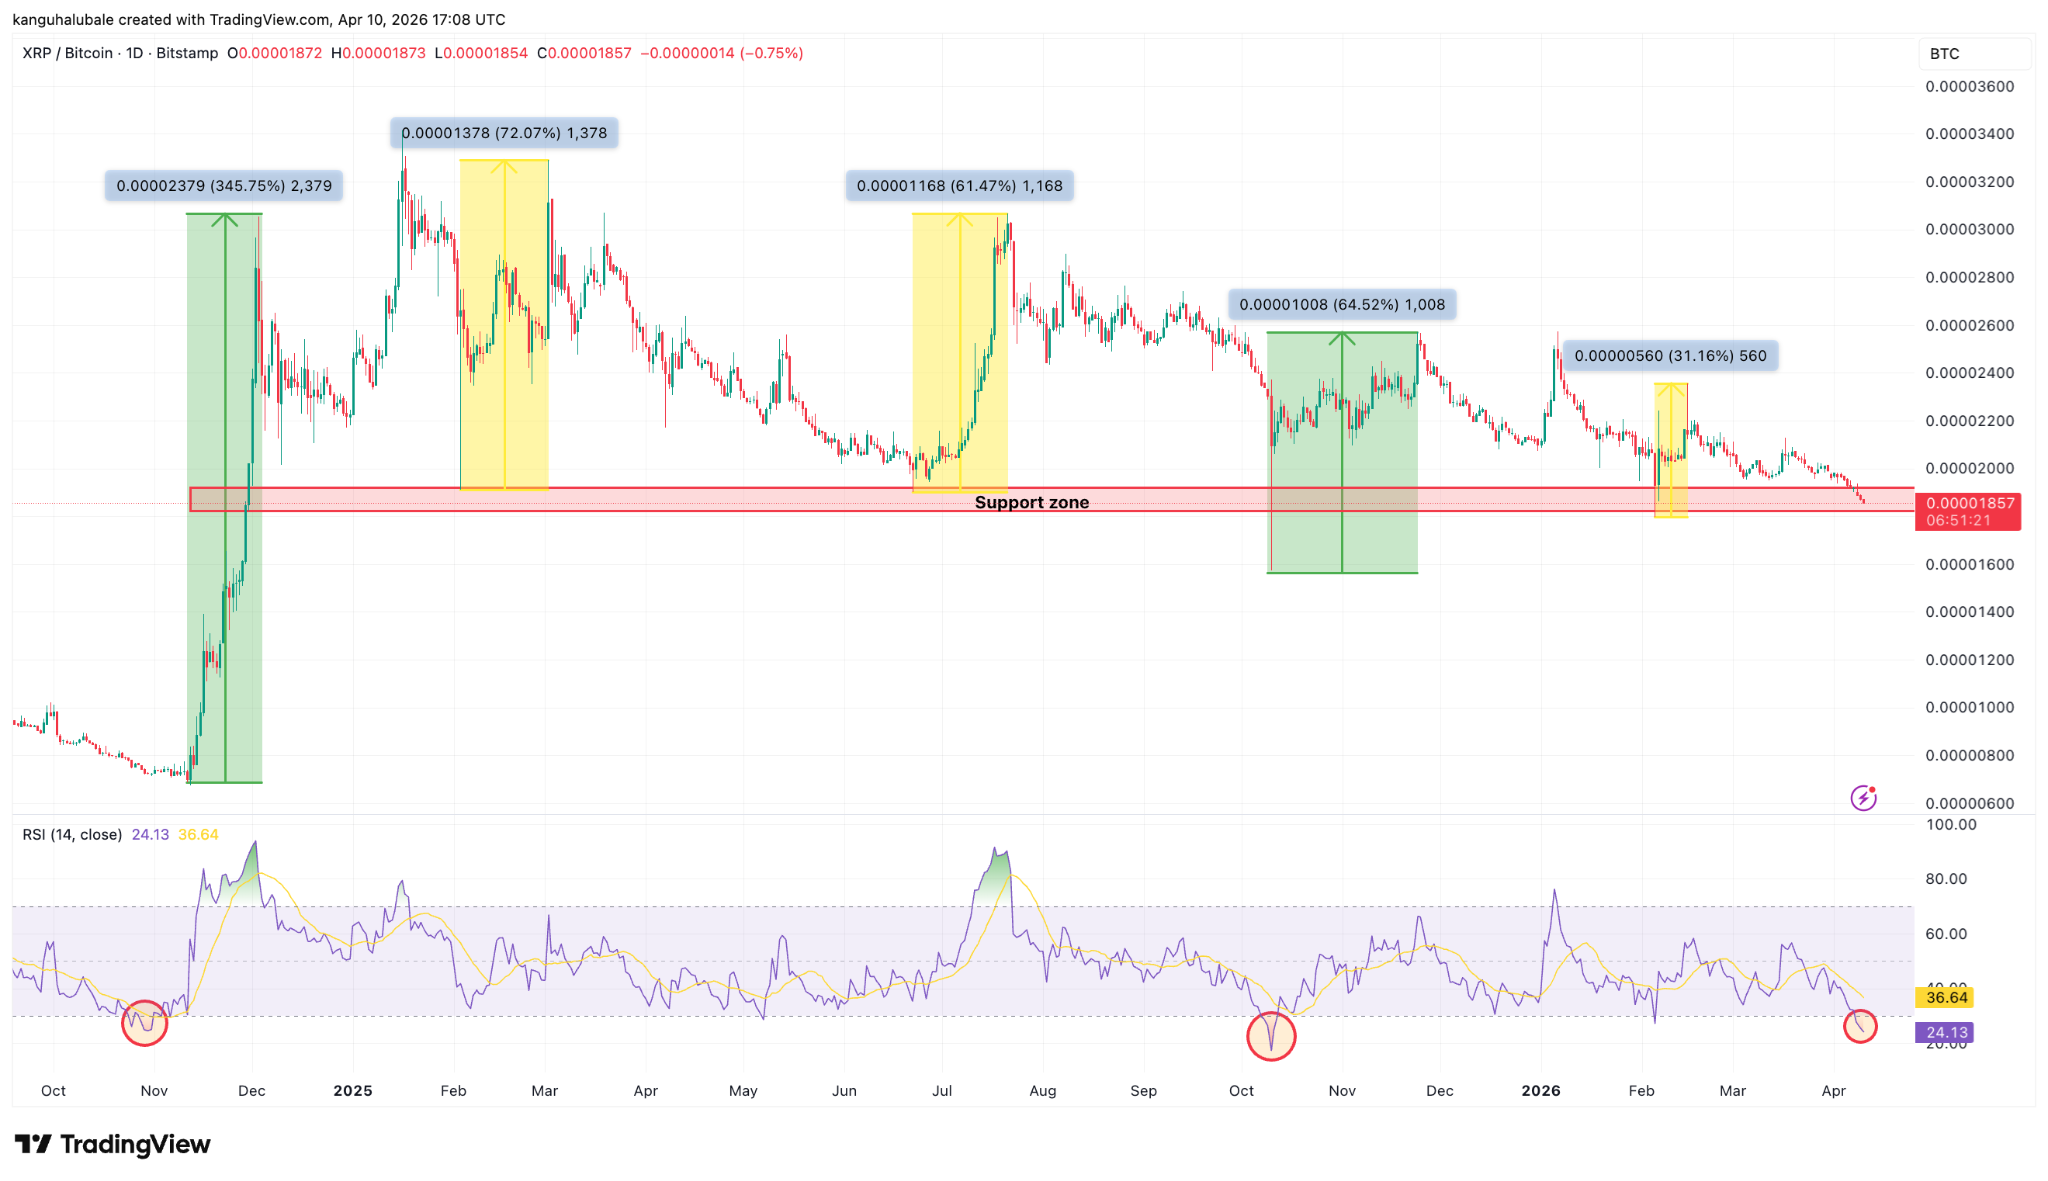
XRP (XRP) has been in an eight-month downtrend, with momentum and onchain indicators at levels that previously coincided with macro bottoms.
Data from TradingView reveals that the relative strength index (RSI) of the XRP/BTC ratio is at 24, the most oversold level since October 2025.
Such low levels in the daily RSI have marked market bottoms for the ratio, ultimately leading to 65% to 345% XRP price breakouts against Bitcoin as seen late 2024 and 2025.

The chart above also shows that the XRP/BTC pair is trading within a long consolidation range, which has previously acted as a strong launching pad for the ratio.
The last time XRP bottomed against Bitcoin around this zone was in June 2025. It marked the beginning of a 61% increase in the XRP/BTC ratio, accompanying a 92% XRP price rally to a multi-year high of $3.66.
Other instances shown by the yellow bars in the chart reinforce the reliability of this level in marking macro bottoms for XRP/BTC.
MVRV Z-Score suggests XRP price is bottoming
XRP’s MVRV Z-score is hovering near zero, a level that historically aligns with accumulation zones and market bottoms.
This indicates that most holders are close to breakeven, reducing sell pressure and signalling potential downside exhaustion. Similar patterns appeared in 2021, 2022 and 2024 before major rallies.

Note that the last time XRP’s MVRV Z-score fell to similar levels in late 2024 coincided with a macro market bottom at $0.30 and preceded a multi-month rally, with the XRP/USD pair rising 500% to a multi-year high above $3.
Meanwhile, the 0.80 MVRV pricing band, which has historically marked cycle bottoms, is currently at $1.14, coinciding with a 15-month low reached on Feb. 6.

These onchain metrics suggest that XRP is undervalued and may continue the ongoing recovery, potentially rising toward $1.70 or higher.
XRP price must hold above $1.30
Meanwhile, XRP/USD remains cautiously bullish as long as it holds the $1.25-$1.30 support zone.
“$XRP is sustaining the major support zone between $1.30-$1.25 levels since early Feb’26,” trader ChiefraT said in an X post on Friday, adding:
“If this zone continues to hold, then a short-term bounce towards $1.45 can’t be ruled out.”

The importance of this support level is reinforced by cost basis distribution. The heatmap below shows that nearly 1.73 billion XRP were acquired around this price.

Below that, the next line of defence is the $1.15 demand zone, where the 200-week simple moving average is.
If XRP/USD drops below this level, it would be in a free-fall toward the measured target of the bear flag at $0.80, or 41% below the current price.
As Cointelegraph reported, holding $1.27-$1.30 would be a sign of strength among the bulls who must push the XRP/USD pair toward the $1.61 range high to regain control.
This article is produced in accordance with Cointelegraph’s Editorial Policy and is intended for informational purposes only. It does not constitute investment advice or recommendations. All investments and trades carry risk; readers are encouraged to conduct independent research before making any decisions. Cointelegraph makes no guarantees regarding the accuracy or completeness of the information presented, including forward-looking statements, and will not be liable for any loss or damage arising from reliance on this content.
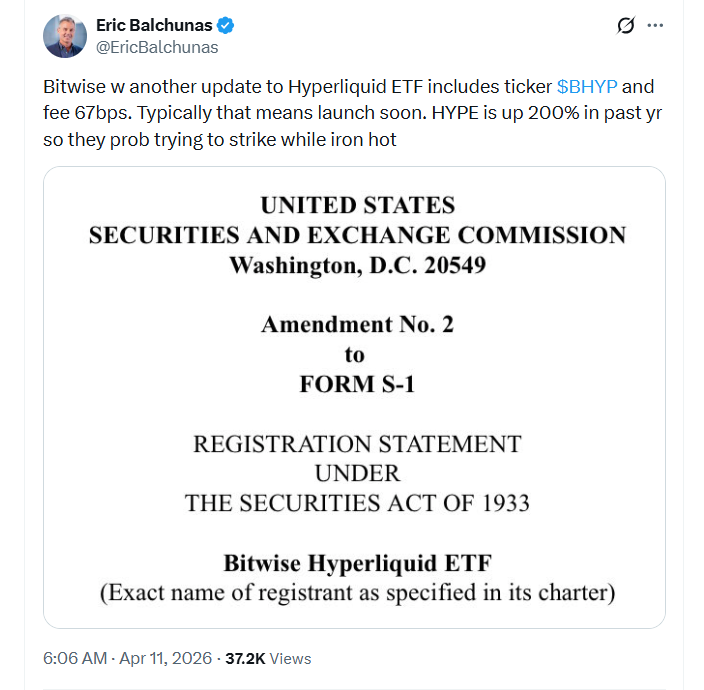
Bitwise Asset Management has reportedly taken a key step toward launching its proposed spot Hyperliquid exchange-traded fund, filing a second amendment with the US Securities and Exchange Commission.
In an X post on Friday, Bloomberg senior ETF analyst Eric Balchunas highlighted that Bitwise had updated its Hyperliquid ETF to include the ticker $BHYP and had also set a management fee of 0.67% (67 basis points).
According to Balchunas, the filing of these details generally indicates that the product will “launch soon.”
“HYPE is up 200% in the past year,” he said, adding that the firm was likely “trying to strike” while the iron was “hot.”
The filing comes amid competition from other asset managers vying to launch the first spot ETF tied to the crypto perpetual futures protocol and blockchain, with Grayscale and 21Shares also pushing for similar products of their own.
Bitwise was the first of the three to submit a Hyperliquid ETF filing with the SEC in September. 21Shares followed a month later with its own, while Grayscale submitted its filing in late March.

If approved, Bitwise’s ETF will trade on the NYSE Arca stock exchange and offer investors exposure to the spot price of Hyperliquid.
In the firm’s first filing amendment from December, Bitwise also indicated that the fund would seek to generate additional returns from HYPE staking — something Grayscale and 21Shares haven’t explicitly indicated their funds would do.
Hyperliquid continues to gain traction
According to data from CoinGecko, the price of HYPE is up 65% since the start of 2026 to around $41.96 at the time of writing, despite a tough start to the year for the broader crypto market. Over 12 months, the price of HYPE is also up about 182%.
Related: BlackRock Bitcoin ETF sees $269M inflows, best day since early March
Alongside a strong token performance, blockchain analytics platform CoinGlass reported in early April that Hyperliquid had broken into the top 10 crypto derivatives platforms by volume, joining the likes of Binance, OKX and Bybit.
During Q1, Hyperliquid generated $492.7 billion in trading volume, putting it shy of ninth-placed Coinbase by about $90 billion.
Magazine: Should users be allowed to bet on war and death in prediction markets?
TLDR:
- Aave Labs secured SOC 2 Type II for security, availability, and confidentiality controls across software operations.
- The audit tested whether Aave’s controls worked consistently over time, not only at one review date.
- The milestone supports Aave’s institutional DeFi push through stronger governance and risk frameworks.
- Aave said the same compliance standards now extend across Pro, Kit, App, and future software products.
Aave Labs has secured SOC 2 Type II attestation, marking a notable compliance milestone for one of DeFi’s largest software contributors. The certification covers security, availability, and confidentiality controls across the company’s software development and operations.
The update arrives as Aave expands deeper into institutional and enterprise-focused DeFi infrastructure. Besides, the move places operational discipline at the center of the protocol’s next growth phase.
Aave SOC 2 Type II Sengthens DeFi Security Standards
The attestation covers the Trust Services Criteria defined by the AICPA. It focuses on whether internal controls worked effectively over time.
Unlike a point-in-time review, Type II testing measures performance across a defined audit window. That gives partners clearer visibility into process consistency.
According to Aave’s official announcement, the audit reviewed development workflows, software safeguards, and information handling practices. The scope also included operational methodologies tied to software releases.
The result confirms that Aave Labs applies standardized controls across the software it contributes to the Aave Protocol. That includes products such as Aave Pro, Aave Kit, and Aave App.
For institutional DeFi users, this matters because compliance standards increasingly shape counterparty decisions. Security controls now carry similar weight to protocol design.
Aave Institutional Strategy Expands Through Compliance and Risk Controls
The timing aligns with Aave’s broader enterprise roadmap. The company has increasingly linked product growth to governance, risk, and market architecture.
Its announcement directly connected the attestation to initiatives like Aave Horizon. That product direction targets institutional and regulated market use cases.
Aave also framed the milestone around operational resilience and confidentiality. Those areas remain central for institutions evaluating DeFi integrations.
The company noted that maintaining SOC 2 Type II requires continuous control testing. That means the process extends beyond a one-time audit achievement.
By embedding those controls into software shipping cycles, Aave positions its infrastructure for larger counterparties. The emphasis stays on repeatable internal standards.
The update also reflects a wider shift in crypto infrastructure. More DeFi platforms now prioritize enterprise-grade software assurance alongside transparent governance.
For Aave, the certification formalizes internal practices already tied to product delivery. It also strengthens the protocol’s credibility with risk-aware finance participants.

The U.S. Commodity Futures Trading Commission has unveiled the first roster of members for its Innovation Task Force, part of a broader effort to bring clearer rules to the crypto market. Spearheaded by Michael Passalacqua, the CFTC’s senior advisor to Chairman Mike Selig, the initiative aims to provide greater clarity for American developers and investors navigating digital assets.
In an announcement on Friday, the agency named five initial members who will join Passalacqua: Hank Balaban, formerly a crypto-focused attorney at Latham & Watkins; Sam Canavos, an ex-Patomak advisor with crypto and prediction markets experience; Mark Fajfar, a longtime CFTC legal veteran; Eugene Gonzalez IV, who previously practiced cryptocurrency law at Sidley Austin; and Dina Moussa, a Market Participants Division special counsel at the CFTC. Chairman Selig praised the lineup, saying the group combines deep legal expertise with a shared commitment to delivering clear “rules of the road” for U.S. innovators.
The expansion of the Innovation Task Force fits a broader push by U.S. regulators to provide regulatory clarity for the digital asset sector, a project outlined under the direction of the Trump administration. The CFTC’s move comes alongside parallel efforts at the Securities and Exchange Commission to define regulatory boundaries for crypto assets.
Key takeaways
- The CFTC has formalized its Innovation Task Force with a first five-member roster led by Michael Passalacqua, signaling a structured approach to crypto governance.
- The new task force is part of the agency’s effort to deliver clear rules of the road for American innovators and to reduce ambiguity around crypto markets.
- The CFTC has also launched an “innovation tracker” to map ongoing work across crypto, artificial intelligence and autonomous systems, and contracts and prediction markets.
- Regulatory clarity remains entangled with the broader political debate, including questions about the CLARITY Act and how the CFTC and SEC divide jurisdiction over digital assets.
A new lineup for regulatory clarity
The initial members bring a blend of legal and regulatory experience tailored to crypto markets. Balaban’s background at a major law firm and Gonzalez IV’s Sidley Austin credentials anchor a practice familiar with crypto law. Canavos’s policy-oriented experience at Patomak and Fajfar’s long tenure within the CFTC provide institutional continuity, while Moussa’s role in the Market Participants Division emphasizes practical, participant-focused considerations. Together with Passalacqua, the group is positioned to translate evolving technology and market developments into more predictable oversight parameters.
“The Innovation Task Force brings together a leading team that exhibits deep expertise and an enthusiastic commitment to deliver clear rules of the road for American innovators,” Selig said in the announcement. The wording underscores the regulator’s intent to move beyond static guidance toward actionable policy that market participants can rely on as the crypto ecosystem evolves.
Innovation tracker and three focus areas
Alongside naming the task force, the CFTC introduced an innovation tracker intended to document the agency’s ongoing efforts to modernize regulation in three priority areas: crypto and blockchain, artificial intelligence and autonomous systems, and contracts and prediction markets. The tracker signals where policymakers believe clarity is most urgently needed and where technological progress intersects with market integrity.
The move occurs amid a broader regulatory dialogue about how U.S. authorities will handle crypto assets, particularly in relation to securities laws and futures framework. The CFTC’s emphasis on “clarity” aligns with a broader push by federal agencies to set clearer boundaries for who regulates what in the digital-asset space, a shift that could influence market structure, product design, and compliance costs for firms building in this space.
Regulatory landscape and the CLARITY Act
Another layer shaping the next steps is the debate over the CLARITY Act, a legislative proposal that some policymakers advocate as a way to codify regulatory jurisdiction for crypto. SEC Chair Paul Atkins has publicly urged Congress to pass the act to establish a durable framework that can accommodate rapid innovation while protecting investors. In parallel, the SEC has signaled that it does not see most crypto assets as securities, a position that would naturally concentrate regulatory authority with the CFTC for many tokenized products if the law changes or is clarified in law.
While both agencies have indicated readiness to implement a clearer framework, the ultimate outcome remains tied to Congressional action and how the CLARITY Act is translated into enforceable policy. For market participants, the tension between the CFTC’s emphasis on spot markets, risk controls, and market infrastructure, and the SEC’s security-centric view, could shape product design, listing decisions, and compliance programs in the near term.
Investors and builders should watch how the Innovation Task Force’s work translates into concrete guidance, potential safe harbors, or pilot programs that could lower uncertainty and speed legitimate innovation. The cross-agency dialogue and the push for legislative clarity may, if successful, unlock a more predictable regulatory environment that balances innovation with market integrity.
Source for the task force announcement: Michael Passalacqua, via a post on X, and the CFTC press release detailing the initial membership and the broader policy objective.
What happens next remains linked to congressional action and how the CLARITY Act is refined and enacted. In the meantime, market participants should monitor how the tracker’s focus areas evolve into practical rules, and which areas—if any—move from guidance toward formal rulemaking or enforcement priorities.

How to watch the 2026 Grand National, start time and runners

‘Every drop of water counts’: Fear for Argentina’s glaciers

Bitcoin (BTC) Surges Past $73K as ETFs Pour in $240M During Friday Rally

Why Israel is blocking foreign journalists from entering

Bitcoin: We’re Entering The Most Dangerous Phase

Alan Cumming Brands Baftas Ceremony A ‘Triggering S**tshow’

XRP- Ripple Treasury Ceritified To Tap 11,000+ SWIFT Banks? Yes – Bitcoin Hits $200K What Is XRP???

ULTIMATE Cryptocurrency Trading Course (From Beginner To PRO)

Gs Finance – New Loan App for Low Cibil ( Review ) | New Loan App review 2026 | Only On KYC
-

 Business5 days ago
Three Gulf funds agree to back Paramount’s $81 billion takeover of Warner, WSJ reports
-

 Sports6 days ago
India men’s 4x400m and mixed 4x100m relay teams register big progress | Other Sports News
-

 Politics12 hours ago
US brings back mandatory military draft registration
-

 Fashion13 hours ago
Weekend Open Thread: Veronica Beard
-

 Business7 days ago
Expert Picks for Every Need
-

 Tech3 days ago
How Long Can You Drive With Expired Registration? What Florida Law Says
-

 Business6 days ago
No Jackpot Winner, Prize to Climb to $231 Million
-

 Fashion5 days ago
Massimo Dutti Offers Inspiration for Your Summer Mood Board
-
 Sports13 hours ago
Man United discover Nico Schlotterbeck transfer fee as defender reaches Dortmund agreement
-

 Fashion4 days ago
Let’s Discuss: DEI in 2026
-

 Crypto World3 days ago
Bitcoin recovers as US and Iran Agree a Ceasefire Deal
-

 Business10 hours ago
Tesla Model Y Tops China Auto Sales in March 2026 With 39,827 Registrations, Beating Cheaper EVs and Gas Cars
-

 Business6 days ago
Akebia Therapeutics, Inc. (AKBA) Discusses Pipeline Progress and Strategic Focus on Kidney Disease Treatments at R&D Day – Slideshow
-

 Crypto World2 days ago
Canary Capital Files SEC Registration for PEPE ETF
-

 Business19 hours ago
OpenAI Halts Stargate UK Data Centre Project Over Energy Costs and Copyright Row
-

 Tech5 days ago
Haier is betting big that your next TV purchase will be one of these
-

 Tech5 days ago
The Xiaomi 17 Ultra has some impressive add-ons that make snapping photos really fun
-

 Tech5 days ago
Samsung just gave up on its own Messages app
-

 Tech5 days ago
Gamer Restores the Original PlayStation Portal From Two Decades Ago
-

 Tech5 days ago
Save $130 on the Samsung Galaxy Watch 8 Classic: rotating bezel, sleep coaching, and running coach for $369
You must be logged in to post a comment Login