
Business
Where’s the Indian mutual fund sector going ahead? 6 big trends to watch out for

Large Cap’s share of total equity AUM has fallen in a straight line – 18.2% (Mar-21) → 16.6% (Mar-22) → 15.5% (Mar-23) → 13.4% (Mar-24) → 12.2% (Mar-25) → 11.4% (Mar-26). In absolute rupees, Large Cap AUM grew from ₹1,78,324 Cr to ₹3,66,045 Cr, so money didn’t leave – it just barely doubled while total equity AUM more than tripled (₹9,79,367 Cr to ₹31,97,698 Cr). Every other category’s share in the overall pie grew faster.
The ratio shift against Mid and Small Cap is the most striking way to visualise this. In March 2021, Mid Cap was just 0.65x the size of Large Cap, and Small Cap at a distant 0.39x. By March 2026, Mid Cap has crossed over at 1.14x Large Cap – bigger than Large Cap for the first time – and Small Cap has reached 0.91x, closing in fast. Year by year, this progression is relentless:
Trend 2:

Sectoral/Thematic: Five years of dominance, one extraordinary year, and a sharp correction
Sectoral/Thematic AUM has grown nearly 5x from ₹98,080 Cr (Mar-21) to ₹4,77,309 Cr (Mar-26), with equity AUM share rising from 10.0% to 14.9% — a story of genuine secular growth. But the flow data tells a more nuanced story.
The annual flows: FY22: ₹27,128 Cr (16.5%) → FY23: ₹23,731 Cr (16.2%) → FY24: ₹46,138 Cr (25.1%) → FY25: ₹1,46,656 Cr (35.2%) → FY26: ₹29,975 Cr (8.6%). FY25 was the outlier — more than one rupee in every three going into equity mutual funds chose a sectoral or thematic fund. Three forces converged: India’s capex Supercycle gave credible narratives for infrastructure, defence and manufacturing launches; PSU re-rating attracted fresh money; and crucially, unlike most equity categories where SEBI permits only one scheme per fund house, there is no limit on sectoral and thematic fund launches.
FY26’s pullback to 8.6% of flows is the market’s verdict. Defence, PSU and manufacturing themes underperformed as valuations stretched and earnings upcycles disappointed. Redemptions followed losses. FY25 was a powerful reminder that NFO-driven surges built on narratives and not on earnings do reverse.
Trend 3:
Multi Asset Allocation Funds (MAAFs): From niche to essential, fuelled by gold and silver’s historic run
Multi Asset Allocation Fund (MAAFs) has been the single biggest structural winner in the entire hybrid segment over five years: from ₹14,795 Cr (Mar-21) to ₹26,591 Cr (Mar-23), and then an explosion to ₹1,73,762 Cr by Mar-26. Its share of hybrid AUM has surged from 4.1% (Mar-21) to 16.8% (Mar-26) — the largest positive shift of any hybrid sub-category. Net inflows tell the same story: FY22: ₹1,498 Cr → FY23: ₹6,070 Cr → FY24: ₹33,054 Cr → FY25: ₹34,786 Cr → FY26: ₹65,209 Cr.
The fuel for the growth of this category has been precious metals. Gold rose 21% in value in 2024 alone in INR terms, before surging a further ~55% in 2025. Because SEBI mandates MAAFs invest at least 10% each in equities, debt and commodities, these funds had built-in exposure to the precious metals rally. When equity markets struggled in late 2024 and 2025, the gold and silver allocation cushioned returns and made MAAFs standout performers. Multi-asset funds delivered an average return of 17.4% in 2025, even as equity markets struggled. Flows followed performance, and the changes in debt fund taxation in 2023 and 2024 removed indexation benefits, pushing investors toward alternatives — multi-asset funds quietly filled this gap.
TREND 4:
Overseas FOF: fighting regulatory handcuffs to capture a global market recovery
The story of overseas Fund of Funds in India is as much about regulation as it is about returns.
The AUM journey: ₹12,408 Cr (Mar-21) → ₹22,609 Cr (Mar-22) → ₹22,991 Cr (Mar-23) → ₹25,713 Cr (Mar-24) → ₹25,031 Cr (Mar-25) → ₹38,287 Cr (Mar-26). The flat line from Mar-22 to Mar-25 is not investor disinterest — it is the direct consequence of a regulatory wall. In January 2022, SEBI restricted mutual funds from accepting new investments in international funds as the industry breached the USD 7 billion limit. By April 2024, the USD 1 billion cap for overseas ETFs was also reached, leading to a complete ban on fresh inflows — no new lump-sum investments or SIPs permitted in most overseas equity schemes unless redemptions created room within the caps.
The flow data shows exactly what happened. FY22 saw strong inflows of ₹10,674 Cr as investors rushed into global markets. Then the gates closed: FY23 flows dropped to just ₹1,639 Cr, FY24 saw net outflows of ₹3,143 Cr, and FY25 was still negative at ₹2,065 Cr. Investors who wanted global exposure had essentially nowhere to go through the mutual fund route. Around 70 schemes in India focus on overseas investing, but their ability to accept new investments is constrained by industry-wide limits.
FY26 marks the first meaningful recovery: ₹4,826 Cr of net inflows, with acceleration clearly visible in monthly data — flows went from near-zero in the first half of FY26 (Apr–Jun 2025) to ₹962 Cr in September, ₹882 Cr in January 2026, and ₹904 Cr in February 2026. The trigger is performance, as the global and emerging market equity indices started recovering strongly — providing exactly the return differentiation that makes overseas diversification compelling for Indian investors. The AUM jumped from ₹25,031 Cr (Mar-25) to ₹38,287 Cr (Mar-26) in a single year — a 53% increase.
TREND 5:
SIP Book: A decade of compounding discipline, now crossing ₹32,000 Cr a month
March 2026 marked a watershed moment for Indian mutual funds: monthly SIP inflows crossed ₹32,087 Crore for the first time, setting an all-time high. This is not a one-month spike — it is the culmination of a decade-long structural shift in how India saves. Total SIP inflows for FY 2025-26 stand at ₹3,49,589 Crore — up 21% over FY25’s ₹2,89,352 Crore, and more than 8x the ₹43,921 Crore collected just ten years ago in FY 2016-17. The compounding of the SIP book itself has become one of Indian finance’s most reliable data stories.
The growth trajectory across fiscal years tells a clean story of acceleration: FY17: ₹43,921 Cr → FY18: ₹67,190 Cr → FY19: ₹92,693 Cr → FY20: ₹1,00,084 Cr → FY21: ₹96,080 Cr → FY22: ₹1,24,566 Cr → FY23: ₹1,55,972 Cr → FY24: ₹1,99,219 Cr → FY25: ₹2,89,352 Cr → FY26: ₹3,49,589 Cr. The only blip was FY21, when COVID disrupted household cash flows and many investors paused mandates. Every other year has been higher than the previous one.
The monthly data within FY26 is equally striking. April 2025 opened at ₹26,632 Cr — already higher than any single month before FY24. By September, inflows had crossed ₹29,000 Cr. December ’25 and January ’26 both touched ₹31,000 Cr. And March 2026 delivered the milestone: ₹32,087 Crore, the highest monthly SIP collection in the history of the Indian mutual fund industry. This was not driven by a single market event or an NFO surge — it reflects the quiet, persistent expansion of the SIP register, with new SIP registrations consistently outpacing discontinuations through FY26.
What makes this growth durable is its source. SIPs are not lump-sum market calls — they are standing instructions, auto-debited from bank accounts, renewed by inertia as much as by conviction. Once registered, most investors stay in. The expanding SIP book means the industry now enters every month with a guaranteed base of inflows that is structurally larger than the month before. At ₹32,000 Crore a month, the SIP run-rate alone exceeds the total equity inflows the industry used to see in an entire year as recently as FY17. India has built a savings machine — and it keeps getting larger.
TREND 6:
Market Share Shift — who gained, who lost, and what it says about where investors are moving their money
Total equity AUM more than doubled from ₹15,17,082 Crore in March 2023 to ₹31,97,698 Crore by March 2026 — a ₹16.8 lakh Crore expansion in three years. image.png
But this growth was deeply uneven across categories. Of the eleven equity sub-categories tracked by
AMFI, six gained market share, and five lost it. The divergence is not noise — it reflects a structural reallocation of investor preference that has been building since FY22 and is now clearly legible in the data.
The gainers: risk appetite moving up the curve. Sectoral and Thematic funds were the single biggest winners in equity, gaining 3.5 percentage points (pp) of share to reach 14.9% of equity AUM. Mid Cap (+1.0pp), Small Cap (+1.7pp), Multi Cap (+1.9pp), and Large & Mid Cap (+1.0pp) all gained ground — a consistent pattern of investors moving away from pure large-cap safety and toward higher-risk, higher-return mandates. Net inflows into these categories were substantial and deliberate: Mid Cap saw ₹1,10,898 Crore of net inflows over the period, Small Cap’s net inflows stood at ₹1,29,901 Crore. Crucially, in Mid Cap, 68% of the AUM growth came from mark-to-market appreciation — meaning investors who came in were rewarded, which in turn attracted more.
The losers: structural headwinds, not temporary underperformance. Large Cap lost 4.1 percentage points of equity AUM share — the steepest decline of any category — falling from 15.5% to 11.4%. This is not because Large Cap AUM shrank: it grew from ₹2,35,760 Crore to ₹3,66,045 Crore in absolute terms. But it grew far slower than the rest of the market. A significant reason is the persistent return gap: Large Cap funds as a category have struggled to beat their benchmark net of fees, making the case for passive alternatives increasingly compelling for the large-cap allocation. ELSS lost 3.2 percentage points, falling from 10.0% to 6.8% — a predictable consequence of the new tax regime removing the Section 80C deduction advantage that was historically the primary reason investors chose ELSS over other equity funds. Focused Fund shed 1.6 percentage points, reflecting lower new launches and investor preference for broader diversification mandates.
In a hybrid, the story is Multi-Asset Allocation’s dominance. Multi Asset Allocation Fund gained 11.2 percentage points of hybrid AUM share — from 5.6% to 16.8% — making it the single largest share shift of any category across both equity and hybrid segments. ₹1,28,309 Crore of net inflows in three years, against a base of just ₹26,591 Crore, tells you this was genuine new allocation, not just market appreciation. On the other side, the traditional hybrid anchors gave ground: Balanced / Aggressive Hybrid lost 9.7 percentage points, and Dynamic Asset Allocation / Balanced Advantage lost 11.2 percentage points — both categories that had been the default “one-stop” solution for moderate-risk investors, now facing competition from Multi Asset funds that offer a more complete, gold-inclusive mandate. Arbitrage Fund grew sharply in share (from 14.1% to 24.5%), but this is driven almost entirely by short-term institutional and HNI parking of money around tax-efficient liquid alternatives, not by retail conviction. Its MTM effect was negative at -₹14,460 Crore, confirming that the AUM growth is purely flow-driven.
The MTM data adds a further dimension to reading these share shifts. A high % Effect — the proportion of AUM growth coming from market returns rather than net inflows — tells you a category is being held more than it is being bought fresh. Mid Cap’s 68% MTM effect and Large Cap’s 36% MTM effect sit at opposite ends of this spectrum: Mid Cap investors were rewarded handsomely and stayed; Large Cap investors received less appreciation relative to the broader market, and many chose to redeploy elsewhere. The share shift is therefore not just a story about new money — it is also a story about where existing investors decided to stay.
(The author is Viraj Gandhi, CEO of Samco Mutual Fund)


Andrew McElroy is Chief Analyst at Matrixtrade, author of the ebook ‘Fractal Market Mastery’ and producer of the ‘Daily Edge.’ The ‘Daily Edge’ is emailed before each US session and outlines actionable ideas, directional bias, and important levels in the S&P500. It also looks at ‘What’s Hot,’ on any particular day, whether it is commodities, stocks, crypto, or forex. Andrew has developed a top-down proprietary system that starts with his weekend Seeking Alpha article focusing on the higher timeframes. Fractals, Elliott Wave, and Demark exhaustion signals are all incorporated, as are macro drivers and analysis of the market narrative. It is much more than just a few lines on a chart – it is a system developed over 15 years and proven to deliver a consistent edge. An independent trader since 2009, Andrew manages a family portfolio of stocks and ETFs with his wife and fellow Seeking Alpha contributor Macrogirl.
Analyst’s Disclosure: I/we have a beneficial long position in the shares of VOO either through stock ownership, options, or other derivatives. I wrote this article myself, and it expresses my own opinions. I am not receiving compensation for it (other than from Seeking Alpha). I have no business relationship with any company whose stock is mentioned in this article.
Seeking Alpha’s Disclosure: Past performance is no guarantee of future results. No recommendation or advice is being given as to whether any investment is suitable for a particular investor. Any views or opinions expressed above may not reflect those of Seeking Alpha as a whole. Seeking Alpha is not a licensed securities dealer, broker or US investment adviser or investment bank. Our analysts are third party authors that include both professional investors and individual investors who may not be licensed or certified by any institute or regulatory body.

I aim to provide alpha-generating investment ideas. I am an independent investor managing my family’s portfolio, primarily via a Self Managed Super Fund. My articles deliver 5-Minute Pitches focused on the core fundamental and technical drivers of the security.I have a generalist approach as I explore, analyze and invest in any sector so long there is perceived alpha potential vs the S&P500. The typical holding period ranges between a few months to multiple years.I am very much focused on adding value via alpha generation. I always start with a Performance Assessment section for each follow-up article. I publish unusually detailed analytics on my long-only, zero-leverage global equity portfolio performance on my Hunting Alphas website every month. At Hunting Alphas, you can also access the models to all the tickers I publish on.A bit about how I approach research and coverage of a stock:I build and maintain spreadsheets showing historical data on the financials, key metric disclosures, data on the guidance and surprise trends vs consensus estimates, time-series values of the valuations vs peers, data on key coincident or leading indicators of performance and other monitorables. In addition to the company’s filings, I also keep tabs on relevant industry news and reports plus other people’s coverage of the stock. In some cases, such as during times of a CEO change, I will do a deep dive on a key leader’s background and his/her past performance record.I very rarely build DCFs and project financials many years out into the future as I don’t think it adds much value. Instead, I find it more useful to assess how a company has delivered and the broad outlook on the 5 key drivers of a DCF valuation: revenues, costs and margins, cash flow conversion, capex and investments and the interest rates (which affect the discount rate/opportunity cost of capital). In some cases, especially for companies trading at very high multiples on a TTM or 1-yr fwd basis, I do a reverse DCF to make sense of the implied growth CAGR implications.Note: Hunting Alphas is related to VishValue Research on Seeking Alpha.
Analyst’s Disclosure: I/we have no stock, option or similar derivative position in any of the companies mentioned, and no plans to initiate any such positions within the next 72 hours. I wrote this article myself, and it expresses my own opinions. I am not receiving compensation for it (other than from Seeking Alpha). I have no business relationship with any company whose stock is mentioned in this article.
Seeking Alpha’s Disclosure: Past performance is no guarantee of future results. No recommendation or advice is being given as to whether any investment is suitable for a particular investor. Any views or opinions expressed above may not reflect those of Seeking Alpha as a whole. Seeking Alpha is not a licensed securities dealer, broker or US investment adviser or investment bank. Our analysts are third party authors that include both professional investors and individual investors who may not be licensed or certified by any institute or regulatory body.


Germany’s Merz, Brazil’s Lula stress close European-Brazilian cooperation


Ukraine pushes for Europe to build defense system against ballistic weapons

BNY Mellon Appreciation Fund Q1 2026 Commentary

“Permission to operate international passenger flights at Mashhad Airport has been issued, starting tomorrow,” state TV said, quoting the Civil Aviation Organisation.
The organisation later said travellers can now “purchase tickets for international routes to and from Mashhad Airport,” according to the official IRNA news agency.
Iranian airports have been closed since the outbreak of war with Israel and the United States on February 28.
The Civil Aviation Organisation had said earlier that it would start a phased reopening of Iran’s airspace, beginning with transit flights, followed by operations from eastern airports.
Airports in Tehran — Imam Khomeini and Mehrabad airports — are expected to reopen in the third phase, with western airports resuming operations in the final phase.

Fred Alger Management, LLC (“Alger”) is a privately held $27.4 billion growth equity investment manager. Alger is a pioneer of actively managed, growth equity investing. Their journey over the past six decades has been defined by navigating change, embracing disruption, and investing in innovation. Note: This account is not managed or monitored by Fred Alger Management, and any messages sent via Seeking Alpha will not receive a response. For inquiries or communication, please use Fred Alger Management’s official channels.

syahrir maulana/iStock via Getty Images

Dear Partners,
The first quarter of 2026 gave investors plenty to worry about. Rising tensions in the Middle East pushed oil prices higher, inflation concerns resurfaced, and the long-anticipated pivot to lower interest rates continues to be postponed. Markets, never short on imagination, have begun spinning familiar narratives: that expensive money punishes growth, that AI’s promises may exceed its near-term returns, and that the safer bet lies in energy, cyclicals, and businesses whose cash flows arrive sooner rather than later. There is also a growing fear that AI itself may disrupt entire categories of existing software businesses — rendering yesterday’s winners obsolete overnight.
We will not pretend these concerns are frivolous. They are not. When the cost of capital rises, the arithmetic of investing genuinely changes — a dollar earned a decade from now is worth less today than it was in a world of cheap money. That is not opinion; it is math. And we have always believed in taking math seriously.
But here is what we have also learned, after watching markets swing from greed to panic across many cycles: the headlines that feel most urgent are rarely the ones that determine long-term outcomes. The businesses that compound wealth over decades do so not because they were spared from difficult environments, but because they were built to endure them. We have spent the past decade building a portfolio of exactly that kind.
None of what we are seeing today is new. Different costumes, same play.
Performance in Context
During the first quarter, Rowan Street declined 19.8%, compared to a 4.3% decline for the S&P 500. That is not a result we enjoy reporting. At the same time, it reflects the more concentrated approach we take and is not unusual for portfolios built around a smaller number of high-conviction investments.
We invest in a focused group of businesses that we believe can compound value at attractive rates over long periods of time. In the short term, their stock prices can be more volatile—particularly in environments like the one we are experiencing today, where interest rates are higher and investor focus has shifted toward businesses with nearer-term cash flows.
Rowan Street is designed for long-term compounding, not for minimizing short-term volatility or closely tracking a benchmark. As a result, returns can differ meaningfully from year to year.
We have seen this before.
In early 2022, we went through a similar period where stock prices declined sharply, even as the underlying businesses continued to perform well. At the time, we wrote that the portfolio was, in many ways, in one of the strongest positions in our history despite the decline in stock prices.
That did not feel obvious at the time. What followed was a period where business performance ultimately reasserted itself. The fund returned +102.6% (net) in 2023, +56.6% in 2024, and +11.1% in 2025.
As Benjamin Graham observed:
“In the short run, the market is a voting machine, but in the long run, it is a weighing machine.”
A Post-Quarter Update
We are writing this letter in mid-April, approximately two weeks after quarter-end. Since March 31, markets have moved sharply — and our portfolio has recovered approximately half of the first quarter decline. Based on our internal estimates as of April 17, year-to-date performance stands at approximately -10%, compared to the official quarter-end figure of -19.8%. We note that this mid-month figure is an internal estimate only, has not been verified by our fund administrator, and reflects only a partial month.
We share this not to suggest the difficult period is behind us — it may not be. We share it because it illustrates precisely the point we are making throughout this letter. The fundamentals of the businesses we own have not changed. Their competitive positions, earnings power, and long-term prospects remain intact, in our view. What changed was the price multiple. This is what long-term ownership of exceptional businesses actually looks like. Price and value diverge. Sometimes dramatically. The investors who benefit are those with the temperament to remain focused on the underlying businesses, not the day-to-day movements of their stock prices.
Volatility is the Price of Admission
The table below shows the annual returns of our largest holdings by portfolio weight as of March 31, 2026 and illustrates a simple reality of long-term investing: even exceptional businesses experience significant volatility. We have included an April 17 column to reflect the meaningful recovery in our portfolio since quarter-end, as discussed in the Performance section above. The figures reflect annual stock price returns and do not represent Rowan Street Capital fund performance or returns achieved by the fund on these positions.
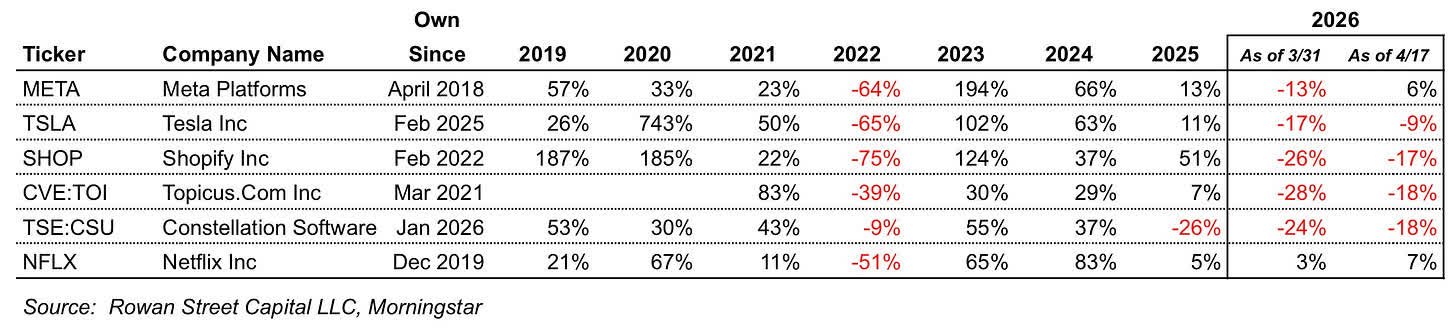
The April 17 column tells its own story — and it is the same story this letter is built around. This is what long-term ownership actually looks like in practice. Not a smooth upward line — but a recurring series of gains, losses, and tests of conviction. Drawdowns of 30%, 50%, even 75% are not unusual. They are a recurring feature of owning exceptional businesses — not anomalies.
Everyone describes themselves as a long-term investor. Very few are willing to endure what that actually looks like. Volatility is the price of admission.
The charts that follow bring this pattern to life across three of our largest holdings — Meta Platforms, Tesla, and Shopify. Different businesses, different drawdowns, same lesson.
Meta Platforms (META)
Meta has delivered a cumulative return of approximately 1,300% since its IPO, or about 21% annually. The path to those returns, however, has been anything but smooth.
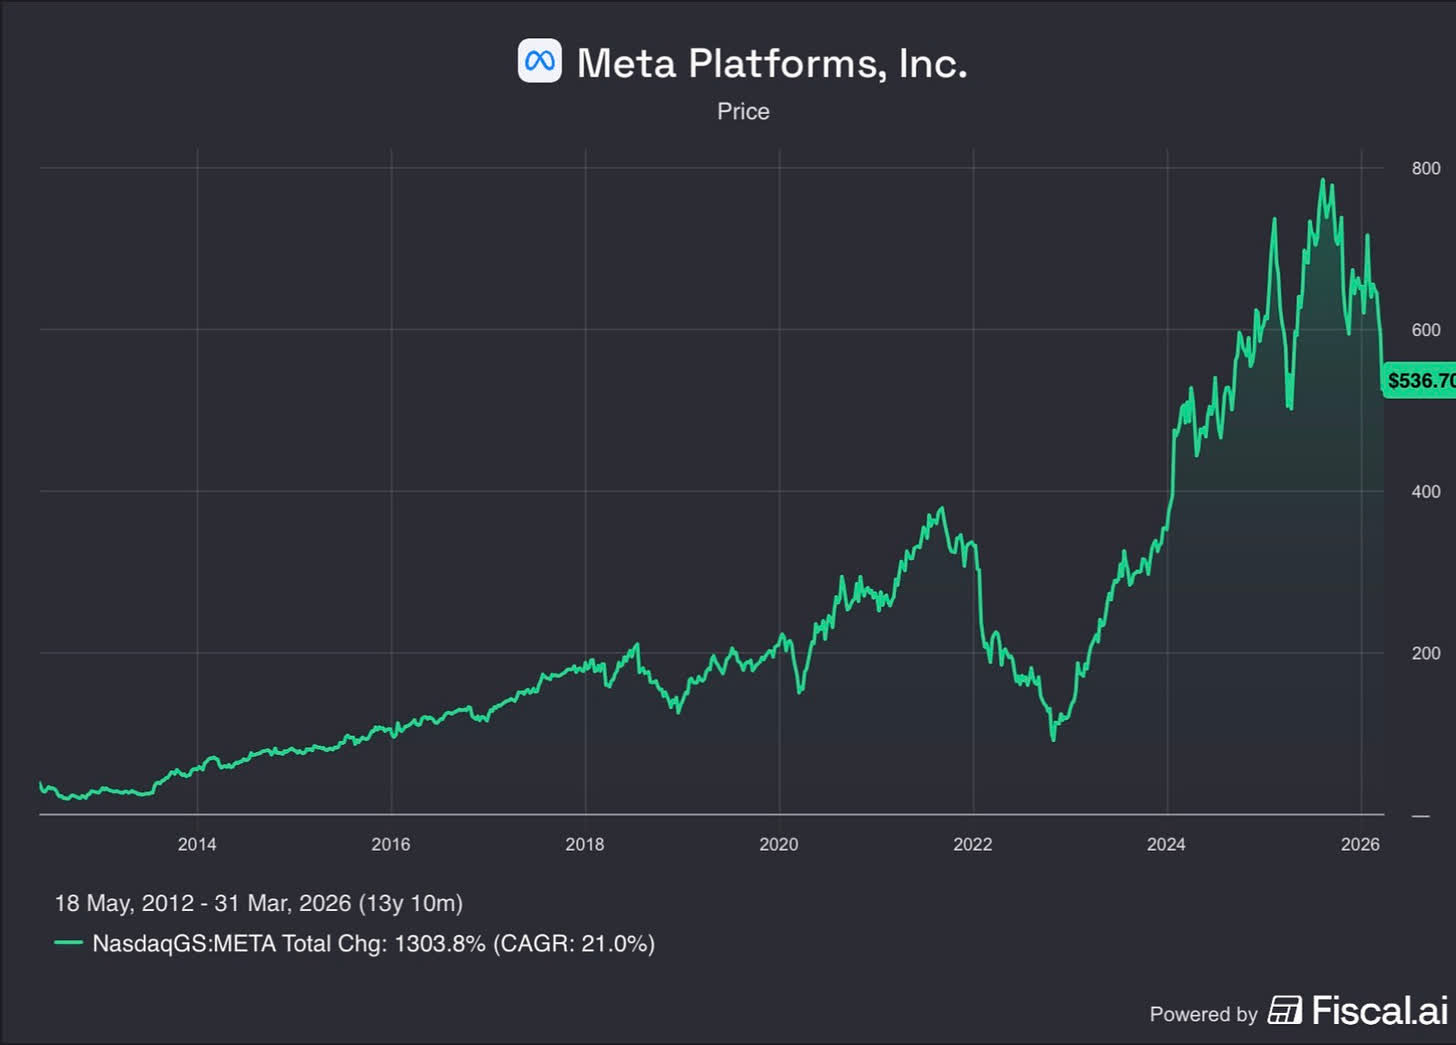
Over the past decade, the stock has experienced numerous drawdowns of 30% or more, several declines of 50% or more, and, most notably, a decline of nearly 80% in 2022.
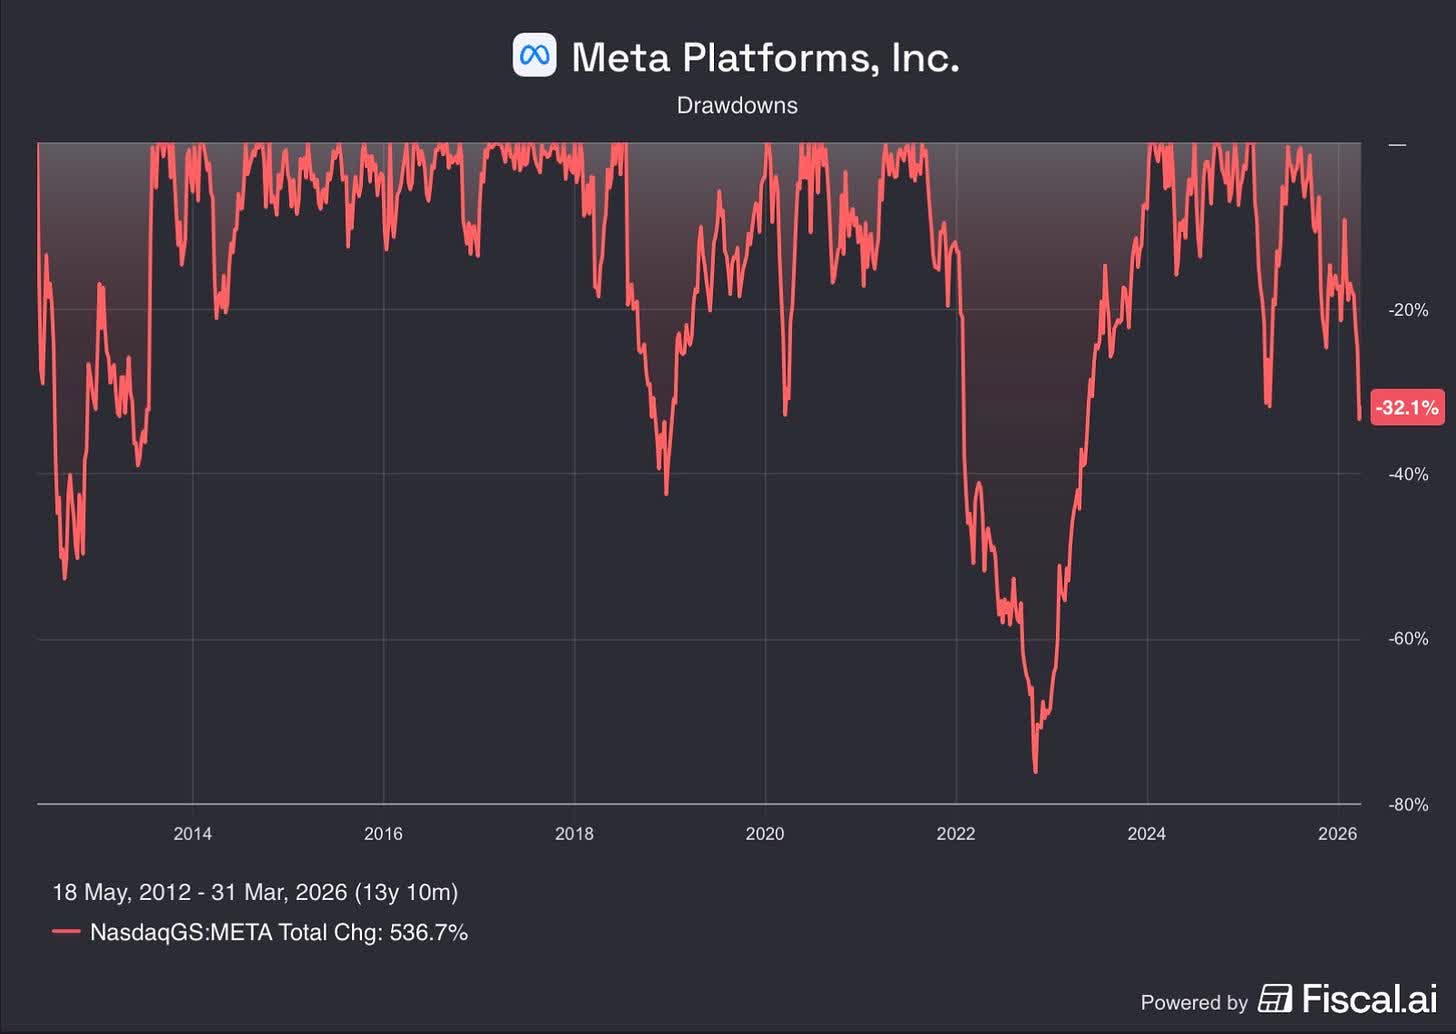
These periods were not isolated events — they were a recurring feature of owning this business. And yet for those who remained focused on the underlying fundamentals, the long-term outcome has been exceptional.
We believe today represents one of the most compelling opportunities in Meta we have seen since 2022. Please read our full analysis below — including our views on the AI spending debate, the recent legal setbacks, and why we believe the market may be repeating a familiar mistake.
Tesla (TSLA)
Tesla provides an even more striking example—not just of volatility, but of how disproportionate long-term outcomes can be relative to the experience along the way.
Since its IPO in 2010, the stock has delivered a cumulative return of approximately 22,000%, or about 41% annually. Looking at that result today, the path can appear almost inevitable. In reality, it was anything but.
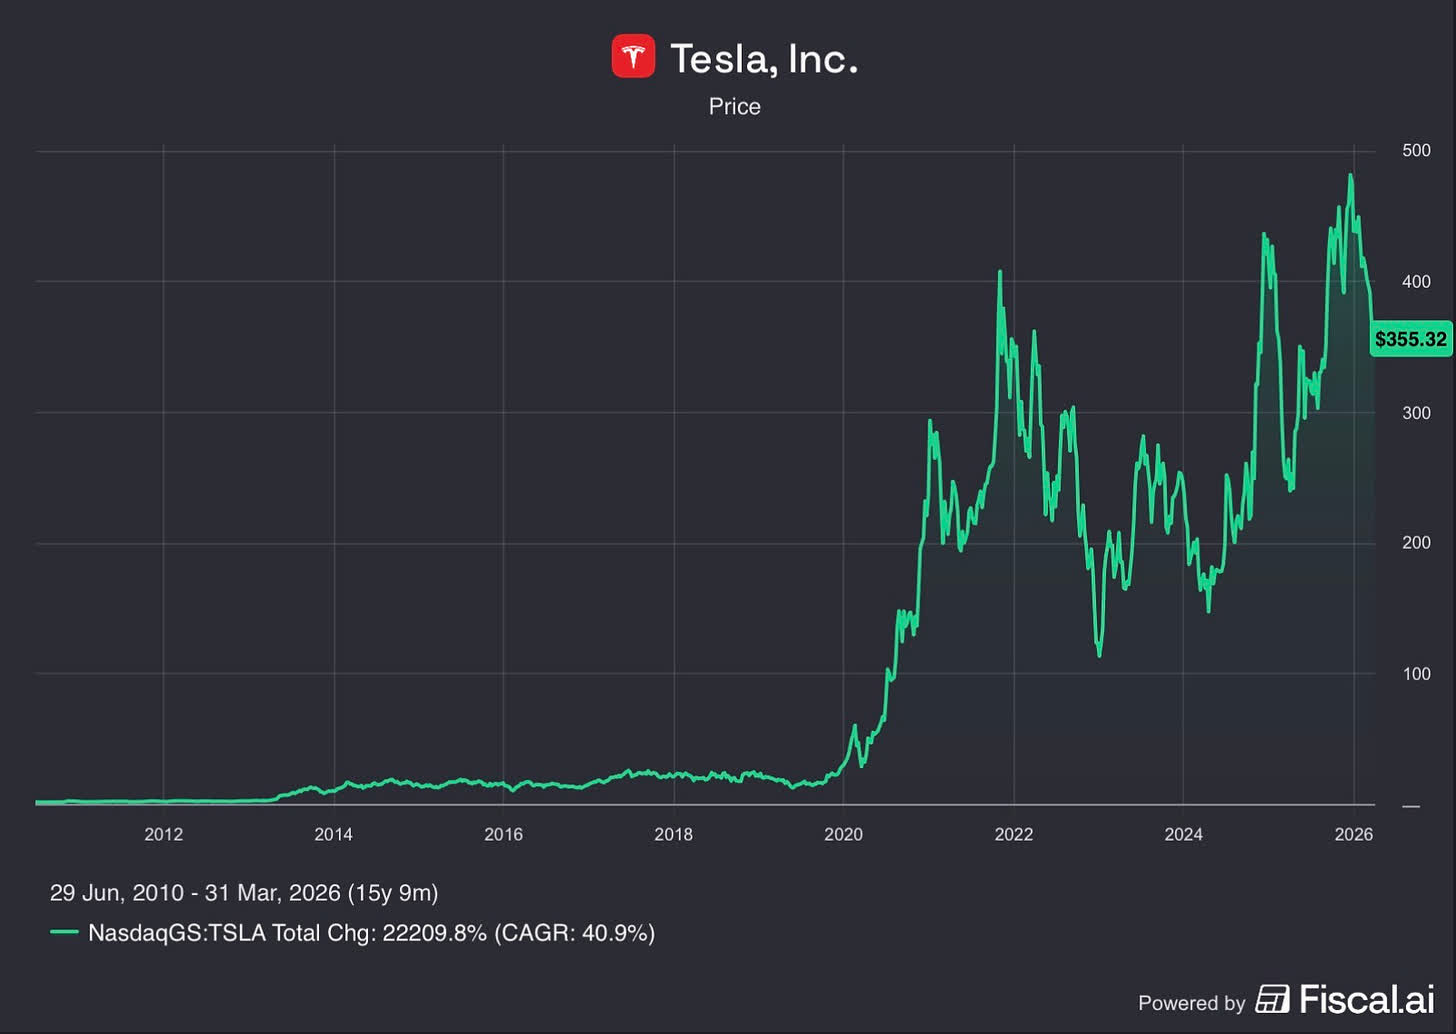
There were multiple periods along the way where the stock declined sharply—on numerous occasions by more than 50%, and once by over 70%—often accompanied by shifting narratives around the business. At different points, the concerns ranged from questions about the company’s survival, to valuation, to increasing competition, founder behavior and execution risk.
Each of those moments felt uncertain in real time. And yet, for investors who were able to remain focused on the long-term trajectory of the business, the outcome has been extraordinary.
The biggest winners rarely feel comfortable to own.
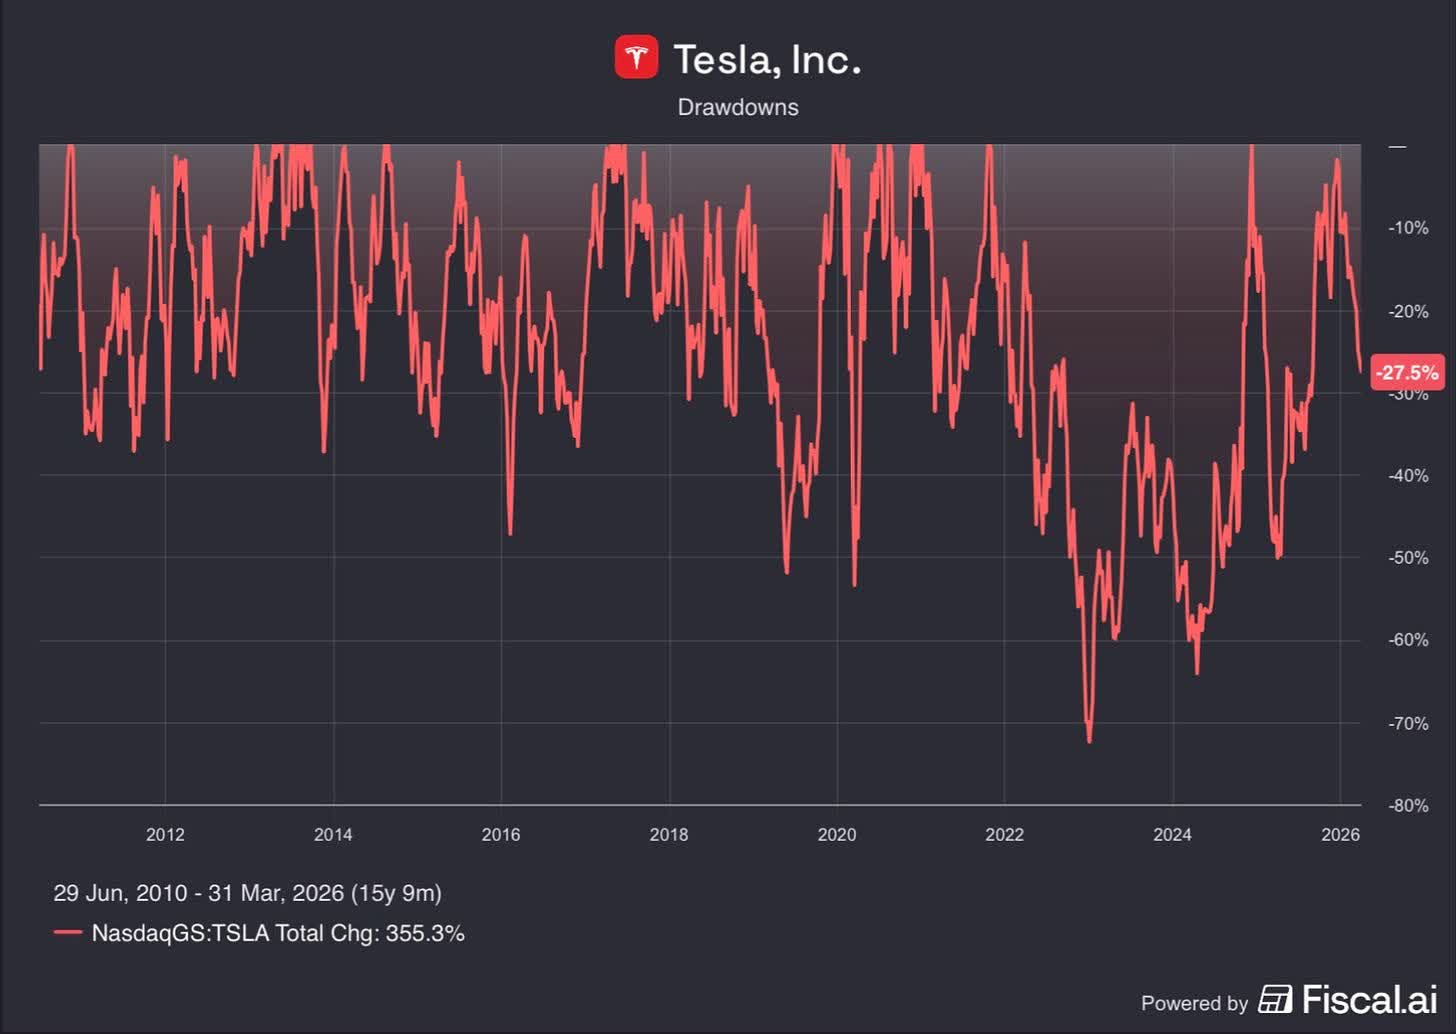
While Tesla has demonstrated this pattern over many years, our ownership of the business is still relatively recent.
We outlined our investment thesis in detail in our Q3 2025 letter, and our view remains unchanged. From here, our role is not to predict short-term movements, but to remain disciplined and allow the long-term economics of the business to play out.
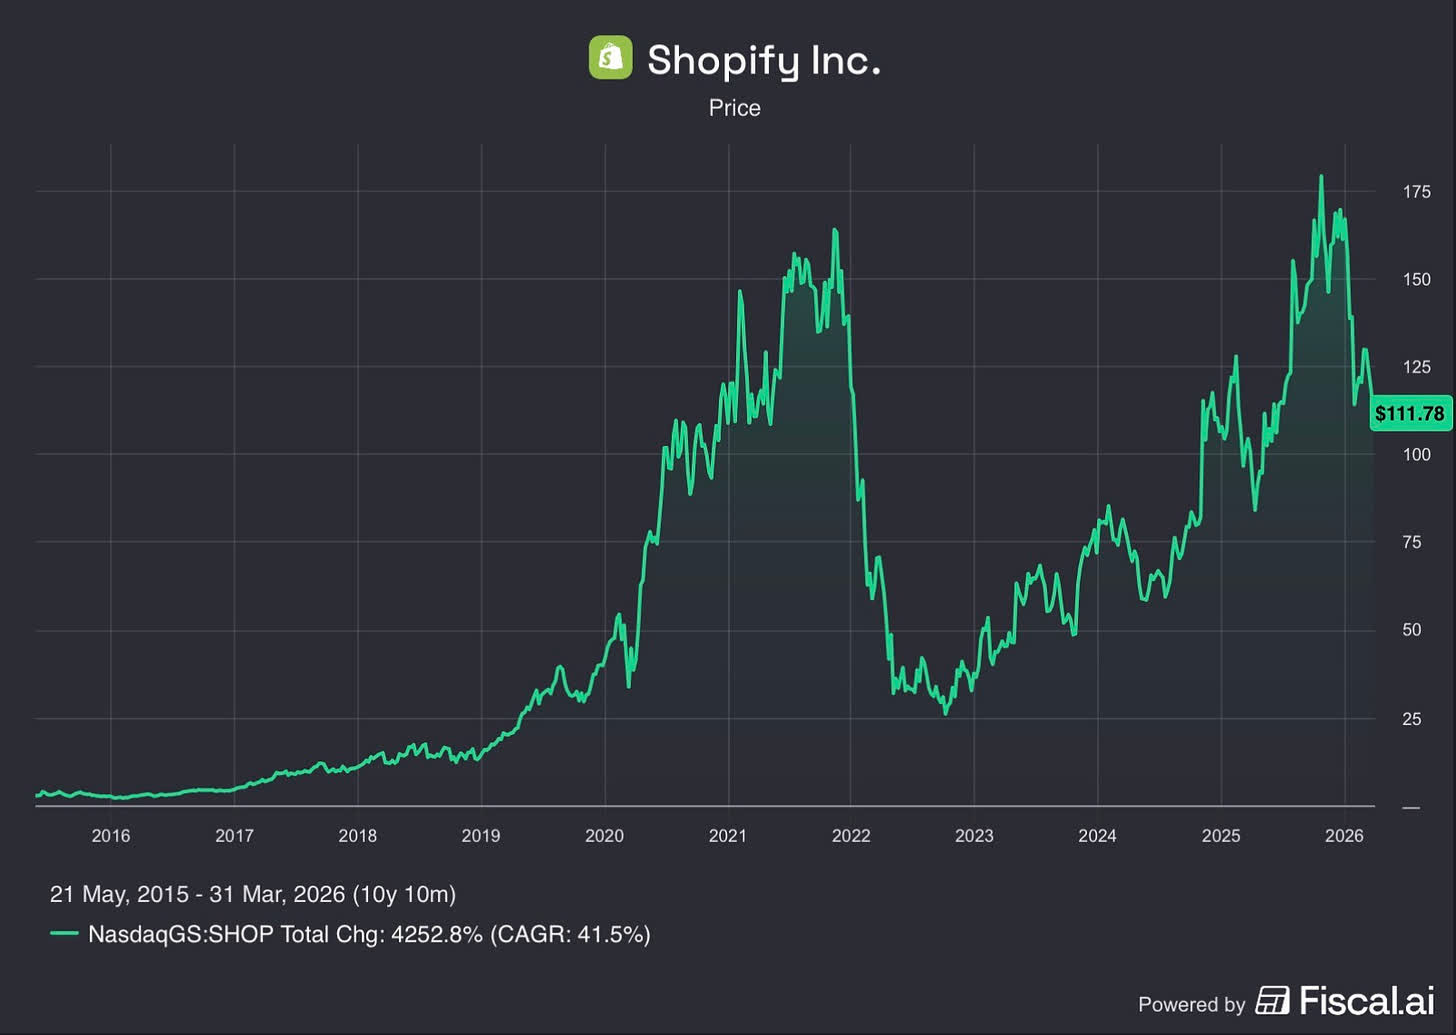
Shopify (SHOP)
Shopify has been an exceptional business over time, compounding at over 40% annually since its IPO.
The path to those returns, however, has been far from smooth, including several sharp drawdowns and a decline of more than 80% in 2022.
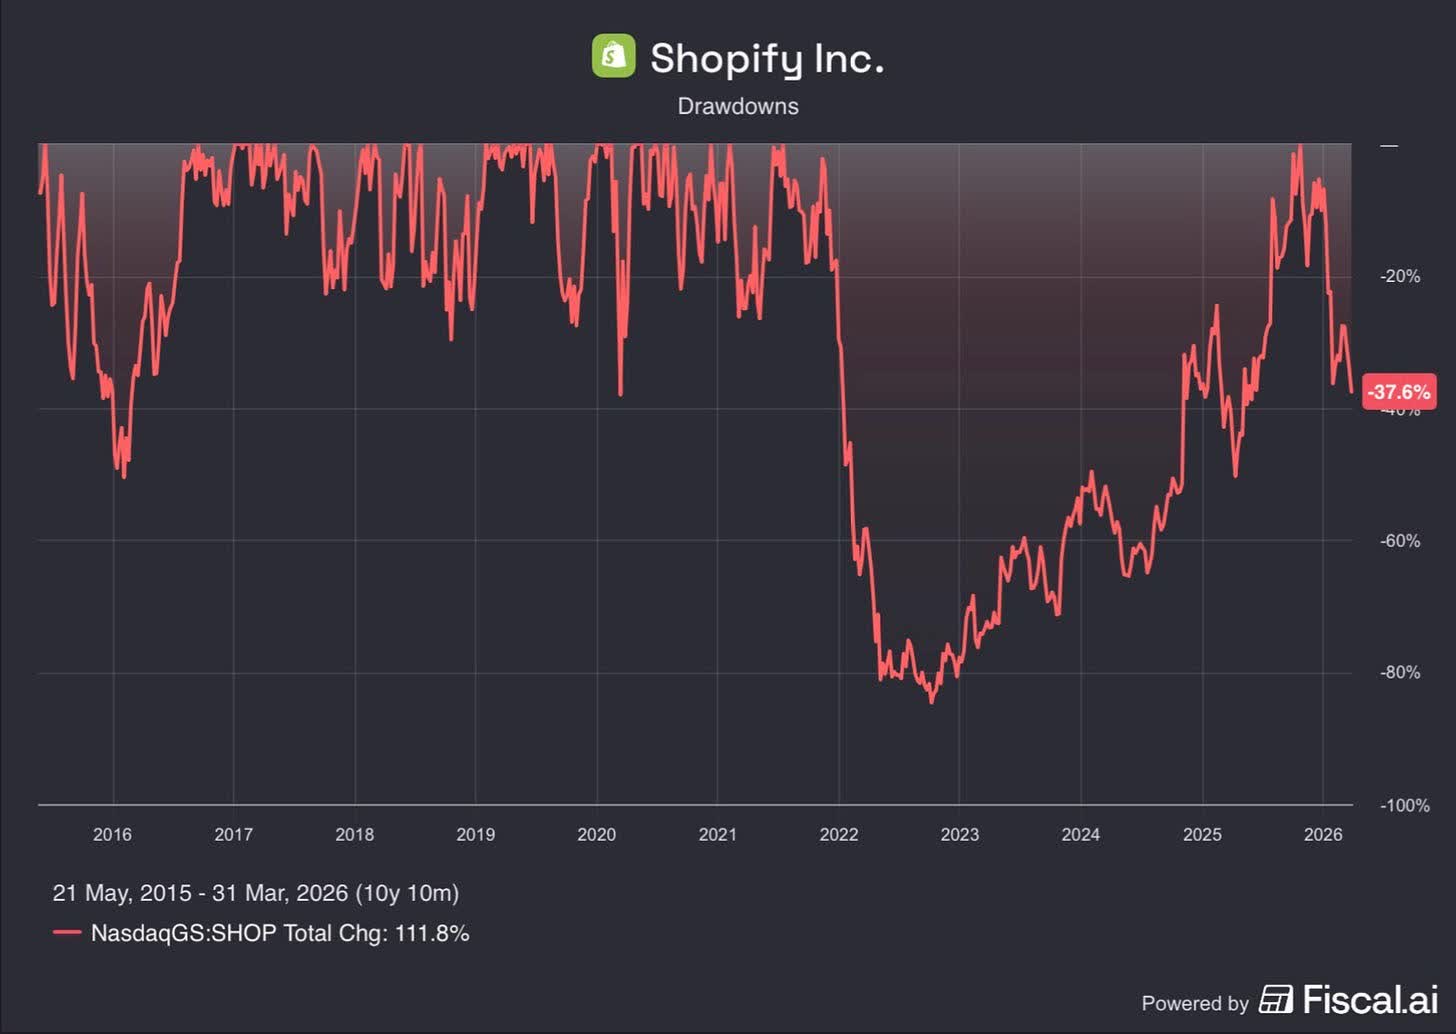
We experienced this firsthand. After initiating our position in early 2022, the stock declined by an additional ~50%. We believed the drawdown reflected multiple compression, not fundamental deterioration. The business continued to grow revenues, expand its merchant ecosystem, and strengthen its competitive position. The price was broken. The company was not.
It did not feel good. The best opportunities rarely do.
What followed was a long and uncomfortable period of patience before payoff. The stock rebounded 124% in 2023 — and yet we were still underwater on our investment. It was not until 2024 — when Shopify generated over $1 billion in operating profit for the first time and the stock gained another 37% — that we finally got our capital back and began generating real returns. The stock then rose 51% in 2025, making it our best performer of the year.
Three years of patience. Three years of watching the business execute while the stock tested our conviction repeatedly.
More recently the stock has again declined meaningfully — down 26% at quarter-end, though it has since recovered to approximately -17% as of mid-April. There is nothing unusual about that. It is the same pattern, playing out again.
Shopify is a clear example of why patience — especially through periods of valuation compression — is often required before fundamentals are fully reflected in stock prices. In our experience, the returns in businesses like Shopify are earned by those willing to endure periods when stock prices and business performance temporarily move in opposite directions.
Underlying Business Performance
Despite the recent decline in stock prices, the underlying businesses we own continue to perform well. Based on current estimates, our portfolio companies are expected to grow revenues at approximately 18% annually and earnings at approximately 21% annually over the next several years. These figures represent a weighted average across a group of businesses operating in different industries and geographies.
In our experience, periods like this — when price and value diverge — have consistently provided the most attractive investment opportunities.
In our Q2 2025 letter, we wrote that our edge does not come from predicting short-term market movements, but from our willingness to own a concentrated group of high-quality businesses and remain focused on their long-term compounding potential.
That principle is far easier to articulate when markets are rising than when they are declining. Periods like the one we are experiencing today are when that discipline is tested — and, in our view, when it matters most.
Portfolio Update: Constellation Software
During the quarter, we initiated a position in Constellation Software (TSE: CSU) (CNSWF), funded by the sale of the remainder of our Spotify position. Constellation is one of the most exceptional capital allocation platforms in the public markets — a company that has compounded shareholder capital at approximately 28% annually since its 2006 IPO by systematically acquiring and operating mission-critical vertical market software businesses. The stock has recently declined approximately 50% from its highs, creating what we believe is a rare entry point into a business of this quality. For those interested in a detailed discussion of our investment thesis — including our views on the AI disruption narrative and the recent leadership transition — we have published a full write-up on our Substack.
The Opportunity Today
We want to be direct with our partners and with anyone considering investing alongside us for the first time.
We have been here before — not just as observers, but as participants with real stakes. In 2021-2022, when our portfolio declined sharply we remained focused on the underlying businesses and their long-term prospects. We wrote at the time that we believed the portfolio was in one of the strongest positions in its history. Few wanted to hear it. Even fewer wanted to invest. What followed was a cumulative net return of approximately +252% over the subsequent three-year period (2023–2025).
We are not promising a repeat. No honest investor can make that claim.
But here is what we can say with conviction: the businesses we own today are stronger than they were in 2022. Their competitive positions are deeper, their earnings power is greater, and their long-term opportunities are larger. In many ways, we believe this is the strongest and most focused portfolio we have built since our inception in 2015 — a small group of exceptional businesses that have each been tested through adversity and emerged with their competitive positions intact or strengthened.
And yet their stock prices have declined meaningfully from recent highs. In our view, the gap between what these businesses are worth and what the market is willing to pay for them today is as wide as it has been since that period.
We have invested a significant majority of our personal net worth alongside yours. We earn nothing unless our partners make money. That is not a marketing line — it is the structure we chose deliberately on day one, because we believe it is the only honest way to manage other people’s capital.
Periods like this are never comfortable. They were not comfortable in 2022, and they are not comfortable today. But in our eleven years of managing capital through euphoria and despair, one lesson has proven itself repeatedly: it is precisely in these moments — when prices are low, sentiment is poor, and patience feels unrewarded — that the most important long-term returns are made.
To our existing partners — thank you for your continued trust and patience. We have been here before, and we remain as convicted as ever in the businesses we own together. If your circumstances allow, we believe adding to your investment at current levels represents one of the more compelling opportunities we have seen since 2022.
To those considering investing alongside us for the first time — if this way of thinking resonates with you, we would welcome the opportunity to partner over the long term.
Best regards,
Alex and Joe
Editor’s Note: The summary bullets for this article were chosen by Seeking Alpha editors.

Whether the twin blows affecting growth and inflation seen in purchasing manager indexes after the first month of the Iran conflict intensified during month two will be a key focus.
The initial take for April in economies from Australia to the US will be published on Thursday. Among those covered by Bloomberg forecasts, indexes in Germany, France, the euro zone and the UK are all anticipated to show broad deterioration, while the American indicators are seen little changed.
Ultimately, the numbers may point to the degree that stagflation is lurking. That ominous term – evoking the noxious mix of surging prices and stalling growth of the 1970s – was cited by Chris Williamson, chief business economist at PMI-compiler S&P Global, when summing up risks highlighted by the overall global measure in March.
The survey numbers follow a week of bleak stock-taking in Washington, where finance chiefs were warned by the International Monetary Fund of a range of potential outcomes that included a near-recession for the world. Notwithstanding the current Middle East ceasefire, the damage to growth and inflation can’t be easily undone.
“Even if the war ends tomorrow, it would take quite some time for the recovery to kick in,” IMF Managing Director Kristalina Georgieva told Bloomberg Television. “The impact is already baked in.”
For all the gloom, multiple policymakers remain cautious about how to respond. European Central Bank chief economist Philip Lane described how he and his colleagues may treat reports such as the PMIs when they set interest rates later this month.”We will have a rich set of survey data,” Lane said in Washington. “Of course, the people who are answering those surveys are looking at the same world we are looking at.” And for now, not many will have a decisive idea about what’s going to happen, he added.
ECB officials will also get French business confidence on Thursday and Germany’s closely watched Ifo business climate gauge on Friday. Their Federal Reserve peers will see the University of Michigan’s sentiment index, also at the end of the week.


US security agency is using Anthropic’s Mythos despite blacklist, Axios reports

Today’s NYT Strands Hints, Answer and Help for April 20 #778

Alan Shearer makes confident title prediction after Arsenal’s defeat to Man City | Football

Why Does the Next Fed Chair Own SOL Before His April 21 Hearing? Pepeto 300x Rotation Explained


-
 NewsBeat7 days ago
Pep Guardiola and Gary Neville agree over Arsenal title problem that benefits Man City
-

 Crypto World6 days ago
The SEC Conditionalises DeFi Platforms to Be Avoided for Broker Registration
-

 Fashion2 days ago
Weekend Open Thread: Theodora Dress
-

 Crypto World6 days ago
SEC Signals Exemption for Crypto Interfaces From Broker Registration
-

 News Videos5 days ago
Secure crypto trading starts with an FIU-registered
-

 Sports2 days ago
NWFL Suspends Two Players Over Post-Match Clash in Ado-Ekiti
-

 Crypto World6 days ago
SEC Proposes Certain Crypto Interfaces Don’t Need to Register as Brokers
-

 NewsBeat5 days ago
Trump and Pope Leo: Behind their disagreement over Iran war
-

 Business6 hours ago
Powerball Result April 18, 2026: No Jackpot Winner in Powerball Draw: $75 Million Rolls Over
-

 Politics2 days ago
Palestine barred from entering Canada for FIFA Congress
-

 Crypto World2 days ago
Russia Pushes Bill to Criminalize Unregistered Crypto Services
-

 Sports6 days ago
NWFL opens Pathway for new Clubs ahead of 2026 Season
-

 Politics11 hours ago
Zack Polanski demands ‘council homes not luxury flats for foreign investors’
-
 Entertainment6 days ago
Brand New Day’ Footage Reveals the Devastating Impact of ‘Now Way Home’
-
 Business3 days ago
Creo Medical agree sale of its manufacturing operation
-

 Crypto World7 days ago
Trump whales load up ahead of Mar-a-Lago luncheon.
-
 Crypto World7 days ago
Sei Network Enters Quiet Reset Phase as On-Chain Metrics Signal a Slowdown in 2026
-
Business7 days ago
Kering slides after Morgan Stanley downgrade, Gucci woes loom
-

 Tech7 days ago
Google adds E2E encryption to Gmail for iOS and Android enterprise users
-

 Tech7 days ago
Apple glasses won’t go brand shopping like Meta did with Ray-Ban and Oakley
You must be logged in to post a comment Login