
Crypto World
FanDuel Alternative Searches Keep Climbing and ZunaBet Is at the Center of the Conversation

There is a pattern forming in the online gambling market that is difficult to ignore. Players are searching for alternatives to the platforms they already know, and they are doing it in increasing numbers. FanDuel, long considered one of the pillars of the industry, is one of the brands most frequently appearing alongside the word “alternative” in search queries. This does not indicate that FanDuel has suddenly become a bad product. It indicates that the market around it has expanded and that players now have access to options that challenge the assumptions FanDuel was built on. Chief among those options is ZunaBet, a crypto-native casino and sportsbook that entered the market in 2026 with a platform so feature-rich that it immediately inserted itself into the conversation about where online gambling is heading next.
FanDuel: A Brand That Defined an Era
FanDuel helped shape what modern online gambling looks like in the United States. Its origin in daily fantasy sports gave it a head start in building a massive, engaged user base before the sports betting wave hit. When state-by-state legalization began opening the door to real-money wagering, FanDuel was ready. It expanded into sports betting and online casino gaming with speed and confidence, securing licenses across multiple states and locking in partnerships with some of the biggest names in professional sports.
Today, FanDuel operates a sportsbook that covers the full spectrum of American professional and college sports alongside international events in football, tennis, golf, motorsports, and more. Its casino section provides a solid collection of slots, table games, and live dealer experiences. The mobile app performs reliably and ranks consistently among the top gambling downloads in app stores. Brand awareness is extraordinarily high thanks to years of sustained advertising investment.
The payment experience on FanDuel reflects the era in which the platform matured. Bank transfers, debit cards, credit cards, PayPal, Venmo, and other established methods handle the movement of funds. These are familiar options that work without confusion for most users, even if they come with the processing times and transaction fees that are inherent to traditional financial systems.
FanDuel built a strong product for the conditions that existed when it grew. It optimized for US regulatory compliance, traditional payment accessibility, and broad mainstream appeal. Those were the right priorities at the time. But conditions have changed. Players now hold crypto. They expect instant transfers. They want game libraries that seem bottomless. They want loyalty programs that feel personal and exciting. The platforms meeting those new expectations do not look much like FanDuel, and that divergence is what is driving the search trend.
ZunaBet: A Platform That Arrived Ready
ZunaBet did not launch as a work in progress. When it went live in 2026, the platform presented a fully realized product that rivaled operators with years of additional runway. It is owned by Strathvale Group Ltd, managed by a team carrying more than two decades of collective industry experience, and licensed through an Anjouan gaming authority with registration in Belize. Every element of the platform reflects a deliberate decision to build for the crypto-native audience first and expand from there.
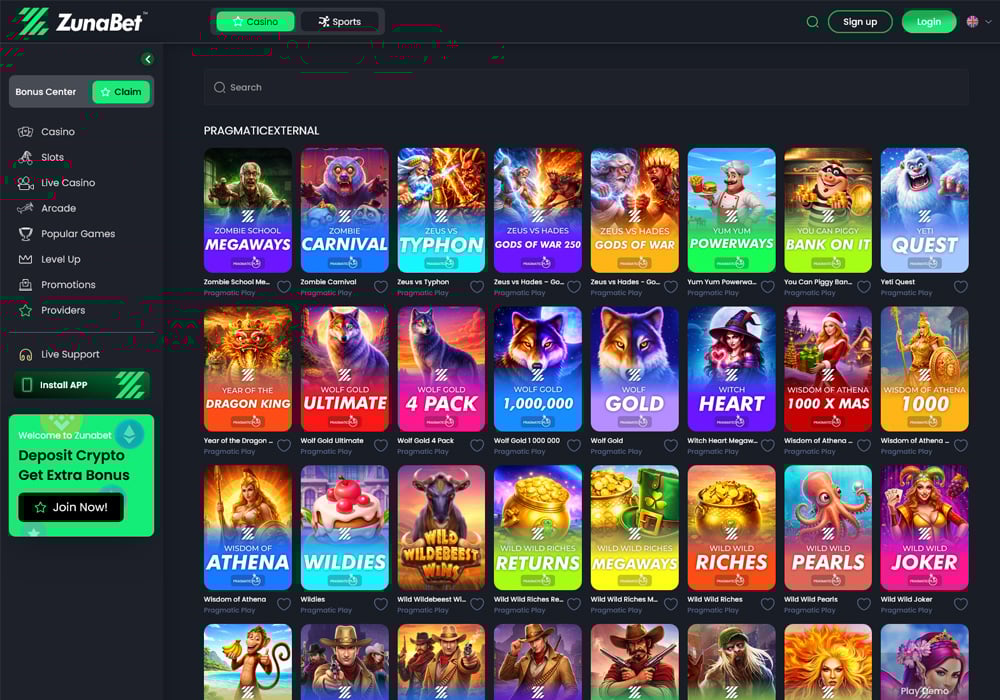
The game library is the most immediate evidence of that ambition. ZunaBet opened with 11,294 games drawn from 63 separate providers. That is not a goal or a projection. That is the number available to players from the first day. The providers contributing to this catalog include Pragmatic Play, Evolution, Hacksaw Gaming, Yggdrasil, BGaming, and a long list of additional studios that collectively ensure there is no gap in the offering. Slots naturally dominate the count, but the library extends meaningfully into RNG table games covering blackjack, roulette, baccarat, and poker variants, as well as a live dealer section that delivers the kind of real-time, studio-quality experience that has become essential for modern casino platforms.
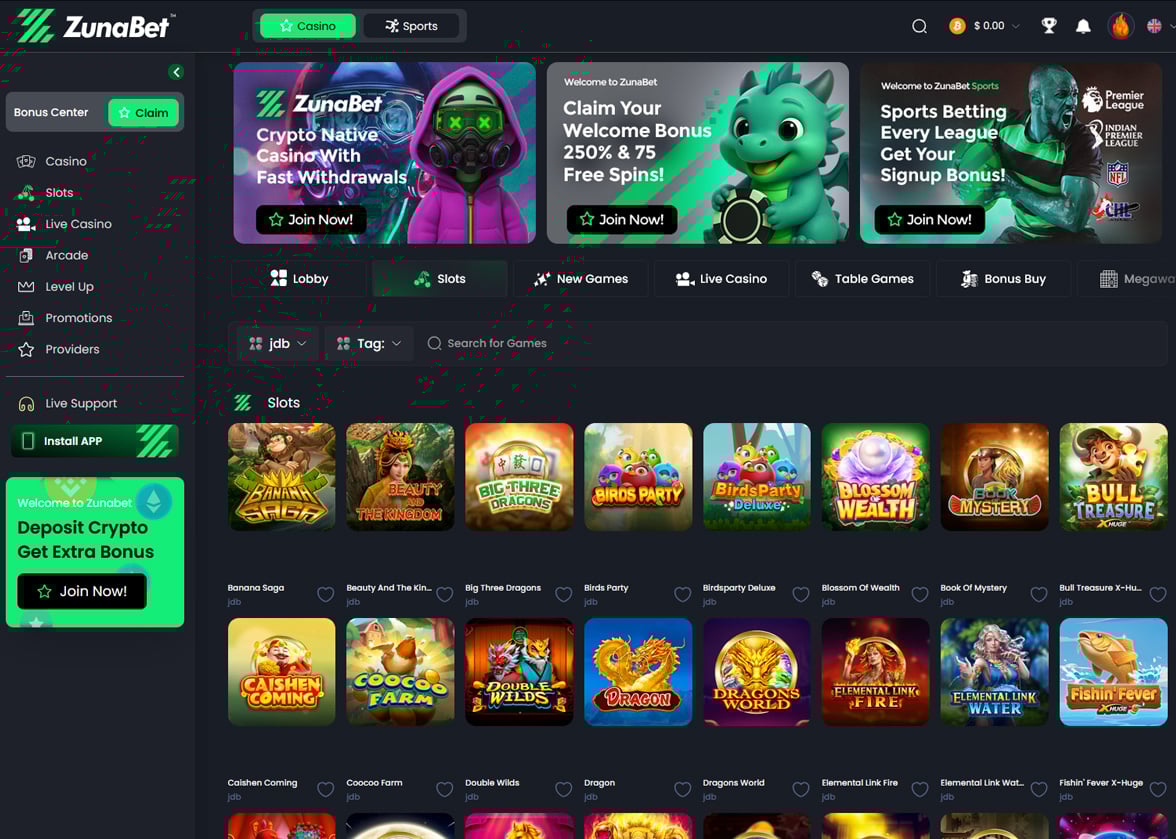
The practical effect of having over 11,000 games is that players never hit a wall. Discovery remains part of the experience for weeks and months rather than days. New providers and titles keep the catalog fresh, and the sheer volume means that even players with very specific preferences — whether that is a particular slot mechanic, a niche table game, or a specific live dealer format — are likely to find exactly what they want without compromise.
ZunaBet pairs this casino depth with a sportsbook that stands on its own merits. Coverage extends across football, basketball, tennis, NHL, combat sports, and virtual sports. Esports receives dedicated and comprehensive treatment with betting markets on CS2, Dota 2, League of Legends, and Valorant. This is a meaningful distinction from traditional platforms that either overlook esports entirely or offer a token handful of markets. Competitive gaming is not a passing trend. It is a global entertainment category with an audience that overlaps heavily with the demographic most likely to gamble online using cryptocurrency. ZunaBet recognized this overlap and built accordingly.
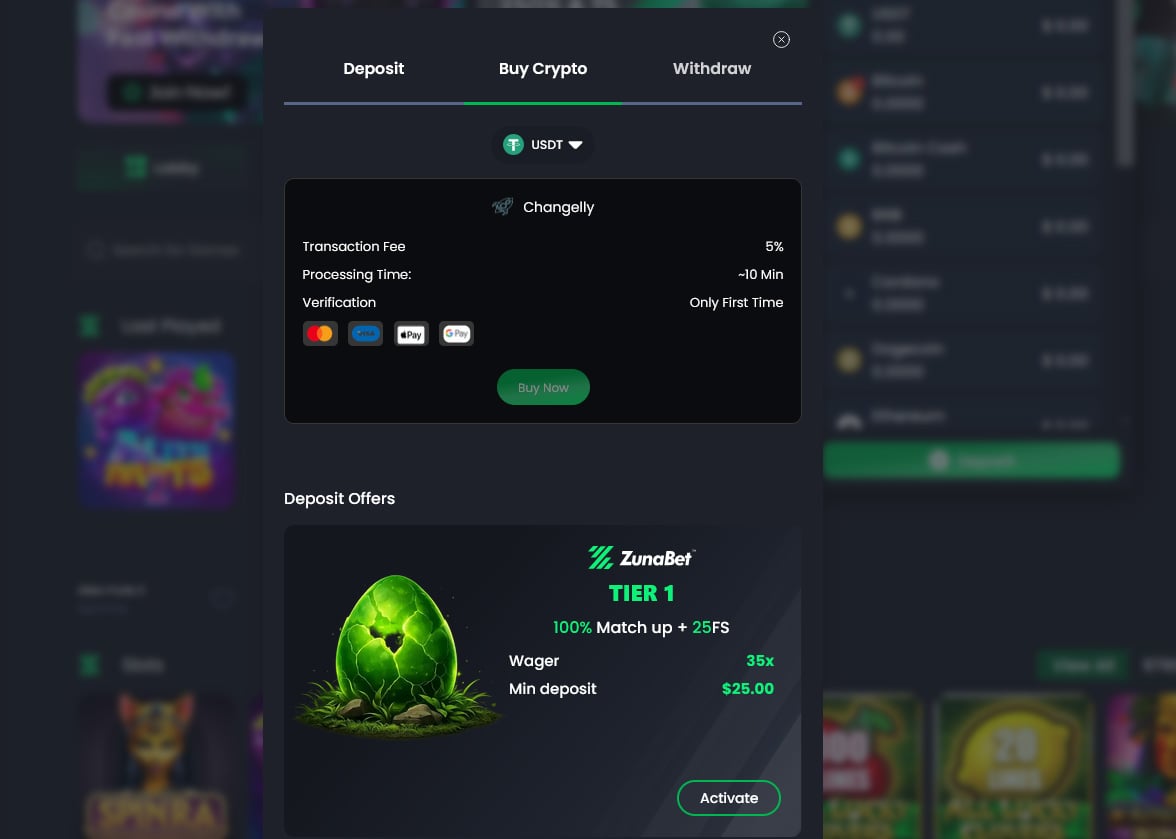
Cryptocurrency sits at the center of the payment experience. The platform accepts more than 20 coins and tokens including Bitcoin, Ethereum, USDT on multiple blockchain networks, Solana, Dogecoin, Cardano, and XRP. No processing fees are charged by the platform on any deposit or withdrawal. Speed is a defining feature — blockchain settlement means funds move in minutes rather than days, without the dependency on banking hours that traditional systems impose. Because ZunaBet was conceived as a crypto platform from its earliest design stages, there is no friction between the payment layer and the rest of the user experience. Everything flows from the same foundational logic.
The welcome offer provides up to $5,000 plus 75 free spins split across three deposits. The first deposit qualifies for a 100% match up to $2,000 and 25 free spins. The second delivers a 50% match up to $1,500 with another 25 spins. The third closes the package with a 100% match up to $1,500 and a final 25 spins. The multi-deposit structure serves a practical purpose beyond generosity. It gives players a reason to return after their first session, explore more of the library, and develop a relationship with the platform over time rather than treating it as a one-visit destination.
Technically, ZunaBet operates on HTML5 with a dark interface theme, fast load times, and responsive design that adapts seamlessly across screen sizes. Native applications are available for iOS, Android, Windows, and MacOS. Live chat support runs continuously, covering every hour of every day without interruption.
Crypto Infrastructure vs Traditional Payment Systems
The difference between crypto and traditional payment platforms in online gambling is not a minor technical detail. It is a core experience differentiator that affects how players interact with a platform during every single session.
Traditional payment infrastructure routes money through banks, card networks, and digital wallet services. Each intermediary in that chain introduces potential delays and costs. Deposit processing can be near-instant for some methods but slower for others. Withdrawals almost universally involve waiting periods that range from hours to several business days depending on the method selected, the day of the week, and any verification requirements the platform imposes. Transaction fees appear at various points — some charged by the platform, some by the payment provider, some by the player’s bank.
Crypto infrastructure operates on fundamentally different principles. Transactions settle on decentralized blockchain networks that run continuously. There are no business hours. There are no intermediary banks holding funds in pending status. When a player deposits Bitcoin or Solana into their ZunaBet account, the transaction confirms on the blockchain and the funds become available in minutes. Withdrawals follow the same path in reverse with comparable speed. The platform adds no fees of its own to any transaction.
This is not just faster. It is structurally different in ways that compound over time. A player who makes fifty deposits and fifty withdrawals over the course of a year saves meaningful amounts of both time and money on a crypto platform compared to a traditional one. Those savings are not theoretical. They accumulate in real terms with every transaction.
ZunaBet’s decision to build entirely on crypto infrastructure rather than bolting it onto a traditional system means the experience is consistent from end to end. There is no secondary payment path creating a disjointed experience. Every player interacts with the same streamlined, fee-free, fast-settlement system regardless of which specific cryptocurrency they choose to use.
Dragon Evolution vs Points Collection
The standard online casino loyalty program has not changed in any meaningful way in well over a decade. The formula is simple and universal — wager money to earn points, accumulate enough points to claim a reward, repeat indefinitely. It works as a basic retention mechanism, but it generates almost no emotional engagement. Players participate because the rewards exist, not because the process of earning them is interesting or enjoyable in any way.
ZunaBet designed its loyalty program to be an experience in itself. The dragon evolution system includes six progression tiers that each carry their own identity and reward structure. Squire begins at 1% rakeback. Warden increases to 2%. Champion reaches 4%. Divine climbs to 5%. Knight jumps significantly to 10%. Ultimate reaches the ceiling at 20% rakeback. At each tier, additional benefits unlock — free spins that scale from modest allocations at lower levels to 1,000 at the top, VIP club access, and double wheel spins. Tying the entire system together is Zuno, a dragon mascot that visually transforms as the player progresses upward through the ranks.
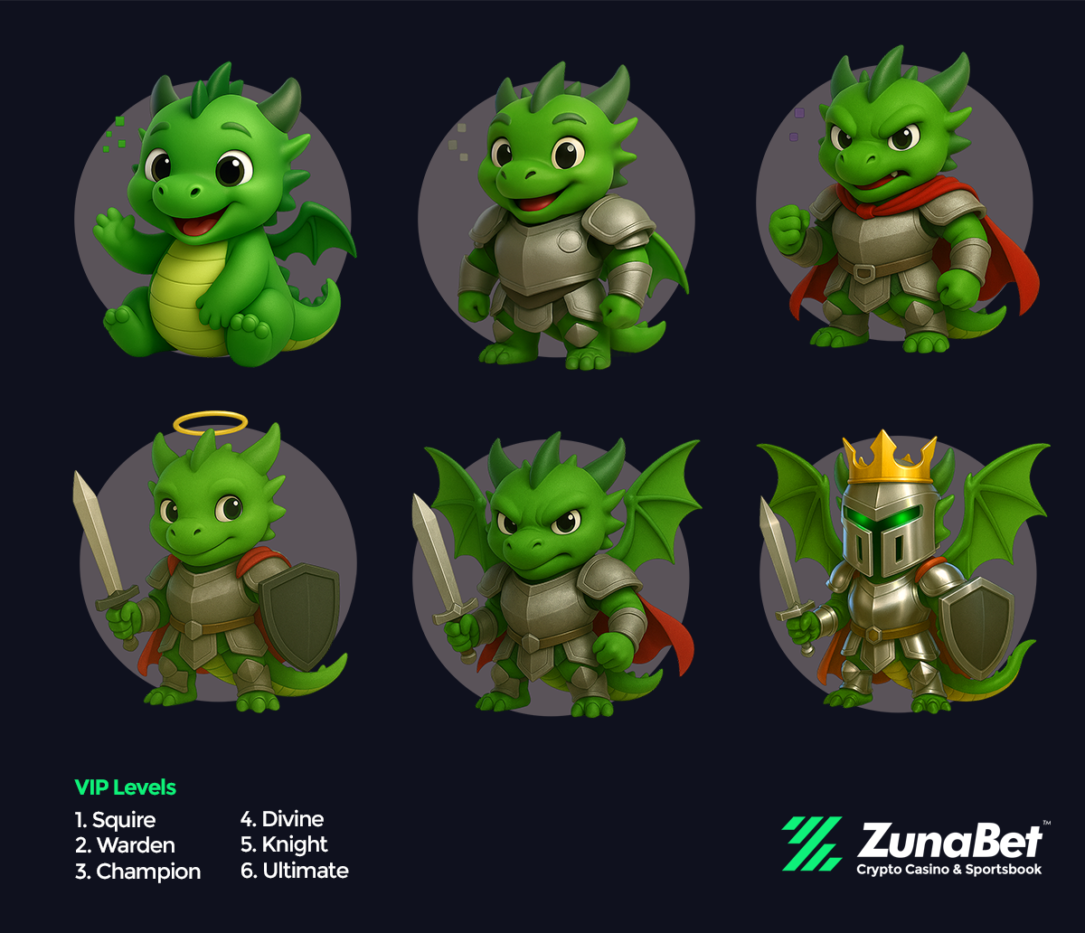
The structure mirrors the progression systems found in modern video games. There are defined levels with visible thresholds. Advancing feels like an achievement rather than an arbitrary accounting milestone. The rewards escalate meaningfully enough that reaching the next tier always feels worthwhile. And the visual evolution of the Zuno character gives players a tangible representation of their journey that a number on a screen simply cannot replicate.
This approach works because it aligns with how a large and growing portion of the gambling audience already thinks about engagement. Players who grew up with leveling systems, achievement badges, and progression-based unlocks in games understand this structure intuitively. It feels natural. It feels rewarding. And it gives them a reason to remain engaged with the platform beyond any individual session or bet.
What the Numbers Are Saying
The continued growth in searches for FanDuel alternatives tells a straightforward story about a market in transition. FanDuel built its position during a specific phase of the industry’s development and it built well. That position is not under immediate threat. The brand, the licenses, the user base, and the financial backing ensure that FanDuel will remain relevant for years.
But relevance and momentum are different things. The momentum in online gambling right now belongs to platforms that are solving the problems players actually talk about — slow payments, limited game variety, uninspiring loyalty programs, and a lack of crypto integration. ZunaBet addresses every one of those issues with solutions that are not incremental improvements but fundamental rethinks of how each element should work.
The players driving the search trend are not nostalgic for something old. They are looking forward. They want a platform that matches the speed, variety, and digital fluency they experience in every other area of their online lives. ZunaBet was built from the ground up to be that platform. It arrived with the game library of a veteran operator, the payment infrastructure of a blockchain-native fintech company, and a loyalty system that finally makes progression feel like something worth caring about. Every week, more players discover it. Every week, the search numbers confirm that discovery is accelerating. The trajectory is clear, and ZunaBet is riding it.
Disclaimer: This is a Press Release provided by a third party who is responsible for the content. Please conduct your own research before taking any action based on the content.


Crypto World
Why Does the Next Fed Chair Own SOL Before His April 21 Hearing? Pepeto 300x Rotation Explained

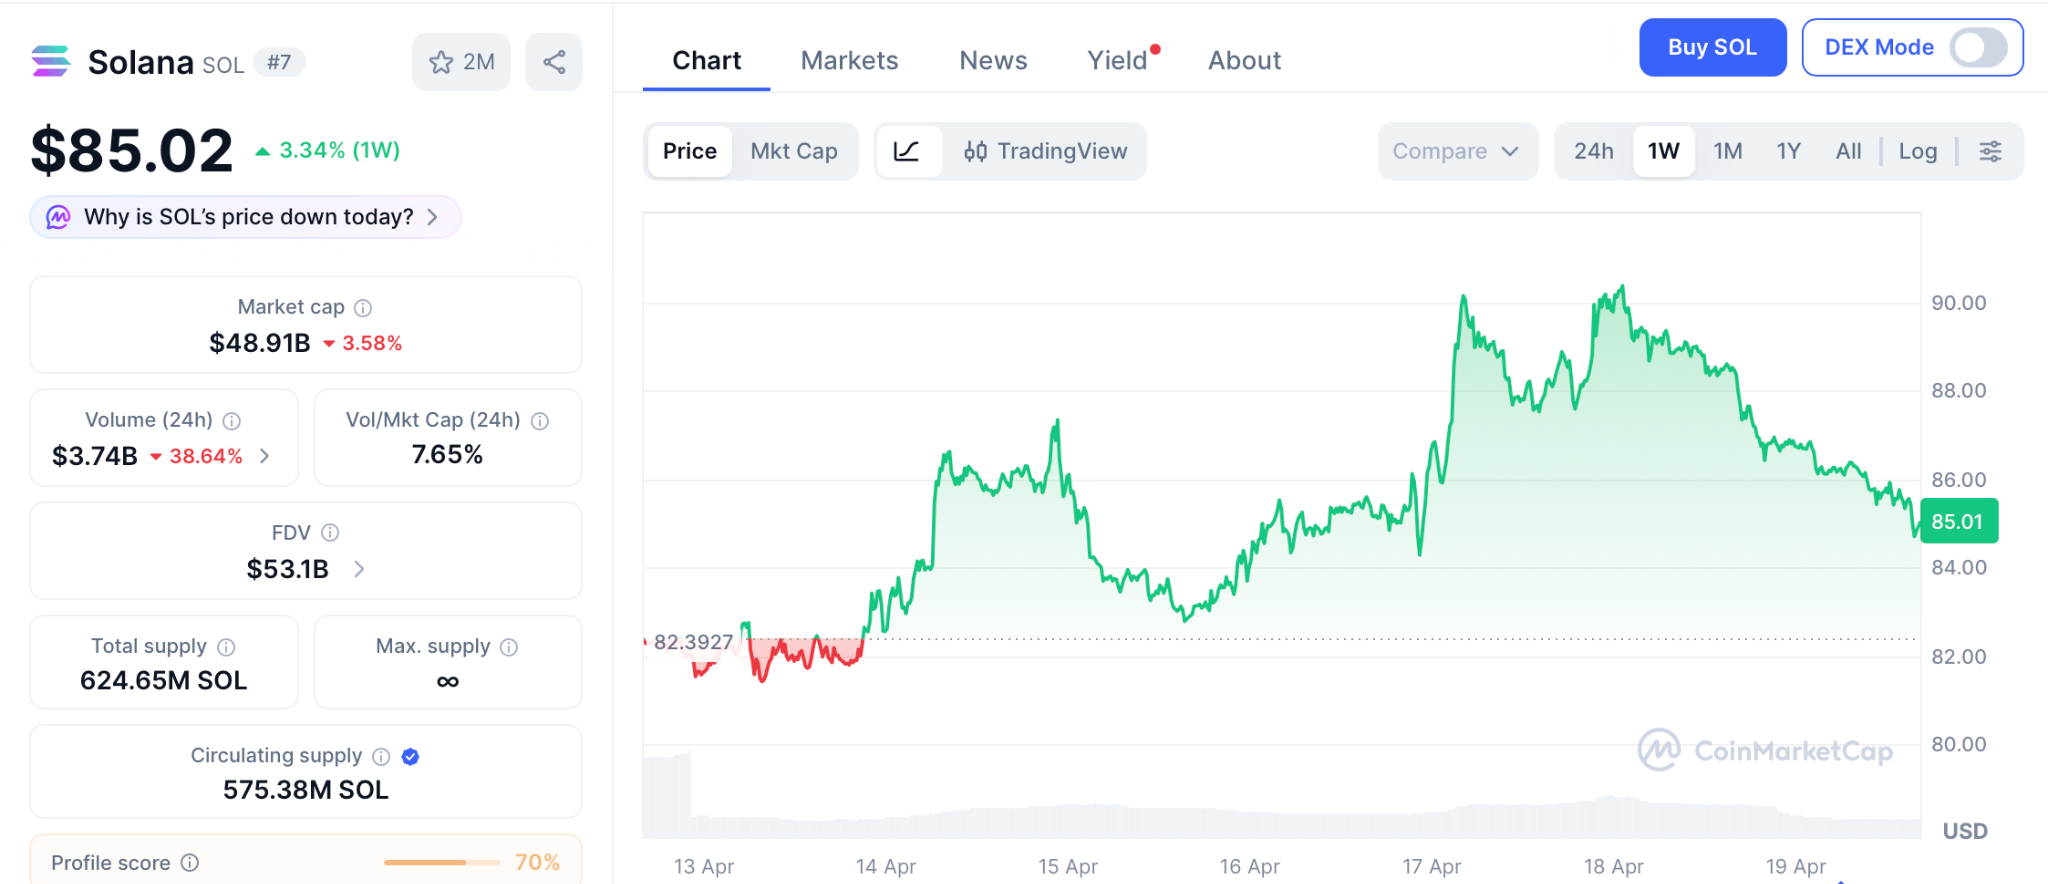
The solana price prediction just picked up a talking point nobody saw coming. Kevin Warsh, Donald Trump’s nominee to chair the Federal Reserve, disclosed indirect Solana holdings across multiple venture fund vehicles in his April 14 ethics filing, per Decrypt, with the Senate confirmation hearing locked for April 21. SOL trades at $85.02 with Bitcoin pushing past $77,300 and the tape finally turning green across the majors.
The numbers look strong, but SOL at a $50 billion market cap is simply too large to print the multiples that reshape a portfolio from a single position. That is where Pepeto steps in, a fresh presale trending hard across crypto feeds this quarter, carrying the kind of traction every cycle signals ahead of returns no large cap can match.
Warsh’s 69 page filing with the Office of Government Ethics lists indirect SOL positions held through the AVGF I venture fund alongside stakes in Optimism, Compound, dYdX, Polymarket, Blast, and more than 30 other Web3 names, per Yahoo Finance. Combined assets top $192 million, making this the broadest Web3 portfolio ever disclosed by a senior US financial nominee.
The Senate Banking hearing lands April 21, the same window that holds the CLARITY Act committee markup and the Fed’s April 28-29 meeting. Spot SOL ETFs have crossed $892 million in net assets, with Bitwise’s BSOL alone pulling $808 million in cumulative inflows per Bitcoin.com. The timing puts SOL at the intersection of every major US monetary and regulatory decision this month.
Solana Price Prediction Compared: SOL Setup and the Presale Opportunity Pepeto
The solana price prediction section below breaks down how even the bullish $180 target spreads across months, and for traders who want more, the audited exchange pulling capital in this quarter is the play worth watching. Pepeto gives retail access to tools large holders previously kept private, wrapped in a single platform.
A contract scanner built into the exchange screens each token before any deposit opens, putting buyers ahead of the news cycle. Presale wallets earn 181% APY through daily compounding staking as the rounds fill, meaning the earliest buyers hold the heaviest positions the second demand peaks.
A risk scoring engine reads momentum across the chain and flags suspect contracts before a dollar moves. The presale has pulled in $9.21 million at $0.0000001865, backed by a SolidProof audit and driven by the founder who pushed Pepe to $7 billion on 420 trillion tokens, now leading this exchange alongside a former Binance executive.
The entry window narrows every hour as the Binance listing draws closer. Once public trading opens, millions of new buyers set the price and the presale floor vanishes on the spot. Every past crypto recovery paid the wallets that moved while the crowd was waking up, and once Pepeto’s Binance listing lands, the 300x runway from presale pricing closes the same day.
Solana (SOL) Price Prediction: Can SOL Reach $180?
Solana (SOL) trades at $85.02 per CoinMarketCap, bouncing with the broader market, still 70% below the $293 peak from November 2021. SOL holders sit at 167 million monthly unique wallets per Solana Foundation data, a record set in April.
Standard Chartered’s $250 target rests on Alpenglow’s 150 millisecond finality upgrade and the spot ETF products giving institutions a regulated route in.
CoinCodex sketches a 2026 channel between $84 and $133.03 with the average near $119. Even the aggressive solana price prediction reaching $180 prints around 103% over several months. Strong for a large cap, but a presale at 300x math from one Binance listing event beats months of chart watching by a wide margin.
Conclusion:
The solana price prediction points at $180 to $250 on a long runway, and that kind of move sounds great until you stack it next to the 300x analysts are calling for on Pepeto presale pricing. Once the gap is visible, the SOL forecast starts looking modest, and the rotation into earlier entries starts to make sense.
The accounts that turned Pepe and DOGE into life changing positions were all built the same way. Capital went in before the coin hit every screen, the deposit held through the first exchange print, and compounding did the lifting from there.
Pepeto runs that exact playbook right now. The raise crossed $9.21 million, fresh capital keeps hitting the contract every day, and the Binance listing creeps closer hour by hour. The wallets depositing at $0.0000001865 today are the ones reading their own names in the millionaire headlines the next cycle writes.
Click To Visit Pepeto Website To Enter The Presale

FAQs
What does the solana price prediction target for 2026?
Standard Chartered places Solana (SOL) at $250 and CoinCodex models a $119 average for 2026, with $180 as a mid cycle target from the current $85.02 level. Fed Chair nominee Kevin Warsh disclosed SOL holdings in his April 14 filing ahead of an April 21 Senate hearing, while Pepeto at presale pricing targets 300x.
How does Solana (SOL) compare to Pepeto as an entry today?
Solana (SOL) at $85.02 projects toward $133 to $180 through 2026 per CoinCodex and Standard Chartered. Pepeto at $0.0000001865 with $9.21 million raised and a Binance listing days away offers a presale to listing return that beats even the strongest solana price prediction.
Disclaimer: This is a Press Release provided by a third party who is responsible for the content. Please conduct your own research before taking any action based on the content.
Crypto World
BitGo, Polygon Among Industry Giants Pushing Rate Limits After The Largest DeFi Exploit of 2026

A wave of protocol-level security responses followed the $292 million KelpDAO rsETH exploit on April 19, with BitGo, Polygon, and Katana moving swiftly to isolate potential contagion.
The attack drained 116,500 rsETH from Kelp DAO’s LayerZero-powered cross-chain bridge through a forged message that bypassed its Decentralized Verifier Network (DVN) configuration.
Protocols Move to Contain Fallout
BitGo, alongside BiT Global Trust, took down the LayerZero OFT DVNs for Wrapped Bitcoin (WBTC) as a precaution. The firm confirmed that user funds remain secure and pledged to share updates as more information becomes available.
Polygon stated that its chain, Agglayer, and broader ecosystem remain unaffected by the incident. The network noted it has safely processed over $2 trillion to date.
Katana paused the OFT path on Vaultbridge, which relied on a 2/3 DVN setup. Bridging through Agglayer, which verifies with zero-knowledge proofs rather than proof-of-authority multisigs, remained fully available.
Meanwhile, Cyvers CTO and co-founder Meir Dolev revealed that KelpDAO was just three minutes away from losing an additional $100 million. A rapid-response blacklist blocked the attacker before a second attempt could succeed.
Industry Leaders Call for Structural Rate Limits
The exploit has reignited calls for built-in rate limits across DeFi protocols. Ethena contributor Guy Young argued that asset issuers should implement throttled cross-chain transfers on top of standard LayerZero OFTs.
“We built a solution on top of the standard OFT to throttle cross chain transfers at $10m per hour for every DVN, in addition to the $10m per block rate limit on the mint contract. The former would have prevented Kelp, the latter Resolv,” he wrote.
Ethena’s configuration caps potential damage at $10 million per chain per hour even if a DVN is fully compromised. Young called the slight inconvenience for users a worthwhile tradeoff to avoid catastrophic losses.
Keone Hon, CEO and co-founder of Monad, proposed that pooled lending protocols adopt “smart caps” that limit how quickly collateral supply can grow.
He pointed to the Resolv hack in March, where the attacker minted infinite tokens but could only extract $24 million because exit pathways were small.
Hon argued that high supply caps should be seen as a liability, not a sign of stature. A supply limit slightly above current utilization, adjusting over hours to the true cap, would have saved rsETH depositors $200 million, he estimated.
The KelpDAO breach is now the largest DeFi exploit of 2026. Whether protocols adopt the rate-limiting measures these leaders are proposing may determine how large the next one gets.
The post BitGo, Polygon Among Industry Giants Pushing Rate Limits After The Largest DeFi Exploit of 2026 appeared first on BeInCrypto.

TLDR:
- An ECB director stated tokenization restructures entire financial systems, surpassing all previous waves of technological change.
- The UK reversed its stablecoin payments policy, bringing digital assets into its formal regulatory perimeter for the first time.
- HSBC completed a tokenized deposit pilot covering issuance, transfer, and atomic settlement on the Canton Network successfully.
- Clearstream will custody and settle Ondo’s tokenized stocks and ETFs, embedding digital assets into core European market infrastructure.
Tokenization is gaining serious traction across Europe as regulators, central banks, and financial institutions move toward digital asset integration.
A European Central Bank director recently stated that tokenization’s effect on finance surpasses earlier waves of technological change.
Major institutions across the continent are responding with concrete steps. From regulatory reversals to live pilots and cross-border partnerships, Europe is emerging as a key driver of the global tokenization push.
European Regulators Set the Tone for a New Financial Era
A European Central Bank director drew a sharp distinction between tokenization and previous technological shifts in finance.
According to Ledger Insights, the director noted that these technologies do not merely improve one part of a system.
Rather, they restructure the entire logic of how financial systems operate. That assessment positions tokenization as a foundational change, not an incremental upgrade.
The statement carried weight given the ECB’s central role in shaping European financial policy. When a director at that level speaks about systemic change, institutions across the continent take notice.
The framing moved the conversation beyond speculation and into strategic planning. European banks and depositories began responding almost immediately.
Across the Channel, the UK government reversed its earlier position on stablecoins within payments regulation. Authorities confirmed plans to bring stablecoins into the country’s formal payments regulatory perimeter.
That reversal closed a policy gap that had kept digital assets outside mainstream financial oversight. Britain’s shift aligned it more closely with the direction Europe’s financial regulators are heading.
Together, these regulatory signals are creating a more predictable environment for tokenized finance. Institutions require clear frameworks before committing to infrastructure investments at scale.
With central bank commentary and government policy now pointing in the same direction, that clarity is forming. Europe’s regulatory posture is becoming one of cautious but deliberate acceptance.
European Institutions Move From Pilots to Permanent Infrastructure
HSBC completed a tokenized deposit pilot on the Canton Network, marking a practical step forward for European banking. The exercise simulated the issuance, transfer, and atomic settlement of its Tokenised Deposit Service.
All three functions were tested in a controlled environment, confirming operational readiness. The pilot demonstrated that large European banks are past the conceptual stage.
ABN Amro extended crypto access to its investment clients through a carefully structured approach. The Dutch bank introduced indirect exposure via Exchange Traded Products and Capital Protected Notes.
Both instruments are available through ABN Amro’s existing investment platforms, keeping the process familiar for clients. That design reflects how European institutions are balancing innovation with risk management.
The most structurally significant development came through the Ondo Finance, Clearstream, and 360X partnership.
Clearstream, Europe’s leading securities depository, will provide custody, settlement, and collateralization for Ondo’s tokenized stocks and ETFs.
This integration places tokenized assets directly inside established institutional workflows. It removes a barrier that had long kept digital assets separate from mainstream settlement infrastructure.
That partnership matters because Clearstream operates at the core of European capital markets. Anchoring tokenized securities within its framework gives institutional participants a trusted, regulated entry point.
European financial infrastructure is no longer sitting adjacent to tokenization. It is becoming part of it.
TLDR:
- AVAX trades near $9 as price consolidates above key support within a multi-year descending triangle structure
- Strong buyer activity appears around $8–$10, with reduced volatility signaling a possible accumulation phase
- Resistance between $13 and $16 remains critical, with a breakout needed to shift short-term momentum
- A confirmed move above the descending trendline could open a path toward the $60–$80 price range
Avalanche (AVAX) is trading near a key support zone as its weekly chart shows a long-term descending triangle. Price action suggests buyers are stepping in, with consolidation forming near the lower boundary of the structure.
AVAX Holds Key Support as Buyers Step In
AVAX has remained within a broad downtrend since its 2021 peak above $130. The weekly chart shows a clear pattern of lower highs, guided by a descending resistance trendline. This structure has kept selling pressure active during each rally attempt.
According to analyst Butterfly on X, AVAX is bouncing from the lower edge of the triangle. The post added that buyers are showing interest near this support, with early signs of control shifting toward bulls.
Price is now hovering around $9.18, just above a strong support zone between $10.5 and $11. This area has been tested several times, making it a key level for market participants. Below this, the $8 to $9 range has acted as a short-term accumulation zone.
The chart also shows reduced volatility within this range. Price movement has tightened, forming a consolidation pattern. This behavior often appears when selling pressure slows and buyers begin absorbing available supply.
Volume data supports this view. Larger spikes appeared during earlier sell-offs and rebounds. More recently, volume has stabilized, with no sharp increase in selling activity. This trend suggests that the market may be entering a transition phase.
Resistance Levels Define Next Direction
While support has held, several resistance levels remain in focus. The first barrier sits between $13.5 and $16.5, where recent price rejection occurred. A move above this range could shift short-term momentum.
Beyond that, the $20.5 to $25.5 range represents a mid-level resistance zone. This area aligns with the previous price structure and could slow movement upward if reached. The descending trendline near $30 remains the most critical level.
A breakout above this trendline would change the long-term structure. It would end the pattern of lower highs and open the path for a broader recovery. Projections from the chart suggest that such a move could push the price toward the $60 to $80 range.
On the downside, a break below $8 would weaken the current setup. In that case, price could move toward the $6 to $7.5 region. This level has served as support in the past and may attract new buying interest.
For now, AVAX remains in a narrow range between $8 and $12. This zone has become a key area where both buyers and sellers are active. The longer the price stays within this band, the stronger the next move could be.
Market participants are watching closely as the structure approaches a decision point. The repeated defense of support suggests ongoing demand. At the same time, resistance levels continue to cap upward movement.
The weekly chart reflects a market in balance, with both sides waiting for confirmation. A move beyond these defined levels will likely set the next direction for AVAX.
Crypto World
Bitcoin Dips Below $75,000 as Strait of Hormuz Sees Zero Oil Tankers for First Time in History
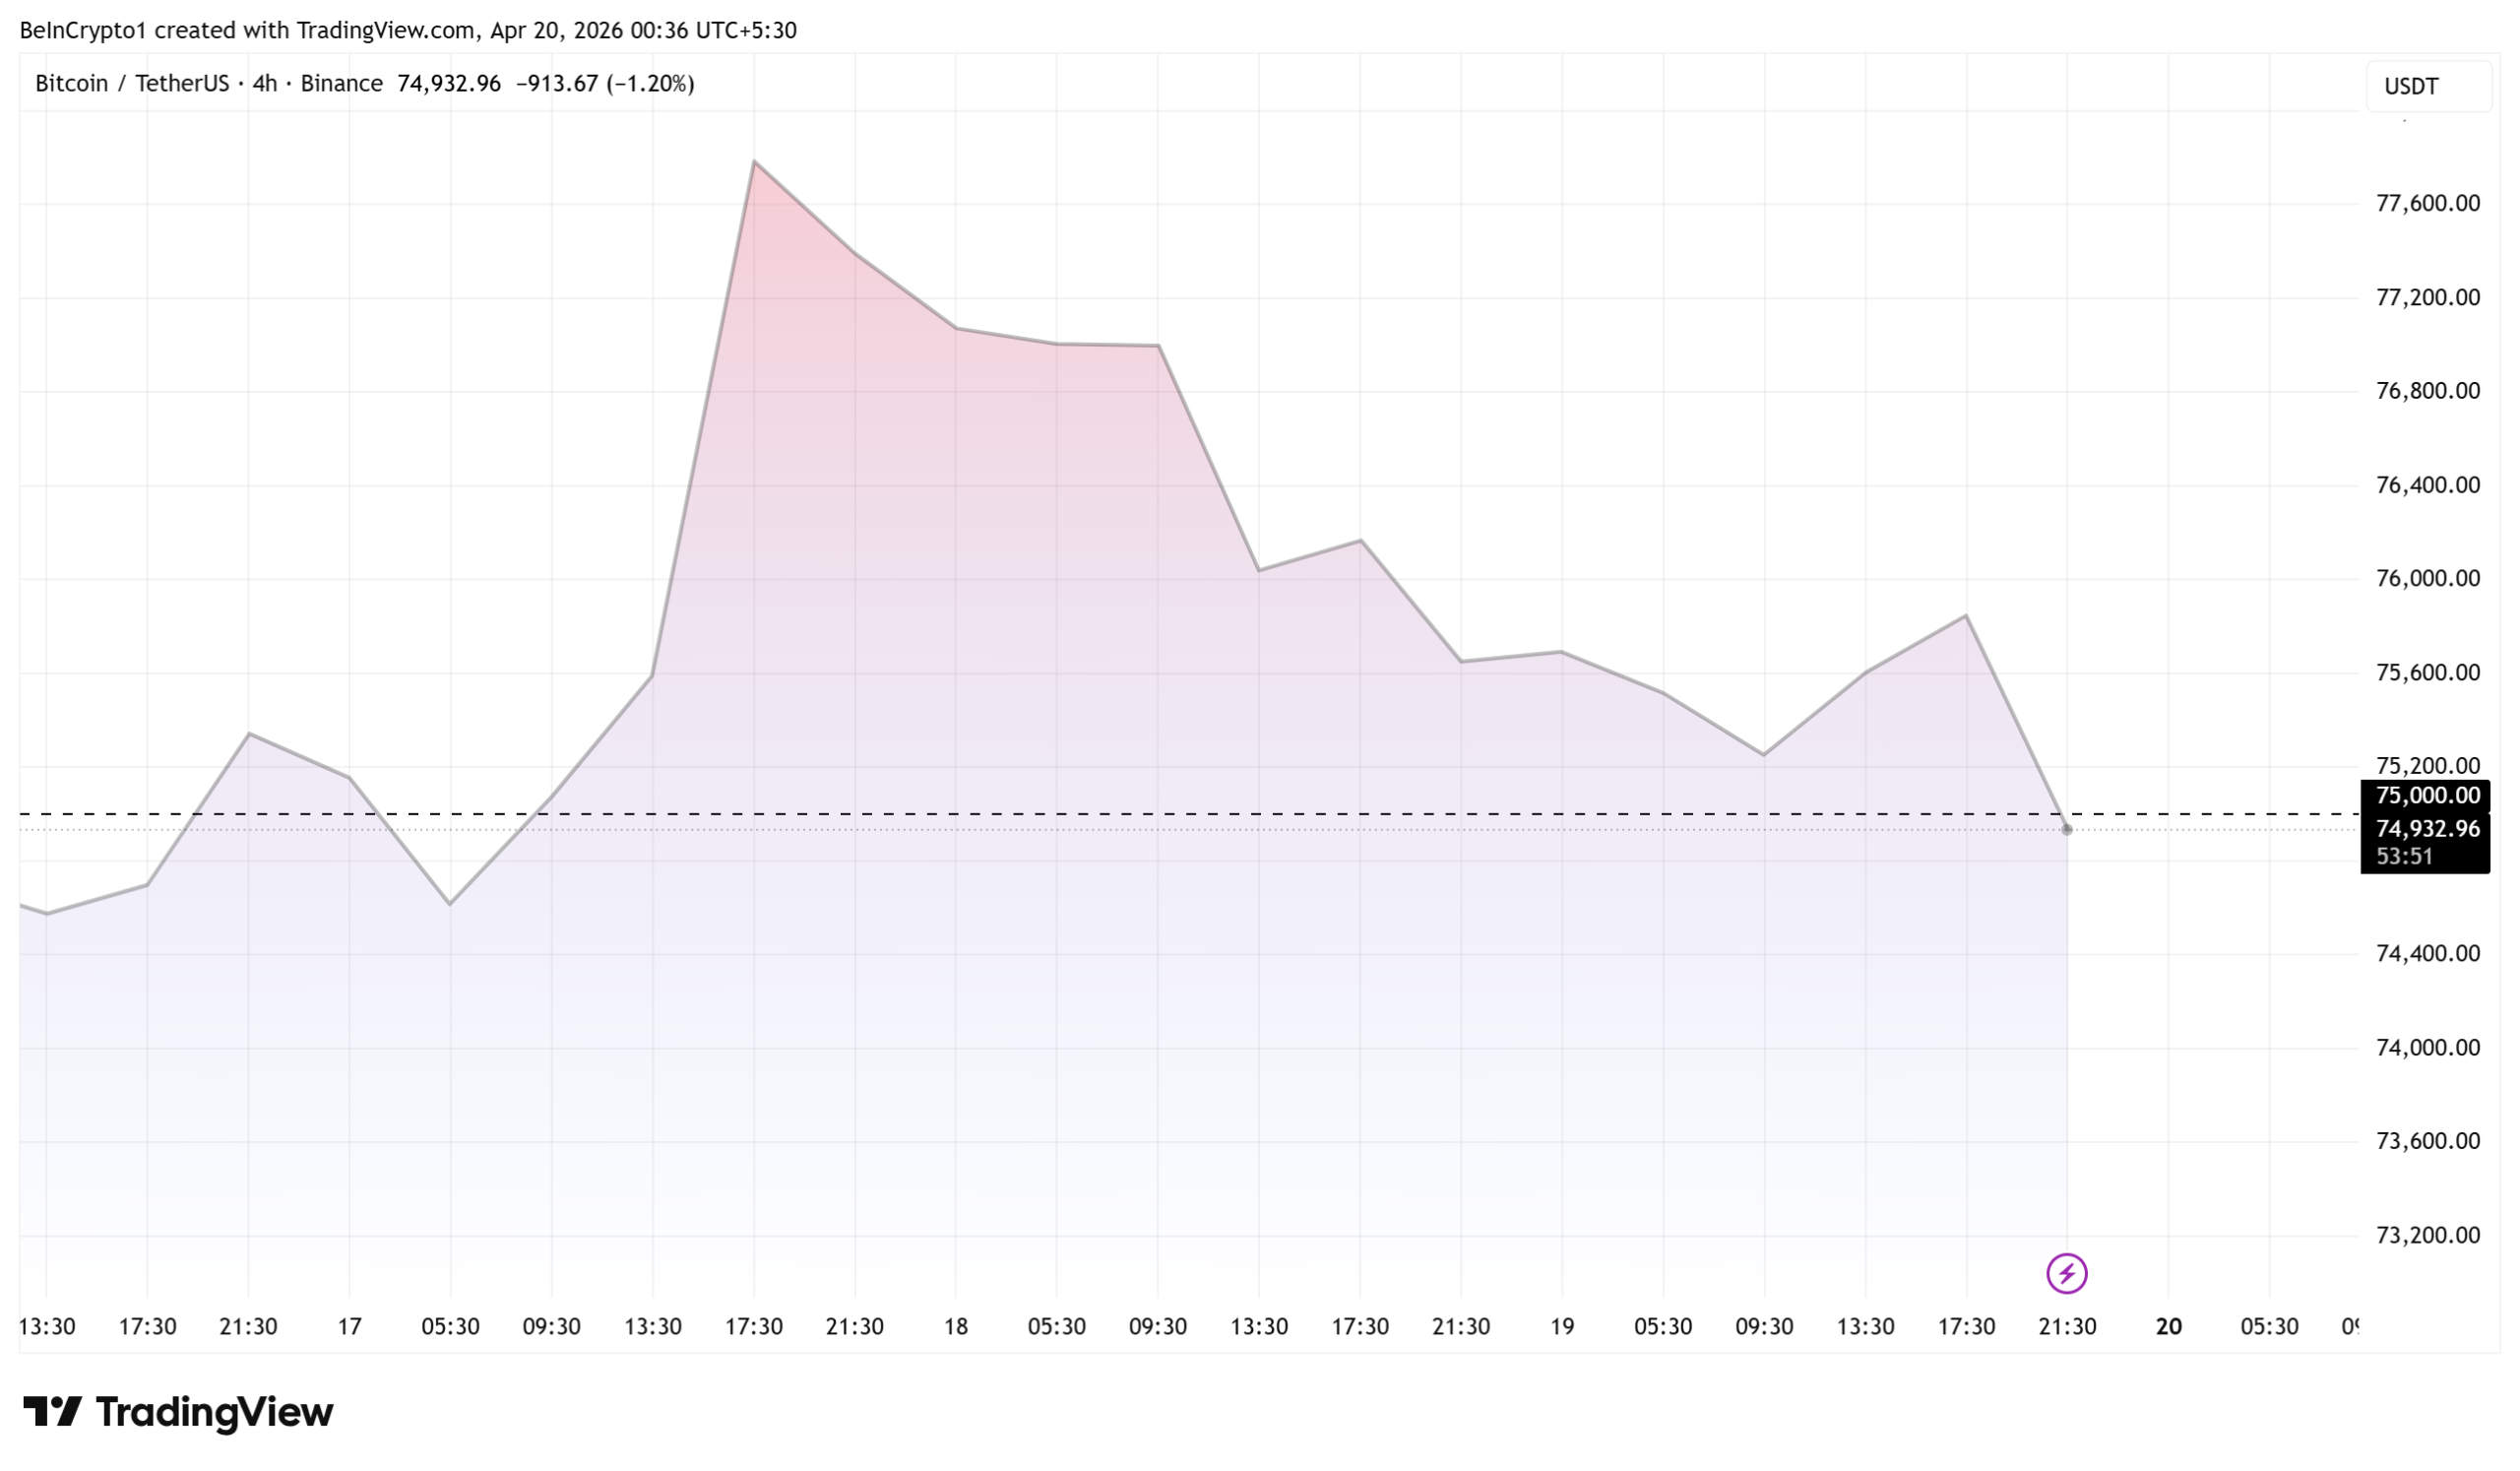
Bitcoin (BTC) dropped below $75,000 on April 19 as the Strait of Hormuz shut down entirely and Iran rejected a second round of negotiations with the United States.
The developments mark a sharp escalation in the US-Iran standoff, with zero oil tankers passing through the strait and diplomatic channels appearing to collapse.
Strait of Hormuz Shuts Down as Diplomacy Stalls
No oil tankers passed through the Strait of Hormuz, effectively closing the waterway that handles roughly 20% of global seaborne oil trade.
“It appears that the Strait of Hormuz is now completely closed for the first time in history. The US “blockade” and Iran’s closure are in full force,” wrote The Kobeissi Letter.
Reportedly, thirteen tankers had already turned back mid-route the day before, freezing shipping flows through the critical chokepoint.
Iran’s state media confirmed that Tehran rejected participating in a second round of talks with Washington. Iranian officials cited what they called “deception” from President Trump, pointing to “inconsistency with what is actually happening” during negotiations.
The rejection came after the first round of talks in Islamabad ended without an agreement last week.
Trump Escalates Threats Against Iran
President Trump accused Iran of firing on ships in the strait in violation of the ceasefire agreement. He threatened to “knock out every single Power Plant, and every single Bridge, in Iran” if Tehran refuses a deal.
General sentiment is that both countries are on the verge of a new round of escalation, with futures markets set to open within hours.
Bitcoin has faced sustained pressure from the US-Iran conflict since February 28. The pioneer crypto previously fell from above $100,000 when Iran first moved to close the strait earlier this year. Amid Sunday’s risk-off sentiment, the king of crypto fell below $75,000 for yet another time.

Rising oil prices and inflation fears have repeatedly pushed investors toward traditional safe-haven assets over crypto.
The coming hours may prove critical as futures markets open and traders price in the diplomatic breakdown.
The post Bitcoin Dips Below $75,000 as Strait of Hormuz Sees Zero Oil Tankers for First Time in History appeared first on BeInCrypto.
TLDR:
- Solana’s monthly chart shows a cup-and-handle pattern forming after a long recovery from 2023 lows.
- Price remains inside a descending channel, with $70–$80 support acting as a key short-term level.
- Resistance between $240–$280 marks the breakout zone needed to confirm the bullish continuation pattern.
- A breakdown below $70 may weaken the structure, while holding support keeps the consolidation phase active.
Solana’s monthly price structure is drawing attention as it continues to form a classic cup-and-handle pattern. The asset remains within a consolidation phase, with price currently moving inside the handle range after a strong recovery from earlier lows.
Long-Term Structure Shows Gradual Recovery
Solana’s macro chart reflects a rounded bottom that formed between 2021 and 2024. Price peaked near $240–$260 in 2021 before entering a prolonged decline. It later found support near $10–$12 in early 2023, marking the cycle low.
Bitcoinsensus describes this structure as a developing cup-and-handle pattern on the monthly timeframe.
The post notes that the recovery from the 2023 lows formed a rounded base, which is often linked to steady accumulation rather than rapid speculation.
From that bottom, price climbed steadily toward the previous highs, completing the cup formation. This move established a broader bullish structure, supported by higher highs during the recovery phase. The return to the $240–$260 range defined the upper boundary of the cup.
Since reaching that zone, the price has not broken out. Instead, it has entered a controlled pullback. This phase forms the handle portion of the structure, which typically follows a rounded recovery.
The handle appears as a downward-sloping channel. Current price action remains within this range, with resistance near $180–$200 and support around $70–$80. At the time of observation, the price traded near $89.97, closer to the lower boundary.
Consolidation Phase Keeps Market in Balance
The handle structure reflects short-term pressure, although the broader trend remains intact. This phase often involves reduced volatility compared to the earlier recovery. Price movement within this channel suggests a pause rather than a confirmed reversal.
Key resistance levels remain clearly defined. The descending channel top sits near $170–$200, acting as immediate resistance. Beyond that, the $240–$280 range marks the major breakout zone tied to the cup formation.
On the downside, the $70–$80 region serves as critical support. A breakdown below this level could shift market structure. In such a case, the price may move toward $60 or lower, weakening the current pattern.
The broader structure remains intact as long as support holds. The cup-and-handle pattern traditionally requires a breakout above the rim for confirmation. In this case, that level lies near $240–$280.
If price moves above this zone with strong momentum, the pattern projects a larger upside range. The depth of the cup suggests a possible extension toward $450–$550. However, such movement depends on sustained strength and a confirmed breakout.
For now, the price continues to move within the handle. This keeps the market in a neutral position, with both upward and downward scenarios still open.
A hold above support may allow a move toward channel resistance. A break below support could delay further recovery.
The current phase remains focused on consolidation. Market participants continue to watch the $70–$80 support and the descending resistance line for direction. Movement beyond these levels will likely define the next stage of the trend.
TLDR:
- Money market funds recorded a $172.2B weekly outflow, the largest ever, far exceeding typical April withdrawal trends.
- Equity funds attracted $11.3B while bond funds saw $7.9B inflows, showing a shift toward diversified allocations.
- Crypto and gold funds each gained $1.2B, reflecting steady demand for alternative assets during capital rotation.
- Seasonal tax payments and portfolio adjustments drove withdrawals, pushing the four-week average to early 2024 levels.
Money market funds recorded a historic weekly outflow as capital rotated across asset classes. Recent data shows a sharp withdrawal trend, with funds moving into equities, bonds, and alternative assets during a period that often aligns with seasonal tax payments.
Record Outflows Reshape Short-Term Liquidity Trends
Money market funds saw a weekly outflow of $172.2 billion, marking the largest drawdown ever recorded. The scale of withdrawals exceeded typical April averages, reflecting an unusual shift in short-term liquidity positioning.
According to a post shared by The Kobeissi Letter on X, the weekly outflow was over 320% above the average April movement seen in recent years.
The data also showed that the four-week moving average dropped to negative $30.0 billion, reaching levels last seen in early 2024.
This change in flow patterns coincided with capital moving into other financial instruments. Equity funds attracted $11.3 billion, while bond funds recorded inflows of $7.9 billion during the same period. These figures suggest that investors adjusted allocations rather than exiting markets entirely.
At the same time, alternative assets saw moderate interest. Gold and crypto-related funds each received $1.2 billion in inflows. While smaller in size compared to equities and bonds, these inflows indicate continued diversification across asset classes.
April often brings seasonal liquidity changes due to tax obligations. As a result, part of the outflow from money market funds was linked to tax-related withdrawals. This pattern tends to repeat annually, although the magnitude this time stands out.
Capital Rotation Signals Broader Allocation Shifts
The movement of funds into equities and bonds points to a broader reallocation strategy. Investors appear to be balancing short-term liquidity needs with longer-term positioning across markets.
Equity inflows suggest a willingness to maintain exposure to risk assets despite recent volatility. Meanwhile, bond inflows indicate continued interest in fixed-income securities, often used for stability during uncertain conditions.
The inflows into gold and crypto funds, although smaller, add another layer to the overall picture. These assets are often viewed as alternative stores of value, especially during periods of shifting liquidity trends.
The decline in the four-week moving average of withdrawals also provides context. It shows that while the weekly outflow was large, the broader trend reflects sustained but less extreme withdrawals over time.
Taken together, the data show that capital is not leaving the financial system but moving between asset classes. Seasonal factors, combined with changing market preferences, continue to shape these flows.
As April progresses, similar patterns may continue, especially if tax-related withdrawals remain active. However, the redistribution of funds suggests ongoing engagement across multiple markets rather than a retreat from risk.
TLDR:
- Institutional Bitcoin buying continues across cycles, with cost basis rising steadily toward the $75K range
- Large purchase clusters at higher prices reflect increased capital deployment during bullish momentum phases
- The $75K level aligns with average cost, making it a key support zone for current market positioning
- Bitcoin price near cost basis signals a decision point as market direction remains uncertain in the short term
Bitcoin accumulation trends tied to large institutional buyers continue to draw market attention as price action tests key levels.
A recent dataset shared publicly outlines long-term purchasing behavior, cost basis movement, and evolving strategy across multiple market cycles up to April 19, 2026.
Institutional Accumulation Strategy Expands Across Market Cycles
A post by Michael Saylor introduced the chart with a brief statement urging larger thinking. The shared data tracks a “Strategy Tracker,” presenting Bitcoin purchases over time alongside price movement and average cost trends.
The dataset shows total holdings of 780,897 BTC valued at $59.10 billion. The average acquisition cost stands at $75,577 per Bitcoin.
Meanwhile, cumulative tracked purchases reach 8,780,897 BTC across 106 events, reflecting long-term accumulation behavior.
Early accumulation occurred when Bitcoin traded between $10,000 and $40,000. During this period, purchases remained consistent but relatively small.
As a result, the average cost line moved gradually upward, showing controlled exposure during lower price levels.
As prices declined toward the $20,000 to $30,000 range, buying activity continued. This phase reflects steady accumulation during market weakness. The average cost stabilized before rising again, indicating continued capital deployment without hesitation.
Later, Bitcoin entered a strong upward move, climbing beyond $100,000. During this phase, purchase sizes increased, and buying frequency rose. The average cost also climbed sharply, signaling a shift toward momentum-driven accumulation.
Price Levels and Cost Basis Shape Market Positioning
The chart outlines key price zones that now frame market structure. The $75,000 to $80,000 range aligns closely with the average acquisition cost. This level now serves as a central support zone tied to institutional positioning.
Below that, the $60,000 to $65,000 range marks a previous consolidation area. This zone acted as a base before the breakout that pushed prices higher. These levels remain relevant for traders assessing downside scenarios.
On the upside, $100,000 continues to act as a psychological barrier. The price has tested this level multiple times. Above that, the $120,000 to $130,000 range represents the recent peak and a clear resistance zone.
The relationship between price and average cost remains central to the current setup. When Bitcoin trades above the cost basis, positions remain in profit. When price approaches this level, it becomes a decision point for market participants.
Recent data shows Bitcoin hovering near this cost level. This places the market in a narrow range where direction remains uncertain. At the same time, continued buying during both rallies and pullbacks reflects a steady approach.
Purchase markers on the chart also show larger allocations at higher price levels. This pattern suggests increasing capital commitment over time. It also reflects a willingness to accumulate regardless of short-term price fluctuations.
The absence of selling activity across the timeline reinforces a long-term positioning strategy. Rather than reacting to price swings, the approach remains focused on building exposure across cycles.
Future price movement now depends on how Bitcoin behaves around the $75,000 level. Holding above this range may support another move toward $100,000 and beyond. However, a breakdown below this level could shift short-term market direction toward lower support zones.
The chart presents a structured view of accumulation, cost growth, and price interaction. It captures how institutional participation has evolved alongside Bitcoin’s expanding market cycle.
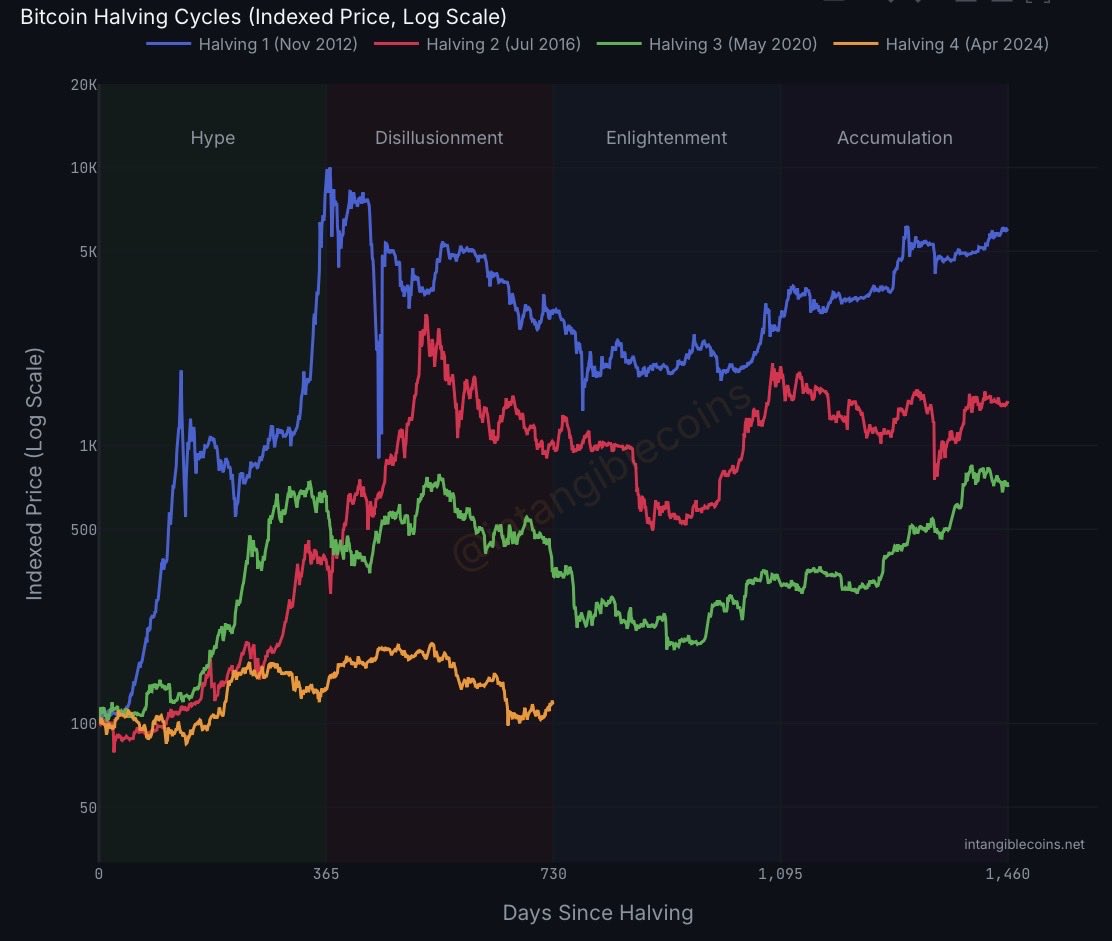
The current Bitcoin (BTC) market cycle is “dramatically” weaker than the three previous cycles, according to Alex Thorn, the head of firmwide research at investment firm Galaxy.
Thorn compared price action since the April 2024 Bitcoin halving to cycles triggered in 2012, 2016 and 2020; the current cycle shows significantly dampened volatility and lower upside. The all-time high above $125,000 on Oct. 5, 2025 was only 97% above the 2024 halving price around $63,000.
BTC’s price increased by about 9,294% during the 2012 halving cycle, reaching a high of about $1,163, and climbed by about 2,950% during the 2016 halving cycle, reaching a high of about $19,891. The 2020 halving saw a price increase of about 761%.

“Cycle four is dramatically underperforming prior cycles,” Thorn said in an X post, asking, “Is this the new normal, or is it the new normal until it isn’t?”
The decreasing volatility in each successive BTC halving cycle suggests that traditional market dynamics are changing and that BTC’s price may start to be influenced more by other factors, rather than the halving or the four-year cycle market theory.
The 30-day Bitcoin Volatility Index, which spiked to 9.64% on April 2, 2020, has not been above 3.11% in the current cycle, a reading last tipped on Aug. 24, 2024. At last look, the latest 30-day estimate for that volatility gauge is 1.75%, according to Bitbo data.
Related: Bitcoin bull run ‘still too early’ to call as demand lags exiting capital: Analyst
Critics say current cycle performance ignores the premature all-time high before 2024’s halving
BTC reached what was then the all-time high above the $70,000 level in March 2024 — one month before the April 2024 halving.
The approval of spot Bitcoin exchange-traded funds (ETFs) in the United States in January 2024 was the primary catalyst for the price pump.

This historic anomaly of BTC hitting a new all-time high before the halving skewed the current cycle’s price performance, critics of Thorn’s analysis said.
Bitcoin drawdowns have also become less severe, as volatility has declined, according to Fidelity Digital Assets.
Previous Bitcoin bear markets have seen declines between 80% and 90%, according to Zack Wainwright, a Fidelity Digital Assets research analyst.
However, Bitcoin’s crash to $60,000 from the all-time high above $125,000 represents a decline just north of 50%, Fidelity’s analysis noted.
In March, Jan van Eck, CEO of asset management company VanEck, said that BTC is close to bottoming out and that he expects the price to begin gradually rising again in 2026.
At last look, the biggest crypto was trading at about $74,703, up almost 5% in the last seven days, according to TradingView data.
Magazine: Bitcoin will not hit $1M by 2030, says veteran trader Peter Brandt

Attacker minted unbacked rsETH through Kelp’s LayerZero bridge, then borrowed WETH on Aave V3 and V4 before markets could freeze.
In 46 minutes on Saturday evening, DeFi lost more money than it had in any single event this year, and left Aave to face its biggest challenge yet. The mechanics took roughly one transaction.
At 17:35 UTC on April 18, an attacker sent a crafted message to Kelp DAO’s LayerZero-powered cross-chain bridge. The bridge accepted it as legitimate and released 116,500 rsETH, worth about $293 million and roughly 18% of the token’s entire circulating supply, to a wallet that had been funded through Tornado Cash ten hours earlier. No ETH ever changed hands on the other side, which means rsETH was effectively spun out of thin air.
The attacker did not try to sell it. They deposited it into Aave V3 as collateral and borrowed real wrapped ether against it, then repeated the trick on Aave V4. By the time Kelp’s emergency multisig froze the protocol’s core contracts 46 minutes later, the WETH was gone.
Two follow-up attempts at 18:26 and 18:28 UTC, each trying to drain another 40,000 rsETH, reverted into the pause, but the first hit was already reverberating across DeFi.
Twenty-four hours later, Aave is carrying between $177 million and $236 million in bad debt, its TVL has dropped by roughly $6 billion, according to DeFiLlama, its WETH market is pinned at 100% utilization, and the AAVE token is down more than 18%.
SparkLend, Fluid, and Upshift have all paused or frozen rsETH. rsETH on more than 20 chains is of uncertain backing. Ethereum itself has barely moved.
It is now, by size, the largest DeFi exploit of 2026.
How it happened
rsETH is Kelp’s liquid restaking token. Every rsETH is supposed to represent a real claim on ETH deposited into Kelp and restaked across EigenLayer operators. That one-to-roughly-one relationship is why some money markets have been willing to treat rsETH as ETH-correlated collateral.
rsETH lives on more than 20 networks and moves between them through a LayerZero messaging layer. When a user locks rsETH on one chain, the bridge on the destination chain is supposed to mint or release an equivalent amount only after it verifies a valid message from the source.
The attacker found a way to make that verification accept a message that corresponded to no real deposit, so that 116,500 rsETH were released without the corresponding ETH being locked anywhere. Kelp’s vault reserves did not move, but its liability, denominated in rsETH, grew by 18%.
How Aave became the exit door
This is where the story gets uncomfortable for Aave.
Kelp’s bridge is the proximate cause of the mint. But the reason this turned into $200 million of hard damage rather than a localized, recoverable incident is that Aave had, by design, made rsETH one of the most capital-efficient collateral types in DeFi.
Supply caps were large enough to accommodate an entire $292M deposit. Borrow caps on WETH were sized such that a single attacker could withdraw well over $200M of real ether in a handful of transactions. Liquidation thresholds assumed rsETH would trade at or near peg.
The listing reviews and parameter tuning by Chaos Labs, Block Analitica, and LlamaRisk treated rsETH as what it had been in practice: a conservatively collateralized liquid re-staking token (LRT) with a boring price history.
That’s why the attacker was able to use a single forged message on a bridge to drain real assets out of the largest lender in DeFi.
Billions of WETH left Aave
After the attacker borrowed WETH against unbacked rsETH, WETH suppliers started to withdraw their own funds, likely on speculation that first-movers would be made whole while last-movers would eat the residual loss. By Sunday morning, $5.4 billion of ETH and WETH had left Aave.
WETH pool utilization hit 100%, which means WETH depositors can no longer withdraw.
The borrow positions are effectively unliquidatable. The collateral cannot be redeemed at Kelp and will not trade near peg once the scale of unbacked supply is fully digested. No profitable liquidation path exists.
Aave Labs said on X that Aave’s contracts were not compromised. But “no bug” doesn’t necessarily mean “no problem.”
Aave’s Umbrella insurance fund holds about $50 million. Aave-specific bad debt is roughly $196 million concentrated in the rsETH / WETH pair on Ethereum. The gap is where the next few weeks of governance will happen.
The waterfall, in order: aWETH Umbrella stakers absorb the first slice via automatic slashing; WETH suppliers take a pro-rata haircut on their deposits; stkAAVE holders are next if governance activates a deeper slash; and the DAO treasury could fund a repayment proposal.
Aave’s Guardian froze rsETH and wrsETH across every deployment. Aave V4’s Security Council disabled supply and borrow on both the Core Hub and the Kelp E-Spoke. A Risk Stewards proposal to reduce the WETH Slope1 is already live, aimed at pulling new supply back in.
Contagion spreads
SparkLend, Fluid, and Upshift froze rsETH within hours. The exception is Morpho: CEO Paul Frambot said exposure is about $1 million across two isolated markets, with other vaults entirely unaffected. Morpho’s architecture isolates each market so bad debt in one pair cannot propagate.
rsETH itself now has a backing problem across 20-plus chains until Kelp publishes a clean reconciliation of reserves against outstanding supply. Any protocol that accepts wrsETH as collateral is exposed until that accounting is public.
LayerZero’s messaging layer will also take scrutiny as the path manipulated in Kelp’s bridge is not unique to Kelp.
Kelp follows the $285 million Drift hack on April 1, the $80M Resolv Labs exploit in March, and a string of infrastructure-level compromises. Cumulative DeFi losses for 2026 are between $450 and $482 million across roughly 45 protocols.

Today’s NYT Strands Hints, Answer and Help for April 20 #778

Alan Shearer makes confident title prediction after Arsenal’s defeat to Man City | Football

Why Does the Next Fed Chair Own SOL Before His April 21 Hearing? Pepeto 300x Rotation Explained


-
 NewsBeat7 days ago
Pep Guardiola and Gary Neville agree over Arsenal title problem that benefits Man City
-

 Crypto World6 days ago
The SEC Conditionalises DeFi Platforms to Be Avoided for Broker Registration
-

 Fashion2 days ago
Weekend Open Thread: Theodora Dress
-

 Crypto World6 days ago
SEC Signals Exemption for Crypto Interfaces From Broker Registration
-

 News Videos5 days ago
Secure crypto trading starts with an FIU-registered
-

 Sports2 days ago
NWFL Suspends Two Players Over Post-Match Clash in Ado-Ekiti
-

 Crypto World6 days ago
SEC Proposes Certain Crypto Interfaces Don’t Need to Register as Brokers
-

 NewsBeat5 days ago
Trump and Pope Leo: Behind their disagreement over Iran war
-

 Business6 hours ago
Powerball Result April 18, 2026: No Jackpot Winner in Powerball Draw: $75 Million Rolls Over
-

 Politics2 days ago
Palestine barred from entering Canada for FIFA Congress
-

 Crypto World2 days ago
Russia Pushes Bill to Criminalize Unregistered Crypto Services
-

 Sports6 days ago
NWFL opens Pathway for new Clubs ahead of 2026 Season
-

 Politics11 hours ago
Zack Polanski demands ‘council homes not luxury flats for foreign investors’
-
 Entertainment6 days ago
Brand New Day’ Footage Reveals the Devastating Impact of ‘Now Way Home’
-
 Business3 days ago
Creo Medical agree sale of its manufacturing operation
-

 Crypto World7 days ago
Trump whales load up ahead of Mar-a-Lago luncheon.
-
Crypto World7 days ago
Sei Network Enters Quiet Reset Phase as On-Chain Metrics Signal a Slowdown in 2026
-
Business7 days ago
Kering slides after Morgan Stanley downgrade, Gucci woes loom
-

 Tech7 days ago
Google adds E2E encryption to Gmail for iOS and Android enterprise users
-

 Tech7 days ago
Apple glasses won’t go brand shopping like Meta did with Ray-Ban and Oakley
You must be logged in to post a comment Login