
Crypto World
Bitcoin Price Faces 25% Risk as Buy-the-Dip Narrative Weakens

Bitcoin’s recent rebound has revived the buy-the-dip narrative, but the data tells a more complicated story. After falling nearly 15% and briefly touching the $60,000 zone, the Bitcoin price bounced more than 11%, drawing traders back into long positions.
At first glance, the bounce looks encouraging. However, bearish chart patterns, rising leverage, and fragile spot demand suggest the market may not be out of danger yet. With a potential 25% downside still in play, the latest bounce is now facing serious scrutiny.
Bear Flag, Rising Leverage, and Falling Exchange Supply Signal Risky Optimism
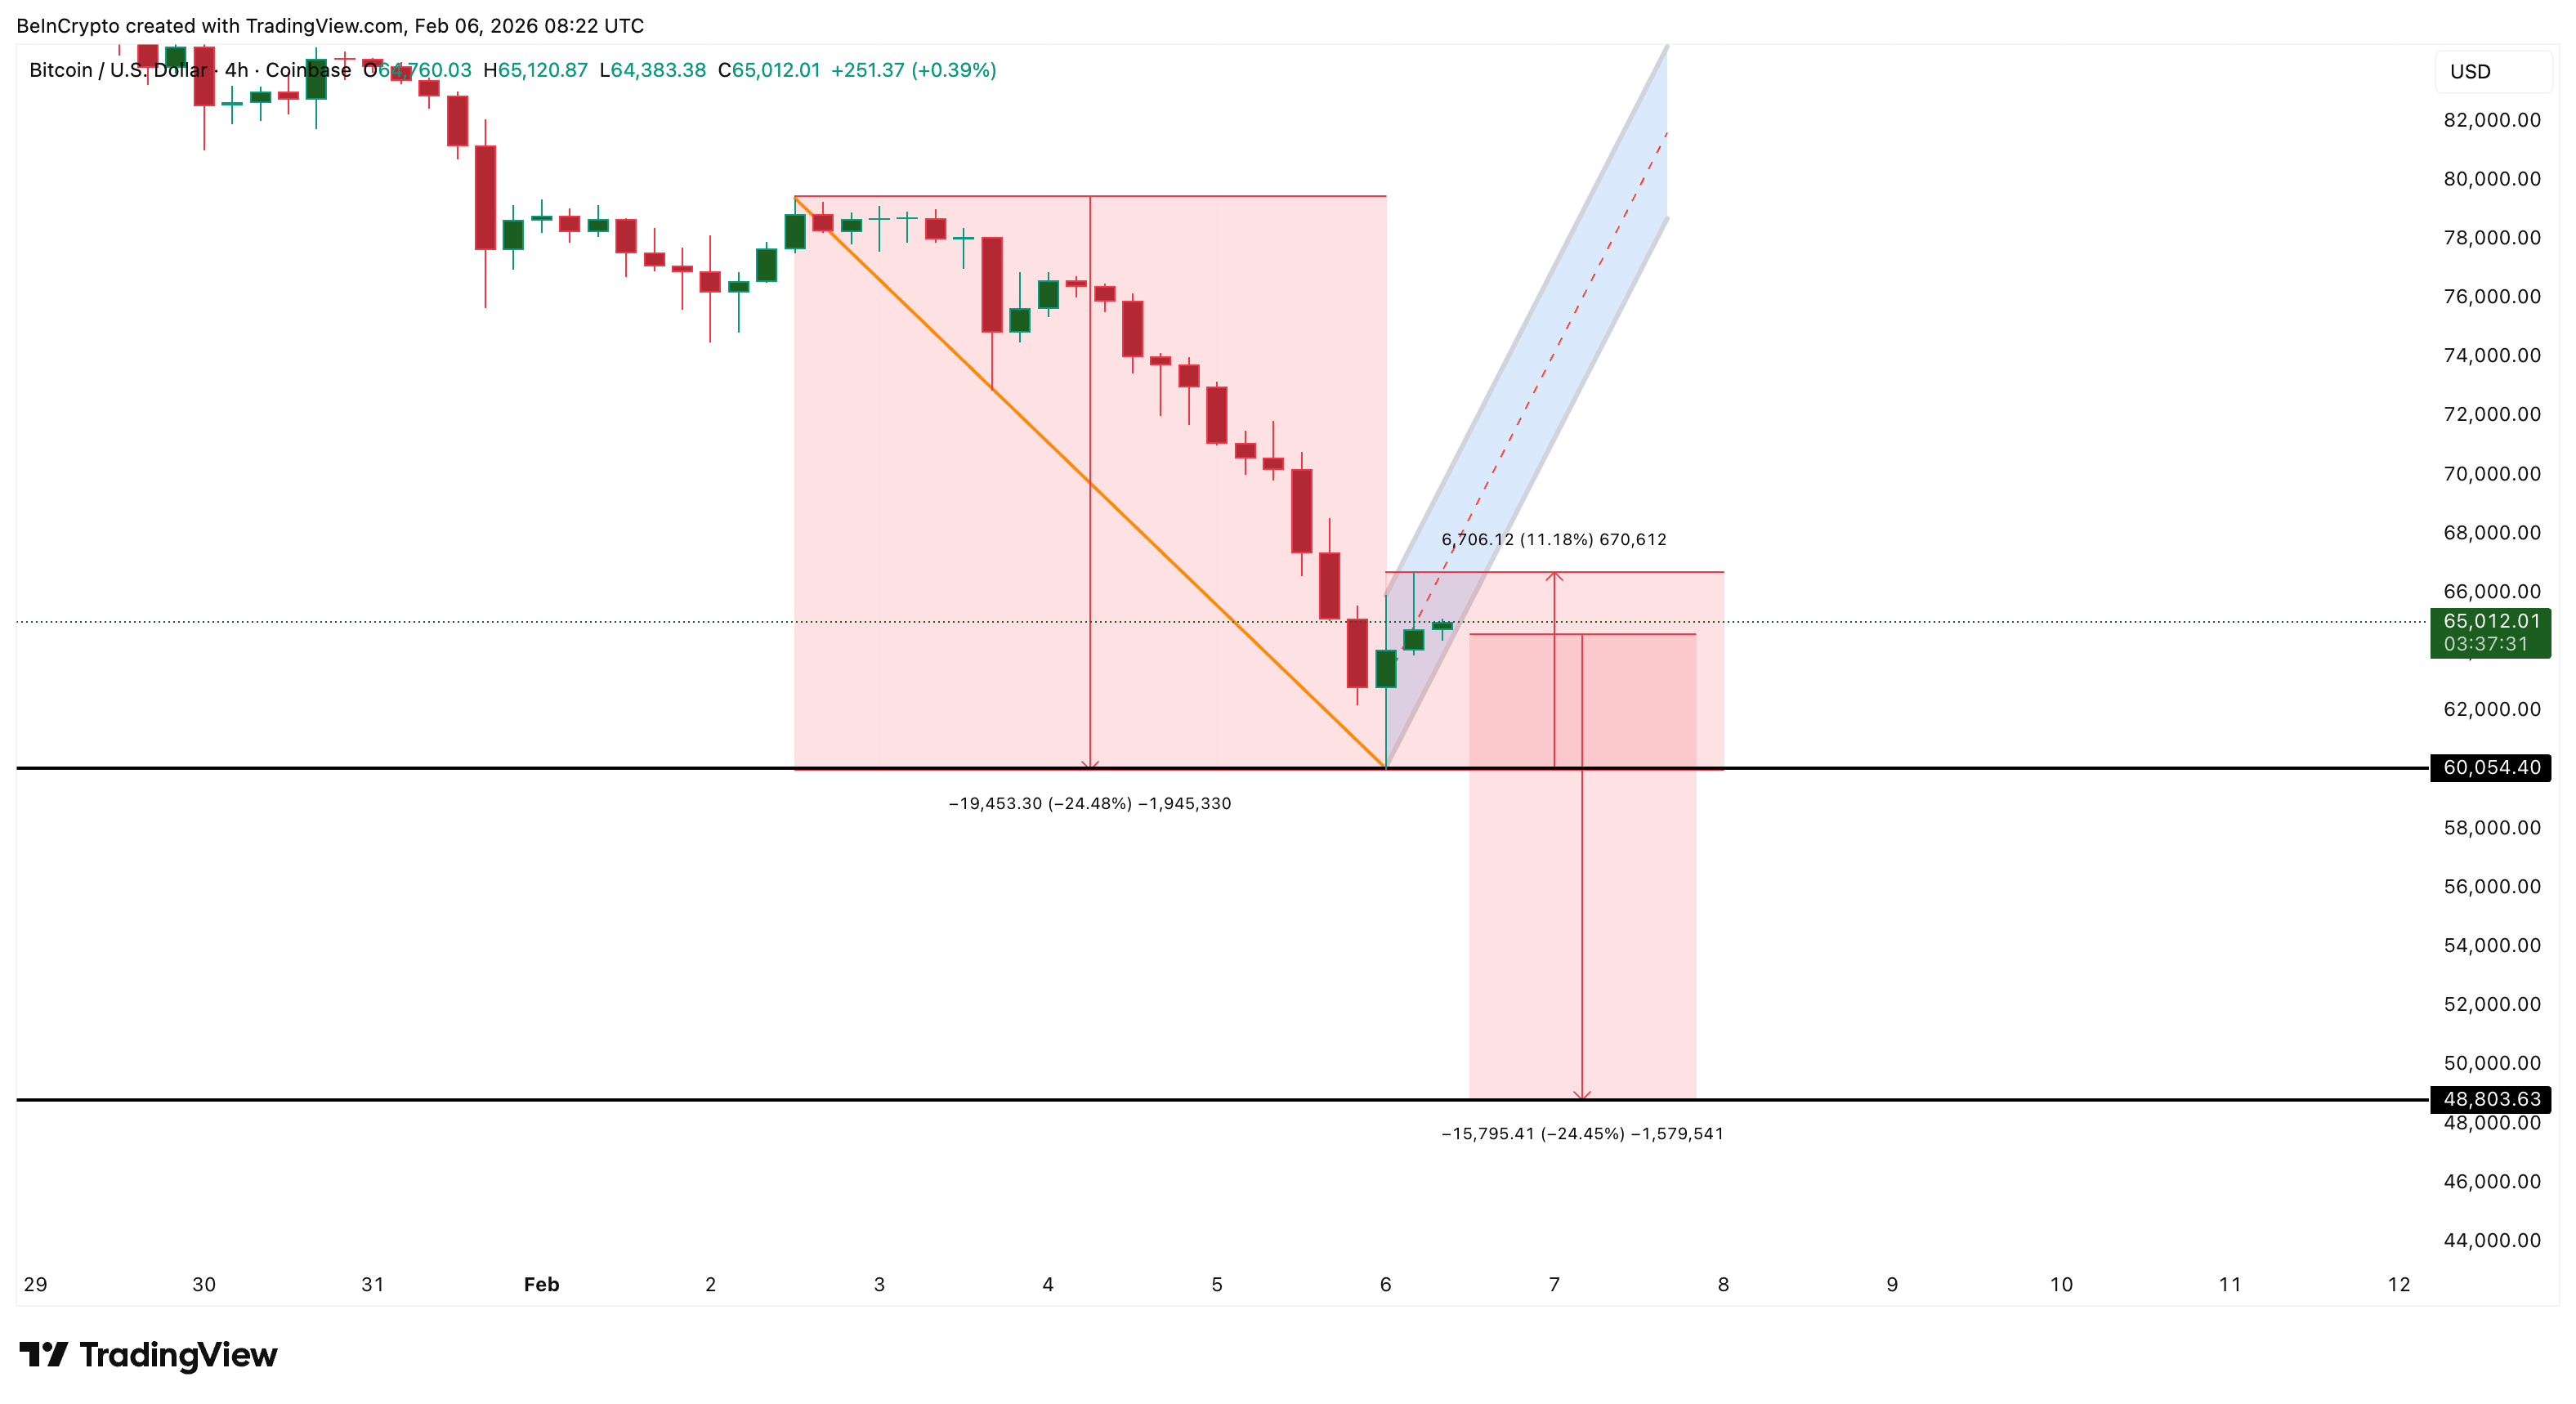
Bitcoin’s short-term risk is already visible on the 4-hour chart.
Sponsored
Sponsored
After the sharp sell-off toward $60,000, the Bitcoin price formed a rebound structure that now resembles a bear flag pattern. This setup typically appears when the price pauses after a strong drop before continuing lower. If the lower trendline breaks, the pattern points to a downside move of nearly 25%, targeting the $48,000–$49,000 zone.
Want more token insights like this? Sign up for Editor Harsh Notariya’s Daily Crypto Newsletter here.
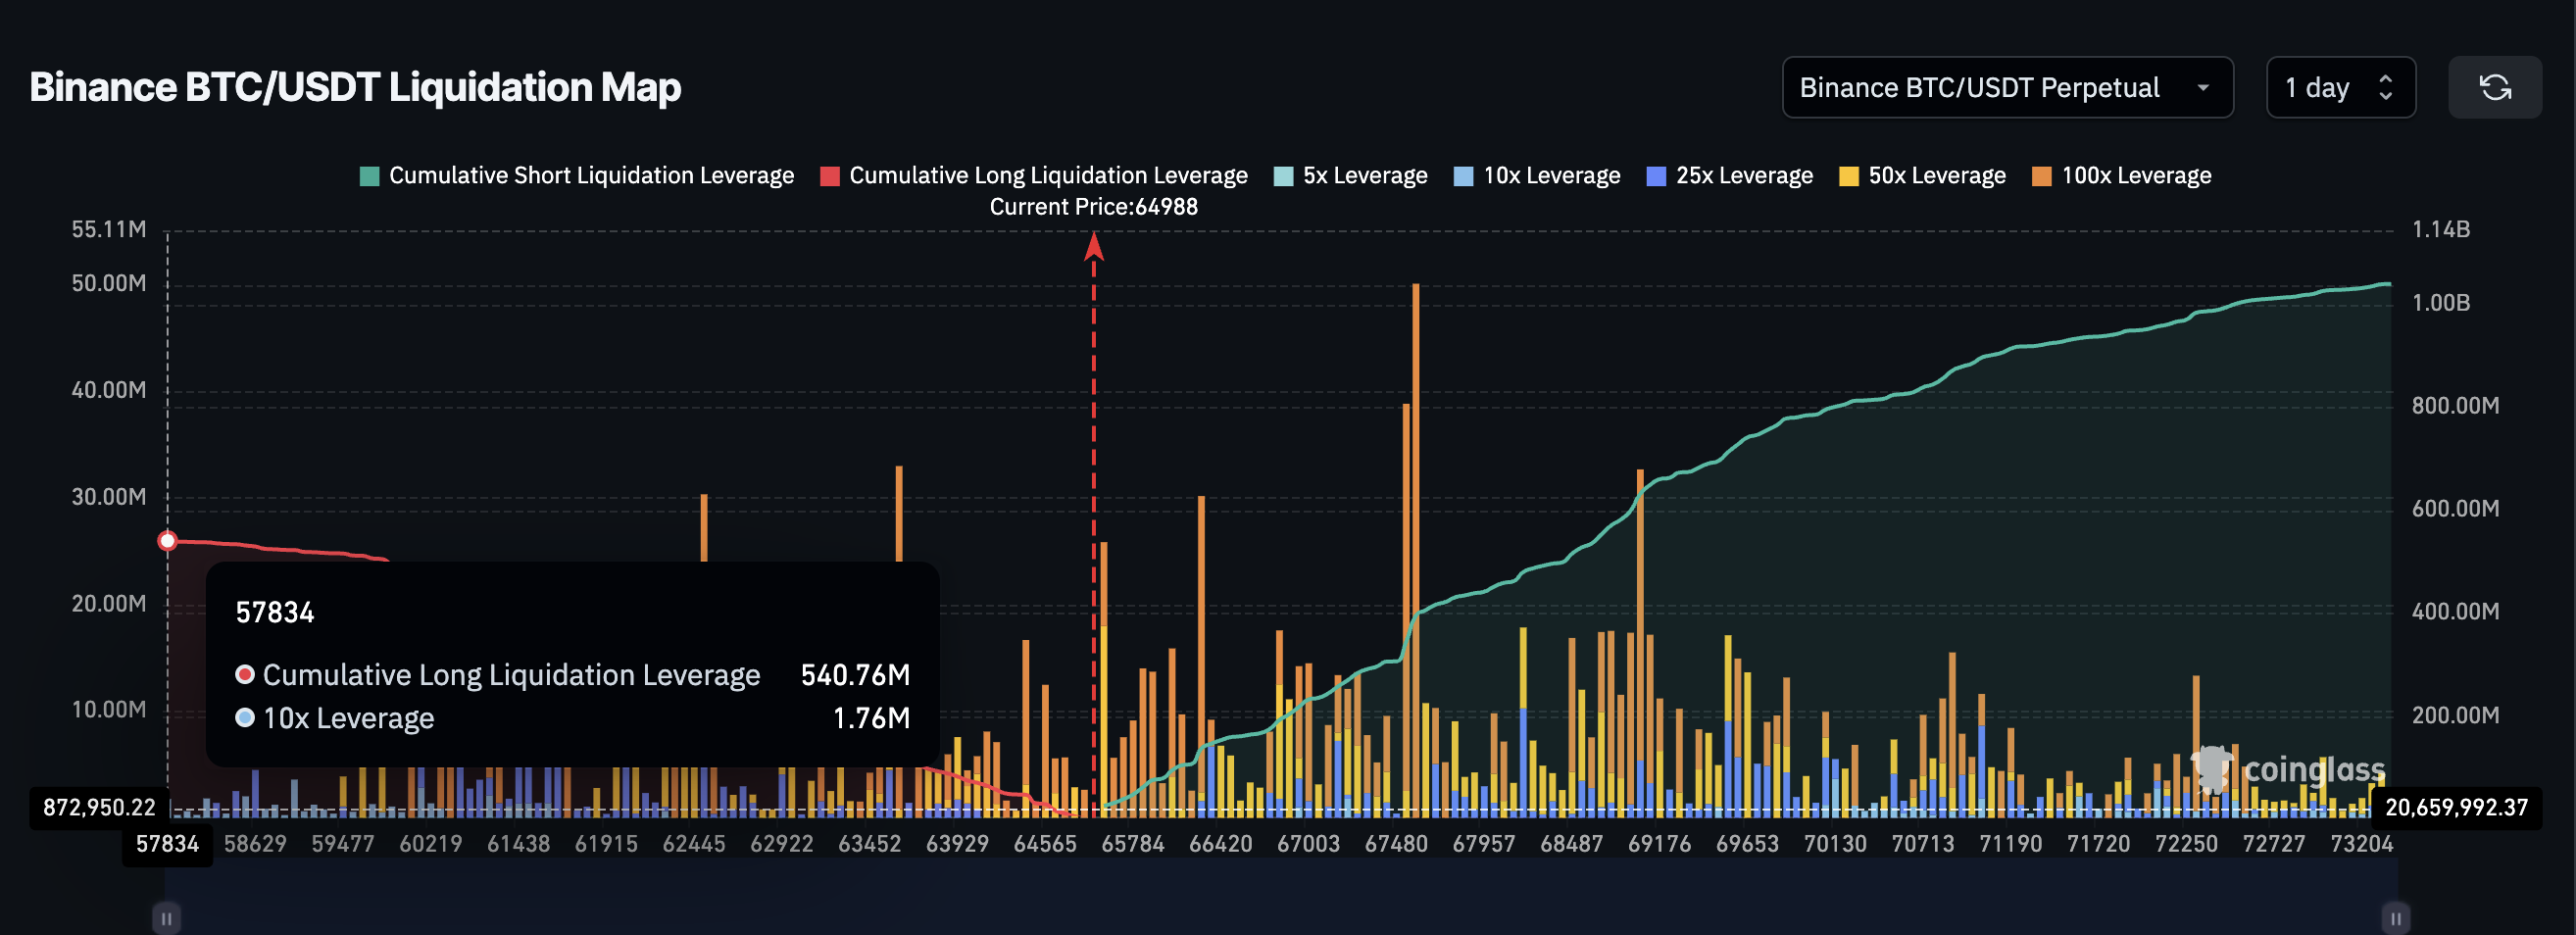
Despite this technical warning, leverage is rising again.
Following the 11.18% rebound, more than $540 million in new long positions were built on Binance alone. This shows that traders are once again using heavy leverage, betting that the bottom is already in. Similar behavior has preceded major liquidations in past downturns.
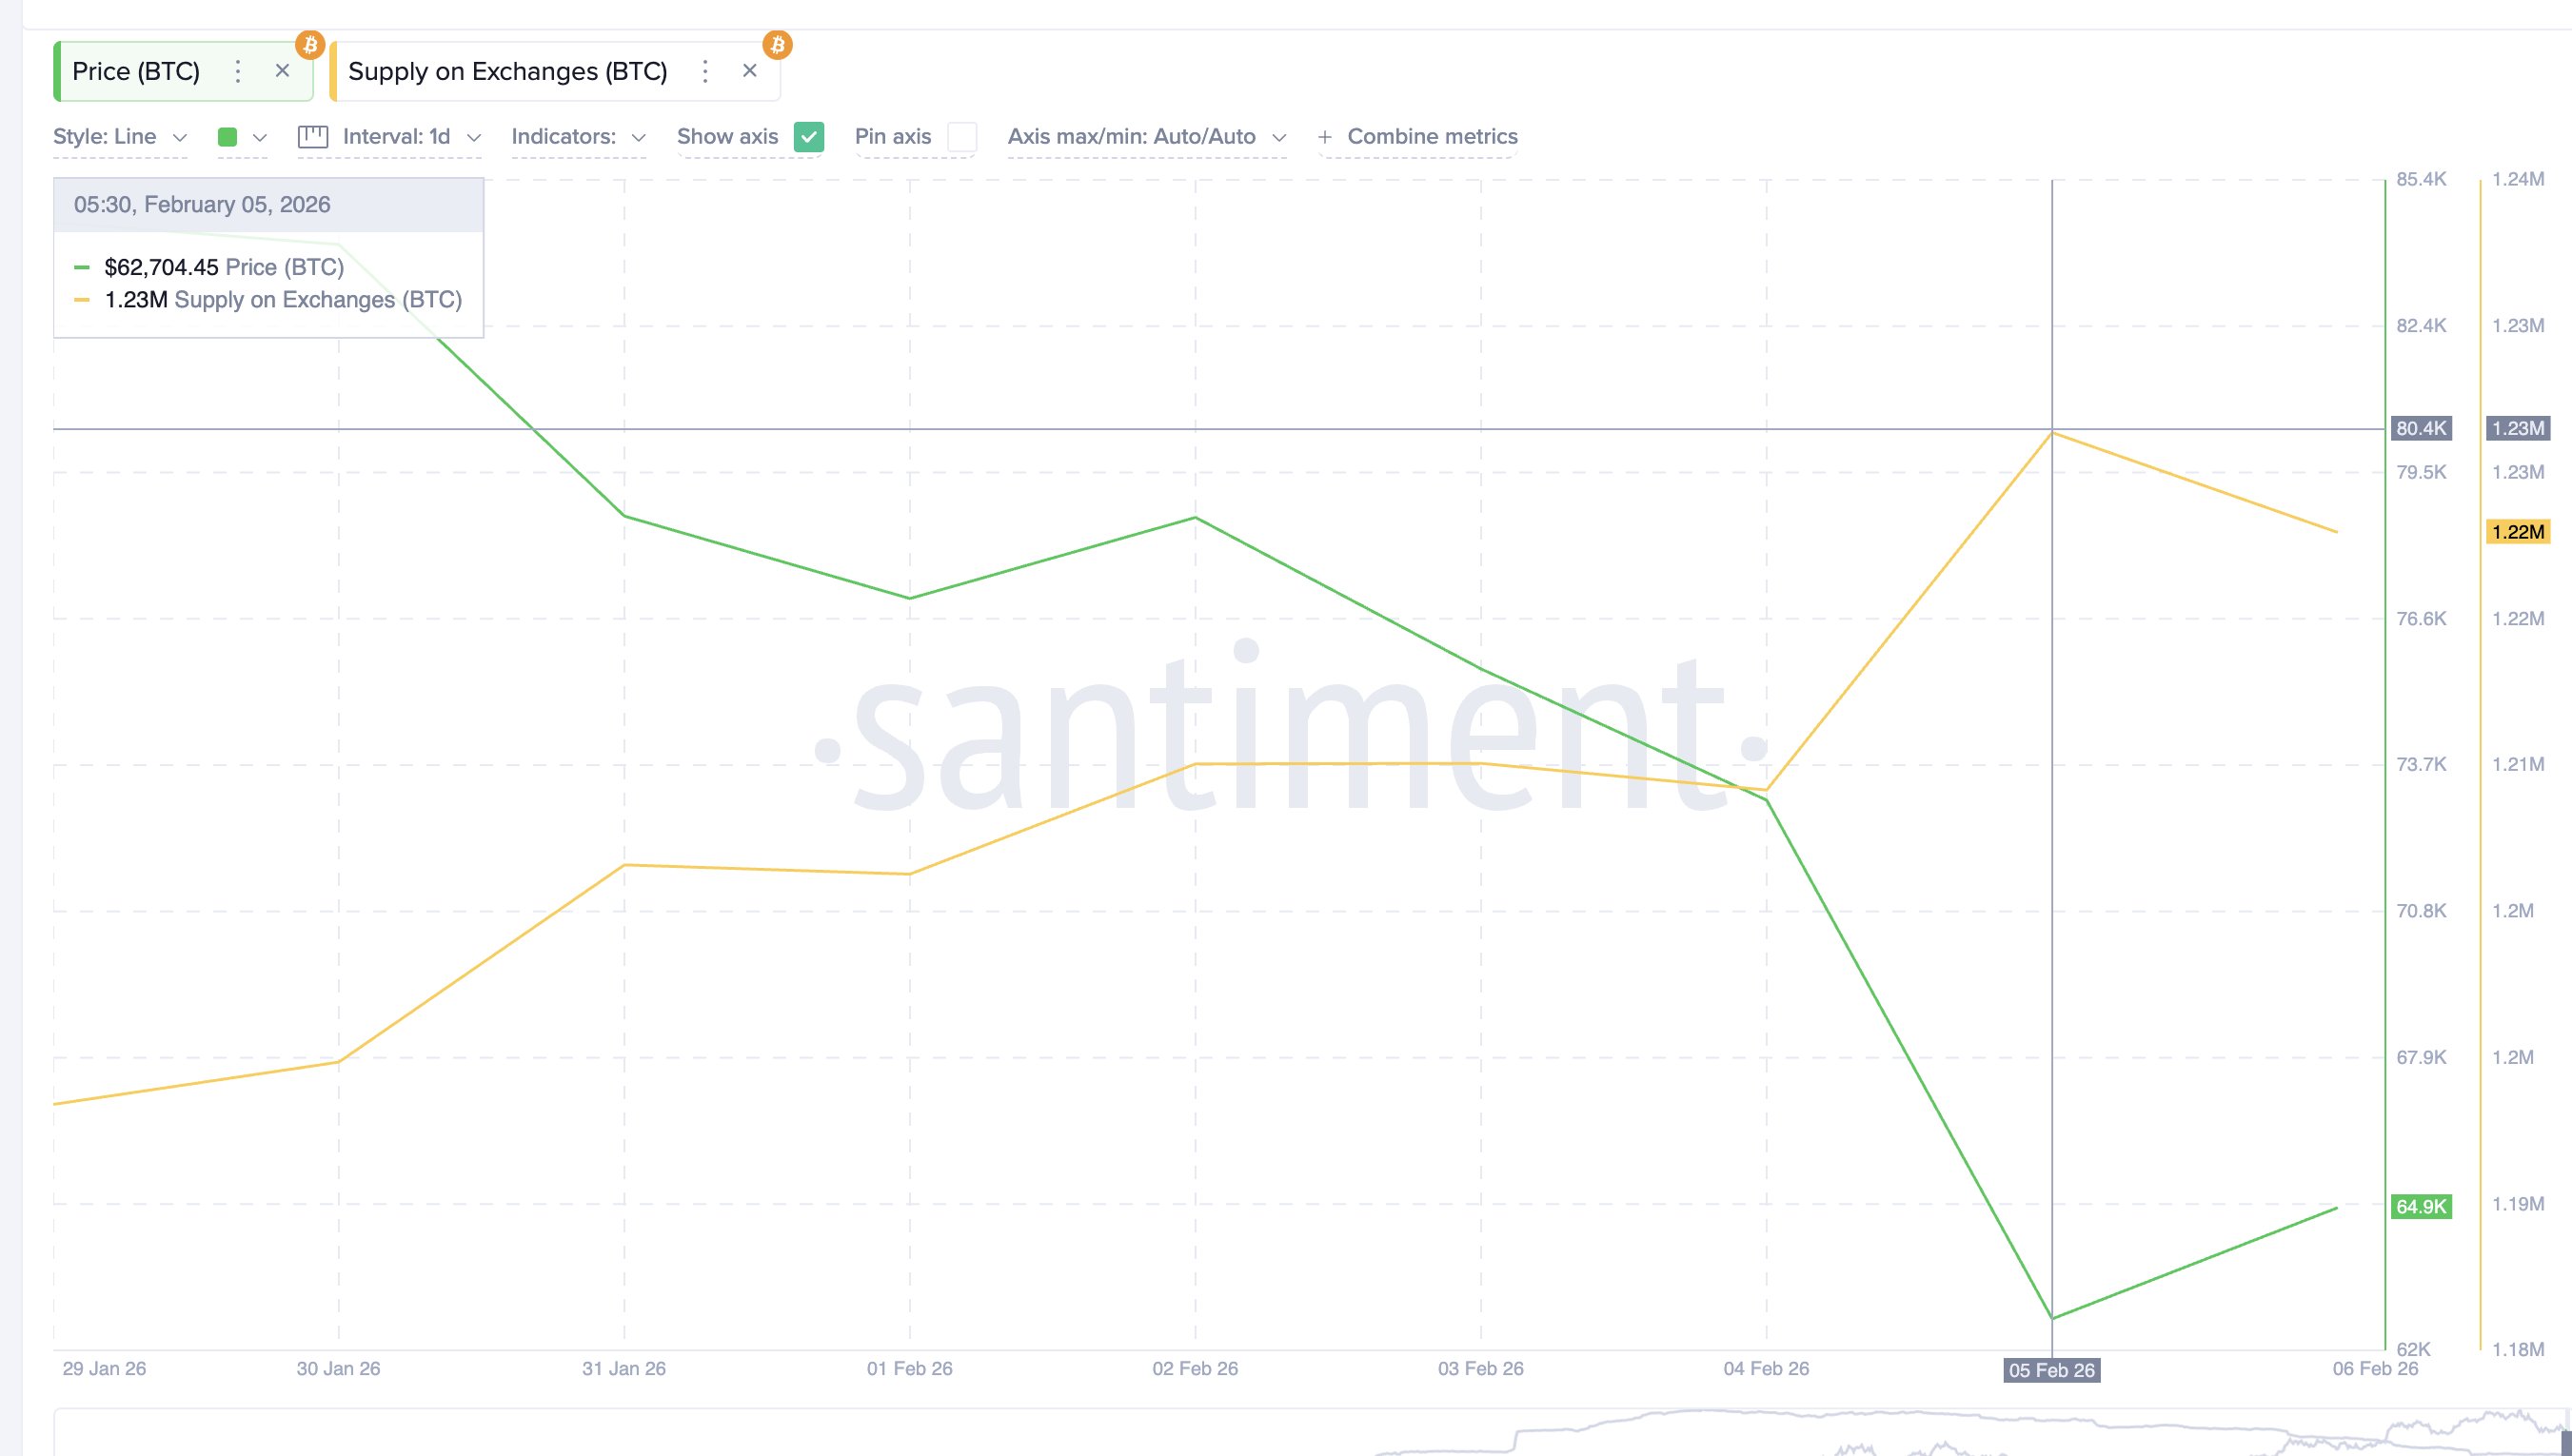
At the same time, spot market behavior reflects a growing buy-the-dip mindset.
Bitcoin supply on exchanges fell from around 1.23 million BTC to 1.22 million BTC between February 5 and February 6. This decline suggests that traders are withdrawing coins, possibly for short-term holding, expecting higher prices.
Public figures and social media sentiment have also turned more optimistic, reinforcing the ‘Buy-the-Dip’ narrative.
Sponsored
Sponsored
Together, these signals possibly show misplaced confidence.
A fragile chart pattern, rising leverage, and early dip buying are forming at the same time. When optimism builds before structural weakness is resolved, downside risk often increases rather than fades.
Long-Term Holders Keep Selling as Realized Price Support Comes Into Focus
While short-term traders are turning bullish, long-term holders, the most stable folks, are moving in the opposite direction.
The Long-Term Holder Net Position Change, which tracks the 30-day supply shift among investors holding for more than one year, has remained deeply negative since early January. On January 6, this metric showed net selling of around 2,300 BTC. By February 5, that figure had worsened to roughly 246,000 BTC.
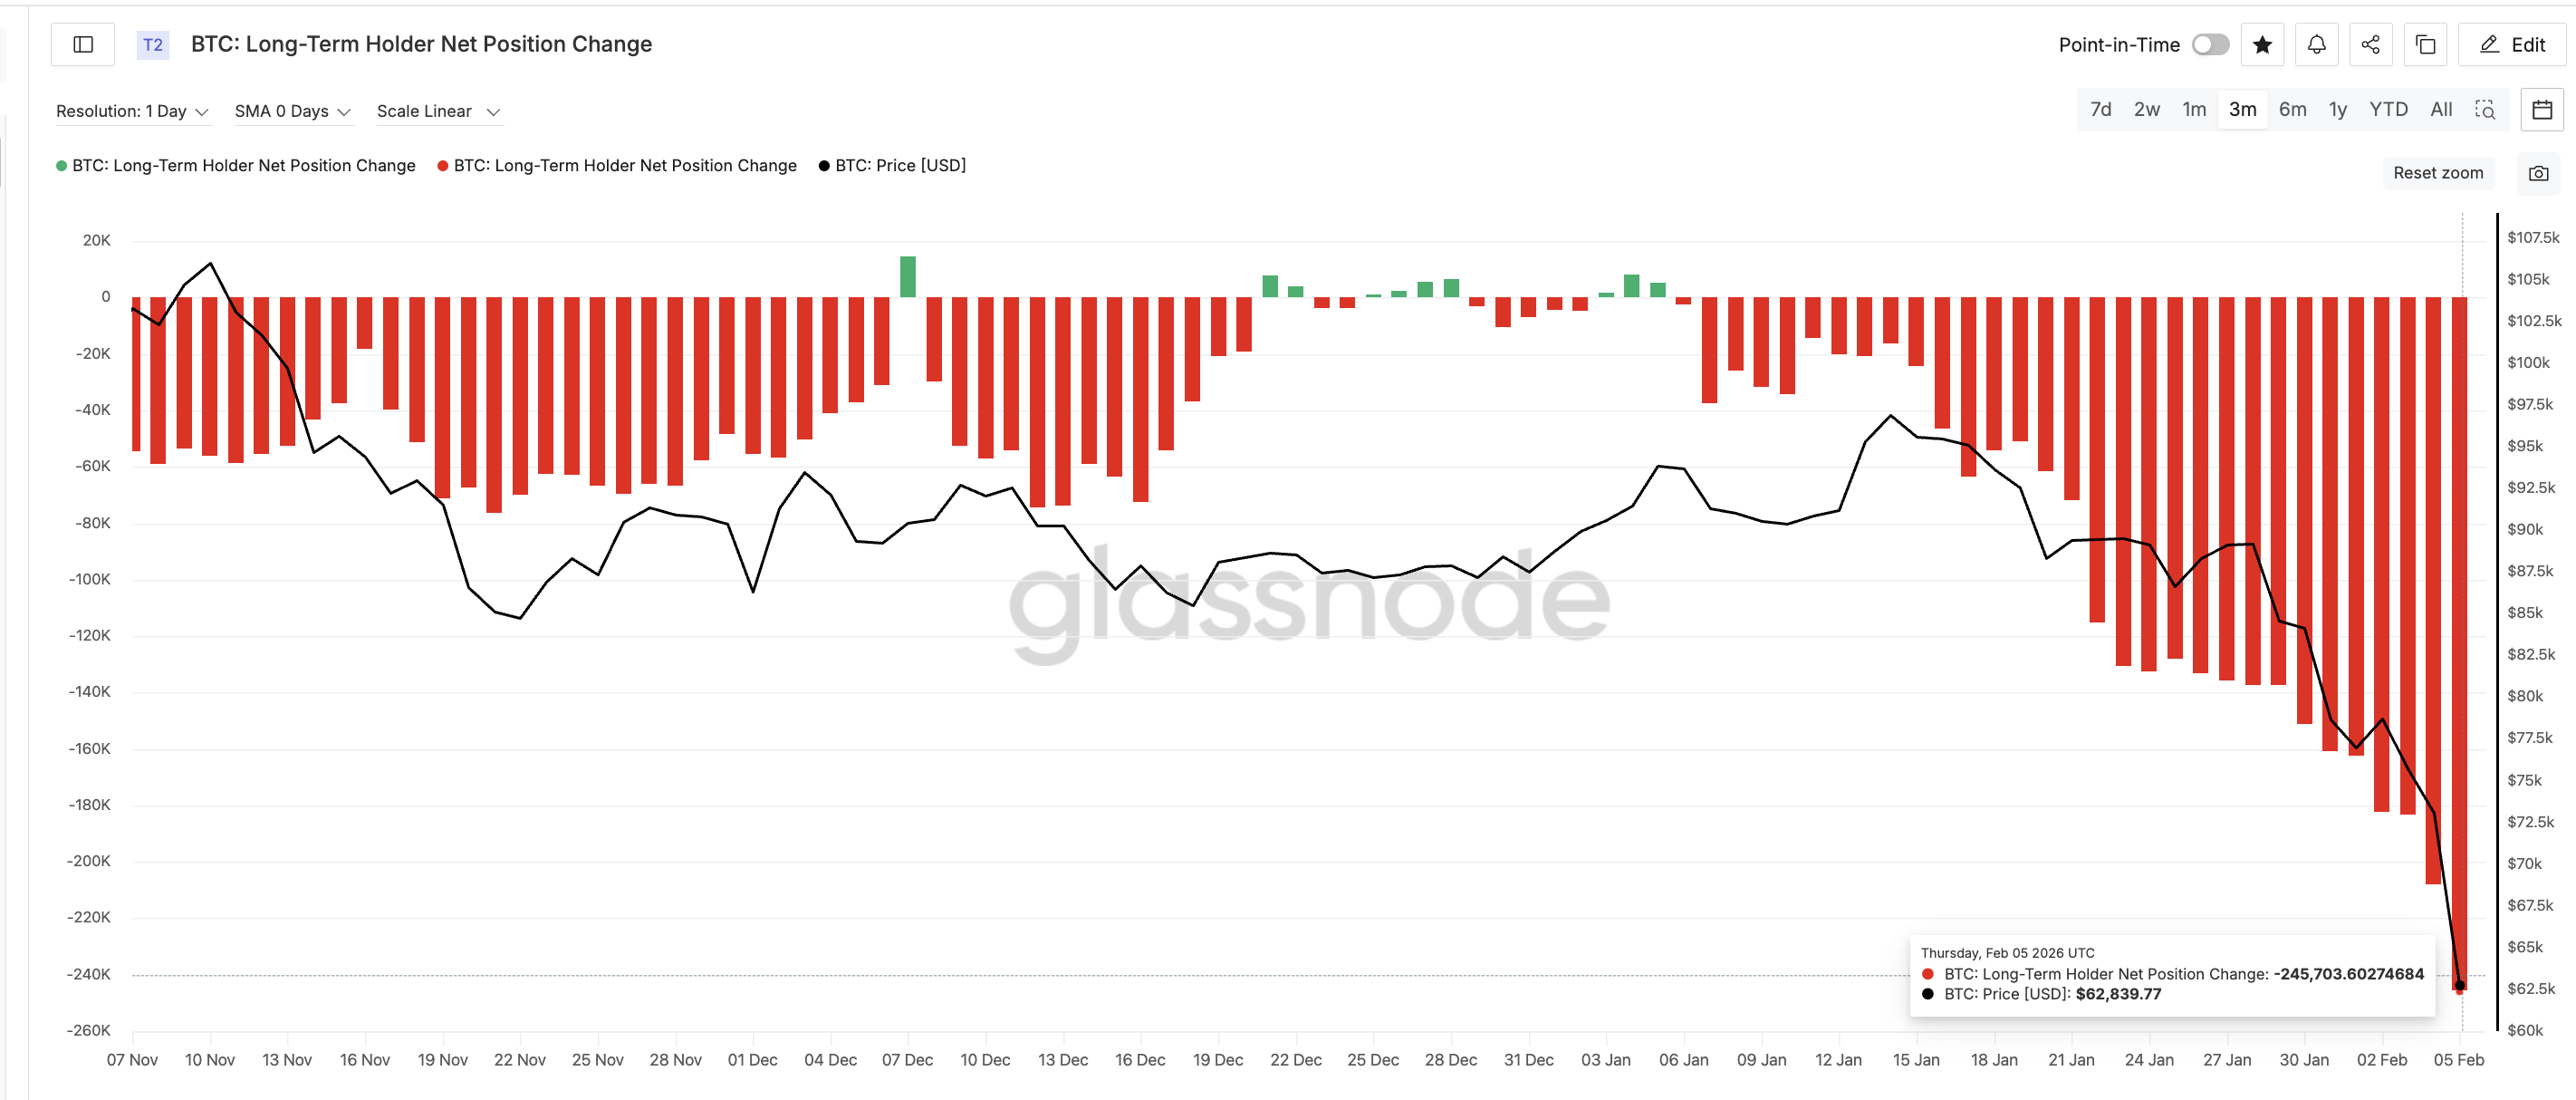
This represents a nearly 10,500% increase in long-term distribution in just one month. In simple terms, the most conviction-driven investors are still reducing exposure.
Sponsored
Sponsored
This behavior becomes more concerning when combined with the long-term holder realized price.
The realized price represents the average acquisition cost of coins held by long-term investors. Historically, when Bitcoin approaches or falls below this level, it signals deep market stress. In past cycles, major rallies only began after the price stabilized around this zone; however, not immediately.
Currently, the long-term holder realized price sits near $40,260.
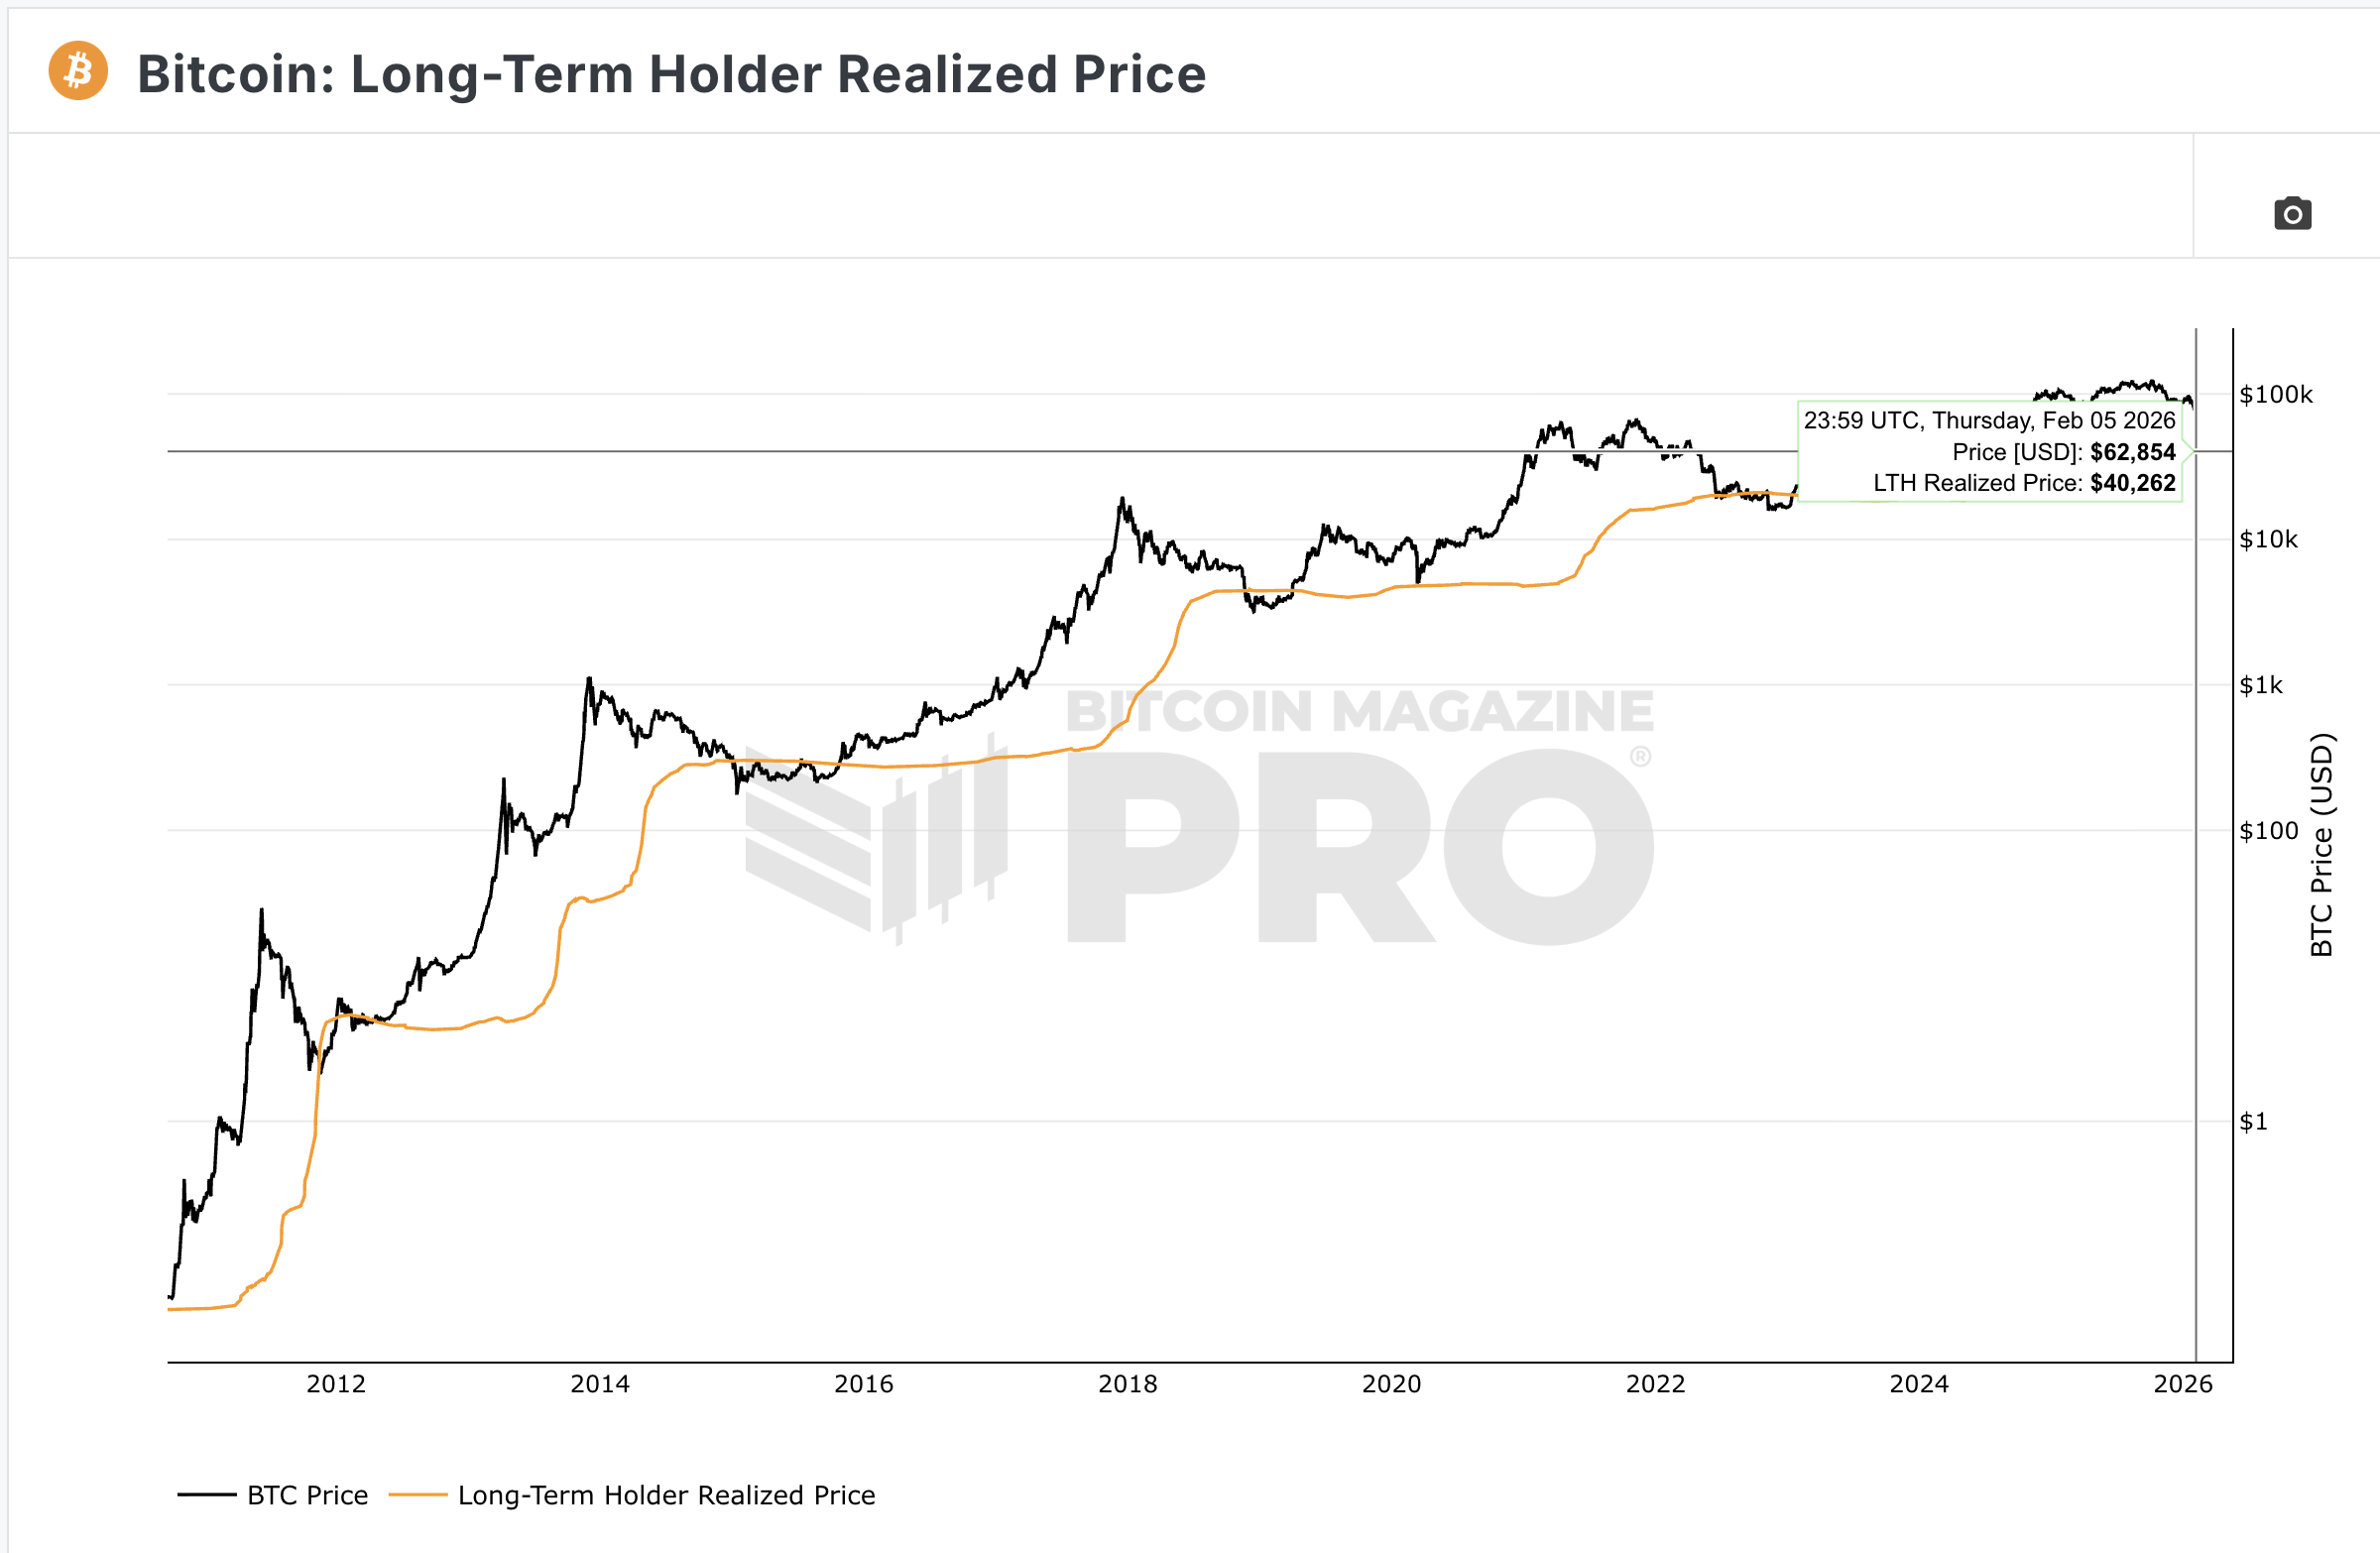
As Bitcoin moves closer to this level, more long-term investors approach breakeven. If the price drops below it, many enter losses, often accelerating capitulation. This dynamic played out in late 2022 before the final bear market bottom formed.
So far, that reset has not happened.
Long-term holders are still selling, not accumulating. Their realized price is becoming a key downside magnet. This suggests the market has not completed its full deleveraging and redistribution phase.
Sponsored
Sponsored
Key Bitcoin Price Levels Show Why $48,000 and $40,000 Matter Next
All technical and on-chain signals now converge around a few critical price zones.
On the downside, the first major support sits near $53,350. A failure here would expose the $48,800 region, which aligns with the bear flag target and prior consolidation zones.
If $48,800 breaks, attention shifts to the long-term holder realized price near $40,260.
This zone represents the deepest structural support in the current cycle. A move into this region would indicate broad capitulation among long-term investors and confirm a deeper bear phase.
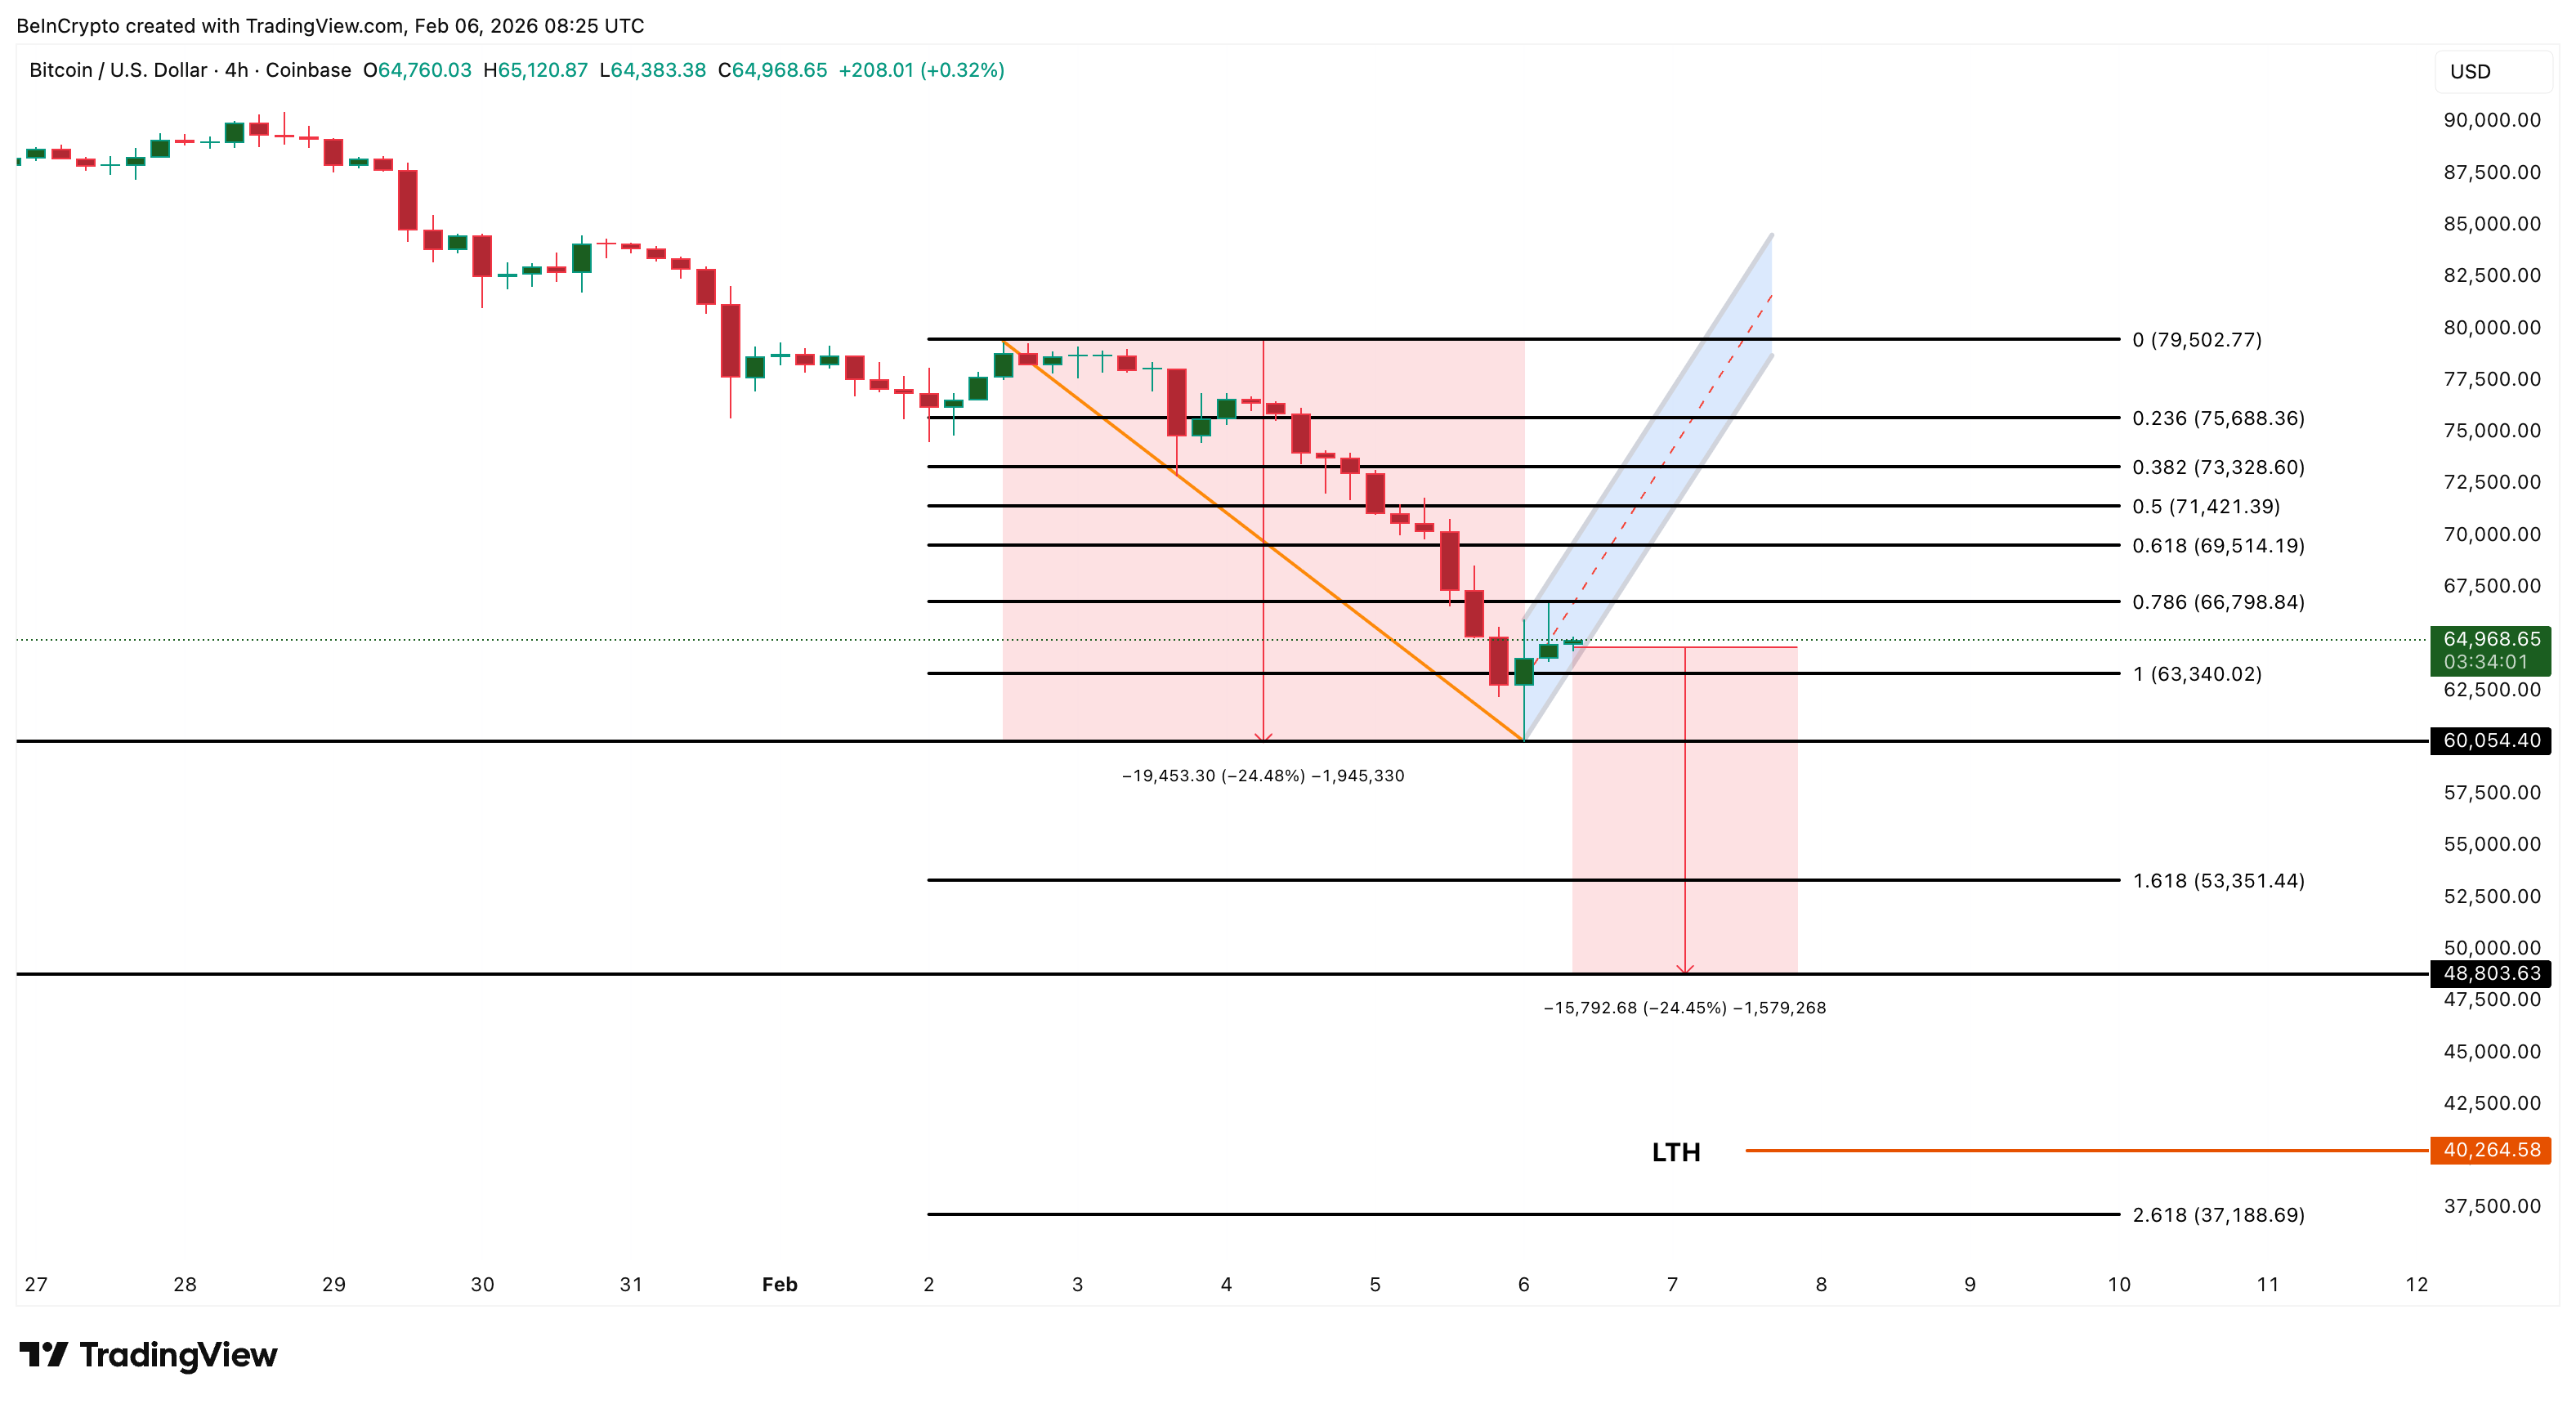
In a worst-case scenario, extended weakness could even open the door toward $37,180, based on longer-term projections and historical support clusters.
On the upside, Bitcoin must reclaim $69,510 on a sustained 4-hour closing basis to regain short-term credibility. A move above $73,320 would be required to invalidate the bearish pattern.
Until that happens, rallies remain vulnerable.
With leverage rebuilding, long-term holders still selling, and critical support levels approaching, the current rebound lacks structural confirmation. Under these conditions, buy-the-dip strategies remain exposed to sharp reversals rather than sustained upside.


DeFi risk curator Steakhouse Financial has been hacked and its website and app are now being used to host a phishing scam.
Steakhouse disclosed the breach Monday morning and warned that any new users interacting with the website or app are likely interacting with a malicious version implemented by the hackers.
The attack appears to have affected just the front-end of operations, as Steakhouse assured users, “No deposits are at risk. No contracts are affected. All Steakhouse depositors are safe.”
Read more: Fake Uniswap phishing ad on Google steals trader’s life savings
“We are working to restore the frontend as soon as possible,” the firm said.
Steakhouse co-founder, Sébastien Derivaux, warned crypto users to avoid the website until further notice.
Various crypto firms offered alternative services and safety assurances for customers with funds at Steakhouse.
Others found humor in the incident, with one user asking, “Does phishing on Steakhouse make this a surf and turf attack?”
At the time of writing, neither Steakhouse Financial or its CEO have shared any further updates on the incident.
Steakhouse Financial housing a crypto drainer
Crypto security firm Blockaid claims that the Steakhouse attackers are utilizing code from one of the “largest active wallet drainer operations onchain” known as Angelferno, or Angel Drainer.
Read more: Fears of $27M Venus Protocol hack turn out to be phishing attack on power user
Earlier this month, AI crypto firm GAIB fell victim to a social engineering scheme that gave hackers access to its domain, where they implemented a copycat website kitted with Angelferno.
Drainers work by stealing a user’s crypto after they sign a malicious transaction that gives hackers full access to withdraw their funds.
Blockaid was able to help GAIB detect the malware, and the malicious site was gone in roughly seven hours, with no apparent user losses.
Got a tip? Send us an email securely via Protos Leaks. For more informed news and investigations, follow us on X, Bluesky, and Google News, or subscribe to our YouTube channel.
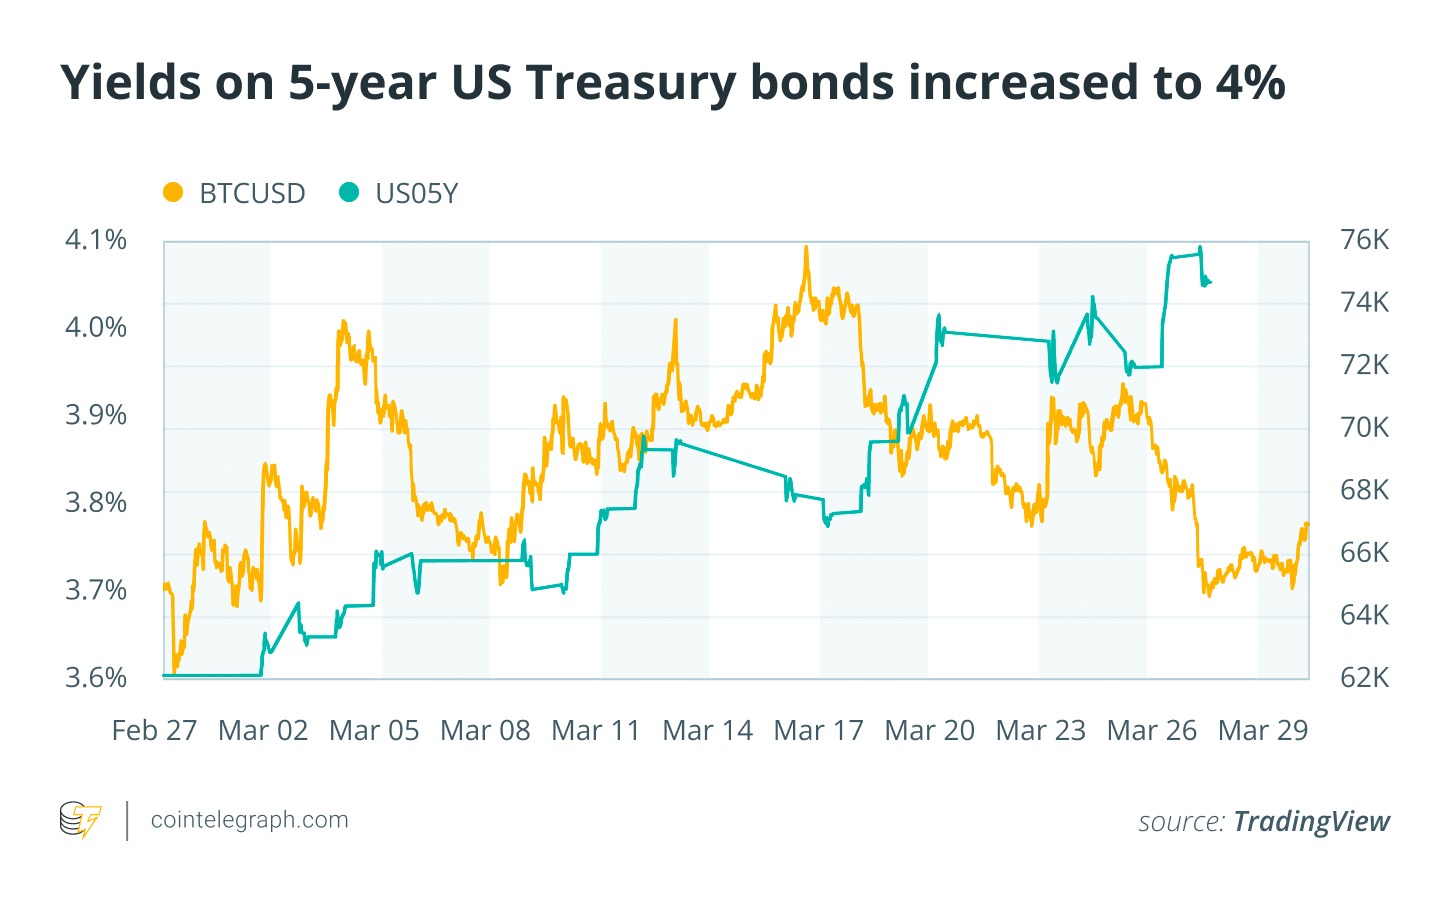
This month, Bitcoin’s hashrate fell 6% after the US and Israel attacked Iran, highlighting Iran’s significant crypto mining activity.
Bitcoin price, meanwhile, remains lackluster. Higher 4% yields on US Treasury bonds have added pressure, and investors are seeking less risky prospects amid geopolitical tension.
Less appetite for crypto trading has proven problematic for Robinhood. The trading platform’s stock is down 16% on the month, and leadership has announced a stock buyback program.
Prediction markets marked a record number of transactions, representing a more than 2,800% increase since this time last year.
Here’s March by the numbers:
Bitcoin lacks momentum as 4% US Treasury bond yields put pressure on price
Yields on five-year US Treasury bonds are up 4% in March, putting pressure on Bitcoin price. While showing some gains in mid March, the asset ended the month much where it started, around $67,000.

As per an analysis from Cointelegraph, fears of a drawn-out conflict between the US and Israel against Iran have led investors to cut out risk. A sell-off in bonds, along with a nine-month high of 4% in yields, suggests that traders are building cash positions.
Bitcoin hashrate falls nearly 6% after US and Israel attack Iran
On Feb. 28, the United States and Israel launched a joint special military operation in Iran called “Operation Epic Fury.” One month later, the Bitcoin (BTC) hashrate is down almost 6%.

Bloomberg crypto and digital assets strategist Dushyant Shahrawat said in a recent interview that Iran is one of the world’s largest Bitcoin miners, accounting for some 6-8% of global hashrate, and 70% of mining activities are conducted by the military.
Disruptions to the country’s energy infrastructure and diversion of military priorities to defense have thus hit Iran’s ability to mine Bitcoin.
Prediction market transaction top 192 million
Transactions on prediction markets like Polymarket and Kalshi topped 192 million in March. That represents a 24% increase from last month and a 2,880% increase compared to the same time last year, according to Dune analytics.

Related: Lawmakers push another bill to curb prediction market insider trading
Prediction markets are growing in popularity, but in the United States, they face state regulators who say they facilitate a form of gambling. At least 11 states have taken legal action against them.
On March 20, Carson City District Court Judge Jason Woodbury upheld a regulator’s move to temporarily ban prediction market Kalshi in Nevada.

Arizona has brought criminal charges against Kalshi for allegedly “running an illegal gambling operation and taking bets on Arizona elections, both of which violate Arizona law.”
Other states like Utah and Pennsylvania are currently considering legislation that would bring prediction markets under state gambling or gaming laws. Kalshi says that it answers only to federal regulation under the Commodity Futures Exchange Commission (CFTC).
Euro-denominated stablecoins account for 85% of non-dollar volume
Stablecoins backed by the euro have emerged as a favorite alternative to assets backed by US dollars. Some 85% of non-dollar stablecoin volumes occur in euros, according to a March report from Dune.

While euro-denominated coins initially only represented some 50-70% of the non-dollar market, they began expanding significantly in 2024. Now they represent 85% of total transferred volume. Euro stablecoins are also dominant in regard to participation, with user share rising to over 78%.
Dune attributes this increase to more confidence in stablecoins among institutions, thanks in large part to the Markets in Crypto-Assets regulatory package (MiCA).
Robinhood stock down 16% on month
Robinhood stock has decreased over 16% in March, from nearly $80 to $66 as of publishing time.

The stock and crypto trading company’s share price has been struggling in recent months. Over the last six months, it dropped over 50%. Uncertainty over the regulation of new verticals like prediction markets and social trading, along with a collapse in crypto trading revenues are creating structural obstacles for the company.
Revenue from crypto transactions reportedly dropped 38% year-over-year as of Q4 2025. Crypto app volumes dropped 58%.
To address the problem, Robinhood has approved a $1.5 billion share buyback program in March, which will execute over the next three years.
Strategy’s Bitcoin holdings are 11% in the red
Amid a lackluster price action on the month, Strategy’s Bitcoin portfolio is at an 11% loss. The average cost of Bitcoin in its portfolio is $75,669. Bitcoin is trading around $67,800 at publishing time.

Still, the company has continued its regular Bitcoin purchases. It made two this month: one for 17,994 Bitcoin on March 9 and another for 22,337 Bitcoin on March 16, amounting to roughly $2.7 billion at publishing time.
The software company has financed most of its Bitcoin purchases through high-yield stock offerings, like Stretch (STRC). This allows the company to buy Bitcoin without diluting its MSTR common shares.
The company’s chair, Bitcoin bull Michael Saylor, said recently that 80% of STRC buyers are retail investors. “Retail investors prefer low-volatility, high-yield digital credit,” he said.
Magazine: XRP yet to ‘price in’ 3 bullish catalysts, Bitcoin to $80K? Trade Secrets

Brent crude punched through $116 a barrel on March 30, 2026 – a 60% monthly surge driven by escalating US-Iran tensions after Tehran accused Washington of preparing an invasion, compounding Houthi strike disruptions, and Bitcoin is now sitting in the crosshairs of the resulting institutional risk-off rotation.
The oil price spike is not hitting crypto directly; it’s hitting it through three compounding channels: inflation re-acceleration, delayed Fed rate cuts, and a geopolitical risk premium that is draining leveraged long exposure across every risk asset class.
Bitcoin dropped to weekly lows between $63,000 and $65,700, over $500 million in derivatives liquidations hit the tape, and 84% of that came from long positions.
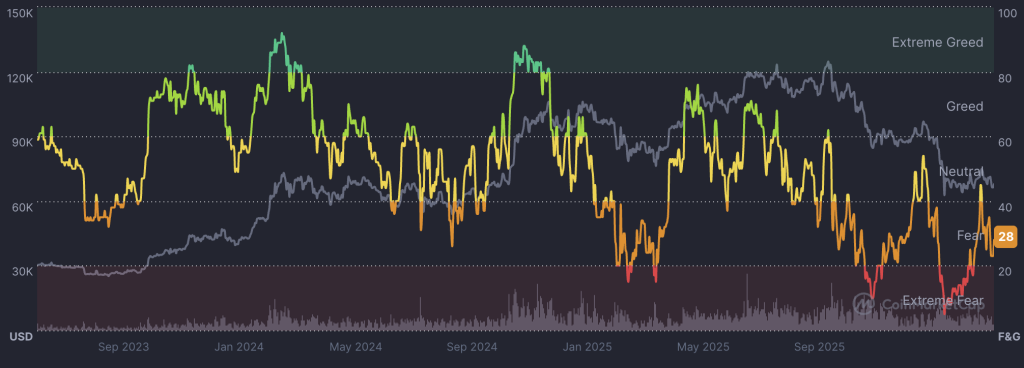
The Fear & Greed Index collapsed to 28 – Extreme Fear – while a record $14 billion options expiry amplified the volatility.
Discover: The best crypto to diversify your portfolio with
Bitcoin Faces Structural Deleveraging as Oil-Driven Inflation Rewrites the Fed Playbook
$63,000 is the line Bitcoin cannot afford to lose.
That level has capped the downside through the prior 2 macro shock episodes. The 200-day moving average sits just below at $62,400.
A close beneath it would be the first since the October 2025 rally began and would likely trigger a second wave of systematic deleveraging from quant funds running momentum strategies. Resistance above is layered at $67,500 and $71,000, both former support zones that flipped during the February selloff.

The oil correlation matters more than usual right now. Binance Research puts the Bitcoin-WTI correlation near zero across most market regimes.
The 30-day rolling correlation currently sits at just 0.15. But that changes during extreme disruption events. The Strait of Hormuz is flowing at roughly 4 million barrels per day against a normal 20 million. That is not a tail risk. That is an active structural supply shock, exactly the kind that produces temporary correlation spikes.
If US-Iran tensions de-escalate and Hormuz flows normalize, Brent retreats below $100 and the Fed signals patience at its April 1 to 2 meeting. Bitcoin reclaims $67,500, BlackRock’s IBIT builds on its $225.2 million inflow during the dip, and institutional rotation flips back into accumulation mode.
If tensions persist without full escalation, Brent holds $110 to $116 and the Fed stays hawkish through Q2. Bitcoin grinds between $63,000 and $68,000 with elevated volatility, ETF flows stay choppy, and mining costs for operators like Marathon Digital rise 15 to 25%.
“The United States of America is in serious discussions with A NEW, AND MORE REASONABLE, REGIME to end our Military Operations in Iran.” – President Donald J. Trump
pic.twitter.com/0MWL2hSNmK
— The White House (@WhiteHouse) March 30, 2026
A full Hormuz blockade is the scenario nobody wants to price. Oil above $130, 10-year Treasury yields breaking above 5%, and the Fed forced to choose between fighting inflation and supporting growth.
That combination could send Bitcoin to $55,000 to $57,000 in a full risk-off liquidation wave, mirroring February 2022 when WTI hit $115 and BTC fell from $45,000 to $39,000 in days.
The inflation channel is what most traders are underweighting. Sustained oil above $100 does not just pressure sentiment. It mechanically delays rate cuts.
Bitcoin’s slide below $67,000 alongside rising Treasury yields already showed how directly that linkage bites. BTC’s 0.9 correlation to the IGV tech index means it trades like a rate-sensitive growth asset in the short run, not an inflation hedge.
Watch the Fed’s April 1 to 2 meeting. Any language signaling a longer hold is the catalyst for the next leg down. Congressional votes on Iran sanctions expected mid-April carry equal weight. Further Hormuz disruption sends another shock through energy markets and straight into institutional risk appetite.
Discover: The best pre-launch token sales
The post Oil at $116: Why This Macro Shock Could Trigger a Bitcoin Risk-Off Deleveraging appeared first on Cryptonews.


BitMine Immersion Technologies (BMNR) made its largest weekly purchase of either (ETH) this year, adding 71,179 ETH and extending a month-long ramp-up in buying even as crypto prices remain under pressure.
The purchase, worth roughly $143 million at current prices, lifted the company’s total holdings to over 4.73 million ETH, about 3.92% of the token’s supply, according to a Monday update. BitMine has now increased its buying pace for four straight weeks, stepping up from a prior average of 45,000 to 50,000 ETH.
The move stands out as most other large digital asset treasuries (DAT) halted crypto accumulation or even sold tokens during the crypto market downturn. Strategy (MSTR), the largest corporate bitcoin owner, was the only other major buyer in the recent months, and even the Michael Sayler-led company refrained, breaking a 13-week buying streak.
Bitmine Chairman Thomas “Tom” Lee said the firm continues to see the current market as the final phase of a downturn as rising oil prices and geopolitical tensions keep risk assets under pressure.
The company’s total crypto and cash holdings stood at $10.7 billion. In addition to its ETH treasury, BitMine held 197 bitcoin, and $961 million in cash and equity stakes, including $102 million in Eightco Holdings.
Digital asset investment products posted their first weekly outflows in over a month, as a mix of geopolitical tensions and shifting monetary policy expectations rattled investor confidence.
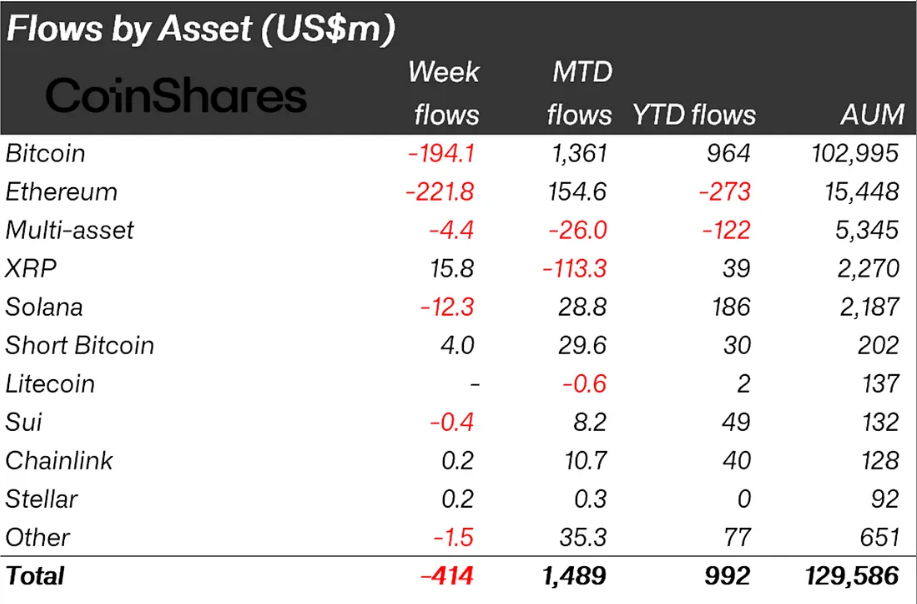
According to the latest data, crypto funds saw $414 million in net outflows, marking a sharp reversal after five consecutive weeks of inflows.
Crypto Funds Lost $414 Million Last Week
The pullback coincided with rising tensions tied to the Iran conflict and a notable shift in expectations around the Federal Reserve, as markets pivot from anticipating rate cuts to pricing in potential hikes.
The US accounted for the bulk of the outflows, with $445 million exiting digital asset funds, highlighting a decisive risk-off stance among American investors.
In contrast, European markets showed signs of opportunistic buying. Investors in Germany and Canada added $21.2 million and $15.9 million, respectively, suggesting confidence in long-term valuations despite short-term volatility.
Among individual assets, Ethereum was hit hardest, recording $222 million in outflows. The move pushed its year-to-date flows into negative territory, reflecting sustained pressure that analysts link in part to regulatory uncertainty surrounding the Clarity Act.
Bitcoin also faced headwinds, shedding $194 million during the week. However, it continues to show resilience, maintaining a strong $964 million in net inflows for the year so far.
This suggests that while short-term sentiment has weakened, institutional conviction in Bitcoin remains intact.
In contrast, XRP stood out as a rare gainer, attracting $15.8 million in inflows. Its performance positions it as a relatively safe haven within the digital asset space during periods of broader market stress.
The latest fund flow data shows how quickly sentiment in crypto markets can shift when macroeconomic and geopolitical risks converge, leaving investors to reassess their exposure in an increasingly uncertain environment.
The post Geopolitics and the Fed Flush $414 Million From Crypto Funds in a Week appeared first on BeInCrypto.
Key takeaways
-
Hong Kong’s 2026-27 budget marks a shift from experimental digital bond projects to the direct integration of tokenized issuance and settlement into the city’s regulated financial market infrastructure.
-
CMU OmniClear, a subsidiary of the Hong Kong Monetary Authority, will build a digital asset platform to support tokenized bond issuance and settlement. This embeds digital securities within Hong Kong’s established clearing and post-trade framework.
-
Hong Kong has issued multiple tokenized government bonds, including a HK$10 billion digital bond in 2025. Authorities plan to make such offerings a regular feature to deepen market participation and improve liquidity.
-
Hong Kong is introducing stablecoin licensing, digital asset dealer and custodian regulations and compliance rules aligned with global tax transparency standards to support a fully regulated digital asset market.
For years, tokenized bonds were discussed as a future upgrade to capital markets. In Hong Kong, that transition is now moving into practice.
The city’s 2026-27 budget marks a pivotal turning point. Tokenization is no longer confined to isolated experiments but is being integrated into the heart of Hong Kong’s financial ecosystem. By embedding issuance and settlement directly into its post-trade systems, the city is moving beyond one-off digital deals to create a standardized, regulated environment.
This article explores how Hong Kong is integrating tokenized bonds into its financial infrastructure through a new digital platform developed by CMU OmniClear, a subsidiary of the Hong Kong Monetary Authority (HKMA), regular government issuances and supportive regulations. This development reflects a shift from experimental pilots to scalable, institutional-grade digital capital market systems.
Hong Kong’s advancing tokenized bond program
Hong Kong has already completed several rounds of tokenized government bond issuances. In Q4 2025, the government launched its third series, valued at HK$10 billion, approximately US$1.28 billion. Authorities have since confirmed that these tokenized bond offerings will continue on a regular basis.
The 2026-27 budget, however, marked a significant escalation.
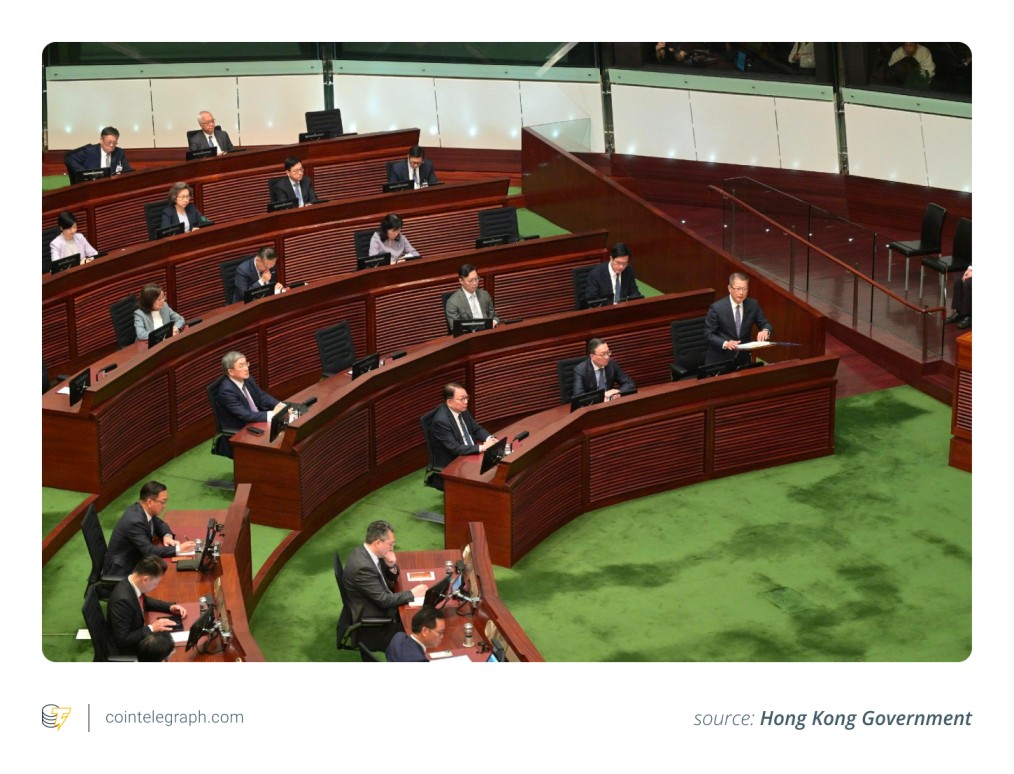
Financial Secretary Paul Chan stated that CMU OmniClear Holdings, a wholly owned subsidiary of the HKMA, will develop a dedicated digital asset platform. The platform is designed to handle both the issuance and settlement of tokenized bonds.
Importantly, the system is being built with long-term expansion in mind. It will:
-
Be progressively extended to support a wider range of digital assets beyond government bonds
-
Establish interoperability with tokenization platforms in other regional jurisdictions
-
Become fully integrated into Hong Kong’s broader post-trade financial ecosystem
This final aspect, deep integration into core market infrastructure, is what elevates tokenization from experimental pilots to a foundational element of the financial system.

CMU OmniClear: From experiment to core infrastructure
CMU OmniClear is far from a standalone startup or proof-of-concept project. It operates as an integral part of Hong Kong’s established clearing and settlement framework. Regulators have entrusted tokenized bond settlement to an entity directly linked to the HKMA. They have integrated digital securities into the same system that already processes conventional financial instruments.
This strategic move reshapes the tokenization story in three key ways:
-
Standardization replaces experimentation: Rather than relying on custom-built, one-off digital bond structures, issuance and settlement can now follow uniform regulatory rules and proven operational protocols.
-
Clear regulatory oversight: With supervision anchored directly under the central banking authority, legal and compliance uncertainty is significantly reduced.
-
Built-in scalability: Core market infrastructure is designed to handle institutional-scale volumes, not just small-scale trials or limited pilots.
Tokenization is no longer an add-on or side project. It is becoming embedded in the core plumbing of Hong Kong’s financial system.
Did you know? The concept of tokenized bonds builds on the broader idea of tokenizing real-world assets (RWAs). Trillions of dollars’ worth of traditional financial assets, such as bonds, real estate and funds, could eventually move onto blockchain-based infrastructure.
Government issuance: Already scaling
Hong Kong’s tokenized bond program is already demonstrating meaningful scale. Rather than building infrastructure in anticipation of future demand, Hong Kong is responding to existing market interest.
The government’s third tokenized bond issuance, completed in late 2025, reached a record size of HK$10 billion, approximately US$1.28 billion to US$1.3 billion, marking the world’s largest digital bond offering to date. This followed earlier digital bond issuances that also attracted strong investor demand. Authorities have now pledged to make tokenized bond issuance a regular practice rather than relying on occasional pilots.
This steady approach delivers several key benefits:
-
Builds investor comfort and familiarity with tokenized products
-
Draws participation from conventional asset managers
-
Reinforces that tokenization has strong official policy support, moving it beyond experimental status
Consistent and predictable issuance is essential to developing deeper, more liquid markets.
Beyond bonds: Building a digital asset ecosystem
Hong Kong’s ambitions extend well beyond tokenized bonds. The 2026-27 budget outlines additional regulatory steps to foster a broader digital asset ecosystem.
Stablecoin licensing regime
The HKMA is moving toward issuing its inaugural set of licenses for fiat-referenced stablecoins, with the first approvals expected in early 2026.
The licensing assessments emphasize:
-
The strength and quality of asset reserves
-
Robust risk management practices
-
Effective anti-money laundering (AML) and compliance controls
-
Well-defined, legitimate use cases
Stablecoins are not inherently tied to bond settlement. However, the introduction of regulated digital fiat equivalents could enable compliant and efficient settlement mechanisms for tokenized securities and other digital assets.
Did you know? The first blockchain bond issued by a multilateral institution was launched by the World Bank in 2018. Called “Bond-i” (Blockchain Operated New Debt Instrument), it used distributed ledger technology to manage bond issuance and settlement.
Licensing for digital asset dealers and custodians
Hong Kong is advancing its regulatory framework by introducing dedicated licensing regimes for key digital asset service providers.
The government plans to table legislation in 2026 establishing licensing requirements for:
-
digital asset dealing platforms, including over-the-counter (OTC) brokers, block traders, and other intermediaries involved in buying, selling, or exchanging virtual assets
-
custodian service providers focused on safeguarding private keys, segregating client assets, and ensuring strong security and operational controls
These measures will bring a broader range of participants under formal supervision. Dealers will face standards comparable to those applied to conventional securities firms, while custodians will be subject to stringent requirements for asset protection and key management.
By covering issuance, trading, custody, and reporting activities, the regime creates a fully supervised ecosystem for tokenized bond markets and other digital securities, enhancing investor protection and market integrity.
Alignment with global tax transparency standards
To reinforce its commitment to international compliance, Hong Kong is amending the Inland Revenue Ordinance to adopt the Organisation for Economic Co-operation and Development’s (OECD) Crypto-Asset Reporting Framework (CARF).
The implementation will apply to reporting by crypto-asset service providers (CASPs), starting in 2027. Information exchanges would begin in 2028, enabling the automatic exchange of tax-related data on crypto transactions with partner jurisdictions.
The move underscores a clear policy stance. Hong Kong’s tokenized and digital asset markets are being designed to be fully interoperable, transparent, and aligned with global standards. These are essential prerequisites for attracting and retaining institutional capital on a sustainable basis.
Did you know? Traditional bond settlement often takes two business days (T+2) in many markets. Tokenized bonds could potentially enable near-instant settlement, reducing counterparty risk and freeing up capital more quickly.
The liquidity layer: Building deeper regulated crypto markets
In early 2026, the Hong Kong Securities and Futures Commission (SFC) issued new guidance enabling licensed virtual asset brokers to provide margin financing for digital assets. Initially, the framework focused on Bitcoin (BTC) and Ether (ETH) collateral, with safeguards for creditworthy clients. The SFC also published a high-level framework allowing licensed virtual asset trading platforms (VATPs) to offer leveraged perpetual contracts.
These developments significantly enhance market liquidity in a controlled manner while preserving strong investor protections and risk management standards. They form part of a multilayered strategy to:
-
Broaden the scope of regulated digital asset markets
-
Uphold institutional-grade guardrails and compliance
-
More seamlessly bridge digital and traditional finance
Tokenized bonds are not standalone experiments. They sit within a comprehensive, integrated digital financial architecture designed for scale and sustainability.
How tokenized bond infrastructure operates in practice
Tokenized bond infrastructure combines several interconnected layers built on blockchain or distributed ledger technology:
-
Issuance: The issuer originates the bond as a digital token directly on a permissioned or regulated ledger, embedding coupon terms, maturity and covenants into smart contracts or digital records.
-
Primary allocation: Subscriptions and allocations occur through regulated intermediaries, such as banks, brokers or platforms, ensuring Know Your Customer (KYC) and AML compliance and orderly distribution to qualified investors.
-
Settlement and custody: True delivery-versus-payment (DvP) is achieved through integrated systems managed by recognized market infrastructure providers, including central securities depositories or clearing houses adapted for tokenization. Custody is handled by licensed providers with segregated assets and secure key management.
-
Post-trade lifecycle: Ongoing events, such as coupon or interest payments, principal redemptions at maturity, and the handling of corporate actions, are automated through programmable logic. This reduces manual intervention, settlement risk and operational costs.
The critical distinction between early pilots and true infrastructure lies in repeatability, institutional integration, and scale. Mature infrastructure enables frequent, large-volume issuances while interfacing smoothly with existing clearing, settlement, custody and reporting systems. This creates the foundation for liquid, efficient secondary markets.
Why this matters for global markets
Hong Kong’s strategy reflects deliberate, long-term positioning in the changing financial sector.
By integrating tokenized bond issuance and settlement into infrastructure closely aligned with the central bank, and by fostering connectivity with regional platforms and counterparties, Hong Kong is working to:
-
Solidify its status as Asia’s leading regulated digital asset and tokenized securities hub
-
Channel meaningful cross-border institutional capital flows into and through the city
-
Offer institutional investors a compliant, scalable and well-regulated tokenization ecosystem
Hong Kong is competing on regulated reliability, predictable rule-making and institutional-grade infrastructure. These factors matter significantly to large asset managers, banks and sovereign wealth funds.
Prevailing risks and challenges
Implementing ambitious infrastructure does not automatically eliminate structural challenges. Several significant hurdles remain:
-
Achieving genuine interoperability across different tokenization platforms, protocols and ledgers
-
Securing legal and regulatory harmonization with other major jurisdictions to enable smooth cross-border issuance, trading and settlement
-
Keeping AML, KYC, sanctions and broader compliance frameworks aligned with the rapid pace of technological change
-
Avoiding liquidity fragmentation, where trading volumes are split inefficiently across siloed digital systems, undermining market depth
Building the digital financial rails is only the first phase. Sustained market adoption, active secondary trading, broad institutional participation and organic liquidity growth will determine whether Hong Kong’s vision translates into lasting global relevance.
Cointelegraph maintains full editorial independence. Guides are produced without influence from advertisers, partners or commercial relationships. Content published in Guides does not constitute financial, legal or investment advice. Readers should conduct their own research and consult qualified professionals where appropriate.
Disclosure: This article does not represent investment advice. The content and materials featured on this page are for educational purposes only.
Exolix gains traction in 2026 as developers seek fast, reliable crypto exchange API solutions.

As the crypto ecosystem grows, infrastructure is now an essential part of every product, from crypto wallets and exchanges to fintech applications and web3 projects. Most products rely on APIs to support key functionalities such as price feeds, access to liquidity, and transaction execution. As such, finding the best crypto API is no longer a choice but a necessity.
However, the best crypto API remains a concern for many projects and teams. The best crypto API depends on a few key factors: ease of integration, reliability, and the speed at which the product can be deployed without having to build complex infrastructure from scratch.
Exolix is emerging as one of the best crypto exchange API providers in the market in 2026 by addressing the key requirements of the crypto ecosystem. It offers the best crypto API due to its fast deployment capabilities, which provide developers with the best way to integrate crypto swap functionalities into their products. As such, the Exolix crypto exchange API is the best choice for teams seeking the best crypto API for startups.
What Is Exolix API?
Exolix API is a crypto infrastructure product that enables developers to add instant exchange capabilities to their applications. Instead of developing complicated exchange systems or dealing with the intricacies of working with multiple liquidity providers, developers can integrate with Exolix and allow users to exchange cryptocurrencies within the interface.
This makes Exolix API one of the best crypto exchange APIs, especially for projects that wish to add crypto-to-crypto exchange capabilities to their applications.
The API is also lightweight and easy to implement. Some of the key functionalities that can be integrated using the API are as follows:
- execution of crypto swaps across various assets
- real-time calculation of the rate
- tracking of the status of transactions
- cross exchange support
This simplicity also makes Exolix one of the best crypto APIs for startups, as the teams involved in the development of the startups need to launch the projects as soon as possible without having to spend much time and resources on the development of the back end.
Another significant factor related to the API is the non-custodial nature of the API. This means that the users are in full control of the money during the exchange process, which is also in line with the current trend of moving towards more decentralized and user-friendly financial tools.
Why Exolix Is One of the Best Crypto API Providers in 2026
As the number of crypto infrastructure providers grows, the line between an excellent API and the best crypto API comes down to usability, reliability, and performance in the real world. Exolix, in 2026, stands out as an API that focuses on the practical needs of developers, ease of integration, execution, and support.
While some APIs are difficult to set up or require significant technical expertise, Exolix has been created to be simple to use, and this is just one reason it is often considered to be among the best crypto APIs, especially for startups and growing web3 products.
Easy API integration
One of the key advantages of Exolix is the ability of the developers to get started as quickly as possible. This is because the API is quite straightforward.
Developers can explore integration on the developers page.
The key advantages of integrating with Exolix are:
- Simple request and response structure
- Quick onboarding process
- No need to build exchange infrastructure
- Ability to integrate with xisting apps and wallets
This makes Exolix a strong contender for the best crypto exchange API, especially for development purposes.
24/7 Technical Support
Another key aspect in selecting the top API for crypto is reliable support. This is because, in the event of any problems related to swaps, rates, or integration, user experience is affected.
Exolix offers technical support around the clock, enabling teams to quickly address any problems, ensuring optimal performance.
This is especially useful for:
- Startups with small engineering teams
- Platforms with users in different time zones
- Platforms that need to be available 24/7
Integration and Revenue Opportunities
Exolix is constantly improving its API infrastructure to ensure ease of integration for wallets, apps, and crypto platforms to include non-custodial cross-chain swaps in their products. This API is flexible and simple to implement to ensure ease of integration for our partners.
Revenue Share Model
One of the main advantages of integrating with Exolix is our revenue share model. This model ensures our partners receive a share of revenue from swaps done on their platforms. This creates an additional revenue source for our partners.
This means our partners can:
- Monetize their current user base
- Create an additional revenue source
- Improve their products without adding operational overhead
Integration assistance for Developers
Apart from that, Exolix is also offering assistance during the integration process itself. This is going to help teams that may not have the best knowledge of the underlying crypto infrastructure.
The assistance that is going to be available during the integration process is as follows:
- Guidance on implementing the API
- Troubleshooting during the setup process
- Optimization hints for the best performance
- Assistance with edge cases during transactions
This is going to help Exolix become one of the best crypto APIs around.
Key use cases for Exolix API
The flexibility of Exolix makes it perfect for various crypto products. Whether it is developing a crypto wallet, exchange, or any other related application, the right crypto API can help to achieve new heights without adding complexity to the development process.
Exolix is all about simplicity and compatibility, and this is why it is used in various applications that demand timely development and user experience. This is why it is considered one of the best crypto APIs for startups.
Wallet Integration
Crypto wallets are one of the most common applications of the Exolix API. The swap feature is integrated into the user interface of the wallet, allowing the user to swap assets without exiting the application. This is a great way to retain the user and provide a richer experience.
Exchange and trading platforms
For projects that need instant swaps without the hassle of building their own trading engine, Exolix is available as a backend solution. This is the reason Exolix is considered one of the best crypto exchange APIs available today.
Web3 and DeFi applications
Decentralized applications may utilize Exolix, which offers the possibility of cross-chain swaps as well as the moving of assets between different chains.
Startup products and MVPs
For early-stage teams, the key is speed, and Exolix helps teams launch their products quickly by not requiring them to develop from scratch.
This makes Exolix an excellent choice among the best crypto APIs for startups, especially when developing:
- MVPs
- Early product tests
- Quick iteration cycles
With the ability to accommodate multiple use cases with a single integration, Exolix offers a scalable base for various types of crypto products at different stages of development.
FAQ
What is Exolix API?
Exolix API is a product that serves as a solution for building a cryptocurrency infrastructure that can facilitate instant cryptocurrency exchange. The API can be used by developers to add instant cryptocurrency exchange capabilities to their platforms.
Why is Exolix considered one of the best crypto APIs?
Exolix API is regarded as one of the best free crypto APIs because it is simple, has a quick onboarding process, and is reliable. The API has a feature that allows users to make cross-chain swaps, has clear documentation, and is available 24/7. These features make it a feasible choice for both new and old cryptocurrency products.
Is Exolix suitable for startups?
Yes, Exolix is an excellent choice in the list of the top-rated APIs in the cryptocurrency industry. It is an excellent choice for startups that want to launch their project without the need to build their exchange infrastructure. This way, the startup can save time and money while still providing the feature of cryptocurrency swaps.
Does Exolix API require complex integration?
No, one of the biggest advantages of using Exolix is that it is easy to integrate. The API is easy to use and has a simple structure. Moreover, there is support available during the integration process. A developer can easily start using the API with the documentation provided on the official website.
What can you build with Exolix API?
The Exolix API is an excellent choice for developers who want to create different cryptocurrency-related products such as wallets, exchange interfaces, and Web 3 applications. It is also used to add instant swap functionality, which makes it one of the top-rated cryptocurrency exchange API solutions.
Disclosure: This content is provided by a third party. Neither crypto.news nor the author of this article endorses any product mentioned on this page. Users should conduct their own research before taking any action related to the company.
The crypto market will welcome tokens worth more than $643 million in the first week of April 2025. Major projects, including Hyperliquid (HYPE), Sui (SUI), and Ethena (ENA) will release significant new token supplies.
These unlocks could introduce market volatility and influence short-term price movements. So, here’s a breakdown of what to watch.
1. Hyperliquid (HYPE)
- Unlock Date: April 6
- Number of Tokens to be Unlocked: 9.92 million HYPE
- Released Supply: 415.33 million HYPE
- Total Supply: 1 billion HYPE
Hyperliquid is a leading decentralized perpetual futures exchange built on its own Layer-1 blockchain. It offers high-performance trading with low latency, on-chain order books, and sub-second transaction finality.
On April 6, the team will unlock 9.92 million HYPE worth $375.84 million. The tokens account for 2.66% of the released supply.
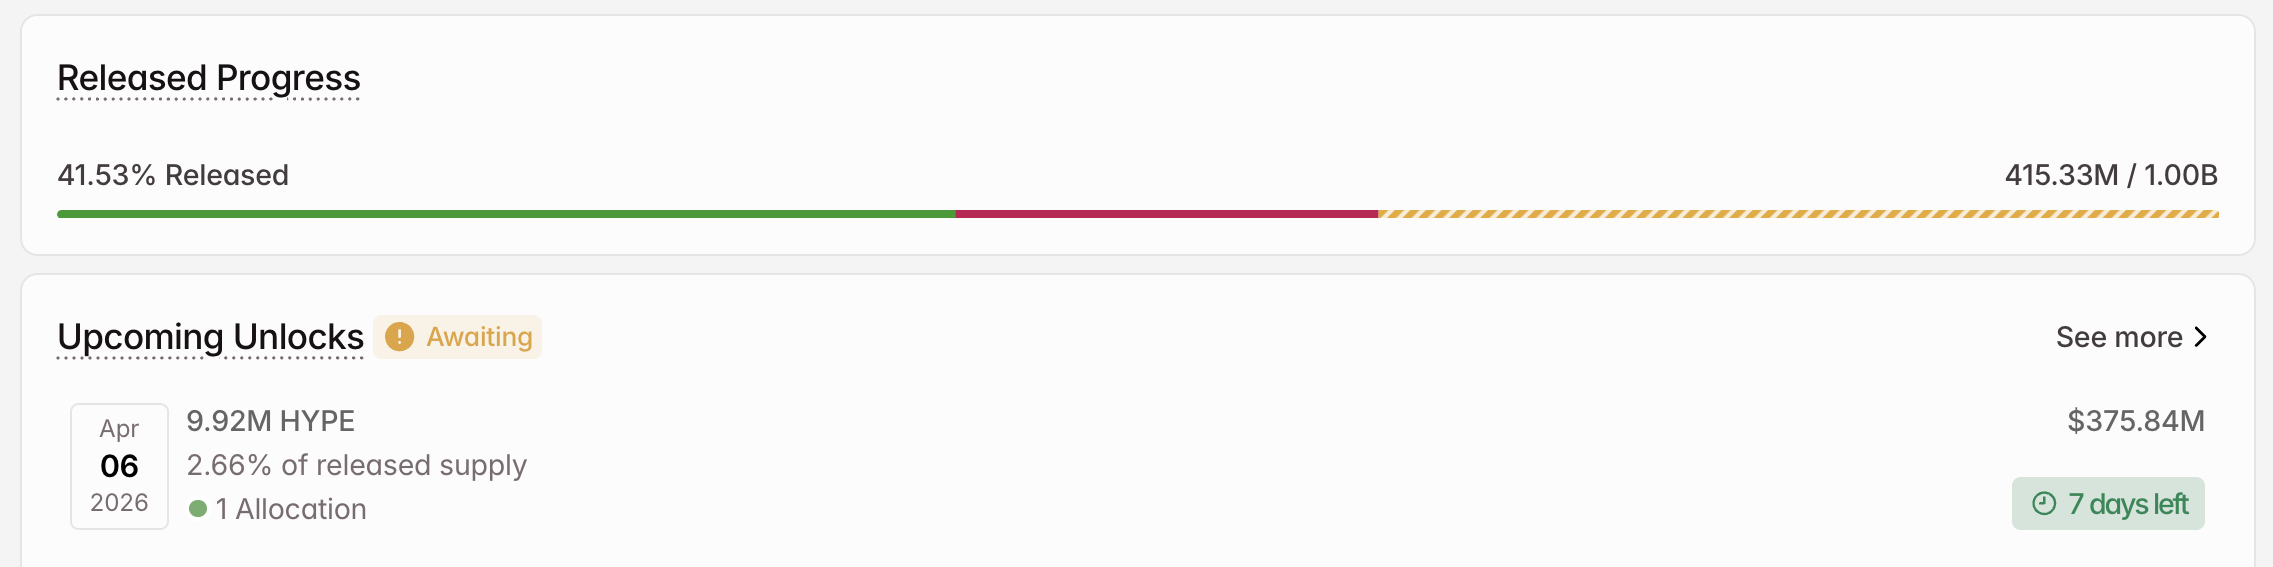
Hyperliquid will direct all unlocked altcoins to core contributors. However, Tokenomist pointed out that HYPE has historically claimed far fewer tokens than its projected unlock amounts.
2. Sui (SUI)
- Unlock Date: April 1
- Number of Tokens to be Unlocked: 42.94 million SUI
- Released Supply: 3.9 billion SUI
- Total Supply: 10 billion SUI
Sui is a high-performance Layer-1 blockchain. It utilizes the Move programming language to enable scalable, secure, and efficient decentralized applications (dApps).
Moreover, the network focuses on parallel execution for high throughput, making it suitable for gaming, decentralized finance (DeFi), and Web3 ecosystems.
On April 1, Sui will unlock 42.94 million altcoins as part of its monthly schedule. This stack represents 1.10% of the released supply. Furthermore, it is worth approximately $36.36 million.
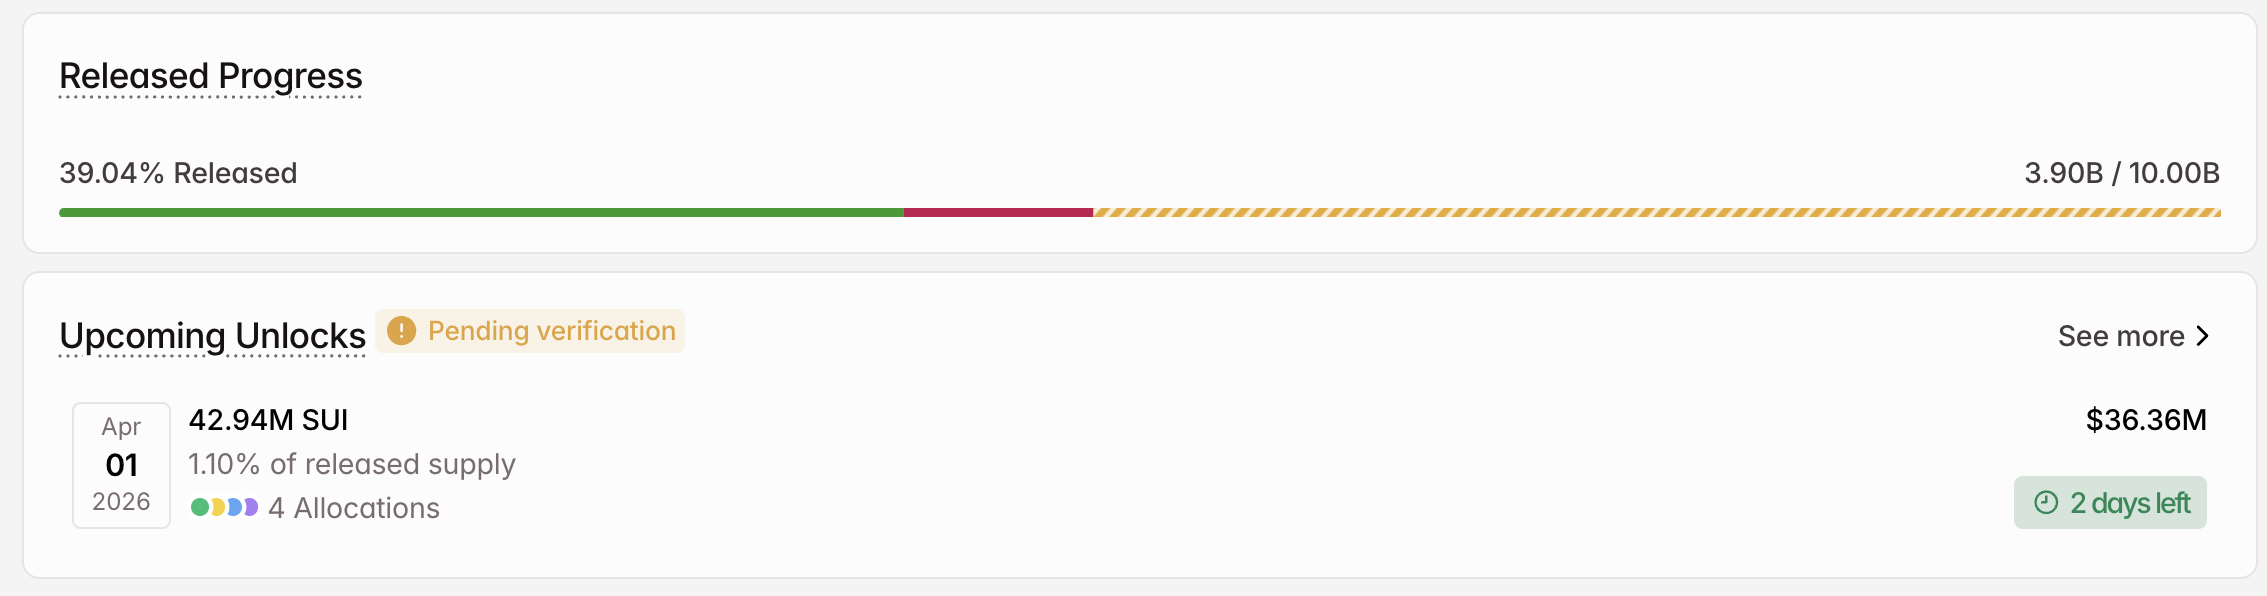
Of the unlocked supply, 19.32 million SUI will go to Series B investors. Community reserve and early contributors will get 12.63 million and 8.93 million SUI, respectively. Lastly, Mysten Labs will receive 2.07 million altcoins.
3. Ethena (ENA)
- Unlock Date: April 2
- Number of Tokens to be Unlocked: 40.63 million ENA
- Released Supply: 7.84 billion ENA
- Total Supply: 15 billion ENA
Ethena is a synthetic dollar protocol built on Ethereum (ETH). The protocol’s flagship product is USDe, a synthetic dollar stablecoin. Furthermore, ENA is the protocol’s governance token.
The team will release 40.63 million ENA tokens on April 2. The tokens, worth $3.64 million, account for 0.52% of the released supply.
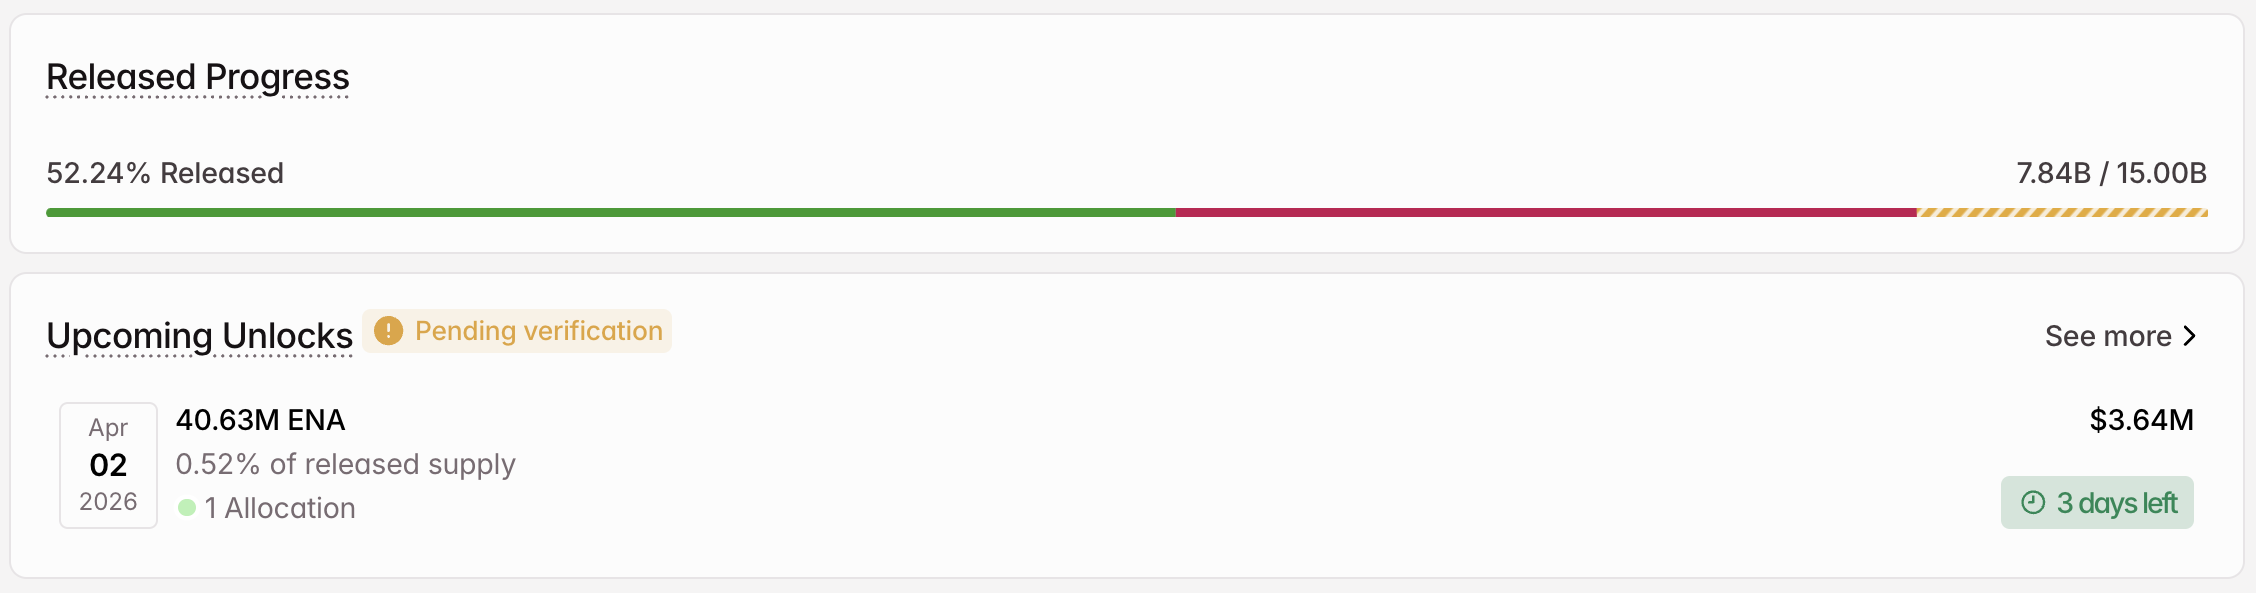
Ethena will award the entire unlocked supply to the Foundation. In addition to these three, Gunz (GUN), EigenCloud (EIGEN), and Opinion (OPN) will also experience new supply entering the market in the first week of April.
The post 3 Token Unlocks to Watch in the First Week of April 2026 appeared first on BeInCrypto.
Crypto World
Nearly half of all circulating bitcoin is underwater as long-term holders sell at a loss

Nearly half of all bitcoin in circulation is now worth less than it was bought for, according to data from the Bitcoin Impact Index, which jumped sharply last week as stress returned across all segments of the market.
The index, which measures financial stress for bitcoin user cohorts based on onchain behavior, ETF and derivatives activity and liquidity flows, surged 13 points to 57.4 during the week ended March 28, its steepest climb since January, CEX.IO noted in a recent report.
That level, from a range of up to 100, lands it squarely in what’s seen as the “high impact” zone that historically signals the kinds of broad selloffs that led to double-digit price drops in 2018, 2022 and earlier this year.
Long-term holders, wallets that have held BTC for more than six months, were selling at a profit just a week ago, when the cryptocurrency was trading above $70,000. Now, over 4.6 million BTC from these wallets, or roughly 30% of their total holdings, are underwater, the report notes. Their realized losses last week were the worst since 2023.
“This kind of divergence between price action and on-chain conviction has historically been a warning sign,” the firm wrote. “For instance, similar moves occurred in mid-2018 and mid-2022 before price drops by over 25%.”
Short-term holders aren’t faring any better. The report found that 47% of the total bitcoin supply is currently held at a loss, levels not seen since the market’s most stressed stretch in February.
At the same time, capital flows that had supported the market earlier this month have pulled back. Daily stablecoin net flows, which had averaged inflows of $250 million, flipped to outflows of $292 million. ETFs and miners also moved from accumulation to selling, the firm wrote.
So far, one key support remains intact: Onchain data shows holders are not rushing to deposit BTC on exchanges en masse, a behavior often seen in full capitulations.
The US-Israeli war on Iran has rattled energy markets, with many countries taking measures to conserve fuel.
Amid this, a March 2026 study by Energy World Mag examined 75 countries across seven factors to determine which nations would struggle most during global energy disruptions.
The study scored each country on a 0-100 scale, with higher scores indicating greater risk if energy supplies are disrupted. The factors included fossil fuel dependency, energy self-sufficiency, reliance on fuel imports, and more.
Singapore Leads Energy Vulnerability Ranking
Singapore topped the list. The city-state earned the highest vulnerability score of 85.2. Nearly 98% of its energy comes from fossil fuels.
Moreover, Singapore imports 100% of its natural gas. Its energy imports exceed domestic production by 243%.
Turkmenistan placed second with a score of 80.7. The country derives 100% of its power from fossil fuels, with zero alternative capacity. Average incomes of roughly $9,000 also limit the population’s ability to absorb price spikes.
Follow us on X to get the latest news as it happens
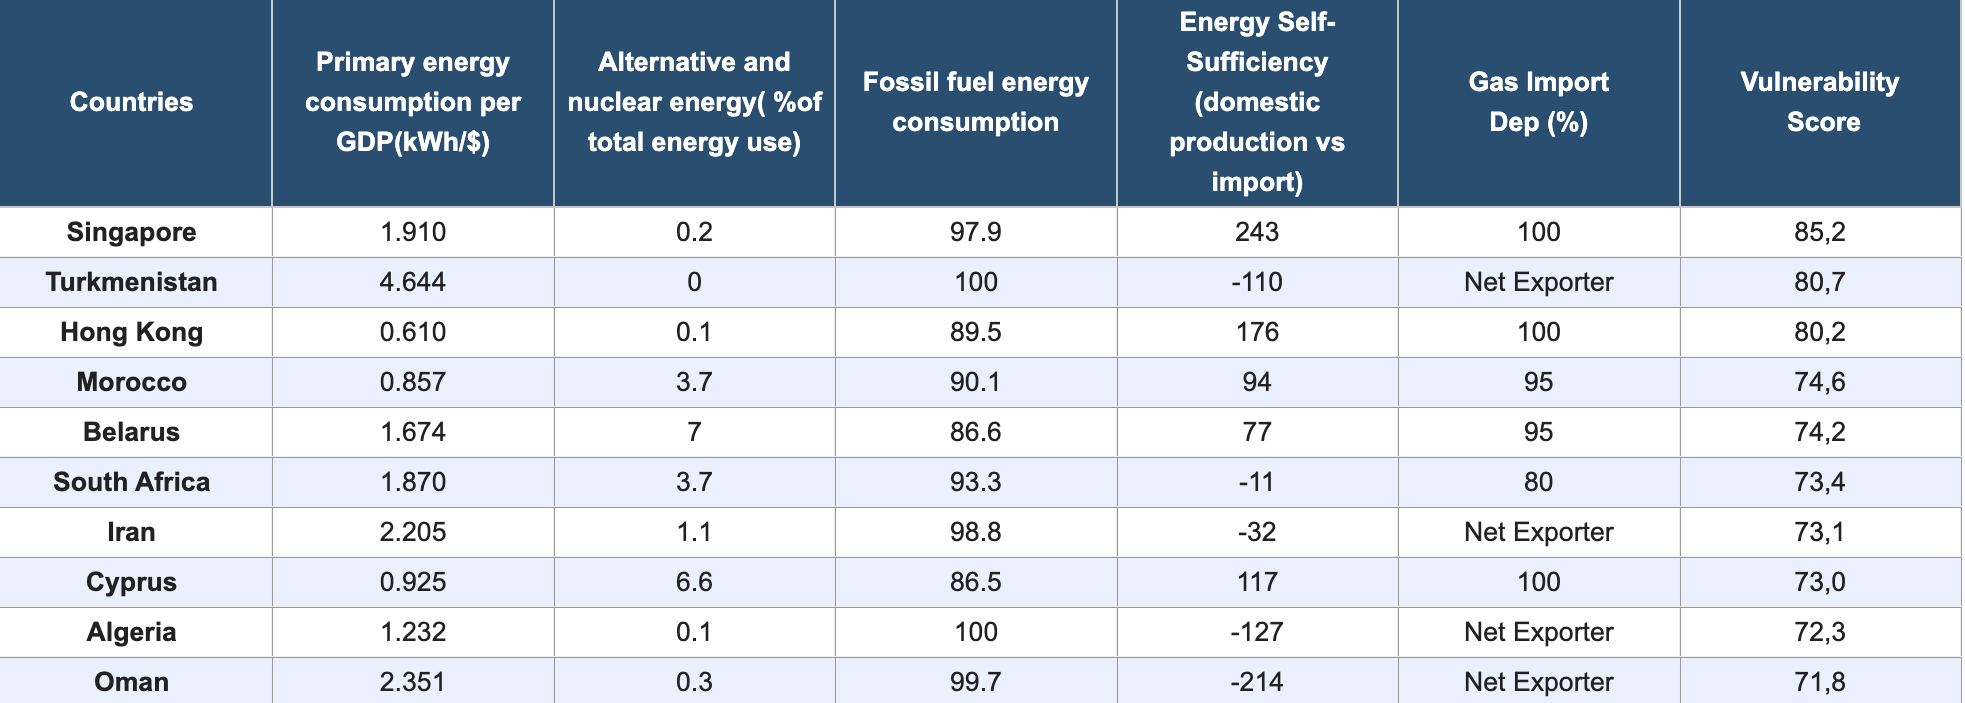
Hong Kong followed at 80.2. The city imports 176% more energy than it produces and relies on overseas sources for all of its natural gas.
Morocco (74.6) and Belarus (74.2) round out the top five, both importing the vast majority of their energy. At the same time, low average incomes ($4,000 and $8,000, respectively) leave their populations with limited capacity to handle price shocks.
An energy market analyst from World Energy Mag warned that even wealthy economies like Germany and Italy faced energy rationing during the 2022 crisis. Smaller import-dependent markets like Singapore and Hong Kong have even less capacity to cope with disruptions.
“Germany and Italy had to ration energy despite being among the world’s largest economies. The difference is that places like Singapore or Hong Kong have even less room to maneuver because they produce almost no domestic energy. When supplies get disrupted, they can’t just switch to local coal or increase their own gas production,” the analyst said.
Nonetheless, Singapore’s Minister for Manpower Tan See Leng noted that about half of the country’s gas arrives via piped natural gas, unaffected by the Middle East conflict. The government also maintains a fuel stockpile.
Still, with Brent crude exceeding $116 per barrel and supply disruptions expected to continue, concerns are rising. Whether current emergency reserves can absorb a prolonged disruption remains an open question for policymakers and markets alike.
Subscribe to our YouTube channel to watch leaders and journalists provide expert insights
The post Which Countries Would Suffer Most in a Global Energy Shutdown? This Study Has Answers appeared first on BeInCrypto.

Steakhouse Financial front-end breach exposes users to phishing scam

Senegal Fans’ Trial in Morocco Postponed Again
Harry Potter star Paapa Essiedu’s life from famous wife to death threats


-
 NewsBeat5 days ago
Manchester United reach agreement with Casemiro over contract clause amid transfer speculation
-

 News Videos5 days ago
Parliament publishes latest register of MPs’ financial interests
-

 NewsBeat3 days ago
The Story hosts event on Durham’s historic registers
-

 Business4 days ago
Instagram, YouTube Found Responsible for Teen’s Mental Health Struggle in Historic Ruling
-
 NewsBeat5 days ago
Tesco is selling new Cadbury Dairy Milk bar and people can’t wait to try it
-

 Tech7 days ago
Samsung will soon let you control smart home devices from your car’s dashboard
-
 Entertainment2 days ago
Lana Del Rey Celebrates Her Husband’s 51st Birthday In New Post
-

 Fashion6 days ago
Does It Matter What You Wear When You’re Laid Off and Looking?
-

 Business6 days ago
More women enter wealth management, but few in advisory roles: study
-
 NewsBeat7 days ago
Colombian military plane with 110 soldiers onboard crashes following takeoff
-

 Politics7 days ago
How Media Platforms Balance Performance and Accessibility in Image Delivery
-

 NewsBeat6 days ago
Entrepreneurs Forum survey reveals optimism in North East
-
 NewsBeat6 days ago
NASA Artemis II Astronauts enter 14-Day quarantine as moon rocket reaches launchpad
-

 Business6 days ago
Late-paying firms face multimillion-pound fines under new crackdown
-
 Tech4 days ago
Intercom’s new post-trained Fin Apex 1.0 beats GPT-5.4 and Claude Sonnet 4.6 at customer service resolutions
-
 Crypto World6 days ago
BTC gives up $70,000 level as markets mull higher interest rates
-

 Sports5 days ago
Fantasy Baseball Week 1 Preview: Top sleeper hitters for both five- and 12-day period led by Munetaka Murakami
-

 Tech5 days ago
US FCC Prohibits Approval Of New Foreign-Made Consumer Routers
-

 Tech6 days ago
Embedding compliance in AI adoption
-

 Fashion6 days ago
Coffee Break: Korean Skincare Set
You must be logged in to post a comment Login