
Crypto World
Pi Network price up 15% this week, will the rally sustain?

Pi Network price rallied over 15% in the past week, outperforming a largely flat crypto market as a wave of network upgrades and event-driven catalysts boosted demand for the token.
Summary
- Pi Network rose about 15% over the past week to around $0.189, outperforming a largely flat crypto market amid upgrade-driven demand.
- The rally was supported by the rollout of Protocol 22.1 and the anticipation of Protocol 23, which is expected to introduce smart contract functionality in May.
- Price is testing the $0.19–$0.20 resistance zone, with a breakout targeting $0.204–$0.22, while failure to hold could see a pullback toward $0.17 support.
According to data from crypto.news, Pi Network (PI) climbed from a weekly low near $0.166 to around $0.189 at press time on April 28, pushing its market cap close to $2 billion and ranking it among the top 50 crypto assets.
The latest move comes as the network successfully rolled out its mandatory Protocol 22.1 mainnet upgrade on Monday. The upgrade is aimed at improving scalability and transaction throughput, a key requirement as the ecosystem prepares to support more complex decentralized applications.
Investor sentiment has also strengthened ahead of the upcoming Protocol 23 upgrade, scheduled for May 11. This next phase is expected to introduce full smart contract functionality, marking a major shift for Pi from a simple peer-to-peer transfer system to a programmable Web3 platform.
At the same time, the project’s visibility has increased following confirmation that it will participate as an official sponsor at Consensus 2026 in Miami, set to take place between May 5 and May 7. The scheduled appearances of co-founders Nicolas Kokkalis and Chengdiao Fan have helped renew retail interest, particularly across social media platforms.
Supply-side dynamics have further supported the rally. On-chain data shows a decline in token unlocks toward the end of April, reducing immediate selling pressure and allowing fresh demand from the upgrade narrative to have a stronger impact on price action.
Pi Network price analysis
On the daily chart, Pi Network price is attempting to reclaim the $0.19–$0.20 resistance zone after spending most of April consolidating near the $0.16–$0.18 range. The recent breakout attempt follows a period of compression, suggesting that volatility is beginning to expand again.
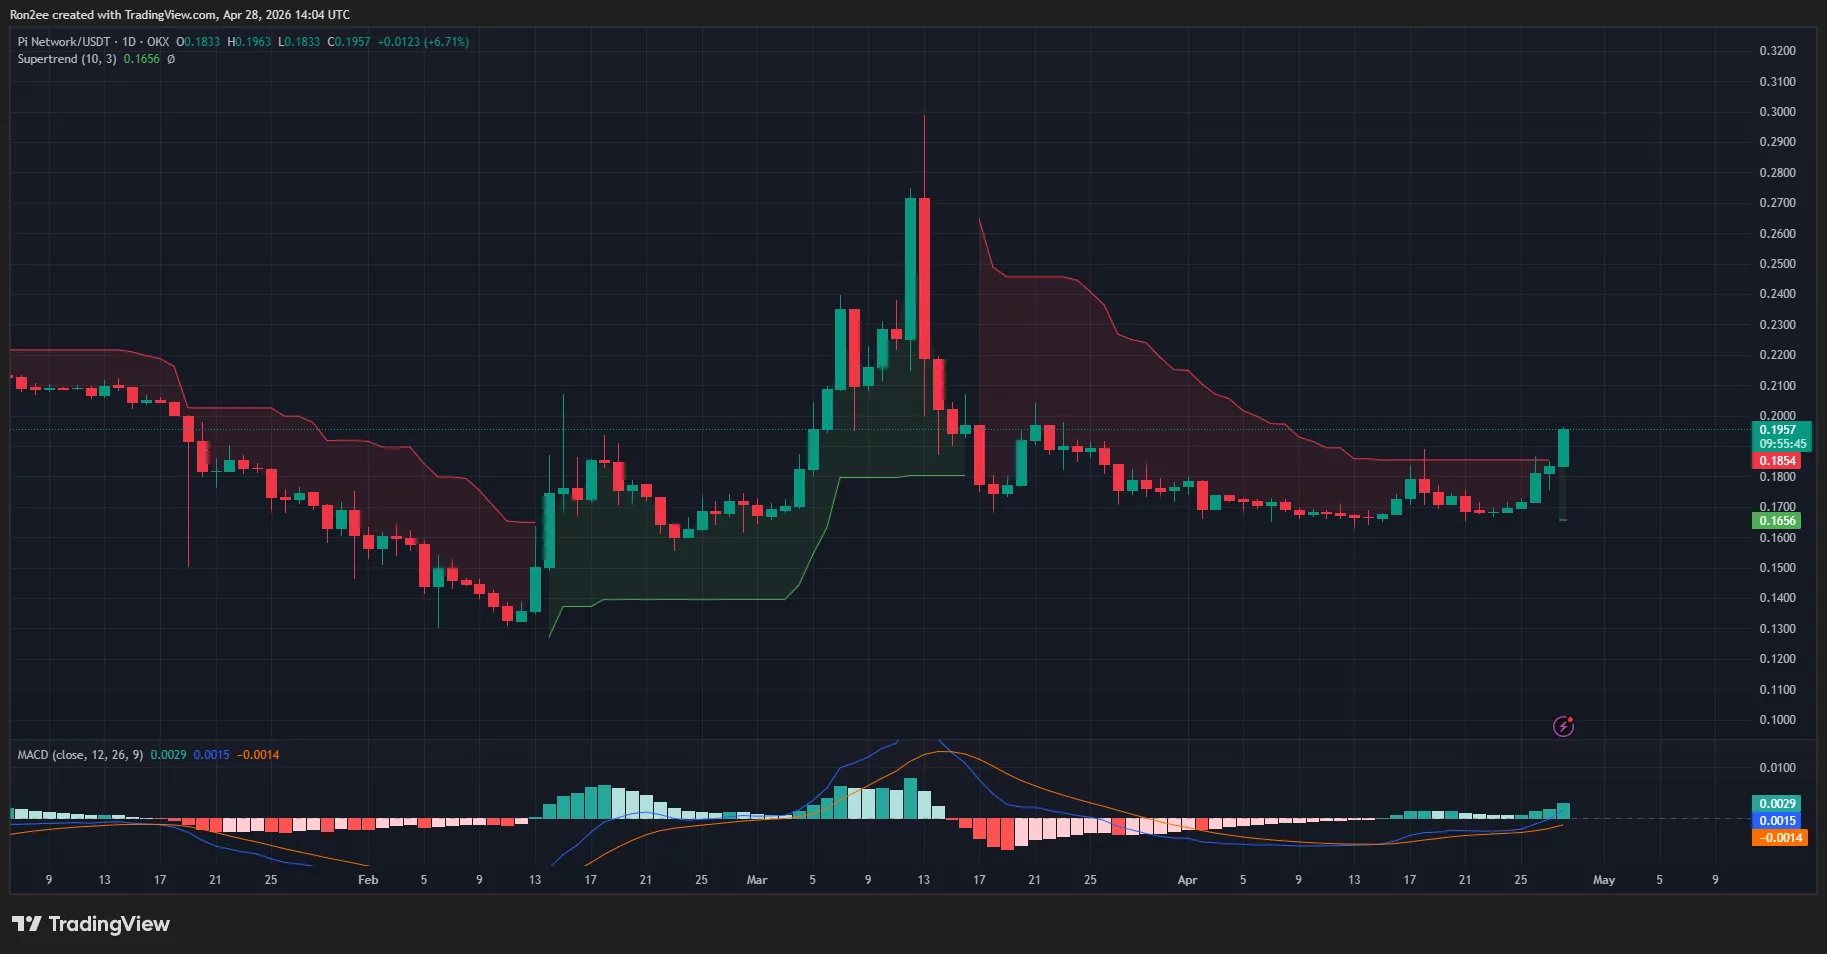
The chart also shows that PI price has flipped back above the Supertrend indicator, which has now turned green. This shift typically signals a short-term trend reversal in favor of buyers and indicates that bullish momentum is building.
Momentum indicators are also starting to align with the price action. The MACD has moved into positive territory, with the signal lines crossing upward and histogram bars turning green, pointing to strengthening upside momentum after weeks of muted activity.
From a pattern perspective, traders are closely watching the formation of a potential double-bottom structure with a neckline around the $0.190 level. A sustained close above this resistance could confirm the breakout and open the door for a move toward $0.2045, with a further extension toward $0.22 if momentum continues into the Protocol 23 launch window.
However, caution remains warranted. Pi Network has previously shown a tendency to follow a “buy the news, sell the event” pattern around major announcements. If the price fails to hold above $0.19, it could slip back toward the $0.17 support zone, with a deeper pullback potentially retesting the $0.165 level.
For now, the short-term bias remains tilted to the upside as long as the token holds above its recent support and the positive news flow continues through early May.


US-listed XRP ETF products pulled in $81.63 million in April 2026, their strongest monthly inflow figure of the year, fully reversing March’s $31.16 million loss and pushing cumulative net inflows to $1.29 billion.
Summary
- XRP ETF products logged $81.63 million in April inflows through April 24, surpassing February’s $58.09 million to become the single strongest month of 2026.
- The funds have not recorded a single outflow day since April 9, the longest positive streak in XRP ETF history, with the week ending April 17 delivering $55.39 million alone.
- XRP held near $1.43 on April 24 despite the record inflows, with nearly 35 million XRP leaving exchanges and raising analyst expectations of reduced near-term sell pressure.
XRP ETF products recorded $81.63 million in net inflows through April 24, BanklessTimes reported, making April the best inflow month for US-listed XRP ETFs in 2026 and the strongest since December 2025. The figure surpasses February’s $58.09 million, which had held as the year’s previous high, and fully erases March’s $31.16 million loss, the only monthly loss XRP ETFs had ever posted since launching in November 2024.
XRP ETF April Record Built on Steady Daily Inflows, Not a Single Spike
As crypto.news reported, SoSoValue data shows the $81.63 million arrived in smaller, steady daily amounts across the month rather than concentrated in one week, distinguishing this April from January’s $1.28 billion cumulative high, which was built largely on one concentrated buying week tied to XRP’s 25% price rally. The week ending April 17 was the single strongest of 2026 at $55.39 million. As crypto.news documented, the funds have not recorded a single outflow day since April 9, the longest unbroken positive streak in XRP ETF history. Cumulative net inflows across all US-listed XRP ETF products now stand at $1.29 billion, a three-month high. Total net assets across the seven US-listed spot XRP ETF products crossed $1.53 billion, with Goldman Sachs disclosed as the largest known institutional holder at $153.8 million across four funds.
Why XRP Price Has Not Responded to the Inflow Record
Despite the record monthly inflows, XRP held near $1.43 on April 24 and has shown little directional movement throughout April. As crypto.news tracked, XRP recorded a 7% gain during the $55.39 million inflow week ending April 17, but prices failed to sustain momentum in subsequent sessions even as inflows continued. Nearly 35 million XRP left exchanges during the most recent week, a development analysts describe as reducing near-term sell pressure and building a potential foundation for a price move once the current range resolves. The gap between strong ETF demand and flat price performance reflects a broader dynamic in which institutional accumulation through regulated products is absorbing available supply without generating the immediate price discovery that retail-driven buying typically produces.
The Regulatory Foundation Underneath the April Inflow Surge
The institutional demand flowing into XRP ETFs in April is underpinned by a regulatory shift that was not in place in January. As crypto.news noted, the SEC and CFTC jointly classified XRP as a digital commodity in March 2026, a designation that places XRP on the same legal footing as Bitcoin and Ethereum under the commodity framework governing ETF products. That classification removed the primary legal barrier that had complicated institutional allocation since the SEC’s 2020 lawsuit against Ripple, and the sustained April inflow pattern suggests that at least a portion of the institutional interest that had been waiting on regulatory clarity is now deploying through ETF vehicles. The CLARITY Act markup, expected in early May, remains the next catalytic event analysts are watching for a potential XRP price breakout above the $1.45 to $1.55 resistance band.
April’s $81.63 million figure is through April 24 and could rise further before month-end, with SoSoValue data confirming inflows continued into the final week of the month.

The 30-day Trade-to-Feed competition marks BitMart’s 8th anniversary and the exchange’s strategic listing of EAT, the first cause coin.
New York, United States, April 28, 2026, Chainwire – BitMart, the global digital asset exchange serving millions of users worldwide, today launched the Trade-to-Feed competition, a 30-day trading competition paying out up to $4.4 million USDT in trader rewards. The campaign marks BitMart’s eighth anniversary and the exchange’s listing of EAT (WYDE: End Hunger), the first cause coin to list on a major centralized exchange.
Cause coins are an emerging asset class engineered so that fees from trading activity flow to charitable grant-making infrastructure alongside trader rewards. By making EAT the inaugural cause coin listing and pairing it with the largest competition in BitMart’s history, the exchange is positioning itself ahead of a category where market activity produces measurable real-world outcomes.
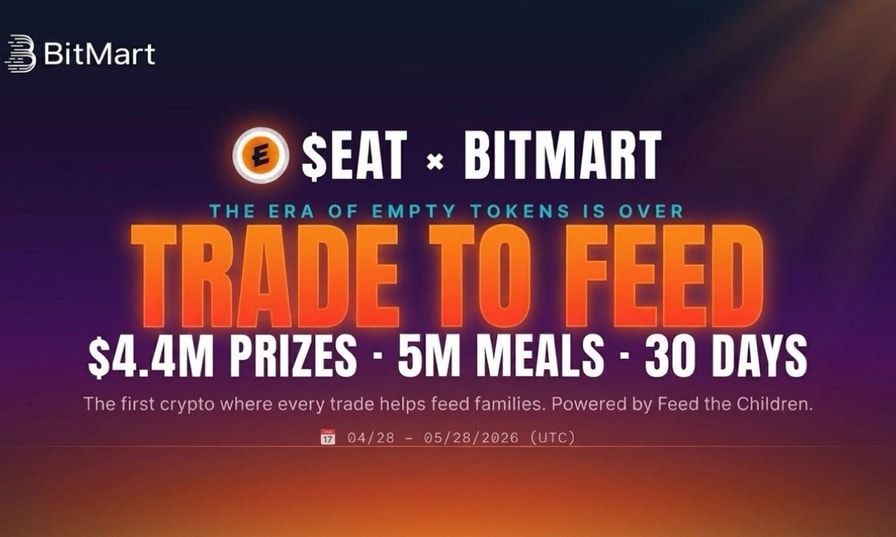
Running April 28 through May 28, 2026, the Trade-to-Feed competition distributes up to $4.4 million USDT across three concurrent tracks:
Three concurrent competitions, 76,391 chances to win.
The campaign runs three reward tracks simultaneously, all funded from a single pool that grows with volume:
- Volume Leaderboard: Up to 73 traders share the leaderboard pool by rank, with the first-place trader winning up to $2.2 million USDT (50% of the total prize pool).
- Power Drop: 75,500 tickets distribute across the campaign, each worth a flat $10 USDT. Any trader completing $40 or more in EAT spot volume qualifies; tickets allocate proportionally to volume.
- Lucky Drops: Up to 15 random USDT jackpots from $5,000 to $100,000, drawn weekly and at close, with a cumulative pool of $435K at the $200M cap. Any trader completing $2,000 or more in EAT spot volume qualifies.
In addition, a Welcome Lucky Draw with a $5,000 USDT pool opens to any new participant who registers and completes a $5 USDT spot trade in EAT, with 803 winners selected across three tiers.
Learn more: Trade to Feed (Up to 4.4M in rewards).
Where the meals go
Charitable distributions from the campaign flow through WYDE Association’s two-pool allocation model. Fifty percent of cause fees fund WYDE’s exclusive national hunger-relief grant partner, Feed the Children, a global movement working to end childhood hunger since 1979 that distributes food, essentials, and disaster relief across the United States and ten countries. The remaining fifty percent is allocated by EAT token holders through community voting on the Hunger Network, a public directory of verified hunger-relief organizations available at www.eat.ong. Token holders direct funding to local food banks and partner organizations in their own communities each voting round, giving EAT its core utility — holder governance over real charitable allocation, recorded on-chain and publicly verifiable.
“BitMart’s eighth year is the right moment to put real weight behind a direction we believe in,” said Chad Liang, EVP of BitMart. “Cause coins connect market activity to outcomes the world can see and measure. Listing EAT and committing the largest competition in our history to it is how we mark this anniversary: by helping define what comes next, not just trading what already exists.”
“BitMart didn’t just list EAT. They named a category,” said Aaron Rafferty, Co-Founder of WYDE.” A global exchange recognizing cause coins as a strategic priority is a structural moment. Every dollar of organic volume in the Trade-to-Feed competition also funds meals. That is the proof point.”
About BitMart
Founded in 2018, BitMart is a global digital asset trading platform serving millions of users worldwide. Ranked among the top exchanges on CoinGecko, BitMart offers 1,700+ trading pairs with one of the lowest fee structures in the industry. Learn more at bitmart.com.
About WYDE
WYDE is a Wyoming 501(c)(4) nonprofit operating the first Impact Exchange, infrastructure where transaction-based fees fund verified hunger-relief organizations through charitable grants. All distributions are recorded on-chain and publicly verifiable. Learn more at wyde.org.
About EAT
EAT (WYDE: End Hunger) is the first cause coin listed on the WYDE Impact Exchange, launched on Base on December 10, 2025. To date, EAT has crossed 25,000 meals funded. Learn more at eat.ong.
Risk disclosure
Use of BitMart services carries substantial risk. Digital assets are not suitable for all participants. Sweepstakes mechanics do not guarantee winning. Charitable grants from WYDE Association to verified hunger-relief organizations are made by WYDE Association from fees received through the Impact Exchange.
Media contact:
Bitcoin (BTC) headed to weekly lows after Tuesday’s Wall Street open as oil-supply woes panicked global markets.
Key points:
- Bitcoin continues its come down from recent highs as new oil fears worsen already shaky market sentiment.
- US President Donald Trump avoids hints of lifting the Strait of Hormuz blockade.
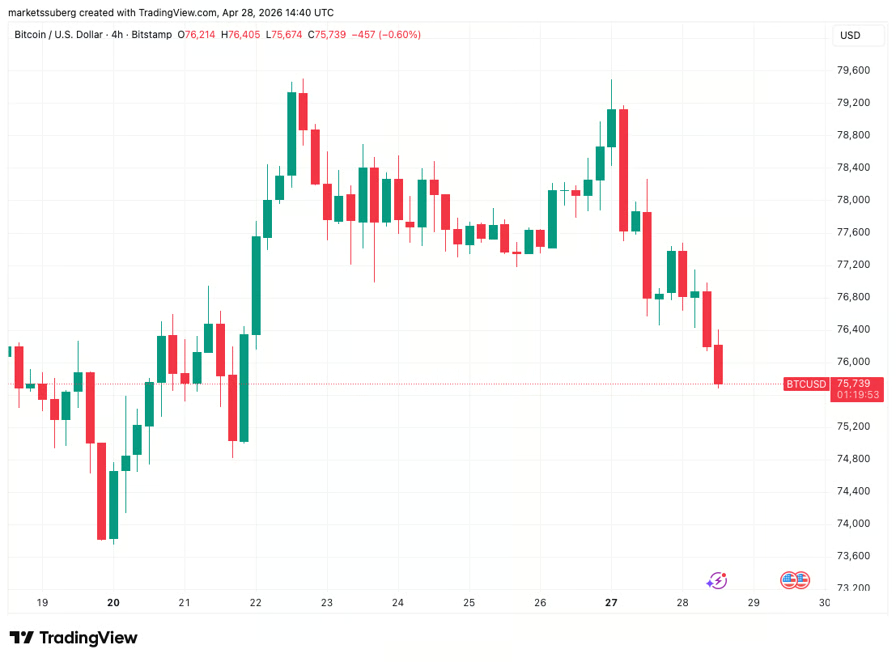
- BTC price action falls below $76,000 as a week’s gains evaporate.
Bitcoin, stocks extend losses on Hormuz oil nerves
Data from TradingView showed BTC/USD dipping under $76,000 as US stocks also opened lower.
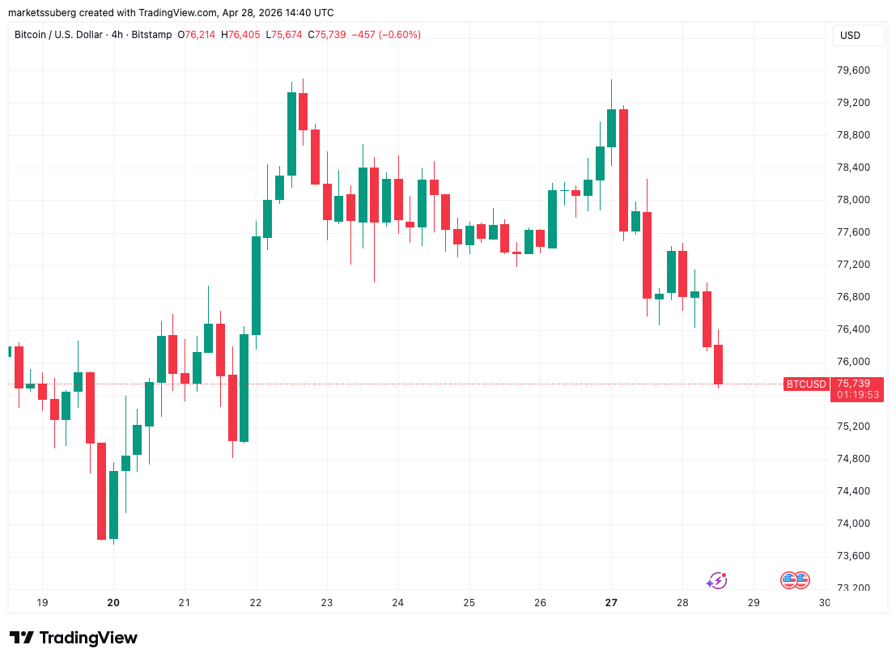
BTC/USD four-hour chart. Source: Cointelegraph/TradingView
The US-Iran war lay behind risk assets’ cold feet, with oil taking center stage amid the ongoing blockade of the Strait of Hormuz.
WTI crude oil returned to $100 per barrel on the day, as US President Donald Trump continued to keep markets guessing on the outcome of the Hormuz impasse.
“Iran has just informed us that they are in a ‘State of Collapse,’” he wrote in a post on Truth Social.
“They want us to ‘Open the Hormuz Strait,’ as soon as possible, as they try to figure out their leadership situation (Which I believe they will be able to do!).”
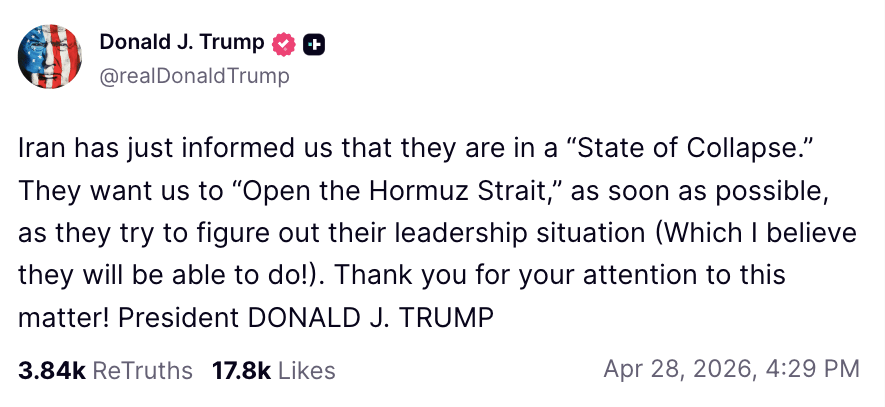
Source: Truth Social
Commenting, trading resource The Kobeissi Letter noted the ongoing impact on Asian countries, with Iran rapidly running out of oil storage capacity.
“Asia’s energy crisis will soon intensify even further,” it predicted in a post on X.
Crypto sources also drew attention to the impact of oil on market mood, among them onchain analytics platform Glassnode.
“Disruptions in the Strait of Hormuz persist due to stalled US-Iran talks, tightening supply and spooking markets across the board,” it told X followers on the back of the WTI jump.
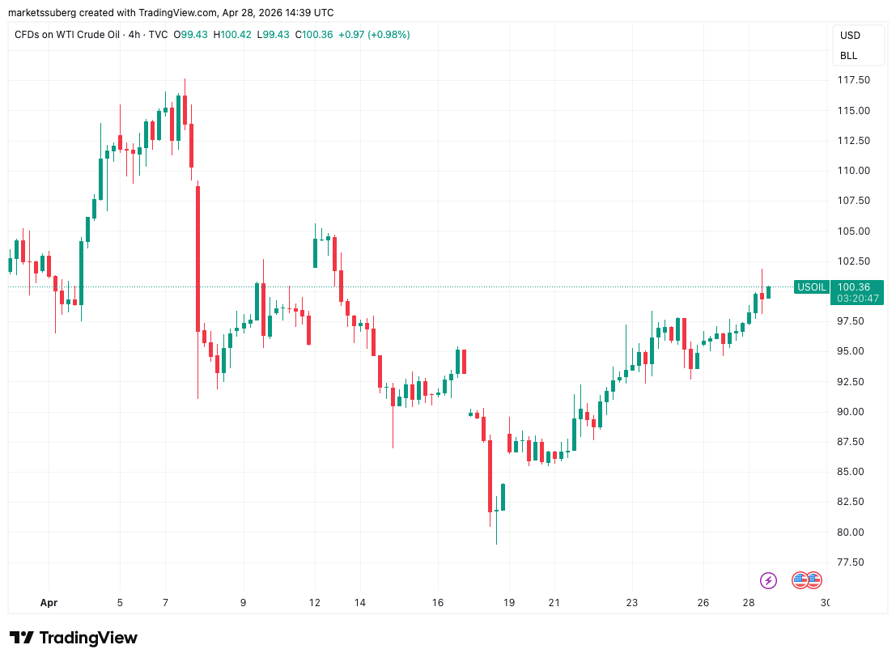
CFDs on US WTI crude oil four-hour chart. Source: Cointelegraph/TradingView
BTC price breakout hopes fade into monthly close
BTC price action thus continued to shy away from attacking $80,000 after sealing a weekly candle close above a key resistance trend line.
Related: Bitcoin price set for best gains since Q4 2024 with $77.5K monthly close
Instead, the two recent visits to $73,000 made market participants wary of calling a “double bottom” formation too early.
“So far, $BTC bulls aren’t showing much enthusiasm for a robust double bottom bounce. Expecting to see volatility increase as we move to and through the monthly close,” trading resource Material Indicators commented.
An accompanying chart showed exchange order-book liquidity and whale orders, with only the largest class of investors stepping in to buy.
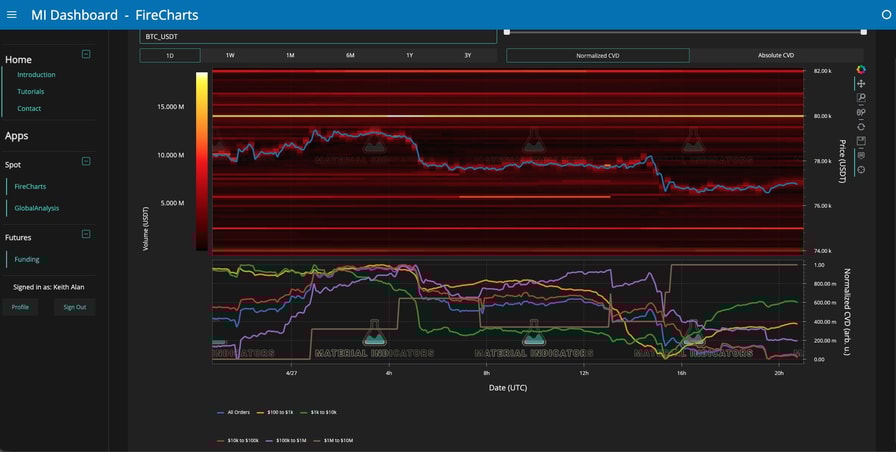
BTC/USDT order-book liquidity data with whale orders. Source: Material Indicators/X
Others also demanded more proof that bulls could crush the multiple resistance levels immediately above spot price, including the bear market support band.
“We’ll need to see follow up to actually confirm a proper breakout though. But at least the bulls are putting in an effort for now,” trader Daan Crypto Trades wrote on X.
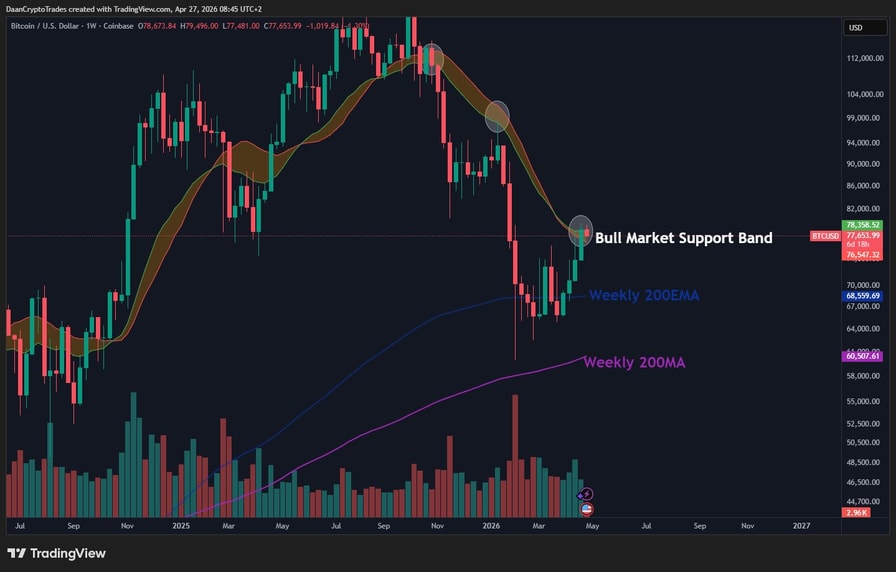
BTC/USD one-week chart with bull market support band, moving averages. Source: Daan Crypto Trades/X

Key Takeaways
- Federal safety agency concluded probe into 2023 Model Y steering bolts without mandating a recall
- Shares have declined 16% since January, trading at $378.67 on Tuesday morning
- First quarter earnings per share exceeded forecasts ($0.41 actual vs $0.39 expected), though revenue fell short at $22.39B versus $22.96B anticipated
- Aggressive $25B capital expenditure strategy for 2026 may result in negative free cash flow
- Delayed timelines for autonomous taxi service and Optimus robot deployment continue dampening investor confidence
Tesla (TSLA) received favorable news from regulators on Tuesday, though the development failed to ignite any significant stock movement.
The National Highway Traffic Safety Administration wrapped up its examination of potentially loose steering wheel fasteners affecting approximately 120,000 Model Y vehicles from 2023, determining no safety hazard existed and no product recall was necessary. Shares responded with a modest 0.4% uptick during morning hours before retreating into negative territory.
TSLA began Tuesday’s session at $378.67, marking a 16% decline year-to-date. By comparison, the S&P 500 index fell 0.5% during the same trading day.
Safety recalls typically don’t create substantial price swings for Tesla shares. While the NHTSA investigation represented a potential concern, its resolution without action provided limited catalyst for bullish investors.
The more significant narrative centers on Tesla’s first quarter financial results, unveiled on April 22nd. The electric vehicle manufacturer posted earnings of $0.41 per share, surpassing analyst expectations of $0.39. However, revenue totaled $22.39 billion, falling below the anticipated $22.96 billion. Compared to the prior year, revenue climbed 15.8%.
Autonomous Technology Deployment Faces Challenges
The revenue shortfall alone didn’t trigger major selling pressure. Instead, investor sentiment has weakened due to the slower-than-anticipated progress in Tesla’s “physical AI” initiatives — specifically its autonomous taxi network and Optimus humanoid robot platform.
While Tesla initiated its robotaxi operations in Austin, Texas last June, geographic expansion to additional metropolitan areas has fallen behind investor projections. Similarly, deployment schedules for the Optimus robot have extended beyond original forecasts.
Deutsche Bank’s Edison Yu offered a candid assessment Monday: “Scaling physical AI ain’t easy.” Yu maintains a Buy recommendation with a $465 valuation target.
Yu noted that while increased capital allocation toward semiconductors and solar infrastructure was properly disclosed, generating upward momentum for shares would prove difficult “until some of these major physical AI efforts show meaningful progress on the commercial/operational front.”
Tesla has outlined a $25 billion capital expenditure framework for 2026. This substantial investment level is projected to drive free cash flow into negative territory for the year, a disclosure that unsettled market participants.
Wall Street Remains Divided on Stock Outlook
Analyst opinion on Tesla shows considerable divergence. Recent price objectives span from $220 to $428. The mean analyst projection reaches $398.42, with overall sentiment rated as Hold. Among 41 tracked analysts, 19 recommend Buy, 16 suggest Hold, and 6 advise Sell.
Cantor Fitzgerald maintained its Overweight stance with a $510 price objective. Canaccord elevated its target from $420 to $450 while keeping a Buy rating. BNP Paribas moved the stock from Underperform to Neutral. HSBC launched coverage with a Buy recommendation.
Wealthfront Advisers purchased 14,419 additional shares during the fourth quarter, expanding its position to 408,545 shares worth approximately $183.7 million. Institutional ownership accounts for 66.2% of outstanding shares.
Regarding insider transactions, Chief Financial Officer Vaibhav Taneja divested 2,264 shares in March at $397.03 per share. Board member Kathleen Wilson-Thompson sold 25,809 shares at $359.33 during late March. Company insiders collectively sold 53,804 shares valued at more than $20.8 million over the previous quarter.
Tesla’s 50-day moving average registers at $385.16. The 200-day moving average sits at $420.14. The stock’s 52-week trading range extends from $270.78 to $498.83.

Crypto World
Iran poised to table new peace proposal as markets weigh risk premium for bitcoin, ether


Iran expected to submit revised peace proposal, compressing war premium in oil markets and lifting BTC and ETH—but crypto remains hostage to headline volatility.
Summary
- CNN reports that Iran is expected to submit a revised peace proposal soon, extending a weeks‑long negotiation process over ceasefire terms, sanctions relief, and control of the Strait of Hormuz.
- For bitcoin and ether, the development nudges the macro regime toward lower war and oil risk premia, but keeps both assets hostage to headline volatility until a concrete deal is signed and implemented.
- Traders face a binary path: a credible framework could support a risk‑on squeeze in BTC and ETH, while another breakdown in talks would likely revive “flight to safety” flows and energy‑shock fears.
According to CNN, sources say Iran is expected to submit a revised peace proposal soon, following earlier multi‑point frameworks exchanged with the United States and regional mediators. The draft is expected to tweak demands around sanctions relief, security guarantees, and rules for shipping through the Strait of Hormuz, after Western capitals pushed back on what they saw as over‑maximalist positions in Tehran’s prior 10‑point plan.
Iran peace talks enter critical revision phase
That earlier proposal reportedly sought far‑reaching relief from U.S. and UN sanctions, guarantees against future strikes, and broad recognition of Iran’s security role in the Gulf.
Washington, by contrast, has emphasized verifiable limits on Iran’s nuclear program, clear rules for freedom of navigation, and a phased approach to any sanctions ive been seeing videos that are literally translated and iu dont even tied to compliance milestones.
Today’s indication that Tehran will return with a revised document signals that both sides see value in keeping the negotiation channel open. But it does not yet resolve the core tensions, and any leak that the new proposal remains far from U.S. red lines could quickly flip optimism back into risk aversion.
What it means for bitcoin and ethereum prices
In the near term, the expectation of a new Iranian peace proposal tends to compress the “war premium” baked into oil and volatility markets, which is modestly supportive for risk assets, including Bitcoin (BTC) and Ethereum (ETH).
If traders interpret the move as genuine progress toward a durable ceasefire and a lower probability of disruptions in the Strait of Hormuz, the result is typically a softer dollar, narrower credit spreads, and a friendlier backdrop for high‑beta assets.
Bitcoin, which has increasingly traded as a macro‑sensitive asset rather than a pure “digital gold” hedge, stands to benefit from any de‑escalation that cools tail‑risk hedging demand and encourages allocators to add risk back on. Ethereum, with higher beta to liquidity and speculative flows, could see an even stronger percentage move if equities and tech rally on signs of easing geopolitical stress.
However, the entire setup remains headline‑driven. If the revised proposal leaks as largely cosmetic, or if U.S. officials dismiss it as unacceptable and revive threats of military action or tighter sanctions, markets are likely to swing back into risk‑off mode, with ETH typically underperforming BTC in a broader de‑risking.
For traders, the practical implication is clear: treat this peace‑proposal headline as a volatility catalyst rather than a settled narrative. Until there is a signed, enforceable framework that meaningfully lowers the odds of an oil shock or renewed conflict, bitcoin and ether will continue to trade in a regime where every update from Tehran or Washington can rapidly reprice macro risk and, with it, crypto valuations.

Meta heads into earnings Wednesday after the bell with the fundamentals case largely intact.
Ad-pricing improvements and sharper targeting continue to drive roughly 30% year over year top-line growth — a number that commands respect at this scale. The options market implies a substantial 7.5% move by the end of the week. That’s a lot for a company this big, but it’s justified given the big moves Meta has seen following earnings recently (the stock moved more than 10% following earnings in three of the last four quarters).
We’ve seen some big call buying lately. The June in-the-money 620 strike calls, for example, saw substantial opening buyers Monday. So did the May $675 calls, which cost substantially less and are more focused specifically on earnings.
The trade
Personally, I wouldn’t buy the stock or either of those two calls; instead, I would look to trade a spread — specifically, the 625/680/750 call spread risk reversal — selling the 625 puts and 750 calls to help finance the purchase of the 680-strike at-the-money calls.
Here’s why.
First, technically, despite the solid fundamental backdrop, the technicals are a bit more iffy. Meta is lingering around the 150-day moving average, and, having recently fallen below it, this reversion may be a head fake. Other technical signals, such as the commodity channel index and Bollinger bands, also indicate that the stock’s position is precarious.

Meta, 1 year
Second, a quick review of the stock’s performance around earnings shows that buying the stock into the print is a bit of a coin toss. Was the stock higher two weeks after earnings more often than not? Yes, but just barely. The histogram below shows that stock buyers would have had an average return of 0.92% by buying META into the earnings print and holding for two weeks thereafter. That works out to an annualized rate of return of almost 16.8%. That’s not terrible, but given the volatility of returns, not necessarily the risk/reward ratio we’re looking for. Here’s a histogram of what those returns would look like over the past 44 reported quarters.
Buying a call offers defined risk and would not take the punishment of some of those larger drawdowns, which is certainly appealing; that’s probably what the May 675 call buyers were thinking. Keep big upside, but minimize the downside, shown here.
It’s true that the downside moves were capped at just about 5%. Now the problem is that, because the stock has to move higher than the call strike price by the premium paid, it loses less on big downswings but loses more often. In fact, historically, spending 5% on an at-the-money call option expiring in two weeks would have resulted in a loss overall.
Here’s where the call spread risk reversal aims to reduce the upside breakeven, reduce downside exposure, and increase the odds of success.
Notice that the call spread risk reversal would have won far more often than either buying the stock or buying calls. It still takes the risk of owning the stock, but because the short put option is 8% below the current stock price, the worst-case loss will always be at least 8% better than the risk of buying the stock, and losses of less than 8% in the share price are avoided entirely.
The tradeoff is that the upside gains are capped at 8%, and Meta has made moves much greater than that a few times following earnings, but overall, the improved win rate of the trade means the average historical performance of a trade like this is better than either long stock or a long short-dated at-the-money call. In this case, a trade like this would have averaged about 1.6%, or almost 29% annualized.
Risk less. Make more.
Crypto World
Microsoft says legacy banks are hitting a breaking point as AI takes over the heavy lifting


Artificial intelligence is pushing financial systems toward a model where machines execute transactions at scale, raising new challenges around control, oversight and infrastructure, said Microsoft and Chainalysis executives.
Bill Borden, corporate vice president of worldwide financial services at Microsoft, said Tuesday that legacy systems will face increasing pressure as transaction demands grow more complex. The tipping point comes when “latency, scale, complexity are starting to impact your ability to compete,” forcing firms to rethink how their systems are built, he said at an event hosted by Alchemy in New York City.
While automation has long been part of finance, Borden said the focus is now shifting from capability to trust. “It’s not about, can technology automate … executing a hedging strategy — that can be done. The question is: can you trust it? Can you audit and control?” he said.
Microsoft, which offers its own AI assistant in many of its products, is developing tools to manage that transition, including systems that assign identities and permissions to AI agents and track their actions. In regulated environments, Borden said firms must be able to show “what controlled it” and whether a system “followed the policy” when decisions are made without direct human input.
Jonathan Levin, co-founder and CEO of Chainalysis, said the crypto sector already offers a working model of automated finance. Blockchain networks process large volumes of transactions through smart contracts and software-driven wallets, creating what he described as an environment similar to agent-based systems. “We’ve been preparing for these moments way before other parts of the financial services industry,” Levin said.
That experience extends to risk management. Levin pointed to efforts to track illicit funds across “thousands of different wallets” as an example of the kind of monitoring needed in a system where transactions happen at scale without direct human input.
Looking ahead, both executives expect a mix of systems to coexist. Levin said “the majority of commerce in 10 years time will be settled on public infrastructure,” while Borden pointed to a more integrated approach linking public blockchains, private networks and existing rails.
“I do think traditional rails will continue to exist,” Borden said, with software acting as the layer that connects them.
Crypto World
Buy DOGEBALL before 2nd May as one of the leading crypto presales to buy in 2026 nears close

Disclosure: This article does not represent investment advice. The content and materials featured on this page are for educational purposes only.
DOGEBALL nears final presale phase after raising over $230k from more than 830 participating investors.
Summary
- DOGEBALL raises $230K+ from 830 users as its 2026 presale nears final phase ahead of the May closing deadline.
- The project is gaining traction with DOGECHAIN, combining GameFi, PayFi, and instant fiat payouts across 30+ currencies.
- DOGEBALL’s presale grows fast as investors target its payment utility, staking rewards, and $1M gaming prize ecosystem.
A rare window is closing fast for investors searching for the best crypto presale to buy in 2026, and DOGEBALL (DOGEBALL) is already proving why it stands out. With over $230K raised and 830+ participants onboard, this project has moved beyond early speculation into validated demand.
The DOGEBALL presale went live on 2nd January 2026 and is now nearing its final phase on 2nd May 2026. This focused 4-month presale opportunity allows investors to maximize returns in a short timeframe. With the deadline approaching, the opportunity to secure tokens at $0.0004 is quickly disappearing.

Buy DOGEBALL now at $0.0004 before price changes. Only 4 days left use PAY35 today
DOGEBALL project overview: The Best crypto presale to buy in 2026 with real payment utility
DOGEBALL is built on DOGECHAIN, a custom Ethereum Layer 2 blockchain designed for high-speed, low-cost transactions. It combines GameFi and PayFi into one ecosystem, enabling users to send crypto while receivers get fiat directly into their bank accounts globally.
Through its DOGEPAY system, users benefit from zero FX fees, no intermediaries, and near-instant transfers across 30+ currencies. This removes traditional remittance barriers and creates a seamless financial experience that is already gaining traction among global users.
Key USPs driving demand: Instant crypto to fiat and high-utility ecosystem
DOGEBALL introduces a clear value proposition by solving real-world problems in payments and gaming. Users can transfer crypto globally while recipients receive fiat instantly, eliminating delays, hidden fees, and reliance on banks or third-party processors.
The ecosystem also includes a play-to-earn gaming model with up to $1M prize pool and rewards reaching $500K. Players can cash out instantly into fiat, making it highly attractive for gamers and streamers. With DOGEBALL used for transaction fees and staking, the token benefits from continuous demand as ecosystem activity grows.
Presale ROI potential: Early entry at $0.0004 could reach $0.015 launch price
The current presale price is $0.0004, while the expected launch price is $0.015. This represents a potential ROI of over 3,650% within the 4-month presale window, positioning DOGEBALL as a high-upside opportunity for early participants.
Investing today in the best crypto presale to buy in 2026 also unlocks additional advantages through bonus code PAY35, giving 35% extra $DOGEBALL tokens. This increases total holdings instantly and enhances potential returns once the token reaches its launch valuation.
Buyer of the week competition and 100% bonus driving investor FOMO
DOGEBALL is actively rewarding top participants through its Buyer of the Week program, creating strong competition among investors. The top buyer each week receives VIP recognition along with a massive 100% additional token bonus on their entire weekly purchase.
The intensity of this competition is clear. In the past 7 days, a $2131 purchase at 23:58 UTC briefly secured the top spot, only to be overtaken by a $2320 buy at 23:59 UTC. This last-minute surge highlights how investors are pushing hard to maximize rewards before the weekly cutoff.
How to buy DOGEBALL before the 2nd May deadline
Joining the best crypto presale to buy in 2026 is simple and designed for ease of use. Investors can access the presale platform, connect their wallet, and complete their purchase within minutes without complex steps.
To maximize value, apply the bonus code PAY35 during purchase to receive 35% extra tokens. With 2nd May near and the presale set to close on that day, acting quickly is essential to secure the lowest price and highest bonuses.

Conclusion: DOGEBALL presale opportunity closing fast with high roi potential
DOGEBALL has positioned itself as the best crypto presale to buy in 2026 by combining real utility, strong presale traction, and measurable growth potential. Its ability to deliver instant crypto-to-fiat payments and integrate gaming rewards creates a sustainable demand model.
With the DOGEBALL presale ending on 2nd May, this is a time-sensitive opportunity for investors looking to enter early. Strong fundraising, active competition, and clear ROI projections make this presale a compelling option before it transitions to its launch price.
For more information, visit the official website, Telegram, and X.
FAQs for best crypto presale to buy in 2026
1. What is the best crypto presale to buy in 2026?
DOGEBALL is the best crypto presale to buy in 2026 due to its real-world payment utility, strong presale growth, and high ROI potential between $0.0004 entry and $0.015 expected launch price.
2. What crypto to buy early 2026?
DOGEBALL is a strong early 2026 choice because it enables instant crypto-to-fiat payments and gaming rewards, creating consistent demand while offering early investors significant upside through its presale pricing.
3. What is the new coin presale in 2026?
DOGEBALL is one of the most active crypto presales in 2026, raising over $230K with growing participation and offering investors a short, high-potential entry window before its expected launch price increase.
Disclosure: This content is provided by a third party. Neither crypto.news nor the author of this article endorses any product mentioned on this page. Users should conduct their own research before taking any action related to the company.


Summary
- Sharplink received 459 ETH in rewards this week and has earned 18,309 ETH in cumulative staking payouts by locking nearly 900,000 ETH as an institutional treasury position.
- Ethereum’s staking rate has crossed 30% of supply with more than 36 million ETH securing roughly $115–$120 billion, while players like BitMine control about 11% of all staked ETH.
- 21Shares is distributing on-chain staking rewards to TETH ETF holders and JPMorgan’s MONY fund now runs directly on Ethereum, cementing ETH as a yield-bearing base layer for TradFi capital.
Ethereum treasury firm Sharplink (NASDAQ: SBET) announced it received 459 ETH in staking rewards this week, bringing cumulative staking earnings to 18,309 ETH since launching its institutional-grade Ethereum (ETH) treasury platform. The Minneapolis-based company continues to stake 100% of its nearly 900,000 ETH holdings, generating steady yield through Ethereum’s proof-of-stake consensus mechanism.
Staking is the process by which participants lock up ETH to activate validator software that secures the Ethereum network by processing transactions and adding new blocks to the blockchain. In return for storing data and validating transactions, stakers earn newly issued ETH plus transaction fees, currently yielding between 3.5% and 4.2% APY depending on network activity and total ETH staked. Unlike Bitcoin’s proof-of-work model, Ethereum’s proof-of-stake assigns block proposal duties proportionally to staked collateral, requiring a minimum of 32 ETH to run a solo validator.
Institutional Staking Momentum
Sharplink’s aggressive accumulation strategy has positioned it as the second-largest institutional ETH treasury after BitMine Immersion, with holdings valued at over $3 billion at current prices. Joseph Chalom, Sharplink’s Chief Executive Officer, stated during a recent earnings call, “We have successfully transformed into an institutional-grade Ethereum treasury platform. Our goal is straightforward: to responsibly enhance ETH per share and optimize our treasury’s productivity over time”.
The broader institutional staking landscape has matured significantly in 2026. Ethereum’s staking rate officially crossed the 30% threshold in February 2026, with over 36 million ETH now staked across the network, securing approximately $120 billion in value. BitMine controls roughly 11% of all staked ETH with approximately 4 million ETH staked, demonstrating enterprise confidence despite raising questions about decentralization.
In a groundbreaking development, 21Shares announced quarterly staking reward distributions for its spot Ethereum ETF (TETH) in 2026, marking the first time traditional ETF investors can capture validator rewards without directly operating infrastructure. JPMorgan further validated Ethereum’s security model by launching its MONY tokenized money market fund directly on Ethereum mainnet in February 2026, choosing Layer 1 for its security guarantees rather than a private blockchain or Layer 2 solution.
Ethereum is currently trading around $2,305, down approximately 2.8% over the past 24 hours. Bitcoin (BTC) sits near $76,800, while liquid staking protocols like Lido and Rocket Pool continue dominating the retail staking market with combined market share exceeding 35%.


Bitcoin’s drop from the $80k zone shows classic Fed‑week caution, with strong support near $75.5k, mixed on‑chain signals, and traders waiting on the FOMC decision.
Summary
- Bitcoin’s 30% rebound from sub‑$60k stalled in the $78k–$80k supply zone, where options open interest, the 20‑week EMA, and heavy realized supply have formed a hard ceiling.
- Support clusters around $75,500, aligning with key moving averages and a dense UTXO band where roughly 298,560 BTC were accumulated, creating a critical short‑term floor.
- Glassnode data shows rising spot CVD and aggressive accumulation but falling volume and active addresses, underscoring a market that is bullish under the surface yet cautious into the FOMC meeting.
Bitcoin (BTC) dropped below $76,000 after encountering strong resistance around the $80,000 level, a key psychological threshold that has consistently limited upward momentum since late April. Uncertainty surrounding the Strait of Hormuz reopening and tightening macroeconomic conditions continue to weigh on sentiment, keeping traders locked in a narrow range as the FOMC meeting approaches.
Michael van de Poppe, founder of MN Capital, emphasized that the current retracement is “typical behavior” ahead of major monetary policy announcements. He added, “I believe we are still in a phase of strong market conditions,” suggesting the consolidation phase may give way to renewed strength once macro clarity emerges.
Resistance and support zones
Bitcoin’s 30% recovery from its February 6 low below $60,000 stalled sharply when it reached the $78,000–$80,000 supply zone, which coincides with the 20-week exponential moving average (EMA). This concentration of selling pressure has proven formidable, reinforced by options market data showing 7,200 BTC in open interest at the $80,000 strike, coupled with positive gamma and low implied volatility.
On the downside, support is anchored at $75,500, a level that aligns with the 20-day EMA, 100-day EMA, and the lower boundary of an ascending channel. Glassnode’s UTXO Realized Price Distribution (URPD) data reveals direct resistance around $78,000, where investors hold 335,650 BTC, while approximately 298,560 BTC cluster at an average purchase price of $75,500, forming a critical support floor.
On-Chain signals show mixed picture
On-chain indicators paint a nuanced portrait of market dynamics. Glassnode data shows Bitcoin exhibiting “a coexistence of bullish momentum and cautious sentiment”. The spot Cumulative Volume Delta (CVD) surged nearly 200% over the past week, climbing from $18.3 million to $54.8 million, reflecting aggressive accumulation and strong conviction among market participants. However, spot trading volume declined 13.8%, dropping from $6.95 billion to $5.99 billion, signaling reduced overall activity despite the bullish CVD reading. Daily active addresses also fell by 1.6% during the same period, “indicating a reduction in market activity” and more subdued network participation.
Bitcoin is currently trading around $76,800, down approximately 1.9% over the past 24 hours. Ethereum (ETH) sits near $2,315, while the broader crypto market cap stands at $2.62 trillion, down roughly 2% from the prior day.
St Andrew’s Hospice marks 40 years of care at Airdrie Town Hall celebration

Aussies Urged to Withdraw Cash to Preserve Currency

XRP ETF April Inflows Hit 2026 Record
Manchester United reach agreement with Casemiro over contract clause amid transfer speculation

US brings back mandatory military draft registration

Steven Gerrard disagrees with Gary Neville over ‘shock’ Chelsea and Arsenal claim | Football

LISA ‘MONEY’ mirrored dance cover #shorts (based on the Performance vid and added some freestyle)

TAM Total Addressable Market For XRP – Price Would Be $8,000+

Tribal Man Forced to Bring Dead Body to Bank! Reality of Financial Inclusion in India
-
 Tech23 hours ago
Register Renaming | Hackaday
-

 Fashion4 days ago
Weekend Open Thread – Corporette.com
-
 Crypto World3 days ago
Hyperliquid $HYPE Rally Builds Momentum as AI Sector Enters Prove-It Phase
-

 Politics6 days ago
Making troops accountable for war crimes threatens US alliance, ex-SAS colonel warns
-

 Politics6 days ago
Disabled people challenge government SEND proposals over segregation concerns
-

 Business5 days ago
Patterson-UTI Energy, Inc. (PTEN) Q1 2026 Earnings Call Transcript
-

 Business6 days ago
Rolls-Royce Voted UK’s Most Iconic Trade Mark as IPO Register Hits 150
-
 Sports2 days ago
IPL 2026: Ruturaj Gaikwad registers slowest fifty of the season, enters all-time unwanted list | Cricket News
-

 Crypto World7 days ago
New York sues Coinbase, Gemini over prediction market offerings
-
 Politics19 hours ago
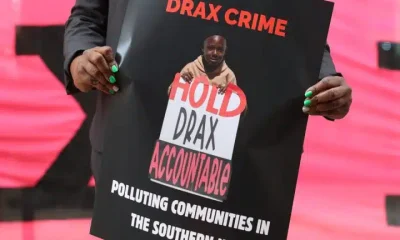
Drax board avoid their own AGM, accused of greenwashing & environmental racism
-

 Politics6 days ago
Starmer handler McSweeney to be dragged from shadows by Foreign Affairs Committee
-

 Politics6 days ago
Zack Polanski responds to home secretary’s taser threat
-
Politics6 days ago
Wings Over Scotland | How To Get Away With Crimes
-
 Business6 days ago
HCL Tech share price tank over 9% after weak Q4. JPMorgan, HSBC & 3 others cut target price
-
 Crypto World7 days ago
Crypto’s great hope in Senate’s Clarity Act still has a path to survive tight calendar
-

 Politics6 days ago
‘Iran is still a nuclear threat’
-

 NewsBeat2 days ago
LK Bennett closes all stores after entering administration
-
 Sports6 days ago
Tim Bradley names the current best in the world: “Better than Inoue and Usyk”
-

 Crypto World4 days ago
Michael Saylor says BTC winter is over. Market analyst disagrees, says bitcoin was in a pullback
-
 Crypto World7 days ago
Ethereum Price News: ETH Flashes a Bullish Setup No Holder Should Miss While Pepeto Nears Its Binance Listing
You must be logged in to post a comment Login