

Crypto World
Can Litecoin hit $1,000 after its ETF and 2027 halving?


Litecoin has returned to market discussion after crypto analyst Crypto Patel said LTC could still reach higher cycle targets, while warning that a $1,000 move remains difficult without stronger institutional demand.
Summary
- Litecoin traded near $53, remaining about 87% below its May 2021 all-time high price level.
- Crypto Patel said $500 is possible next cycle, while $1,000 needs extreme institutional demand conditions.
- Canary’s spot Litecoin ETF added regulated access, but early flows have stayed limited so far.
Litecoin traded at $53.40 on May 24, 2026, according to crypto.news price data. The token was up 2.8% over 24 hours but remained down 5.32% over seven days and 4.95% over 30 days.
Crypto.news listed Litecoin’s market cap at about $4.12 billion, with a market rank of #27. Its 24-hour trading volume stood near $205.46 million, while the price moved between $51.95 and $54.04 during the same window.
The token remains far below its May 2021 all-time high of $410.26. That gap has shaped the latest debate, with some traders viewing LTC as a long accumulation asset and others pointing to its weak recovery compared with Bitcoin, Ethereum, and Solana.
Crypto Patel framed Litecoin as a patience trade rather than a short-term breakout asset. He said LTC is not a “100x rocket” and gave a more realistic path of $150 to $300 between 2026 and 2028, with a possible extension toward $400 to $600 during stronger market conditions.
ETF access supports the bullish case
The strongest bullish argument centers on regulated access. Related crypto.news coverage said Canary Capital’s Litecoin ETF is a classic spot product that holds actual LTC through regulated custody partners such as Coinbase Custody and BitGo.
That product gives investors a brokerage-based route to LTC exposure without handling wallets, private keys, or exchange accounts. Earlier crypto.news coverage also reported that the SEC had formally acknowledged Litecoin ETF filings from CoinShares, while recognizing spot Litecoin filings from Grayscale and Canary Capital.
Still, ETF access has not yet created Bitcoin-style demand for Litecoin. Crypto.news reported in November 2025 that Solana, Hedera, and Litecoin ETFs posted inflows during a session when Bitcoin and Ethereum ETFs saw outflows, but Litecoin’s listed inflow figure was only $855,880.
That gap supports Crypto Patel’s caution. He argued that a $500 target could be possible in a strong cycle, but “$1,000+ requires multi-cycle thesis going into 2030+.” In his view, LTC needs full institutional embrace before that higher target becomes realistic.
The 2027 halving adds a supply argument
Litecoin’s supply structure also remains central to the bullish case. Crypto.news data showed a circulating supply near 77.2 million LTC out of a maximum supply of 84 million, meaning more than 91% of the total supply has already entered circulation.
The next Litecoin halving is projected for around July 27, 2027. The block reward will fall from 6.25 LTC to 3.125 LTC after that event, cutting new issuance by half.
That setup gives Litecoin a clear scarcity story. If demand rises through ETFs or exchange access while new supply falls, LTC bulls expect tighter market conditions. However, halvings do not guarantee price gains. They only reduce future issuance.
Litecoin also has MWEB, its optional privacy layer. Litecoin.com explains that MimbleWimble Extension Blocks let users move coins into a parallel private block secured by the same miners, then return to the base layer when needed.
$1,000 target faces market math
Crypto Patel’s bear case focused on market size. At $500, Litecoin would need a market cap of about $42 billion based on its 84 million maximum supply. At $1,000, the fully diluted value would reach about $84 billion.
That would place Litecoin near the top of the market, far above its current rank. The token would need major capital rotation, ETF demand, stronger payment use, and wider market support to reach that level.
The analyst also noted that Litecoin never reclaimed its 2021 high while other large assets recovered more strongly. That point matters because older proof-of-work assets often depend on cycle rotation rather than new ecosystem growth.
Litecoin also faces competition from stablecoins in payments. USDT and USDC now handle fast dollar transfers across several networks, reducing the need for volatile payment coins in some use cases. That weakens part of Litecoin’s older payment narrative.
Litecoin use remains active but limited
Litecoin still has real network history. It has operated for more than 14 years and remains one of the oldest proof-of-work networks. Its fixed supply, lower fees, and long uptime continue to support its role as a payments-focused asset.
Related crypto.news coverage also showed Litecoin gaining broader use inside regulated crypto products. Coinbase added LTC, XRP, DOGE, and ADA as collateral for USDC loans through Morpho, giving eligible users a way to borrow without selling their holdings.
That does not turn Litecoin into a DeFi ecosystem. LTC still lacks the smart contract activity, yield markets, and developer base seen on Ethereum, Solana, and other chains. For supporters, that simplicity is the point. For critics, it limits growth.
The current market read is therefore balanced. Litecoin has ETF access, a 2027 halving, a capped supply, and a long operating record. It also has weak recent price momentum, modest ETF flows, and stronger competition from stablecoins and smart contract networks.
Crypto Patel’s final view reflects that split. “Can LTC hit $500? Possible in next bull cycle peak.” He placed the probability at 20% to 30%. For $1,000, he gave only 5% to 10%, tied to an extreme demand scenario.
Disclosure: This article does not represent investment advice. The content and materials featured on this page are for educational purposes only.


TLDR:
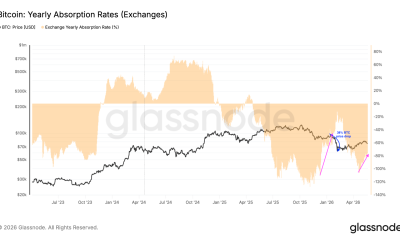
- Bitcoin spot demand has dropped to its weakest level since mid-January market activity.
- Whale Factor warns recent BTC rallies lacked strong institutional spot buying support.
- Kalshi traders now forecast Bitcoin could revisit the crucial $54,000 support region.
- Slowing ETF inflows continue to increase volatility risks across the broader crypto market.
Bitcoin Spot Demand has weakened sharply as institutional inflows slow across the crypto market. Recent analytics from Whale Factor and Kalshi now point toward rising caution among traders, with fading spot participation increasing concerns over Bitcoin’s short-term price stability.
Bitcoin Spot Demand Collapse Raises Fresh Market Concerns
Bitcoin market analysts now believe the recent recovery lacked strong backing from institutional buyers, raising questions about the sustainability of the ongoing rally.
Crypto analytics platform Whale Factor shared data showing apparent demand turning deeply negative during recent weeks.
According to the report, organic spot activity has continued deteriorating even as Bitcoin traded within a stable range through April and early May.
The sharp divergence between Bitcoin price and actual demand has attracted attention across trading desks. Historically, similar conditions emerged during periods where derivatives activity temporarily pushed prices higher without meaningful spot accumulation supporting the move.
Whale Factor explained that futures-driven rallies often become unstable when real buyers remain absent. As liquidity conditions tighten, markets can quickly experience aggressive repricing events once leverage starts unwinding across exchanges.
The report also pointed toward weakening institutional participation since the early months following spot ETF approvals in the United States.
During the strongest phases of the rally, ETF issuers absorbed significant Bitcoin supply from the market. However, recent inflows have slowed considerably compared to launch-period momentum.
Analysts now warn that without renewed spot participation, Bitcoin remains vulnerable to miner selling pressure, profit-taking activity, and broader macroeconomic uncertainty.
The declining 30-day demand average further signals that the weakness extends beyond a temporary cooling phase.
Kalshi Traders Brace For Possible Bitcoin Move Toward $54K
Prediction market platform Kalshi has added to the cautious sentiment surrounding Bitcoin Spot Demand. Recent forecasts from traders on the platform now suggest BTC could revisit the $54,000 level before the end of the year.
The shift reflects growing concerns around liquidity conditions and fading confidence in a straight-line bullish market structure.
Traders are increasingly pricing in the possibility of a deeper correction as institutional demand continues weakening.
Kalshi market projections showed Bitcoin’s expected yearly low steadily moving lower during recent weeks. Analysts believe this trend mirrors broader fears surrounding restrictive Federal Reserve policy and slowing capital inflows into risk assets.
The mid-$50,000 region remains an important area for traders because it previously acted as a major breakout zone during Bitcoin’s earlier rally phases. Market participants often expect stronger buyers to re-enter near historically important liquidity levels.
Despite the bearish forecasts, analysts still view such corrections as historically normal within broader Bitcoin cycles. Previous bull markets also experienced sharp retracements before establishing stronger long-term uptrends.
For now, traders remain focused on whether institutional accumulation returns to the spot market. Until demand improves meaningfully, Bitcoin price action may continue facing heightened volatility and fragile market conditions.

TLDR:
- ZachXBT linked multiple wallets to the reported StablR exploit involving nearly $10 million.
- EURR and USDR dropped over 20% as traders rushed to exit amid liquidity pressure.
- Security teams reportedly froze six figures while the exploit remained active on-chain.
- Investigators suspect compromised multi-signature access rather than a smart contract failure.
StablR exploit concerns rattled the stablecoin market after investigators flagged a possible $10 million breach tied to the issuer’s contracts.
The incident pushed EURR and USDR sharply below their pegs, while blockchain analysts tracked suspicious wallet activity and emergency fund freezes in real time.
StablR Exploit Triggers Sharp EURR And USDR Depeg
On-chain investigator ZachXBT identified suspicious outflows from two contracts linked to the European stablecoin issuer. The breach reportedly drained nearly $10 million and quickly sparked panic across the market.
The incident hit both EURR and USDR within hours. Traders rushed to exit positions as the stablecoins lost more than 20% of their intended value against fiat benchmarks. Liquidity pools struggled to absorb the sudden wave of selling pressure.
ZachXBT stated that the attacker’s wallet received funds via the CCTP bridge on Noble before the exploit occurred. He later published the primary wallet address alongside seven additional addresses allegedly connected to the attack.
The market reaction intensified after the exploit became public. Stablecoins depend heavily on redemption confidence, especially during volatile periods. Once doubts emerged around treasury access and reserve safety, liquidity conditions deteriorated rapidly.
StablR positions USDR as a MiCA-compliant ERC-20 stablecoin backed by segregated reserves, including cash and short-term government bonds.
However, the exploit immediately shifted focus toward reserve management and operational safeguards protecting the platform’s infrastructure.
ZachXBT later confirmed that a six-figure amount had been frozen during the live response effort. His update also suggested that the exploit remained active for several hours before broader mitigation efforts accelerated.
Multi-Signature Security Faces Renewed Industry Pressure
Early findings indicate the StablR exploit may have originated from compromised private keys rather than a direct smart contract vulnerability. Blockchain security researchers pointed toward weaknesses surrounding multi-signature wallet governance.
Multi-signature systems are designed to prevent unilateral treasury access by requiring multiple approvals before transactions are executed.
However, attackers can still gain control if critical signer credentials become exposed or governance structures remain overly concentrated.
The incident renewed debate around operational security standards within the stablecoin sector. Market participants questioned how much separation existed between reserve management systems and minting infrastructure tied to the affected contracts.
Attention also shifted toward the response speed during the exploit. ZachXBT claimed the StablR team appeared inactive while the breach continued unfolding on-chain. That statement fueled additional concerns among traders monitoring reserve-backed stablecoins.
Despite the emergency freezes, uncertainty continues surrounding the recovery process for EURR and USDR. Investors remain focused on whether liquidity conditions can stabilize and whether reserves remain sufficient to support redemptions.
The StablR exploit now joins a growing list of treasury-related crypto security failures. Analysts continue tracking the flagged wallets as investigators monitor fund movements across multiple blockchain networks.
TLDR:
- Algorand confirms transactions at the protocol level, making reversals or reorganizations technically impossible after confirmation.
- HesabPay used Algorand infrastructure to distribute over $30 million in humanitarian aid to more than one million people.
- Institutions exploring tokenized deposits and programmable payments require settlement certainty, not just high transaction throughput.
- As AI-driven autonomous transactions grow, deterministic finality becomes foundational infrastructure rather than a optional technical feature.
Algorand continues gaining recognition for its approach to transaction finality, a feature that separates it from many blockchain networks.
Unlike systems that rely on probabilistic settlement, Algorand confirms transactions at the protocol level. Once a transaction is confirmed, it cannot be reversed or reorganized.
This characteristic is drawing interest from institutions, humanitarian organizations, and emerging financial systems that require reliable, real-time settlement infrastructure.
Why Finality Matters More Than Speed in Blockchain Finance
Speed has long dominated blockchain marketing, but settlement certainty carries more weight in real financial environments.
Traditional payment systems often take days to fully reconcile behind the scenes. Many blockchain networks still require multiple confirmations before a transaction is considered truly irreversible.
Algorand’s architecture addresses this directly. Transactions reach finality the moment they are confirmed, removing downstream uncertainty.
That reliability matters to merchants, trading firms, and institutions managing collateral, compliance, and risk simultaneously.
As Marco Salzmann noted on X, “In financial markets, speed alone is not what matters most. Certainty does.” That framing captures why Algorand’s model is attracting serious infrastructure conversations beyond retail speculation.
Cross-border payments, tokenized asset markets, and machine-to-machine commerce all require deterministic outcomes.
Liquidity constraints and counterparty uncertainty grow when settlement is delayed. Algorand’s design removes those variables from the equation for each confirmed transaction.
Real-World Use Cases Demonstrate Operational Value
Algorand’s settlement capabilities have already moved beyond theory into active deployment. One of the clearest examples comes from humanitarian finance.
HesabPay leveraged Algorand infrastructure to support cash assistance programs involving multiple UN agencies operating in Afghanistan and Syria.
According to publicly discussed figures, those programs have served over one million individuals and distributed more than $30 million.
In crisis regions, delays in access to funds are not just inefficiencies — they directly affect people’s ability to reach essential goods and services.
Salzmann pointed out that this “demonstrates how deterministic settlement infrastructure can operate in environments where reliability and immediacy are operational necessities.” That distinction moves Algorand beyond the category of experimental technology.
Beyond humanitarian use, institutions are exploring tokenized deposits, programmable payments, and real-time settlement systems.
These applications require confidence that finality occurs at the exact moment of confirmation — not seconds, minutes, or days later. Algorand’s protocol-level finality directly supports those requirements.
As AI agents and autonomous software transactions grow in frequency, the need for real-time value exchange without delays becomes more pressing.
Algorand’s infrastructure positions it as a foundational layer for this emerging automated economy, where every transaction must settle with certainty before the next one begins.

Tom Lee’s BitMine faces about $7.3 billion in paper losses on its Ethereum treasury as Ether (ETH) traders weigh worsening sentiment, ETF outflows and a bearish chart setup pointing toward $1,600.
Key takeaways:
- Bitmine keeps buying ETH even as its losses mount amid the 57% price drawdown from the August 2025 high.
- ETH price technicals warn of a 25% drop, which would push Bitmine’s losses over $10 billion.
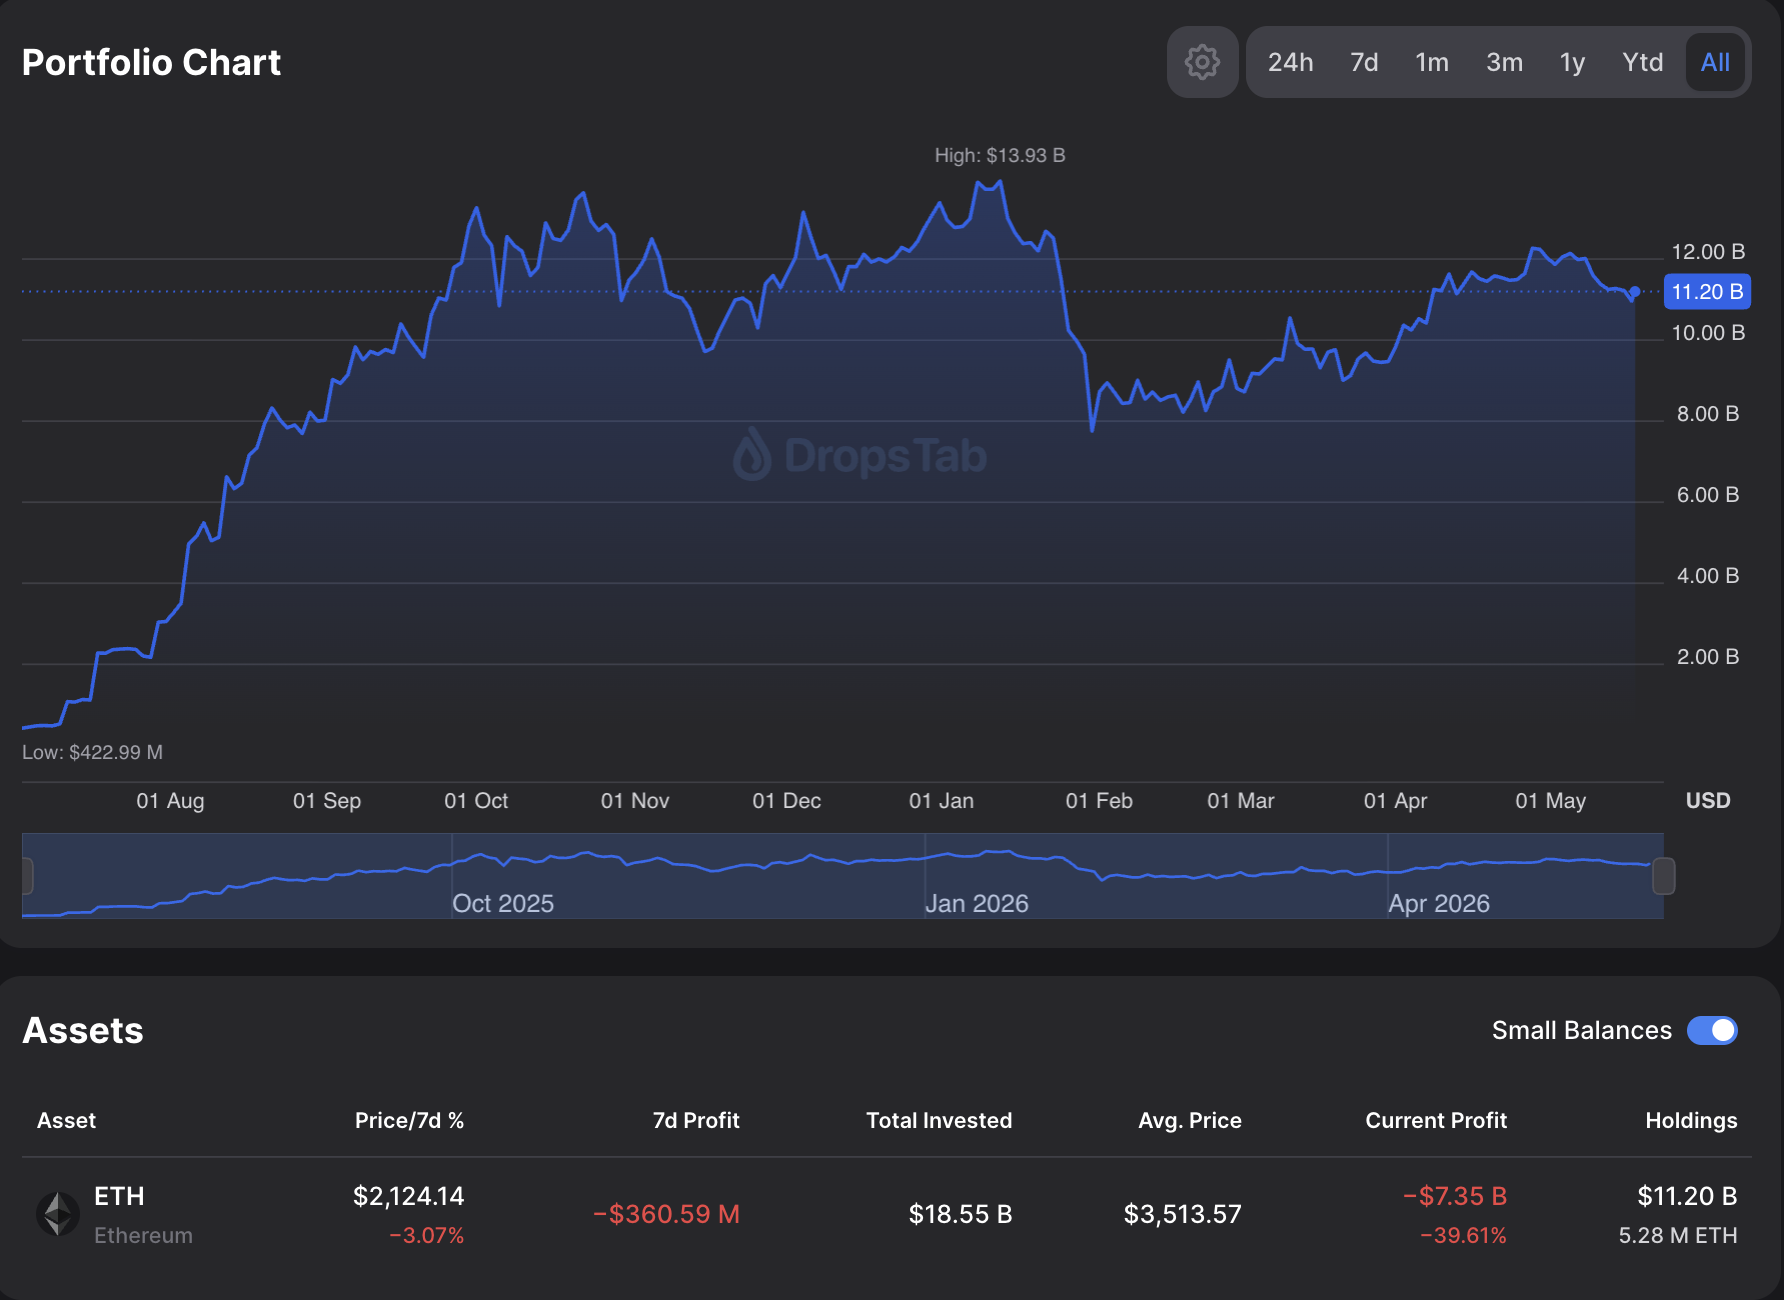
Bitmine’s ETH treasury dashboard. Source: DropStab.COM
Lee continues buying ETH despite mounting losses
Ether has fallen more than 57% from its October 2025 peak near $4,955 on Coinbase, with the sell-off also eroding Ethereum’s market share. ETH’s dominance (ETH.D) has dropped to about 10%, down from roughly 15% in August 2025.
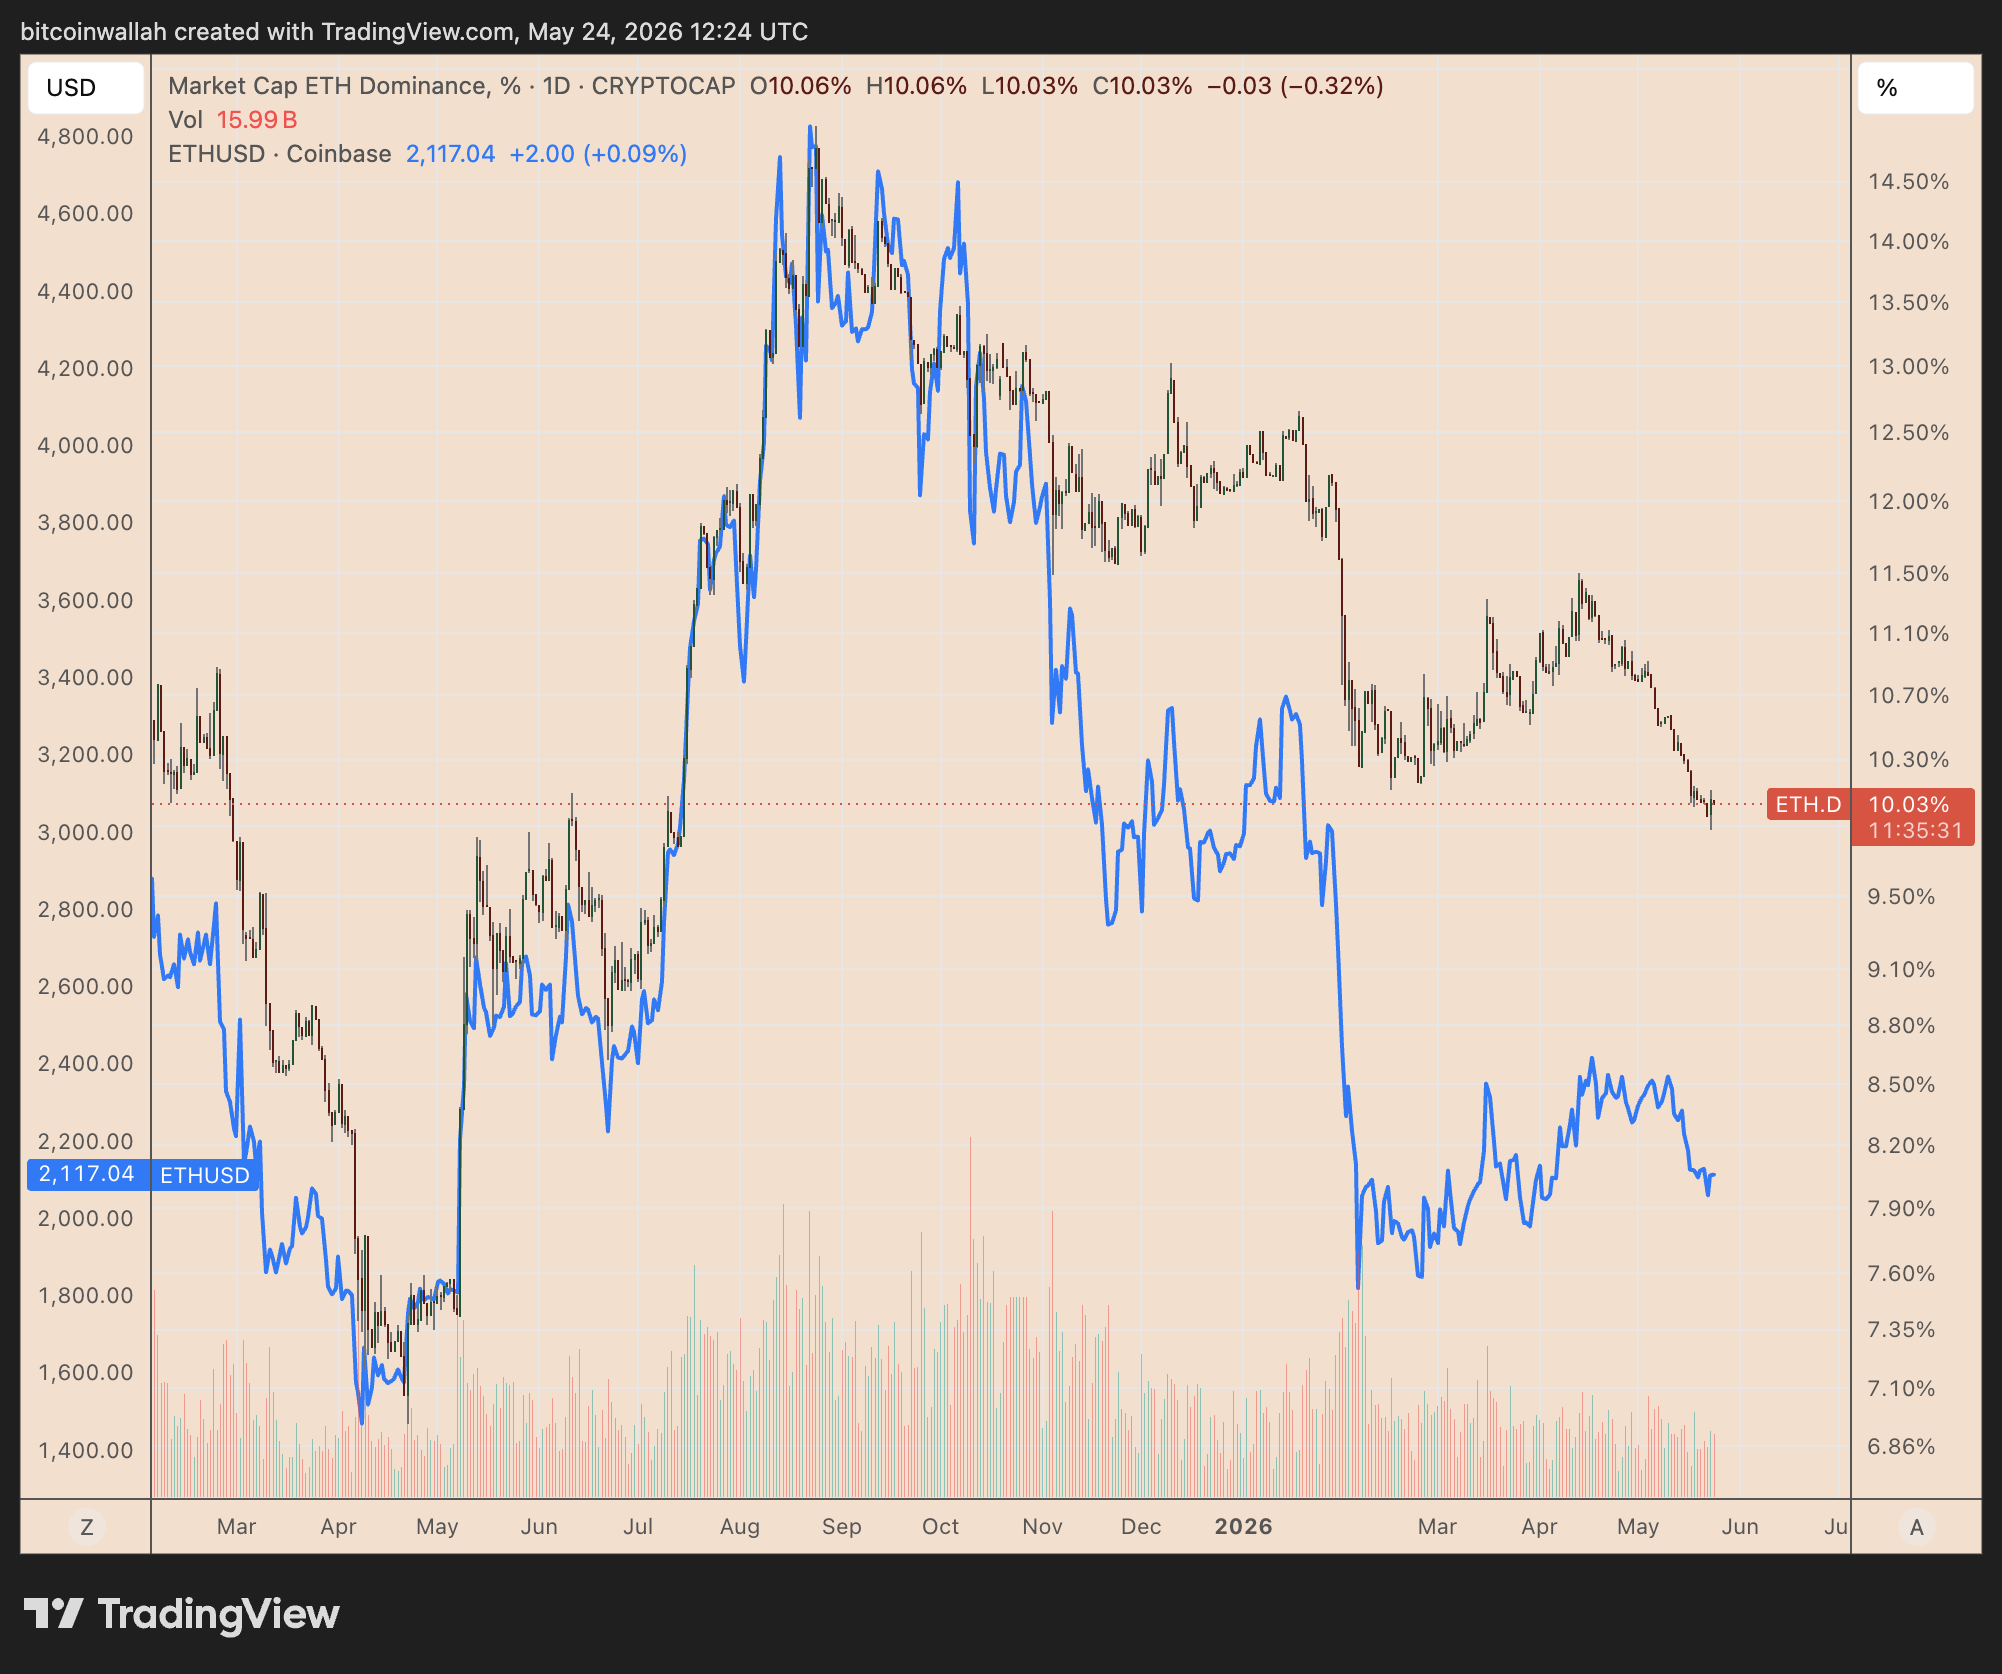
ETH.D vs. ETH/USD daily performance chart. Source: TradingView
BitMine began building its Ethereum treasury in July 2025, days after closing a $250 million private placement to fund the strategy. By July 14, the company disclosed holdings of 163,142 ETH, worth about $500 million at the time.
As of last week, BitMine held 5.28 million ETH, or about 4.37% of Ethereum’s total supply, making it the world’s largest publicly traded Ether treasury company. That means Tom Lee’s firm kept accumulating ETH through the drawdown, even as its losses widened.
Lee has not treated the losses as a reason to retreat. In February, he argued that ETH’s steep drawdown may offer another buying opportunity, citing Ethereum’s history of V-shaped recoveries after 50%-plus declines.
Related: Ether pullback was ‘attractive opportunity’ for 71,672 ETH buy: Bitmine’s Lee
In May, BitMine said it would moderate the pace of its ETH purchases, but not abandon the strategy.
The company still expects to reach its goal of owning 5% of Ethereum’s total supply by December, signaling that Lee’s strategy remains focused on long-term accumulation despite widening paper losses.
Bitmine’s losses may swell to over $10 billion if ETH falls further
BitMine could see its Ethereum paper losses swell to over $10 billion if ETH’s prevailing bearish setup plays out as intended.
As of Sunday, ETH was hovering near the lower trend line of its prevailing rising wedge, a bearish reversal pattern that often signals fading buyer momentum.
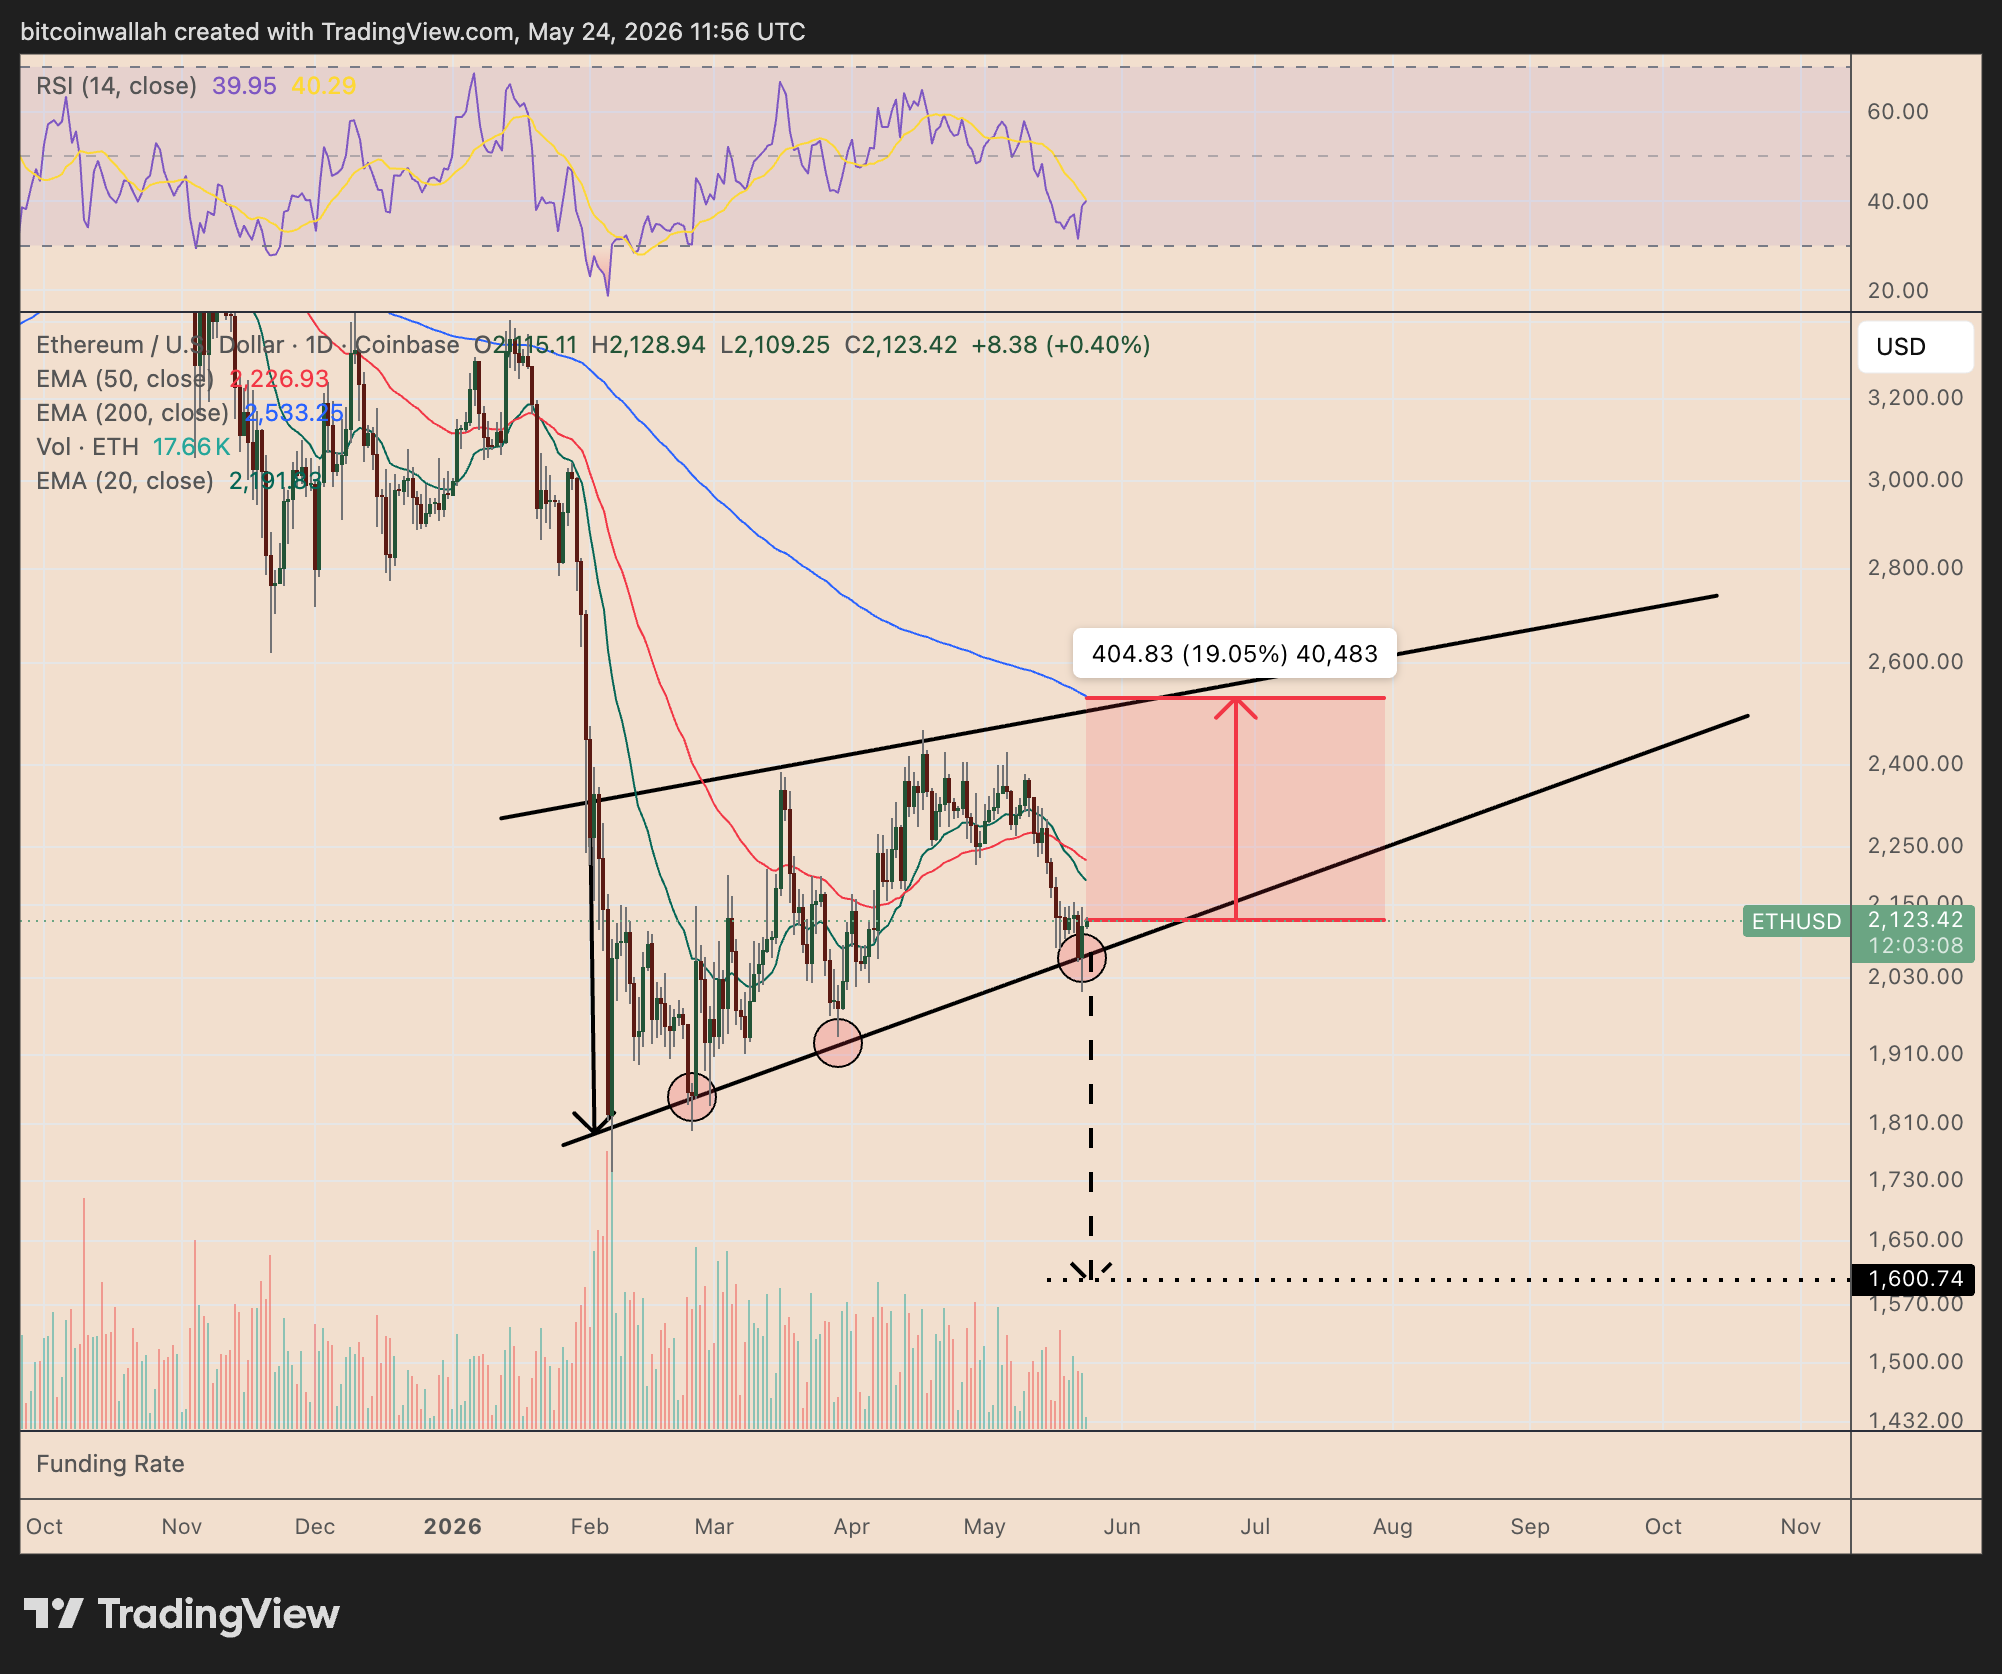
ETH/USD daily chart. Source: TradingView
A confirmed breakdown below that support could trigger a measured move toward the $1,600 area, down about 25% from current prices, by July or August. The target comes from subtracting the wedge’s maximum height from the breakdown point.
Conversely, a decisive rebound from the lower boundary may increase the odds of a 19%–20% rise toward $2,530, aligning with the wedge’s upper boundary and the 200-day exponential moving average (200-day EMA, blue line).
The breakdown scenario would raise BitMine’s unrealized losses to nearly $10.1 billion, based on its reported 5.28 million ETH holdings and average purchase price of $3,513.
Ethereum traders flip bearish
Ether’s bearish technical setup overlaps with several other headwinds, such as recent Ethereum Foundation departures, persistent ETH ETF outflows, and weakening social media sentiment.
ETH sentiment deteriorated sharply in May, with the bullish-to-bearish comment ratio falling from above 2:1 in late April to nearly 1:1, according to on-chain data platform Santiment.
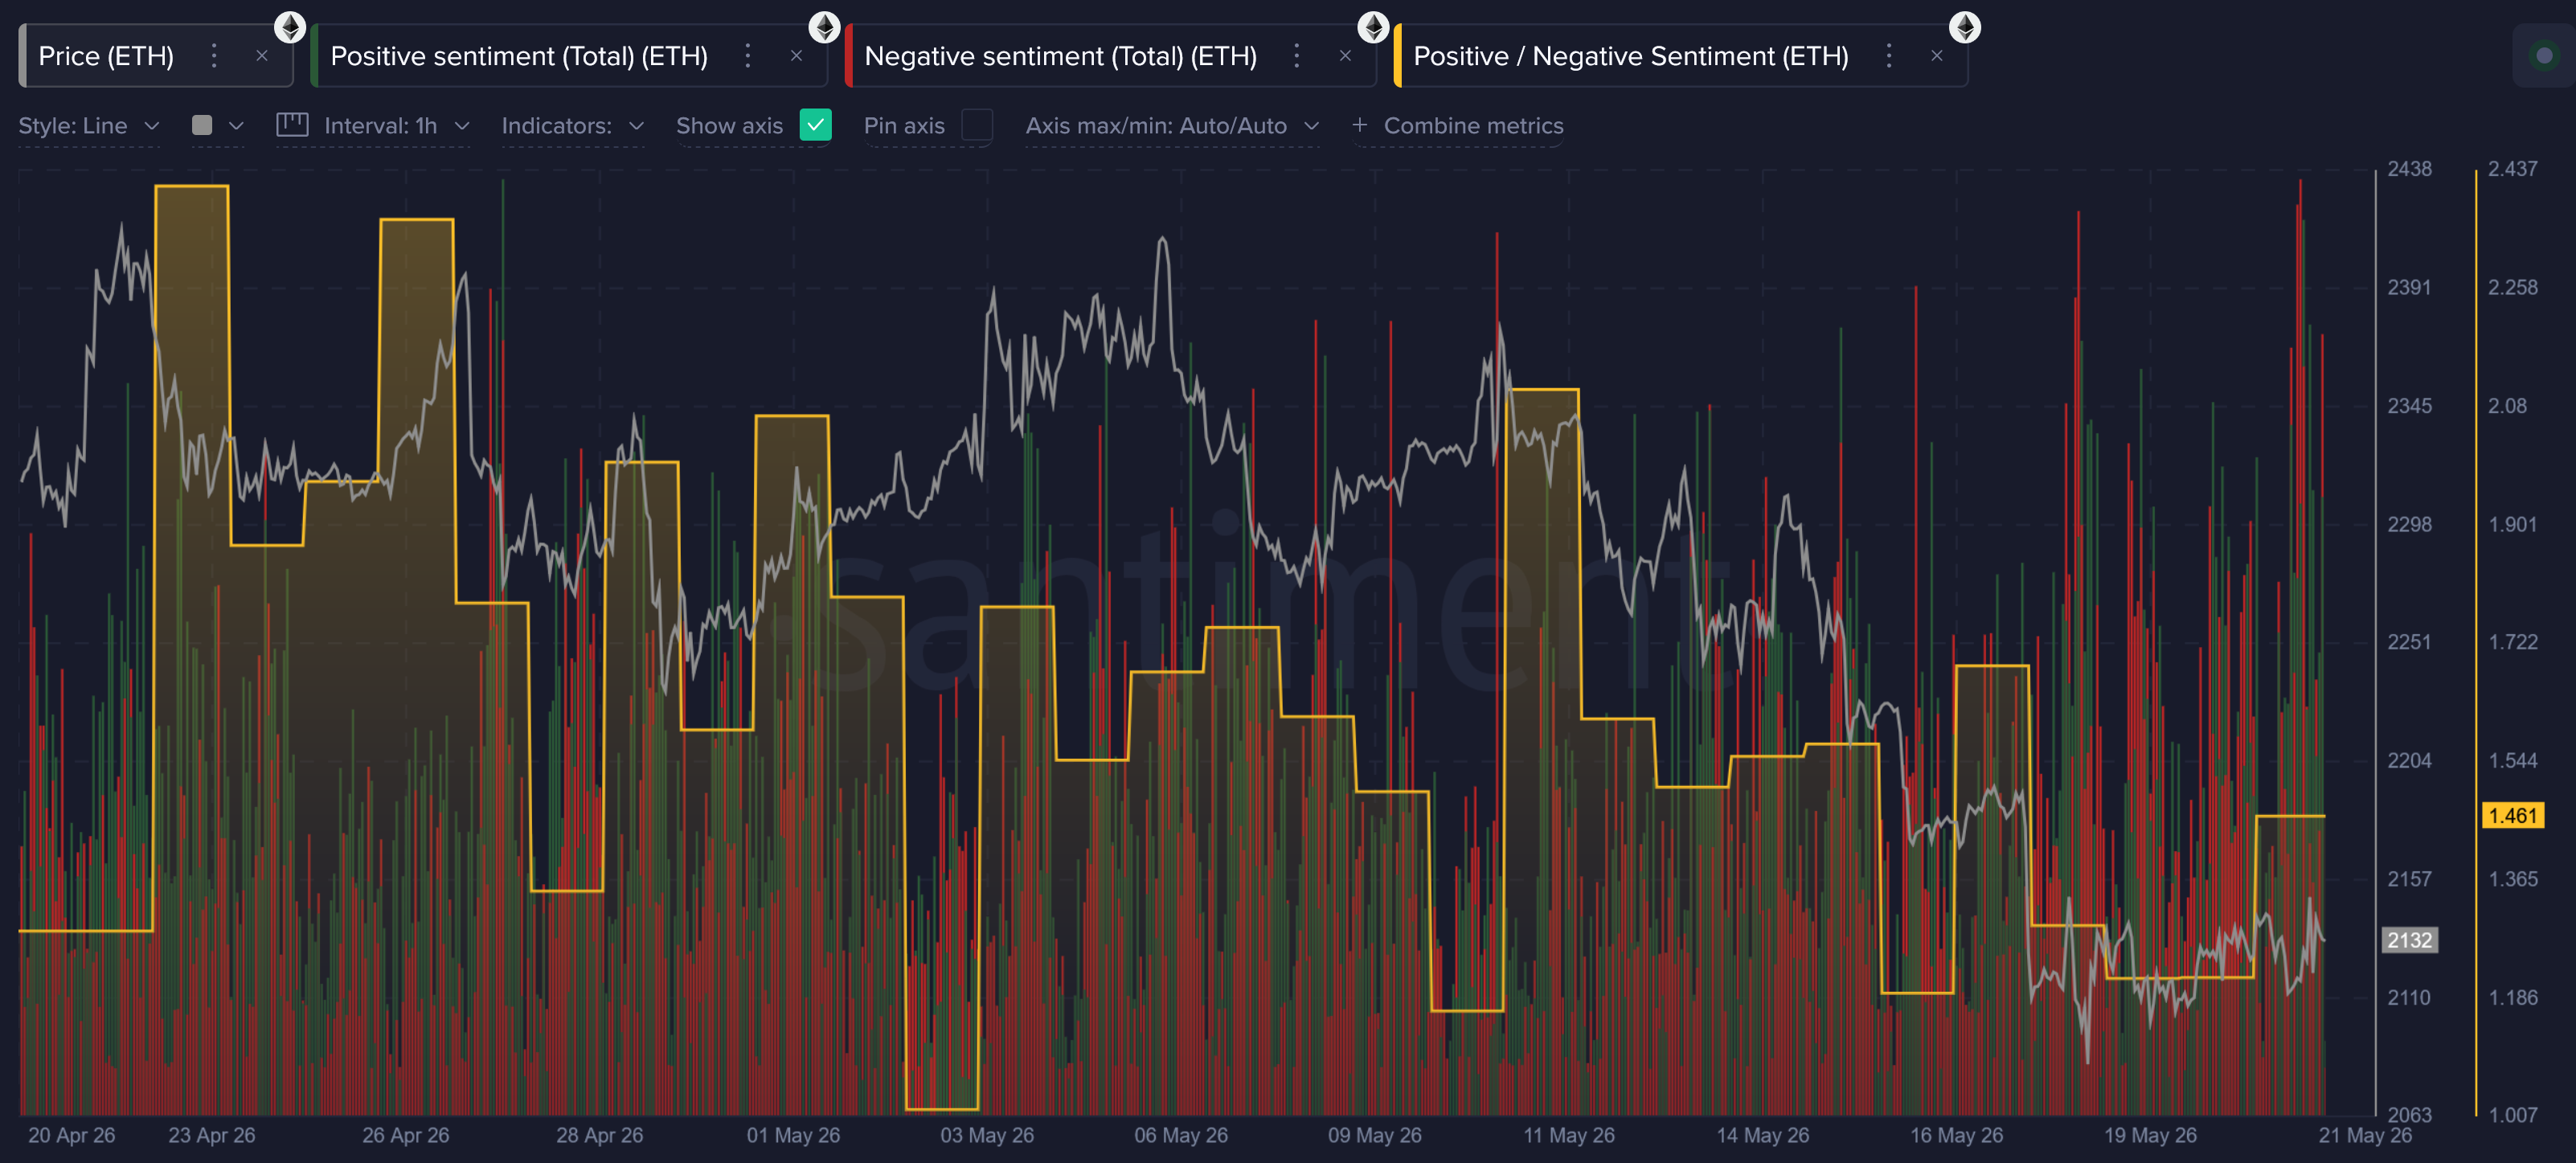
Ethereum social media sentiment. Source: Santiment
“Historically, this kind of deterioration tends to happen when traders lose confidence in an asset’s short-term direction,” it said in a Friday report, adding:
“Crypto traders tend to become highly emotional during periods of underperformance, and ETH has increasingly become viewed as ‘dead money’ compared to assets that have shown much stronger momentum in 2026.”

TLDR:
- Tokenized gold now represents nearly the entire blockchain-based commodity market worldwide.
- a16z Crypto data shows tokenized silver and oil products remain far behind gold adoption.
- Ethereum leads the tokenized asset sector with over $15 billion in on-chain value locked.
- Investors increasingly use tokenized gold for defensive exposure during market uncertainty periods.
Tokenized gold has emerged as the dominant force within the on-chain commodity sector after crossing the $5 billion mark.
Fresh data from a16z Crypto shows investors increasingly moving toward blockchain-based hard assets as macro uncertainty continues reshaping capital allocation strategies across digital markets.
Tokenized Gold Captures Nearly Entire Commodity Market
Tokenized gold now accounts for almost all value within the tokenized commodity sector, according to recent a16z Crypto data. Figures from rwa.xyz placed the broader market near $5.1 billion as of May 2026.
Out of that total, tokenized gold represented approximately $5 billion alone. The remaining commodity categories contributed only a small fraction of overall market capitalization.
Tokenized silver products remained limited, with valuations near $28 million. Gold ETF-linked tokenized exposure, including iShares Gold Trust products, stood at around $14 million.
Meanwhile, tokenized oil, agriculture, and synthetic commodity assets barely registered within the sector. Those categories collectively accounted for less than $3 million in market value.
The report noted that gold’s global liquidity and standardized pricing structure make it naturally suited for tokenization. Blockchain infrastructure also allows faster settlement and easier transferability across digital platforms.
Products like Pax Gold and Tether Gold continue driving adoption by linking physical gold reserves to blockchain-based ownership. Investors can hold tokenized gold directly through crypto wallets without relying on traditional custody systems.
The growing market share also reflects changing investor behavior during periods of elevated economic uncertainty. Traders increasingly seek defensive positioning while maintaining exposure inside crypto-native ecosystems.
Unlike volatile altcoins, tokenized gold offers lower price fluctuations while preserving blockchain liquidity advantages. That combination has strengthened demand among both retail traders and institutional participants.
Tokenized gold has surged to nearly $5 billion in market value, dominating the on-chain commodity sector as investors seek blockchain-based safe-haven exposure.
Ethereum Leads As RWA Adoption Expands Across Markets
The tokenized asset sector has expanded rapidly during the past two years. According to a16z Crypto, the broader real-world asset market recently surpassed $30 billion, excluding stablecoins.
Source: RWA.xyz
Government debt products currently lead the tokenized asset sector with approximately $15.2 billion in value. Asset managers, including BlackRock and Franklin Templeton, accelerated product launches amid rising institutional demand.
Ethereum remains the largest blockchain supporting tokenized assets, hosting nearly $15.7 billion across the sector. BNB Chain, Solana, Stellar, and Liquid Network also maintained sizable shares within the market.
Despite rising valuations, most tokenized commodity products remain lightly integrated into decentralized finance applications. Many investors continue holding tokenized gold primarily as a reserve-style asset rather than active collateral.
The report explained that only a small percentage of tokenized Treasury products currently interact with DeFi protocols.
Categories specifically designed for on-chain utility continue showing stronger composability across decentralized applications.
Tokenized gold adoption also reflects broader changes in crypto markets. Investors are increasingly combining Bitcoin exposure with defensive assets linked to traditional stores of value.
That shift suggests digital asset markets are gradually evolving beyond speculation-focused trading cycles. Blockchain infrastructure now supports both high-growth assets and lower-volatility capital preservation strategies.
Gold now dominates nearly the entire tokenized commodity market as investors rotate toward trusted blockchain-based hard assets.

The Open Network (TON) has confirmed that its legacy Token Bridge will permanently close on September 1, 2026, giving users a final window to recover any bridged assets before access is cut off entirely.
The TON Foundation announced the shutdown of bridge-v3.ton.org and has waived all percentage-based transfer fees for the remaining withdrawal period to ease the transition.
What to Do Before the Bridge Shutdown
Users holding Wrapped Toncoin (TON) on Ethereum or BNB Chain must bridge their tokens back to the TON network using bridge-v3.ton.org before the deadline.
Those holding j-tokens, including jUSDT, jUSDC, jDAI, and jWBTC, in their TON wallets must return them to Ethereum through the same bridge. Any assets left in bridged form after September 1 will become inaccessible.
The TON Foundation confirmed that all previously submitted user transfers have been processed. Additionally, the protocol covered fees for unclaimed transfers.

Toncoin Bridge Shutdown Signals TON’s Next Phase
Bridge oracles will withdraw their staked TON in June 2026, marking the first visible phase of the shutdown. The oracles will actively continue processing transfers until the final date, giving users roughly three months to act.
This development follows a broader period of ecosystem growth. Telegram’s TON takeover reshaped governance and drove a sustained rally, while Pavel Durov’s TON revival attracted both retail and institutional attention to the network.
A recent Telegram CEO TON upgrade further underscored the protocol’s continued development.
The retirement of the legacy bridge reflects the maturity of TON’s native DeFi infrastructure. Users can monitor TON market activity as the network transitions to newer cross-chain solutions.
Users should check their wallets immediately and initiate withdrawals well before the September deadline to account for any network delays.
Overall, this transition highlights the importance of timely user action and careful attention to evolving network infrastructure and updates regularly.
The post Toncoin Bridge Shutdown Confirmed: Users Face Deadline to Recover Funds appeared first on BeInCrypto.

Key Highlights
- Eight consecutive weeks of gains for the S&P 500, with the Dow approaching the 51,000 milestone
- Major quarterly reports expected from Dell, Marvell, Salesforce, Dollar Tree, Burlington, Gap, and Best Buy
- First-quarter earnings expansion hitting 26% annually, marking the strongest growth rate since 2021
- White House announces Iran agreement covering Strait of Hormuz shipping corridor is near completion
- Technology firms positioning workforce reductions as AI-driven evolution rather than budget measures
As May draws to a close, equity markets maintain their elevated position. With the S&P 500 hovering around 7,500, market participants are transitioning from quarterly earnings analysis toward interpreting economic indicators and monitoring potential catalysts.
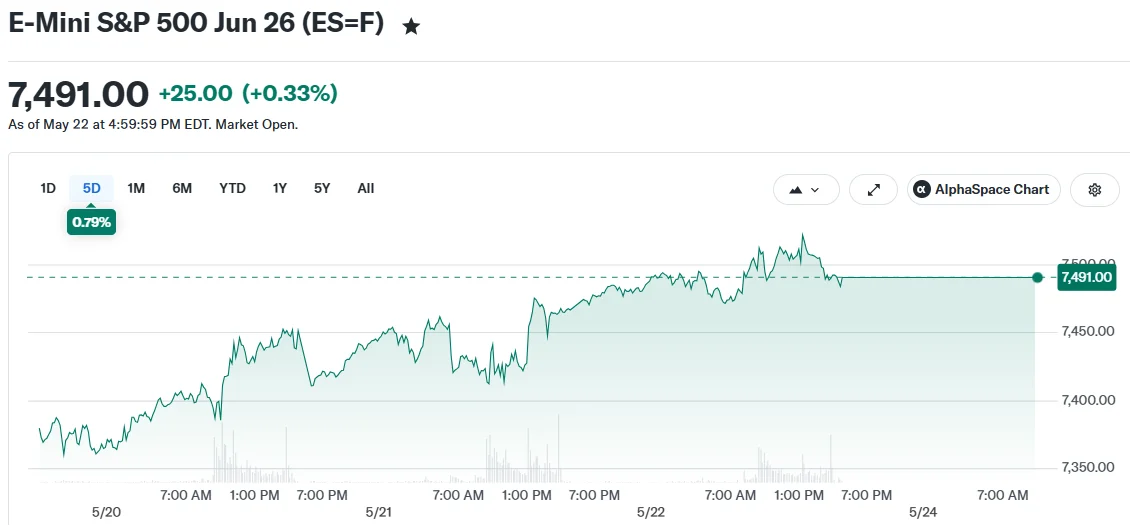
Trading activity will be compressed into four sessions this week due to Monday’s Memorial Day observance, creating a concentrated period of corporate announcements and economic releases.
Major Retailers Report Quarterly Performance
This week delivers a significant wave of first-quarter results from prominent retail chains. Dollar Tree, Burlington Stores, Gap, and American Eagle Outfitters will all unveil their financial performance.
Analysts are particularly interested in understanding how budget-conscious shoppers are navigating elevated fuel costs and persistent inflation pressures. Dollar store chains face intense scrutiny as indicators of spending behavior among price-sensitive demographics.
Best Buy’s Wednesday report carries additional significance as it represents one of the initial quarterly presentations under incoming CEO Jason Bonfig’s leadership, drawing heightened market attention.
The previous week delivered contrasting signals from the retail sector. Walmart provided conservative near-term projections while maintaining annual expectations. Target exceeded forecasts and elevated guidance. Paradoxically, both companies experienced share price declines.
The apparel category delivered more encouraging results. VF Corp, Amer Sports, and Ralph Lauren all exceeded expectations and enjoyed positive stock reactions.
Artificial Intelligence Companies Report Results
Wednesday features earnings from Marvell Technology, whose shares have surged 120% year-to-date. Salesforce also announces results that day, though the company has failed to capitalize on AI momentum with shares remaining more than 30% below year-ago levels.
Dell Technologies presents its quarterly performance Thursday. Company leadership has characterized artificial intelligence as a fundamental business transformation, and market watchers will assess whether management maintains that optimistic perspective.
Synopsys completes the AI-focused reporting calendar with its Wednesday after-hours announcement. The company’s shares gained momentum following Elliott Investment Management’s stake disclosure earlier this year.
These reports follow Nvidia’s previous week earnings, which demonstrated ongoing robust demand for AI infrastructure investments. Bank of America data shows quarterly earnings expansion reached 26% year-over-year, representing the most vigorous growth rate since 2021.
Bank of America analyst Savita Subramanian observed that despite management teams adopting conservative language during earnings presentations, forward guidance exceeded typical levels and historical patterns.
Diplomatic Progress and Economic Indicators
President Trump announced Saturday that negotiations with Iran have reached advanced stages, with an official announcement anticipated shortly. The arrangement reportedly addresses the reopening of the Strait of Hormuz, a critical maritime corridor that has faced disruption since regional hostilities intensified this year.
Financial markets have previously responded to Iran-related announcements, though diplomatic efforts have sometimes faltered. Secretary of State Marco Rubio emphasized that final agreement remains uncertain until officially concluded.
Regarding economic data, the Conference Board publishes its Consumer Confidence Index Tuesday. Thursday brings the Personal Consumption Expenditures index, which serves as the Federal Reserve’s primary inflation gauge.
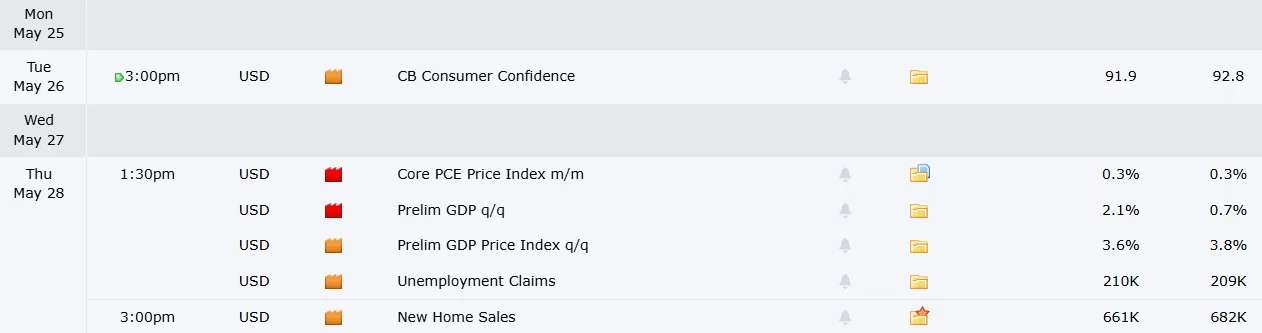
Consumer sentiment weakened in the University of Michigan’s recent survey, yet spending patterns have remained resilient despite pessimistic outlooks — a disconnect that has persisted beyond most projections.
Workforce reductions in the technology sector continue attracting attention. Companies like Meta are characterizing employment adjustments as AI-enabled organizational evolution rather than cost containment. While overall layoff figures remain subdued, the development warrants monitoring as artificial intelligence adoption extends beyond technology industry pioneers.
Crypto World
A massive $1 trillion hidden market is waiting to be unlocked in bitcoin, says new report


Crypto lender Ledn says the consumer bitcoin-backed loan market could grow nearly 300-fold to as much as $1 trillion within the next decade, as demand for borrowing against digital assets far outpaces actual usage.
The forecast accompanied new research conducted by consumer insights firm Protocol Theory, which surveyed 1,244 cryptocurrency holders across the U.S. and Australia between February and March this year. The study found that while 88% of respondents said they would consider using a crypto-backed loan or credit product, only 14% currently do so, revealing what Ledn described as a “6-to-1 consideration-to-adoption gap.”
Ledn estimates the bitcoin-backed consumer lending market currently stands at roughly $3 billion. By comparison, Galaxy Research previously estimated the broader crypto lending market reached an all-time high of $73.6 billion in the third quarter of 2025.
The sector, however, still carries the scars of the 2022 crypto credit collapse, when major lenders including Celsius Network, Voyager Digital and BlockFi either filed for bankruptcy or were forced into restructuring after crypto prices plunged and liquidity evaporated. The failures wiped out billions of dollars in customer funds and severely damaged trust in centralized crypto lending models, prompting regulators globally to tighten scrutiny of the sector. Ledn’s report suggests rebuilding that trust remains the industry’s biggest challenge.
“The demand side of the equation is solved,” Ledn co-founder Mauricio Di Bartolomeo said in a statement. “What’s still catching up is the trust infrastructure that gives borrowers the confidence to act.”
The report argues that crypto-backed lending remains underdeveloped relative to the scale of digital asset ownership globally. The global cryptocurrency market capitalization stood at approximately $2.68 trillion as of May 2, according to data cited in the research.
The findings suggest the main obstacles preventing wider adoption are not lack of awareness or understanding, but confidence-related concerns. Among non-borrowers, the most commonly cited barriers were worries about managing crypto price volatility, liquidation risk and regulatory uncertainty surrounding crypto-backed loans.
Respondents also said platform reputation, transparency around loan terms, custody safeguards and risk management practices mattered more than rates or product features when selecting a lending provider.
The report frames crypto-backed borrowing as a digital asset equivalent of securities-backed lending or home equity borrowing in traditional finance: accessing liquidity without selling a long-term asset position.
TLDR:
- Ethereum price remains near $2,000 while controlling 55% of tokenized assets across on-chain finance networks globally
- Over 39.1M ETH is staked, with an additional 3.49M ETH awaiting validation entry amid tightening supply conditions
- Short liquidation clusters above $2,100 increase volatility risk as leverage resets across derivatives markets rapidly
- Ethereum price structure shows reduced downside liquidity, limiting cascading sell-offs while compression continues forming
Ethereum price continues to trade under subdued sentiment even as underlying network activity shows sustained strength across institutional and decentralized finance channels.
Market behavior reflects a widening gap between valuation pressure and on-chain utility, with capital flows remaining structurally active across staking and tokenized asset systems.
Institutional dominance and structural positioning in the Ethereum price
Ethereum controls nearly 55% of tokenized assets distributed across blockchain networks, reinforcing its position within digital financial rails.
Its stablecoin supply also remains heavily concentrated, accounting for roughly 50% of issuance across ecosystems.
Despite trading pressure, the Ethereum price continues to reflect deep integration within decentralized finance, where it holds about 51% of total value locked.
Stablecoin transaction share remains near 35%, while decentralized exchange activity contributes close to 20% of volume share.
These figures point to sustained network utility even as price action remains muted around the $2,000–$2,200 range.
Institutional flows linked to tokenized treasuries and real-world assets continue to interact with Ethereum-based infrastructure.
Market data suggests that Canton-linked rails and similar systems still rely on Ethereum’s liquidity depth for broader settlement efficiency.
This positioning keeps the Ethereum price tied more to capital allocation trends than retail-driven volatility cycles.
Staking activity further tightens circulating supply conditions, with approximately 39.1 million ETH staked and an additional 3.49 million ETH in validator entry queues.
Entry delays extending toward 60 days indicate sustained demand for yield-bearing exposure despite weak short-term price momentum.
Accumulation address activity also recorded its strongest inflows since January, signaling ongoing spot demand even during consolidation.
Ethereum price, therefore, continues operating within a structure where supply constraints coexist with persistent institutional participation.
Liquidation structure and volatility expansion around the Ethereum price
Ethereum price derivatives markets show a notable shift in leverage composition following recent market resets. Downside liquidation clusters have thinned significantly, reducing the probability of large cascading sell-offs below the $2,000 threshold. This reflects a broad reduction in aggressive long positioning across perpetual futures markets.
At the same time, short liquidation density has increased above current Ethereum price levels, particularly around the $2,100 to $2,300 zone.
These clusters create conditions where moderate upward movement can trigger forced buybacks, adding reflexive pressure to price action. Such mechanisms often intensify volatility when liquidity is unevenly distributed.
Market structure data indicate that the Ethereum price is transitioning into a compressed volatility regime. Reduced leverage on both sides has left the order book thinner, meaning smaller flows can generate larger directional moves. This setup typically emerges after extended periods of range-bound trading and position liquidation cycles.
Traders continue to position defensively as sentiment remains cautious across broader crypto markets. The divergence between positioning and fundamentals continues to define current market behavior.
With leverage reset across most derivatives venues, the Ethereum price now sits in a sensitive equilibrium where liquidity imbalances can drive rapid directional expansion.
Market participants remain focused on how short exposure above resistance zones interacts with any emerging upward pressure.
TLDR:
- Foreign investors net sold 91.13 trillion won on the Kospi yet ownership rose to a record 39.43% of the market cap.
- Strategic retention of AI and memory chip stocks like Samsung and SK Hynix inflated total foreign portfolio values.
- Retail investors absorbed heavy foreign outflows through direct purchases and leveraged ETFs, raising correction risks.
- Korea’s MSCI Emerging Markets weighting jumped to 21.7%, signaling potential passive fund inflows ahead of the June review.
Korean stocks foreign investors are abandoning at the fastest pace in recorded history, yet South Korea’s Kospi continues pushing to fresh all-time highs — powered by semiconductor giants and a retail buying wave unlike anything the market has seen before.
Global Funds Stage Largest Stock Exit in Market History
Foreign investors have now offloaded more than 112 trillion won, equivalent to over $74 billion, in Korean equities since the start of 2026.
That figure alone makes this the most aggressive foreign exit from any single Asian equity market in recorded history.
March 2026 marked the sharpest single-month selloff yet. Overseas investors dumped 43.5 trillion won, or approximately $29.5 billion, in Korean stocks within that month alone. This number broke every previous monthly record by a significant margin.
Samsung Electronics and SK Hynix bore the heaviest outflows, with global funds cutting exposure to both chipmakers despite their strong earnings trajectory.
Then in May, selling pressure surged again. Foreign investors pulled $13.2 billion from Korean equities in a single week.
This sent the Kospi Volatility Index to near-record levels and briefly triggered the exchange’s sidecar mechanism after Kospi 200 futures dropped 5% in rapid succession.
Kospi Defies the Exodus as Retail South Koreans Bet Everything
Despite the historic scale of foreign outflows, the Kospi has continued hitting fresh all-time highs, crossing both the 7,000 and 8,000-point thresholds in 2026.
The index’s resilience traces directly to one force — South Korean retail investors stepping in with extraordinary aggression to absorb every wave of foreign selling.
What makes this retail surge different is the lengths individual investors are going to fund their positions. Reports indicate South Koreans are cashing out life insurance policies and taking out personal loans specifically to purchase equities, channeling borrowed capital into a market already running at record valuations.
Citigroup strategists flagged the situation explicitly, noting the Korean market appeared considerably more overbought than U.S. equities.
He is cutting half their bullish Korea exposure as a precautionary measure. The bank pointed to retail exuberance and margin-driven buying as the primary factors elevating downside risk if sentiment shifts.
Korea’s weighting in the MSCI Emerging Markets Index rose to 21.7% from 15.4% following MSCI’s May review. Analysts assigned a 60% probability to a positive outcome in the June developed market classification review.
That outcome, if realized, could redirect passive fund flows back into Korean equities — offering a potential counterweight to the relentless foreign selling that has defined 2026 so far.

HP investigating BIOS updates that leave premium laptop users in boot loop limbo
60 firefighters battle blaze at recycling centre at Belfast docks: LIVE updates

Navitas Semiconductor NVTS Stock Surges 20% on AI Power Demand and Upgraded Outlook


-

 Crypto World3 days ago
Blockchain.com files with SEC for U.S. IPO
-

 Fashion2 days ago
Holiday Weekend Open Thread – Corporette.com
-

 Business2 days ago
Dell Technologies DELL Stock Surges 15% on AI Server Momentum and Analyst Upgrades in 2026
-
 Crypto World2 days ago
Bitcoin Accumulation Weakens as BTC Realized Losses Hit $600M
-
 Crypto World2 days ago
Space X IPO Is ‘Bad News’ for Tech Stocks: But What About Bitcoin?
-

 Crypto World1 day ago
Robinhood crypto COO Tanya Denisova exits
-

 Politics2 days ago
Makerfield: a tale of two social-media histories
-

 Tech3 days ago
WhatsApp ads could make Irish debut after discussions with DPC
-

 Crypto World2 days ago
AI infrastructure race heats up as IREN pitches full-stack strategy, WhiteFiber lands $160M deal
-
 Tech2 days ago
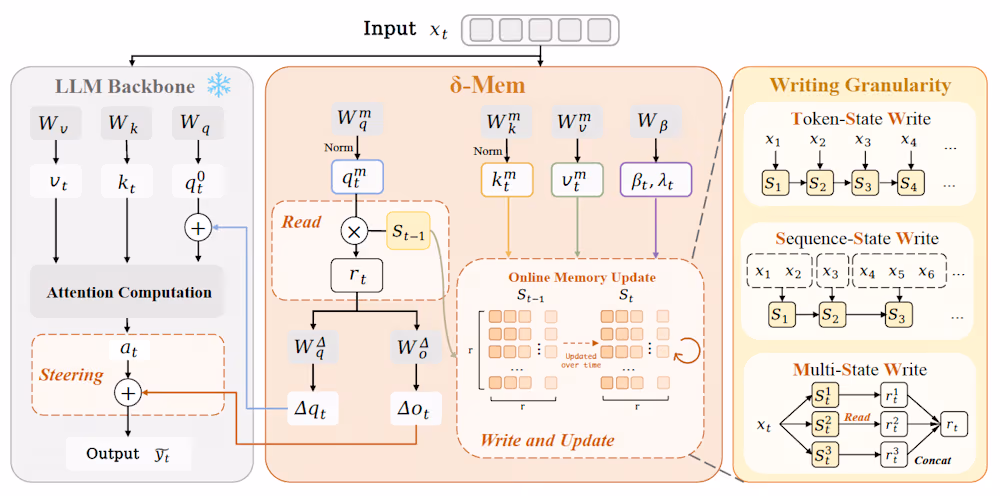
A 0.12% parameter add-on gives AI agents the working memory RAG can’t
-
 Crypto World3 days ago
MicroStrategy’s Saylor Says Miners No Longer Set Bitcoin Price, Another Force Has Taken Over
-

 Business2 days ago
Trump Invests $1M-$5M in Kura Sushi USA Chain With 27 California Locations
-
Crypto World6 days ago
Revolut Launches Dogecoin Debit Card Across UK and EU
-

 Tech3 days ago
You Can Now Add ChatGPT To PowerPoint
-

 Sports3 days ago
2026 CJ Cup Byron Nelson leaderboard: Brooks Koepka finds putting stroke in Round 1
-
 NewsBeat3 days ago
Charity run by Reform leader Malcolm Offord accused of ‘law breaking’ over Scottish registration
-

 Crypto World2 days ago
Trump Media’s Bitcoin Stash Shrinks Again as 2,650 BTC Lands on Crypto.com
-
Business2 days ago
Goldman Sachs reinstates Ageas stock coverage with neutral rating
-

 Crypto World6 days ago
SEC to propose tokenized stock framework as Wall Street efforts deepen: Bloomberg
-

 Politics7 days ago
SECOND secret Israeli base discovered in Iraqi desert
You must be logged in to post a comment Login