
Crypto World
3 Altcoins to Watch In The Second Week Of February 2026
Altcoin momentum is picking up as renewed buying pressure returns to select high-beta tokens. After a period of consolidation and volatility, several charts are now flashing continuation signals and reversal signals.
BeInCrypto has analyzed three such altcoins that the investors should watch in the second week of February.
Sponsored
Sponsored
Axie Infinity (AXS)
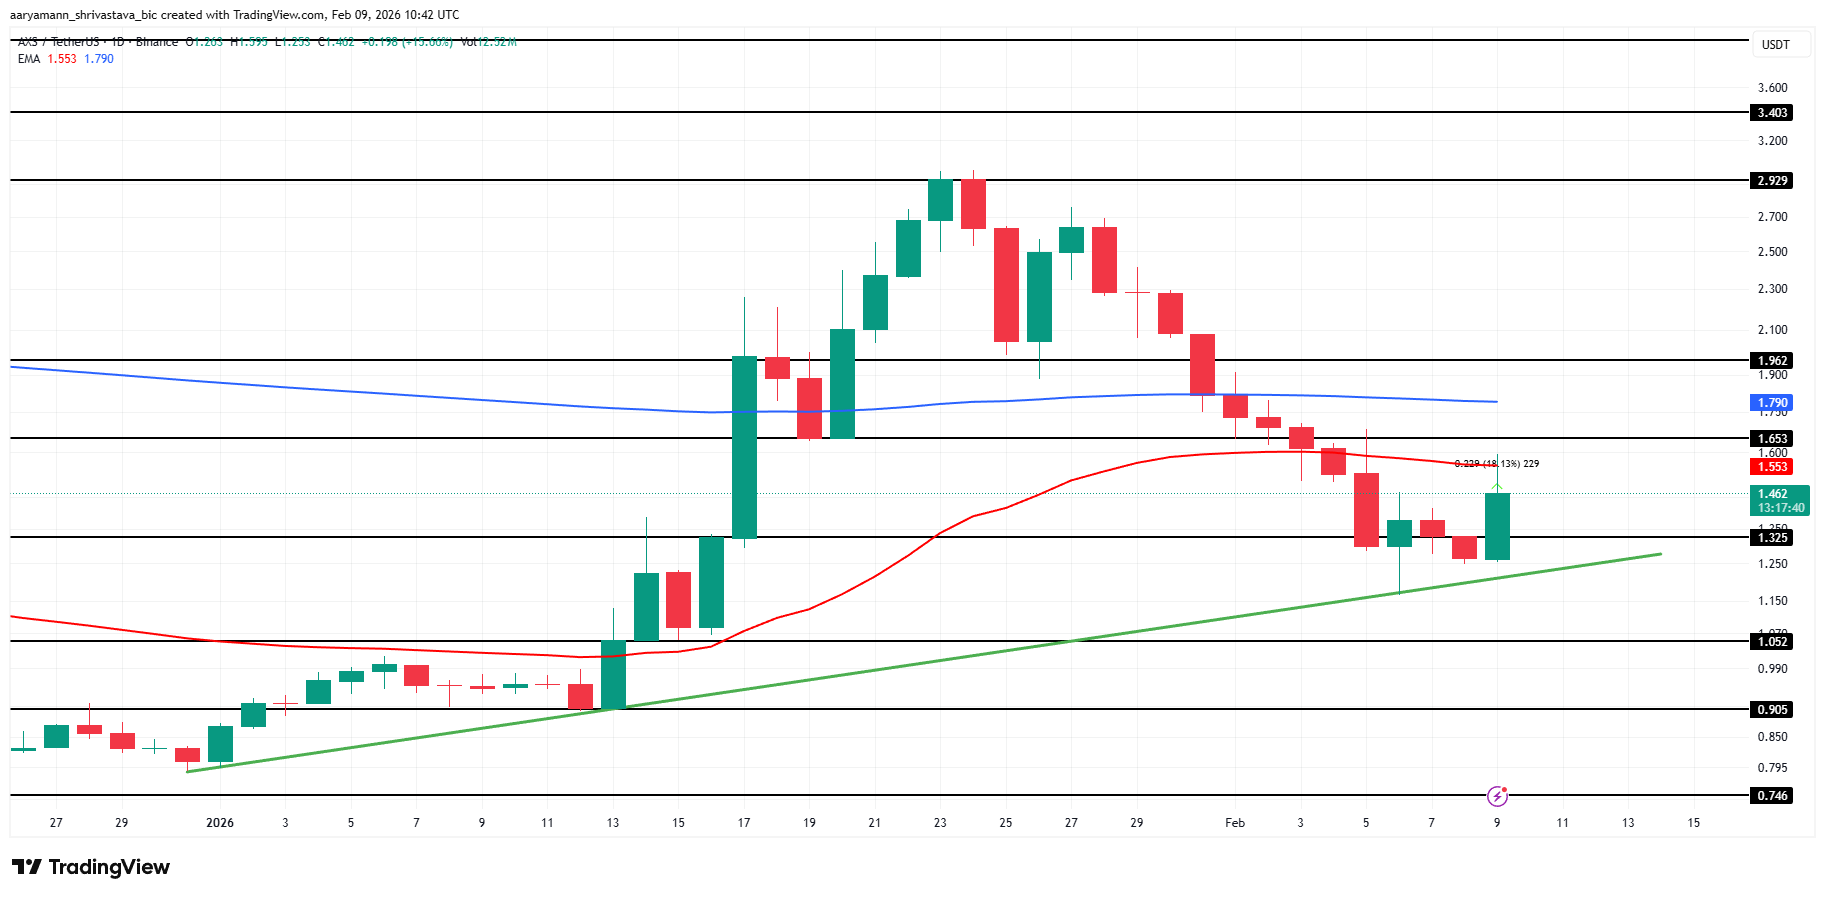
AXS emerged as the best-performing altcoin today, surging 18% over the past 24 hours. The rally helped preserve the broader uptrend that began at the start of the year. Renewed buying interest suggests traders are regaining confidence after recent volatility weighed on momentum.
A recent pullback delayed a potential Golden Cross that AXS was approaching in early February. If bullish momentum resumes from current levels, the setup could re-emerge. Such a reversal may push AXS above $1.65, opening the path toward the $1.92 resistance zone.
Want more token insights like this? Sign up for Editor Harsh Notariya’s Daily Crypto Newsletter here.

Downside risk remains if bullish momentum fails to hold. A breakdown below $1.32 would signal a loss of uptrend support. Under that scenario, AXS could slide toward the $1.05 support, invalidating the bullish thesis and shifting sentiment back toward caution.
Sponsored
Sponsored
Kite (KITE)
KITE is among the strongest-performing altcoins in the market, continuing to post fresh all-time highs since February began. The altcoin set a new ATH at $0.1719 today, extending its momentum-led rally. Persistent buying interest highlights strong demand as traders favor high-momentum assets during the current market phase.
KITE recently bounced from the $0.1506 support, reinforcing bullish structure. The Parabolic SAR remains positioned below the price, signaling an active uptrend. This technical setup supports further upside and suggests the ATH rally may continue as long as buyers defend key support levels.
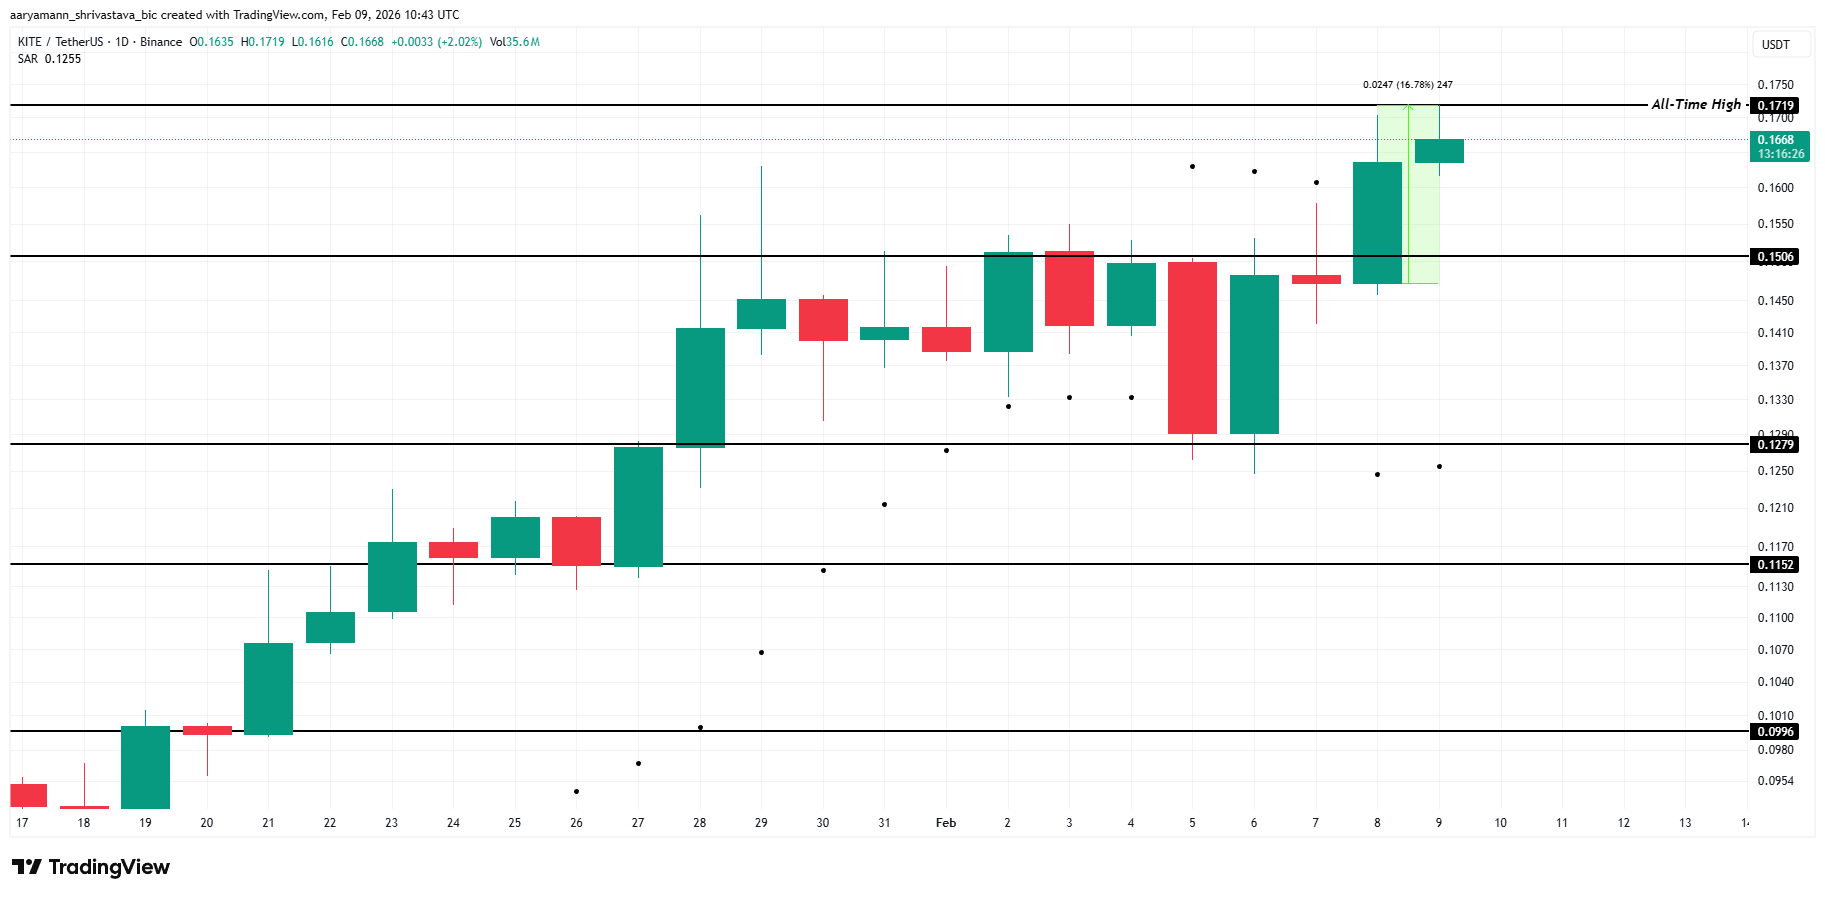
Profit-taking risk remains elevated after repeated ATHs. Additionally, a decisive drop below the $0.150 support would weaken the bullish structure. Under that scenario, KITE could retreat toward $0.127, invalidating the bullish thesis and signaling a deeper corrective phase.
BankrCoin (BANKR)
BankrCoin is showing strong bullish momentum after a sharp impulsive breakout from the $0.0007020 resistance, which has now flipped into support. Price accelerated toward the $0.00099 all-time high, followed by a tight consolidation near $0.00087. The structure suggests healthy continuation rather than distribution, positioning it as an altcoin to watch.
If buyers defend $0.00087, the price is likely to retest the $0.00099 all-time high. Furthermore, a clean breakout above $0.00099 would open price discovery toward $0.00110 next. Strong bullish candles, rising volume, and shallow pullbacks support continuation, indicating momentum remains firmly in favor of bulls.
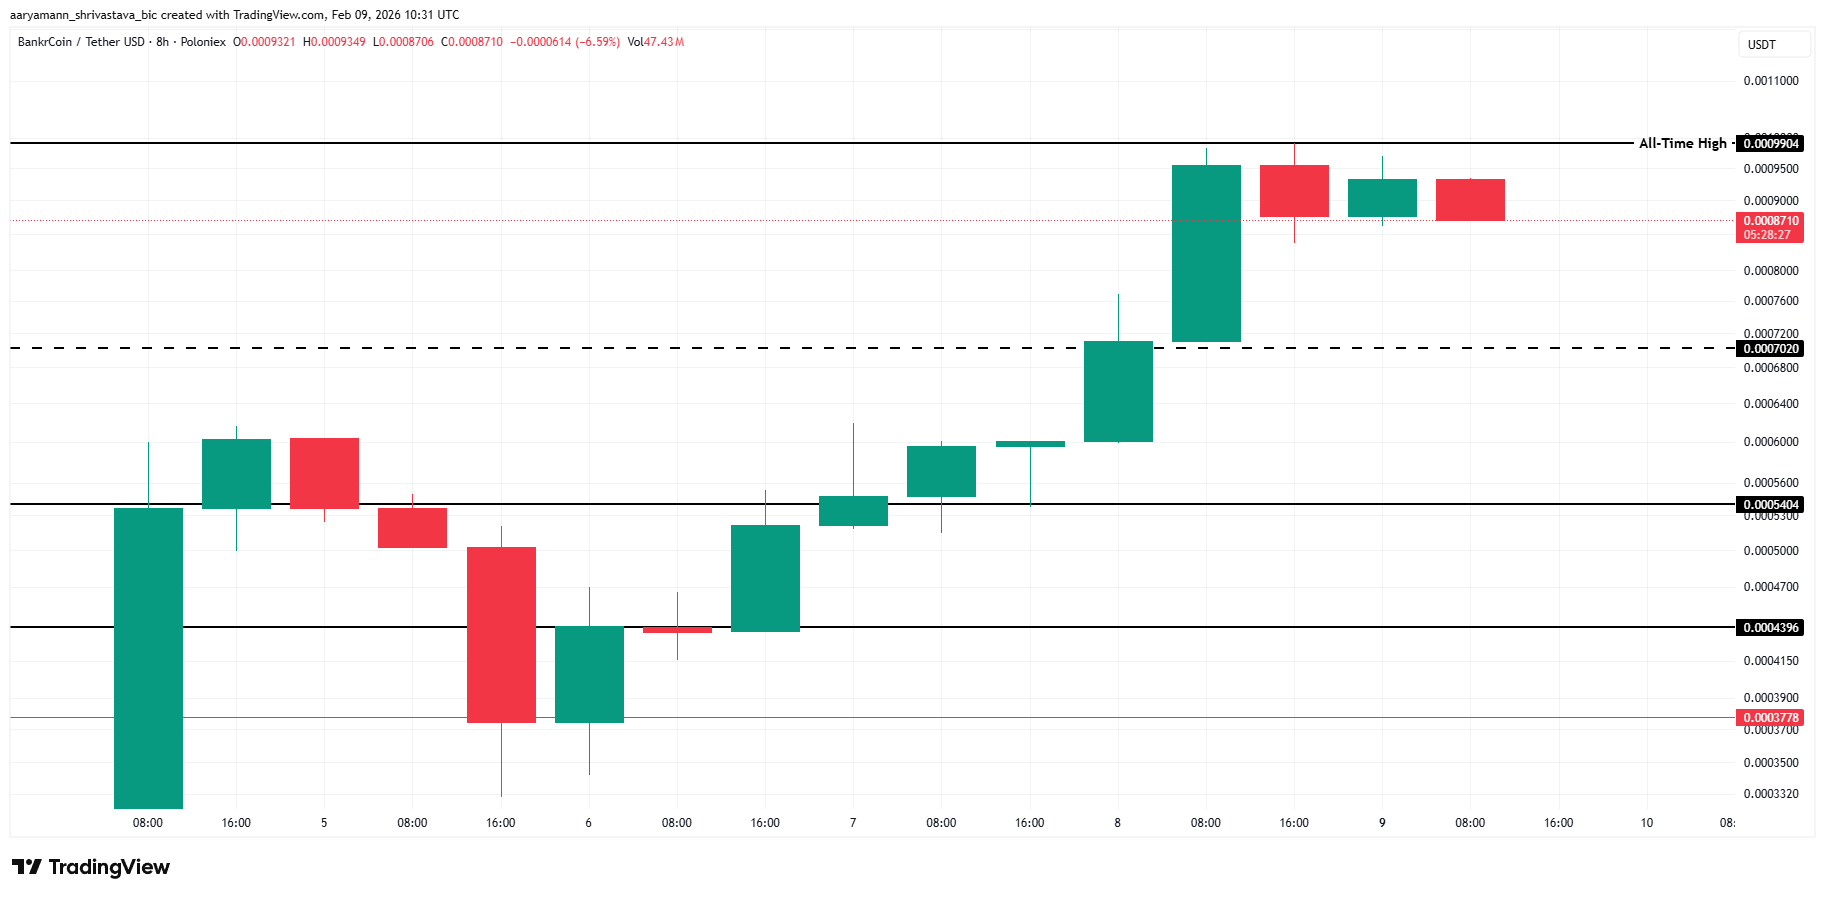
Bullish invalidation occurs on an 8-hour close below $0.0007020, which would signal a failed breakout and shift momentum neutral. As a result, a deeper breakdown below $0.0005404 would fully invalidate the bullish structure.


Aave V4 is live on Ethereum with a hub-and-spoke design that keeps liquidity pooled while routing credit to bespoke RWA and structured credit markets for institutions.
Summary
- Aave has launched V4 on Ethereum mainnet, introducing a “hub-and-spoke” architecture aimed at real‑world asset (RWA) collateral and institutional structured credit markets.news.
- The protocol, which secures more than $24 billion in total value locked (TVL), is positioning V4 as core infrastructure for regulated RWA pipelines and on‑chain credit products rather than purely speculative leverage.
- V4 debuts with three liquidity hubs—Core, Prime and Plus—that route credit to specialized “spokes,” allowing bespoke risk policies without fragmenting Aave’s pooled liquidity.governance.
Aave (AAVE) has used EthCC 2026 in Cannes as the launchpad for its long‑anticipated V4 upgrade, activating a new “hub‑and‑spoke” architecture on Ethereum (ETH) mainnet that is explicitly designed to serve real‑world assets and institutional credit strategies. The decentralized lending protocol, which Phemex notes already holds more than $24 billion in TVL, is betting that its next phase of growth will come from RWA‑backed lending and structured products, not just yield‑farming loops.
In The Block, V4 is described as a system in which a central liquidity “Hub” extends credit lines to multiple lending markets, with Aave establishing three main hubs—Prime, Core and Plus—to segregate assets and use cases by risk level. Governance documentation on the Aave forum explains that “V4 allows each Spoke to define its own risk appetite, collateral policies, and liquidation rules while drawing on shared Hub liquidity,” likening the model to “a supranational bank allocating capital to regional facilities, each operating under its own mandate.” In practice, that means RWAs, fixed‑rate lending and more complex credit structures can sit in their own spokes, with conservative caps and isolation mechanisms, without splintering Aave’s overall liquidity or forcing users to choose between entirely separate pools.governance.
Coverage from Bitcoin.com and Me3 frames Aave V4 as a fundamental redesign rather than a minor version bump, highlighting that the new architecture “supports new market types like fixed‑rate lending and tokenized real‑world asset collateral” and “enables institutional borrowing against RWAs without fragmenting the protocol’s existing liquidity pool.” Those capabilities tie directly into Aave’s 2026 “master plan,” where founder Stani Kulechov outlined three pillars: the V4 upgrade, Horizon—an RWA platform tailored to institutions—and a new front‑end app aimed at onboarding mainstream users. Horizon is already focused on regulated, compliance‑aligned lending, targeting tokenized treasuries, real estate and private credit, with Kulechov’s goal to grow that platform beyond $1 billion in assets and deepen partnerships with firms like Circle, Ripple, Franklin Templeton and VanEck.
Those ambitions are underpinned by scale that is unusual even within DeFi. According to figures shared by Aave and cited by MEXC, the protocol has processed more than $3.33 trillion in total deposits since launch and issued close to $1 trillion in loans, generating around $885 million in fee revenue and capturing roughly 59% of the decentralized lending market. In that context, the decision to anchor V4’s debut to EthCC—amid a broader institutional turn at the conference—signals that Aave sees itself less as a pure crypto‑native money market and more as a candidate backbone for an on‑chain credit system that can handle both degen leverage and Basel‑sensitive collateral flows.
The launch comes after months of governance work and a sizeable funding push. In March, Aave Labs submitted the “Aave Will Win” framework, asking the DAO for $25 million in stablecoins and 75,000 AAVE tokens—about $42.5 million in total—to finance V4 development, a new independent foundation and growth initiatives targeting fintechs and institutions. A separate governance proposal set out the V4 activation path and initial asset range on Ethereum, with Kulechov telling the community on X that V4 is a “full redesign of the protocol’s structure” aimed at moving “the next trillion dollars in assets” on‑chain.
For users, the immediate changes include a more modular risk framework and the prospect of borrowing against a broader set of tokenized assets while still benefiting from Aave’s deep, shared liquidity. For the broader DeFi market, the upgrade cements a narrative shift: as more protocols chase RWA flows and institutional capital, flagship money markets like Aave are quietly turning into on‑chain credit utilities, with EthCC now serving as the stage where that transition is announced.

Key Takeaways
- Bernstein elevated Western Digital to Outperform from Market Perform, raising its price target from $170 to $340.
- A sharp 21% decline followed concerns about Google’s TurboQuant compression technology — which Bernstein argues poses zero threat to hard drive demand.
- The firm projects Western Digital and Seagate will achieve combined revenue growth of 24% CAGR between fiscal 2025 and 2030.
- Western Digital announced an extended timeline for its ePMR technology, potentially indicating a delayed shift to HAMR drives.
- Seagate remains Bernstein’s preferred stock in the segment, with its price target elevated to $620.
Despite recent volatility, Western Digital maintains a year-to-date gain of approximately 57%, showcasing resilience even through the latest correction.
Western Digital Corporation, WDC
The stock plunge was triggered when Google Research introduced TurboQuant — an advanced compression method designed to optimize KV cache during AI inference operations. Market participants worried this innovation could reduce storage hardware demand.
Bernstein’s Mark Newman firmly rejected this narrative. “There is zero impact to HDD demand,” Newman stated in his research note. He emphasized that TurboQuant’s influence on NAND flash storage, utilized solely for offloading inactive caches, is minimal at best.
According to Bernstein, the market reaction was excessive and unwarranted. Western Digital had tumbled 21% from its recent peak before the analyst’s upgrade. Related companies including Seagate and Sandisk experienced similar pressure.
Upgraded Revenue Projections for Storage Industry
Bernstein has adopted a more constructive stance on the broader storage industry. The research firm now forecasts that Western Digital and Seagate will achieve a combined revenue compound annual growth rate of 24% spanning fiscal years 2025 through 2030.
This represents a substantial upgrade from earlier projections that anticipated 18.7% bits growth accompanied by 3.6% annual price erosion. The updated model incorporates 24% bits expansion with pricing holding steady.
Newman pointed to several structural growth drivers: expanding AI computational workloads, increasingly sophisticated content production, extended data retention requirements, and strengthening data sovereignty regulations that support both volume growth and pricing power.
Regarding product developments, Western Digital’s 2026 Innovation Day revealed plans to extend its ePMR technology roadmap. The company essentially prolonged the lifecycle of its existing drive architecture by one to two additional years beyond prior expectations.
Questions About HAMR Rollout Timeline
The upgrade contains an important qualification. Newman interprets Western Digital’s continued emphasis on ePMR as an implicit indication that the company’s migration to heat-assisted magnetic recording — commonly referred to as HAMR — might be progressing slower than initially anticipated.
Bernstein’s financial model anticipates Western Digital will begin scaling HAMR production in 2027, representing approximately 5% of nearline exabyte shipments during that year.
This contrasts sharply with Seagate’s trajectory, where Bernstein projects roughly 70% of nearline volume will utilize HAMR technology by 2027. Seagate continues as the firm’s preferred investment, with its price target increased to $620 from $500.
Western Digital shares climbed approximately 2.3% during Wednesday’s premarket session following the upgrade before accelerating gains throughout regular trading hours.


Gnosis’ push behind the Ethereum Economic Zone shows DAOs moving from tuning parameters to voting on whether whole chains become Ethereum L2s, tying governance to market structure.
Summary
- Gnosis and Zisk’s Ethereum Economic Zone (EEZ) emerged directly from a GnosisDAO R&D mandate to explore turning Gnosis Chain into a natively integrated Ethereum layer‑2.
- The framework, co‑funded by the Ethereum Foundation and unveiled at EthCC 2026, aims to fix Ethereum’s “fragmentation problem” by enabling synchronous composability across L2s while keeping ETH as the core gas and settlement asset.
- The process marks a new phase in on‑chain governance, with DAOs effectively voting on the technical and economic destiny of entire chains, not just on parameter tweaks.
The Ethereum Economic Zone did not appear out of thin air at EthCC 2026; it is the visible tip of a governance process inside Gnosis that has been wrestling with a single strategic question for months: should a long‑running sidechain effectively become a native Ethereum layer‑2. GnosisDAO governance records from February 2026 show community discussions around a six‑month R&D collaboration with zero‑knowledge engineer Jordi Baylina to explore “converting Gnosis Chain (GNO) into a natively integrated Ethereum (ETH) L2 with synchronous composability,” as summarized by analytics site Crypto Whale Data. According to a subsequent note on that same site, “EEZ appears to be the product of that exploration,” effectively weaponizing Gnosis’ internal L2 thesis into a shared framework for the broader ecosystem.
At EthCC in Cannes on March 29, Gnosis co‑founder Friederike Ernst and Baylina formalized that pivot by unveiling the Ethereum Economic Zone, a rollup framework co‑funded by the Ethereum Foundation and pitched as a way to “reassemble Ethereum” into “One Ethereum.” As Binance’s coverage of the announcement notes, the “core commitment” of EEZ is “synchronous composability,” allowing smart contracts on connected rollups to interact with each other and with Ethereum mainnet “within a single atomic transaction” and using ETH as the default gas token. In an EtherWorld write‑up, Ernst is quoted telling the audience that “Ethereum does not have a scaling problem, it has a fragmentation problem,” arguing that every new L2 has become “its own island, separate liquidity, separate deployments, separate bridges that take a cut every time you try to move between them.”
What makes the Gnosis story different from a routine technical upgrade is the way governance and infrastructure are now fused. As MEXC’s summary of the initiative points out, Gnosis has been active as a layer‑1 for seven years, and its decision to help build EEZ means “a governance‑driven blockchain is actively choosing to tie its future to Ethereum’s rollup‑centric roadmap rather than compete as a standalone L1.” The same report stresses that development is being led by contributors from Gnosis and Baylina’s proving‑stack project Zisk, with the Ethereum Foundation co‑funding the work and a Swiss‑based EEZ Association created to maintain neutrality and invite broader participation.
Market commentators within the ecosystem have seized on the shift. In a widely circulated post, the Bankless account described EEZ as “Ethereum’s fragmentation problem [getting] its most serious answer yet,” emphasizing that it is “led by Gnosis and ZisK, funded by the EF.” A longer explainer published on Binance’s content platform asks, “Can this new framework bring Ethereum back together?” and frames EEZ as an attempt to stop building “more walled gardens” and instead connect existing rollups into “something that actually behaves like a single DeFi economy.”
For GnosisDAO and other token‑holder communities watching closely, the implications are clear. Governance is no longer just about changing interest‑rate curves or fee switches; it is about making existential choices over whether entire chains migrate into tightly coupled rollup frameworks, which settlement asset they prioritize, and how closely they bind themselves to Ethereum’s monetary and security model. The Gnosis‑EEZ path suggests that future DAO votes may increasingly resemble corporate strategy decisions—approve an R&D mandate, explore a structural pivot, then ratify an architecture that can redefine the chain’s economic role—rather than the parameter fine‑tuning that defined DeFi’s first era.

Visa Inc. signage on the floor of the New York Stock Exchange (NYSE) in New York, US, on Wednesday, Jan. 28, 2026.
Michael Nagle | Bloomberg | Getty Images
Visa is launching six new tools using artificial intelligence to modernize the process of disputing credit card charges, the company told CNBC exclusively.
The digital payments company said the tools are designed to reduce the costs and frustration of “outdated” dispute processes for multiple entities involved in the payments process: merchants, issuers and acquirers.
“Some of the challenges are these back-office systems are still largely manual,” Andrew Torre, Visa’s president of value-added services, told CNBC. “We really had to think differently about how we approach this at scale.”
In 2025, Torre said, Visa processed more than 106 million charge disputes globally, marking a 35% increase since 2019.
“Our goal is to streamline this as much as possible,” Torre said. “We’d love to be able to see that growth rate come down.”
Visa’s new tools are part of a larger push by major banks and financial institutions to incorporate AI into their businesses — both internally and in consumer-facing applications. JPMorgan Chase and Goldman Sachs have both said they’re already using AI to hire fewer people. BNY spent $3.8 billion on technology in 2025, or about 19% of its revenue.
Visa said three of its six new tools focus on merchants, allowing them to address potential disputes before they escalate, managing disputes with generative AI responses and providing a deeper level of detail on order insights to manage confusion over unfamiliar charges.
For example, Torre said, many disputes are borne out of cardholders not recognizing a specific charge on their statements. With the new tool, Visa will be able to provide further details to financial institutions to show cardholders that data at a deeper level, according to the company.
The other three tools are built for issuers and acquirers, using predictive AI models to aid in case-by-case analysis, analyzing documents for summaries and auto fill and establishing an AI-powered dispute platform to manage the entire process in one location, Visa said.
“We’ll be able to get them insights and data so they can move from being reactive to proactive,” Torre said.
Torre said Visa’s new AI tools are part of a broader host of solutions for consumers, including a subscription manager announced last week that allows cardholders to cancel unnecessary subscriptions directly on the manager.
The automation will save time, money and unnecessary confusion for both parties, he added. Most of the tools will be generally available later this year, the company said.
“We really believe that disputes in this solution makes it much easier to manage and resolve,” Torre said. “We think it has better outcomes for everyone.”
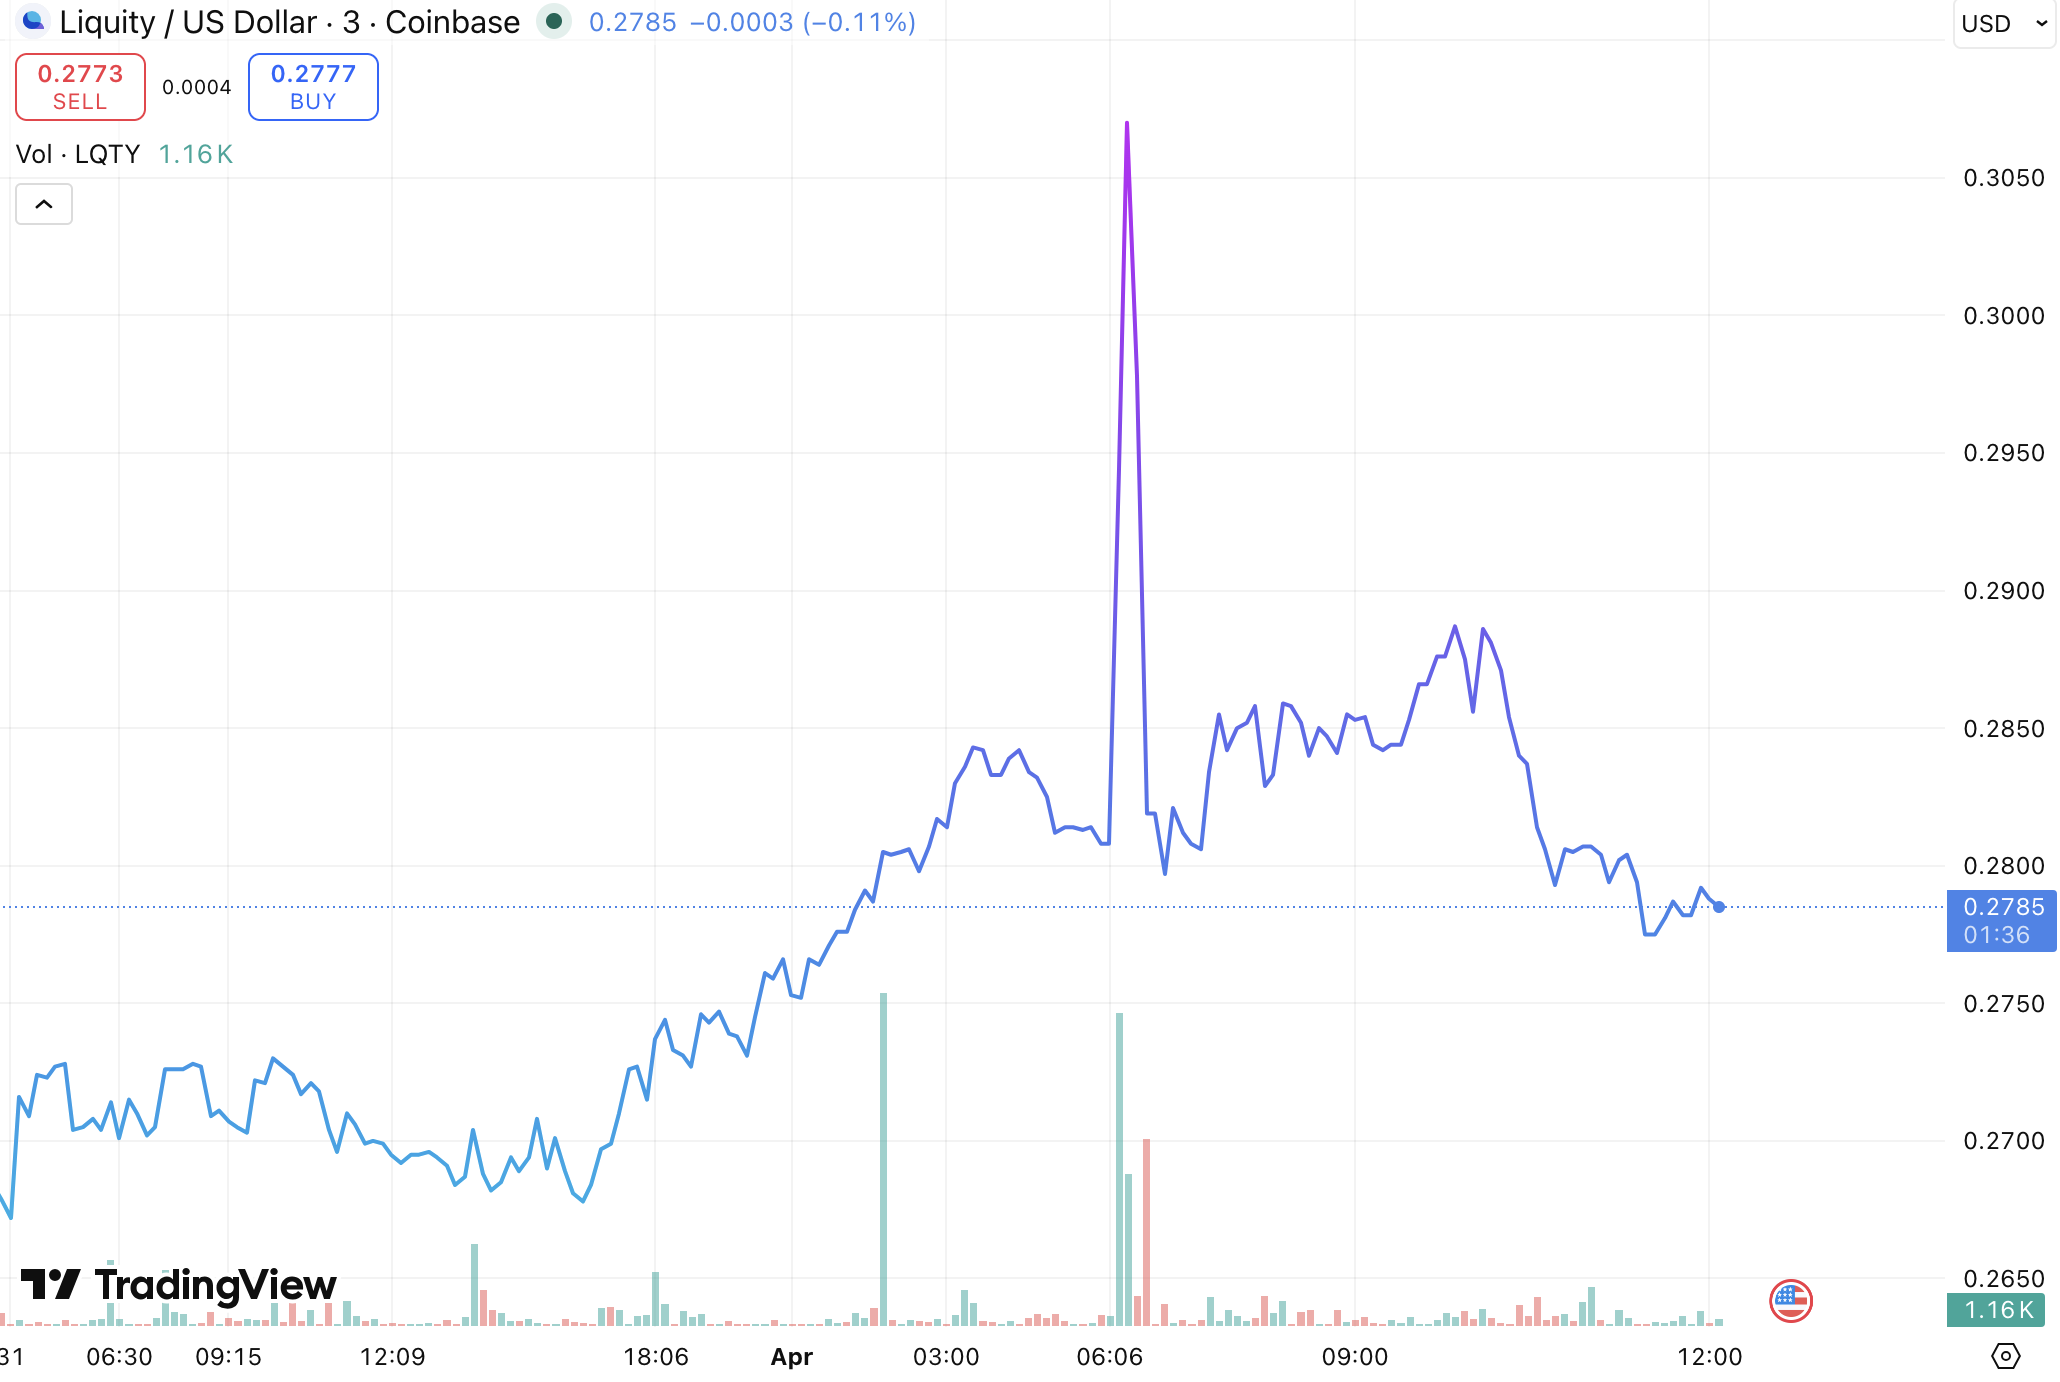
A crypto April Fool’s bit from protocol firm Liquity, which claimed it was being bought by stablecoin giant Circle, has led to allegations of “market manipulation” after it pumped the price of its in-house token.
Liquity announced on April 1 that it was acquired by Circle in a deal that would allow Circle to offer users “a non-freezable stablecoin and directly distribute yield under the Clarity Act.”
The joke pokes fun at Circle’s ability to freeze tokens and the fact that the Clarity Act, in its current form, seeks to ban yield on stablecoins.
Read more: ‘Bad actor’ Circle slammed for letting stolen $3M USDC sit unfrozen
Its freezing powers were ridiculed by the crypto investigator ZachXBT last week, who claimed Circle wrongly froze 16 wallets as part of a civil lawsuit.
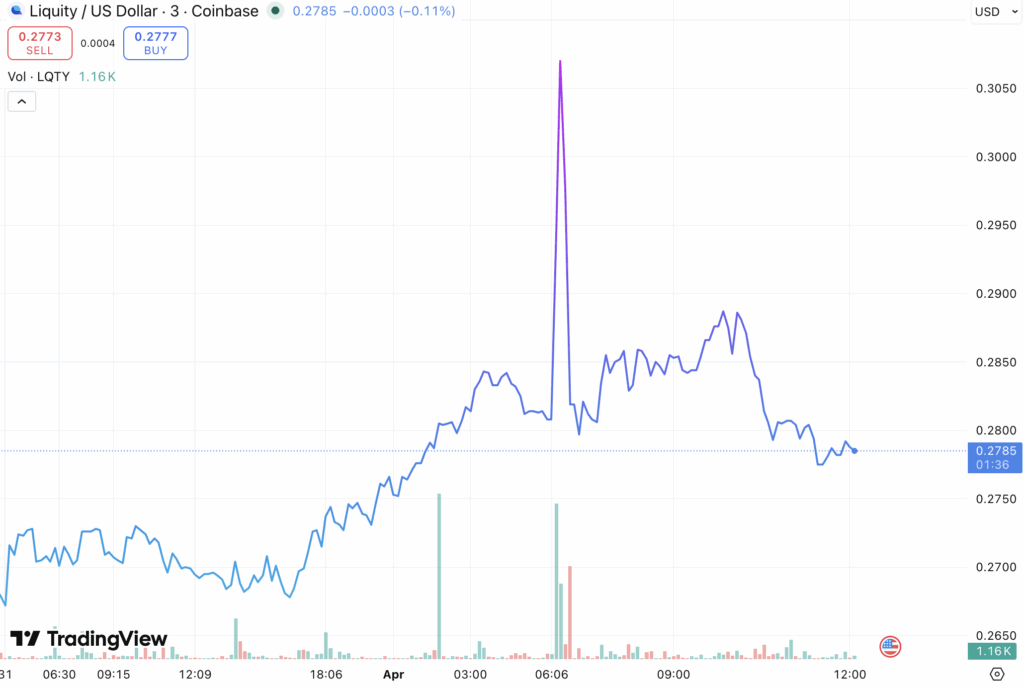
Despite the buyout announcement being a joke on Liquity’s part, it still boosted its $LQTY token by 5%.
The price, however, pulled back in just a few minutes, and is now down 6% from its April 1 peak.
Crypto users on X weren’t too impressed with the joke, describing it as an “April Fool’s pump and dump.”
Read more: WIF fundraiser says Vegas Sphere refunds will start on April Fools
Some said it was an ultra-thin line between a joke and “market manipulation,” while others described the day as an opportunity to “do crime and it’s totally legal!”
Others were more forgiving. DeFi researcher Ignas said that crypto users were losing their minds over a “mere” 5% pump.
They added, “Good taste joke, IMHO. And good project.”
Other users warned not to base your trading on headlines, as on a day like April Fools’, most of them are “facetious.”
Read more: ‘Bad actor’ Circle slammed for letting stolen $3M USDC sit unfrozen
In response to the April Fools’ post, Liquity made it clear that it was just a joke, while also promoting its own stablecoin BOLD.
Additionally, Circle clarified to Protos that the announcement was false, and said “Circle has not acquired Liquity.”
The theme of crypto April Fools’ is phony acquisitions
There were at least two more fake crypto acquisitions announcements today. Crypto wallet firm Frontrun Pro announced that it had been acquired by AI giant Anthropic as part of a $141 million deal.
Crypto copy trading account PolyGun also announced that it had been acquired by Anthropic, this time in a transaction worth $69 million.
Dogecoin also did its own corporate April Fools’ joke, announcing that it would restructure the firm into “DogeCoin Financial Solutions LLC™.”
Read more: Memescope traders have been left with a case of Monday blues
As part of this, it said it would drop its Shiba Inu logo for something navy blue, stop saying words like “wow,” “much,” and “very,” and rebrand its “Doge army” as “Stakeholders.”
Some users thought it would be funny to pretend that memecoin launcher Pump Fun is finally dropping an airdrop in the form of “Pump Fun rewards.”
The platform announced an airdrop would be coming “soon” 266 days ago.
Others joked that Bored Ape Yacht Club had replaced the images of all of its NFTs with photos of actual monkeys and chimps.
Read more: BAYC goes full ‘laser eyes’ and allegedly blinds ApeFest attendees
A bitcoiner called Didi Taihuttu claimed, while wearing his Bitcoin hat and strutting around a luxury villa, that he would be switching back to traditional banks after crypto had become too volatile.
All these examples demonstrate that trading headlines on a day like today is risky business, and that firms with financial assets to their names should be careful about just what kind of April Fools’ they run.
Got a tip? Send us an email securely via Protos Leaks. For more informed news and investigations, follow us on X, Bluesky, and Google News, or subscribe to our YouTube channel.


Artificial intelligence giant OpenAI has closed $122 billion in committed capital at an $852 billion post-money valuation, a round that dwarfs anything raised in private markets and cements the company as the most valuable startup in history by a wide margin.
The funding was anchored by Amazon, Nvidia, and SoftBank, with continued participation from Microsoft. SoftBank co-led alongside a16z, D.E. Shaw Ventures, MGX, TPG, and accounts advised by T. Rowe Price.
The investor list reads like a who’s who of global capital — BlackRock, Blackstone, Fidelity, Sequoia, Temasek, Coatue, and ARK Invest all participated.
For the first time, OpenAI opened participation to individual investors through bank channels, raising over $3 billion from that tranche alone.
OpenAI said it is generating $2 billion in revenue per month, up from $1 billion per quarter at the end of 2024. ChatGPT has more than 900 million weekly active users and over 50 million subscribers. The company claims 6x the monthly web visits and mobile sessions of the next largest AI app, and 4x the total time spent of all other AI apps combined.
Enterprise now makes up more than 40% of revenue and is on track to reach parity with consumer by end of 2026. The company’s APIs process more than 15 billion tokens per minute. Codex, its coding agent, serves over 2 million weekly users, up 5x in three months.
OpenAI also expanded its revolving credit facility to approximately $4.7 billion, supported by JPMorgan Chase, Citi, Goldman Sachs, Morgan Stanley, and others. That facility remains undrawn as of March 31.
The company framed the raise around compute as a strategic moat. Its infrastructure strategy now spans cloud partnerships with Microsoft, Oracle, AWS, CoreWeave, and Google Cloud, silicon through Nvidia, AMD, AWS Trainium, Cerebras, and its own custom chip with Broadcom, and data centers through Oracle, SBE, and SoftBank.
Meanwhile, the company said it is building a “unified AI superapp” that would combine ChatGPT, Codex, browsing, and agentic capabilities into a single product.
The pitch is that as models get more capable, the bottleneck shifts from intelligence to usability, and a single surface lets the company translate model improvements directly into adoption.
The $852 billion valuation places OpenAI above all but a handful of public companies globally. For context, that is roughly the market cap of Berkshire Hathaway, and larger than Visa, JPMorgan Chase, or Samsung.
Crypto World
Non-USD stablecoin senders on Solana nearly tripled year-over-year, led by EURC and BRZ: Dune


Solana’s non-USD stablecoin adoption surged nearly threefold in the past year, driven by EURC and BRZ growth alongside institutional integrations from Visa, Stripe, PayPal, Mastercard, and Western Union.


Key takeaways
- ZCash is one of the worst performers among the top 30 cryptocurrencies by market cap, down 3.5% in the last 24 hours.
- The coin could rally higher in the near term amid demand for privacy-focused cryptocurrencies.
ZEC slips as broader market recovers
ZEC, the native coin of the Zcash ecosystem, is down by 3.5% in the last 24 hours, making it one of the worst performers among the top 30 cryptocurrencies by market cap.
It is trading at $241 per coin, down from the $257 recorded on Tuesday. The bearish performance comes amid a decline in Zcash’s derivatives data.
According to CoinGlass, ZEC’s futures’ Open Interest (OI) reads $438 million, down from the $473 million recorded on Tuesday, reflecting the decreased notional value of open contracts.
Typically, an OI decline during a dip in spot price reaffirms the bearish narrative as traders anticipate further recovery.
Technical outlook: Will Zcash price recover above $250 soon?
The ZEC/USD 4-hour chart is bullish but inefficient as Zcash’s price faced rejection above the $250 psychological level.
It is currently trading below its 50-day EMA of $248c, suggesting that the bulls failed to take advantage of the recent rally.
Despite that, the near-term bias is cautiously bullish as ZEC holds above the recent lows, while remaining capped beneath the long-standing descending resistance line.
If the bulls regain control and ZEC’s daily candle closes above $250, it would confirm the upside breakout and open the path toward the 200-day EMA at $274, followed by the 23.6% Fibonacci retracement level at $362.
The Moving Average Convergence Divergence (MACD) line has turned higher above the signal line and moved back into positive territory on the 4-hour chart, suggesting strengthening upside pressure.

The Relative Strength Index (RSI) at 61 reinforces the recovery of bullish momentum without signaling overbought conditions.
On the downside, if the rejection candle holds, ZEC could drop towards the 38.2% Fibonacci retracement level at $231, followed by the rising trendline near the $200 psychological support level.


Bitcoin’s reputation has historically been built on extreme boom-and-bust cycles, with steep drawdowns of up to 90% following all-time highs.
This cycle, however, the decline has been closer to 50%, a shift that analysts said reflects the maturation of BTC as an asset class.
“Bitcoin’s drawdowns compressing to about 50% is a sign of a maturing market structure,” AdLunam co-founder and market analyst Jason Fernandes told CoinDesk.
“As liquidity deepens and institutional participation increases, volatility naturally compresses on both the upside and the downside,” he added, saying that “at that point, the narrative shifts from questioning its legitimacy to optimizing allocation.”
Fernandes’ comments are in response to Fidelity Digital Assets analyst Zack Wainwright’s X post Tuesday, in which he noted growth is becoming “less impulsive,” with a reduced probability of extreme downside events as bitcoin matures.
‘Less dramatic’
Wainwright pointed out that the current drawdown from the Oct. 6 all-time-high of just over $126,200 is much less significant than previous pullbacks.
“Each cycle has been less dramatic to the upside than the previous and downside risk has also been less dramatic,” he said.
Fernandes and Wainwright, of course, were referring to previous “bust” periods, most notably following the peaks of 2013 and 2017.
After reaching a high of approximately $1,163 in late 2013, bitcoin entered a prolonged “crypto winter” that saw its price plummet to around $152 by January 2015, representing a drawdown of roughly 87%. A similar pattern was seen after the 2017 bull run, when it reached $20,000 in December before plummeting roughly 84% to $3,122 over the following 12 months.
Not all analysts agree that deeper drawdowns are off the table.
Bloomberg Intelligence’s Mike McGlone told CoinDesk that he believes bitcoin could still see a “normal reversion” toward $10,000, arguing that “the crypto bubble is over” and that any downturn could coincide with broader declines across equities, commodities and other risk assets.
However, Fernandes, who has previously dissented with McGlone’s $10,000 forecast, said that scale itself is part of the story. As bitcoin grows into a larger asset class, the likelihood of 90% collapses diminishes simply because the capital required to drive such moves is too great. That effect is reinforced by institutional integration, from ETFs to pension exposure, which makes large-scale unwinds structurally harder.
Portfolio ‘efficiency’ enhancer
The shift is already showing up in portfolio construction.
“The portfolio data is really what shifts institutional behavior,” Fernandes said. “If a small 1% to 3% allocation can materially improve returns and Sharpe ratios without significantly increasing drawdowns, then bitcoin starts to function less like a standalone bet and more like an efficiency enhancer within a diversified portfolio.”
That framing changes the risk calculus. “The risk isn’t about owning bitcoin anymore,” Fernandes stated. “It’s the opportunity cost of having no exposure at all.”
Recent Fidelity research supports that transition. In a 10-year comparison across major asset classes, bitcoin delivered roughly 20,000% returns, significantly outperforming equities, gold, and bonds, while also leading on risk-adjusted measures despite its volatility.
“Bitcoin remains a relatively young asset, yet it has quickly matured into a major asset class and has been the top-performing asset in 11 out of the past 15 years,” the report noted.
At the same time, the tradeoff is becoming clearer.
“There’s a tradeoff here that’s worth articulating,” Fernandes said. “As bitcoin matures and volatility compresses, you should also expect returns to normalize. The asymmetric upside of the early cycles came with extreme drawdowns, but as those drawdowns shrink, the asset increasingly behaves like a macro allocation rather than a venture-style bet.”
That brings it back to the drawdowns.
If bitcoin is no longer falling 80%, and portfolios can benefit from small allocations without materially increasing risk, then the asset is evolving into something more investible and usable, Fernandes said, concluding that for institutions, that may be the real inflection point.
Crypto World
Fed Governor Miran still backs cuts, says interest rates could be ‘about a point’ lower this year

Federal Reserve Governor Stephen Miran on Monday continued his campaign for lower interest rates, telling CNBC that policymakers should disregard the current energy price spike unless there are signs it will have longer-lasting impacts.
“If I saw a wage-price spiral, or I saw evidence that inflation expectations are starting to pick up, then I would get worried about it,” he said during a “Squawk on the Street” interview. “There’s no evidence of it thus far, and you can move the monetary policy rate all you want — today tomorrow — but it’s not going to affect inflation the next couple of months.”
Citing market-based indicators, Miran said inflation expectations remain well anchored, despite the jump in oil to more than $100 a barrel and a price shock at the pump that has pushed gasoline higher by more than $1 a gallon.

Monetary policy works with a lag and isn’t geared toward short-term market gyrations, he added.
Miran has dissented at each of the meetings he has attended since September 2025. He told CNBC that he continues to think “we could be about a point easier, gradually done over the course of a year.”
The fed funds rate is currently targeted in a range between 3.5%-3.75%. Market pricing is implying no moves in either direction before the end of the year.
Miran’s term has expired, but he continues to serve as the nomination of former Federal Reserve Governor Kevin Warsh is held up in the Senate Banking Committee. If confirmed, Warsh will take over as chair for Jerome Powell when the latter’s term expires in May.
ITV star says ‘that’s me done’ and confirms lengthy break with ‘no show for a few weeks’

Oracle layoffs begin as Larry Ellison pushes $50bn AI data centre expansion

Aave V4 launches at EthCC with ‘hub-and-spoke’ design for RWAs and structured credit


-

 News Videos7 days ago
Parliament publishes latest register of MPs’ financial interests
-

 Business6 days ago
Instagram, YouTube Found Responsible for Teen’s Mental Health Struggle in Historic Ruling
-
 Tech6 days ago
Intercom’s new post-trained Fin Apex 1.0 beats GPT-5.4 and Claude Sonnet 4.6 at customer service resolutions
-

 NewsBeat5 days ago
The Story hosts event on Durham’s historic registers
-

 Sports5 days ago
Sweet Sixteen Game Thread: Tide vs Michigan
-
Entertainment2 days ago
Fans slam 'heartbreaking' Barbie Dream Fest convention debacle with 'cardboard cutout' experience
-
 Entertainment4 days ago
Lana Del Rey Celebrates Her Husband’s 51st Birthday In New Post
-
Crypto World1 day ago
Dems press CFTC, ethics board on prediction-market insider trades
-

 Sports23 hours ago
Tallest college basketball player ever, standing at 7-foot-9, entering transfer portal
-

 Tech3 days ago
The Pixel 10a doesn’t have a camera bump, and it’s great
-
 Fashion7 days ago
How to Style Spring Like WeWoreWhat: Easy Outfit Ideas for 2026
-

 Entertainment7 days ago
HBO’s Harry Potter Series Will Definitely Fail For One Big Reason, And It’s Not J.K. Rowling Or Snape
-

 Crypto World2 days ago
U.S. rule change may open trillions in 401(k) funds to crypto
-

 Fashion6 days ago
En Vogue in Brown Leather and Tailored Neutrals by Atelier Savoir, Styled by J Bolin
-

 Tech1 day ago
How to back up your iPhone & iPad to your Mac before something goes wrong
-

 Fashion6 days ago
What Are Your Favorite T-Shirts for the Weekend?
-

 Fashion5 days ago
Weekly News Update, 3.27.26 – Corporette.com
-

 Politics2 days ago
Should Trump Be Scared Strait?
-

 Tech3 days ago
Elon Musk’s last co-founder reportedly leaves xAI
-

 Sports2 days ago
Women’s hockey camp eyes fitness boost, tactics ahead of WC 2026 campaign | Other Sports News
You must be logged in to post a comment Login