
Crypto World
Why the $60K-$62K Zone Is Make or Break
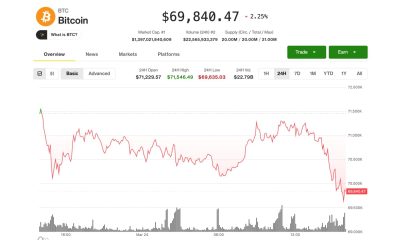
Bitcoin has entered a highly sensitive phase after an aggressive downside continuation. The recent sell-off has pushed it into a historically reactive demand region of $60K, while broader risk sentiment remains fragile. The market is approaching a juncture where technical structure, higher-timeframe demand, and on-chain liquidity dynamics converge, making the coming sessions critical for short- to mid-term direction.
Bitcoin Price Analysis: The Daily Chart
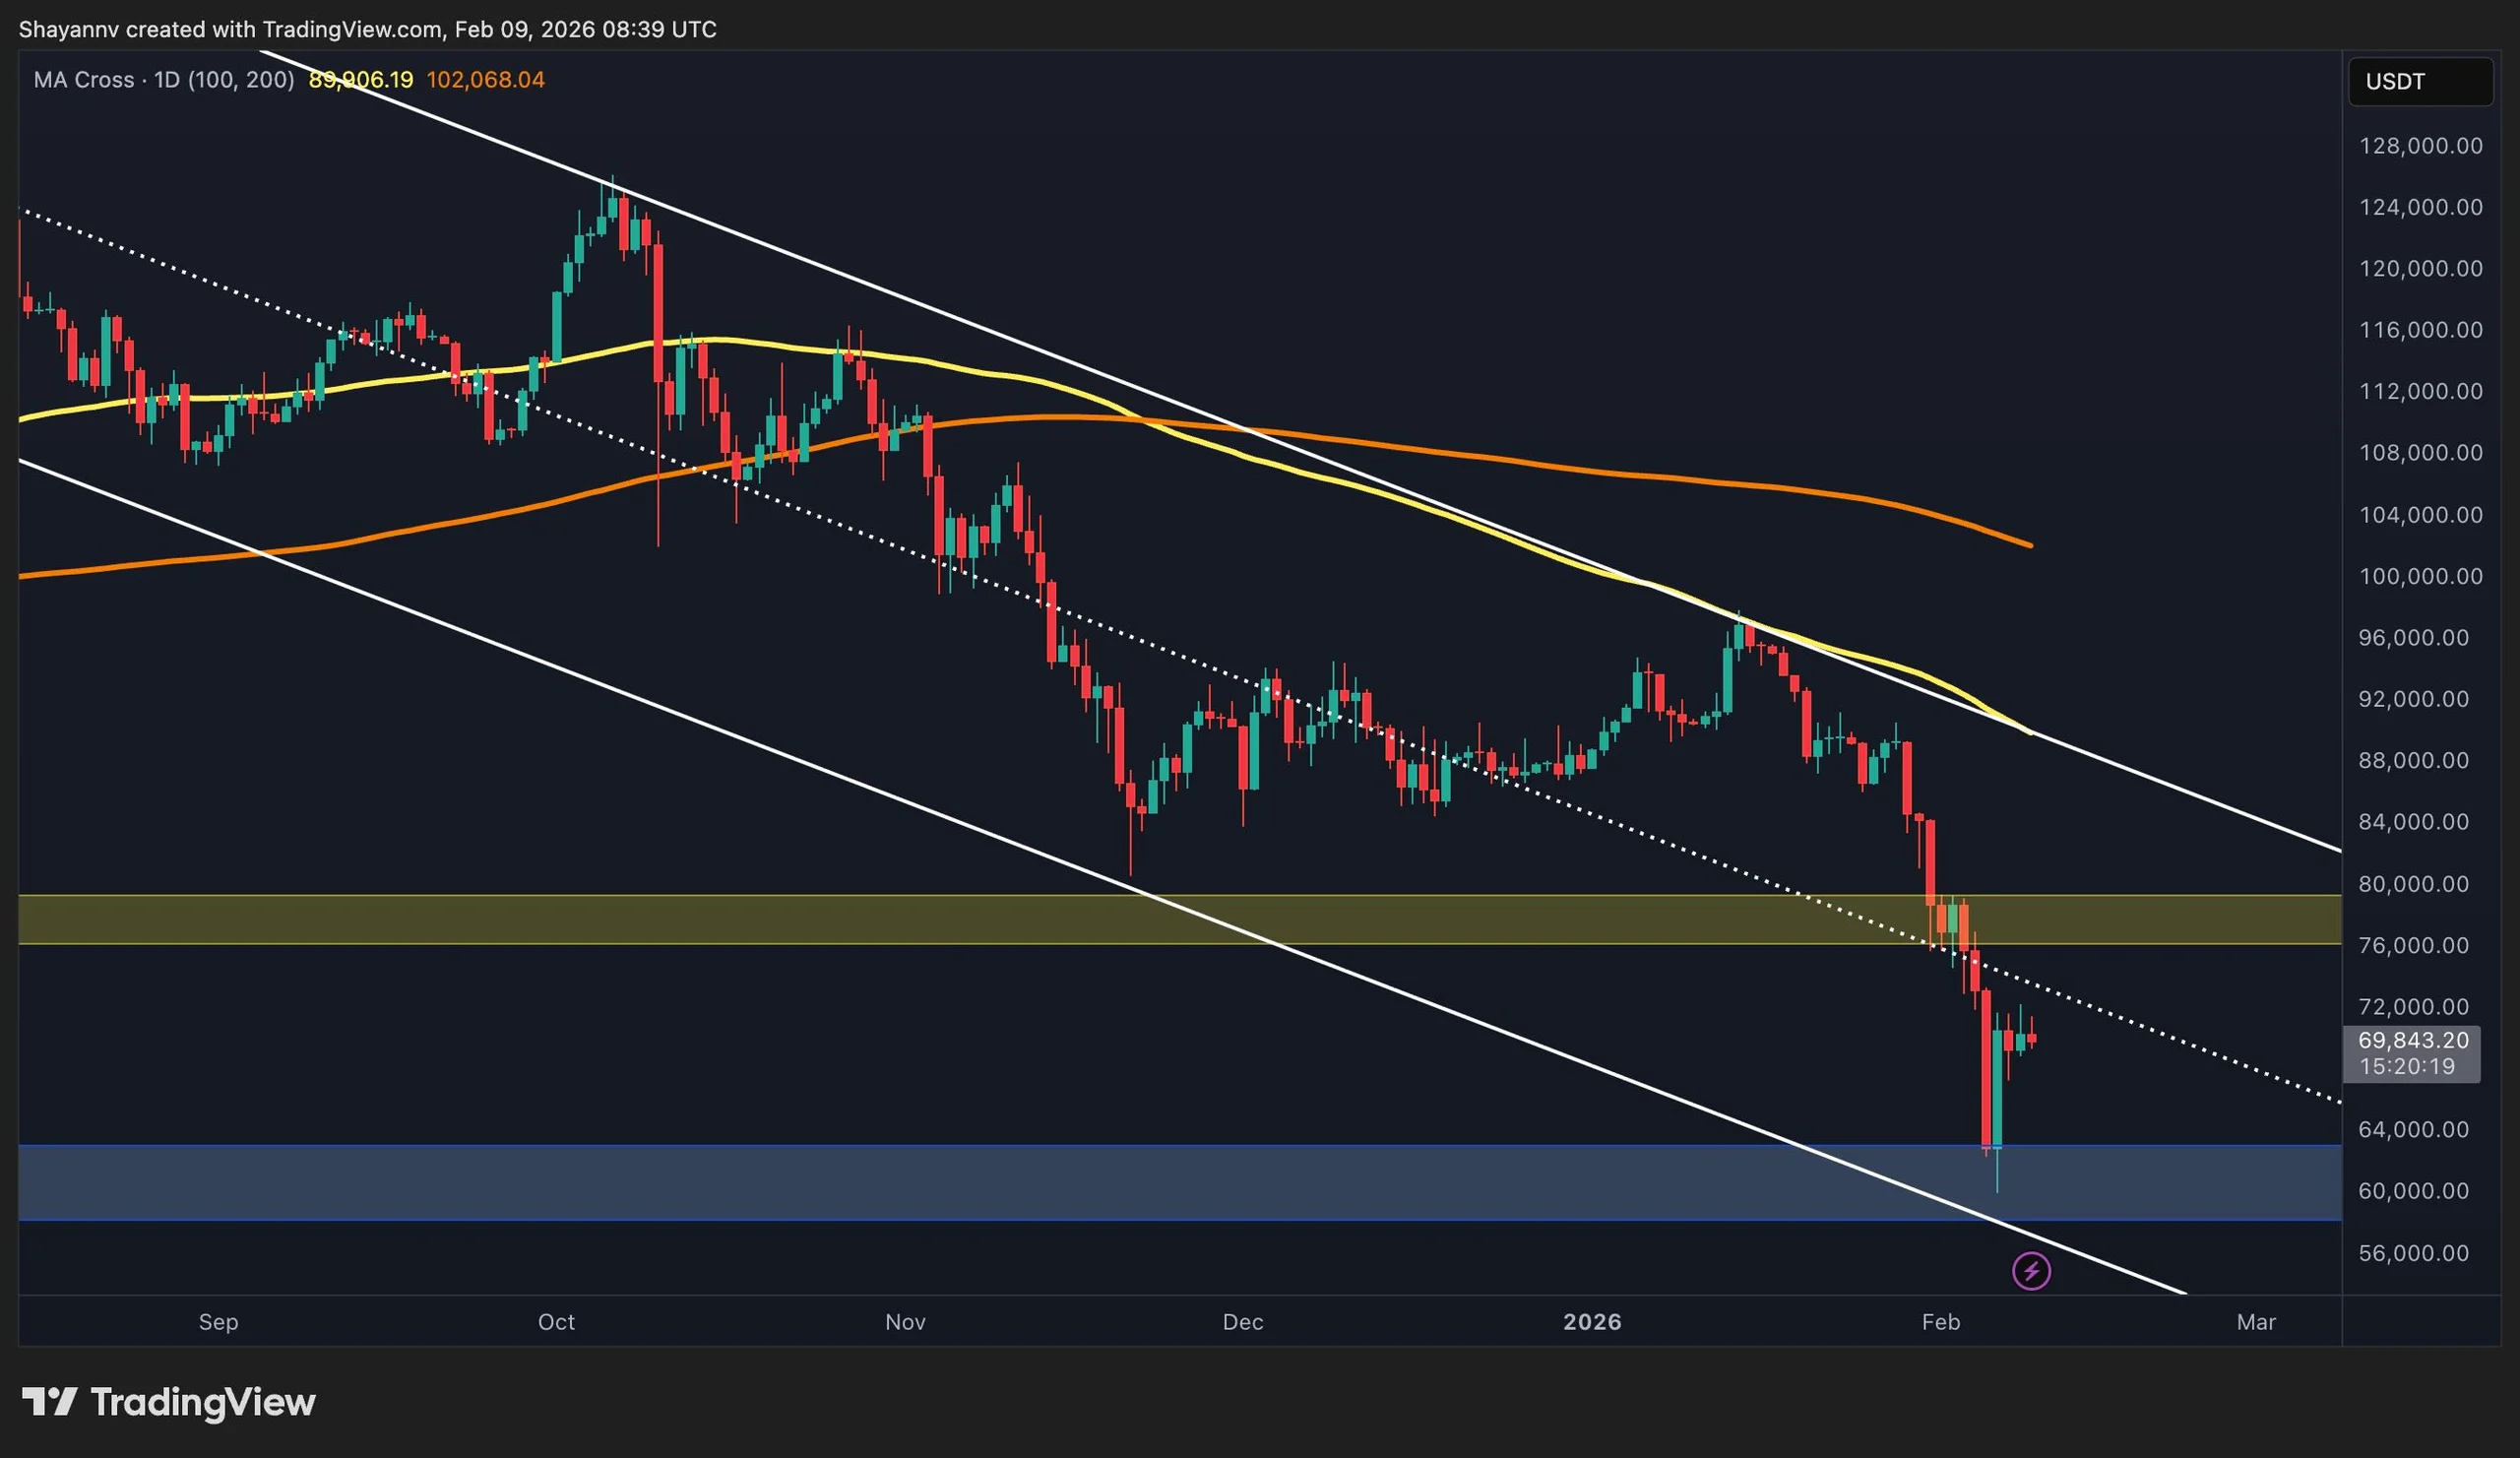
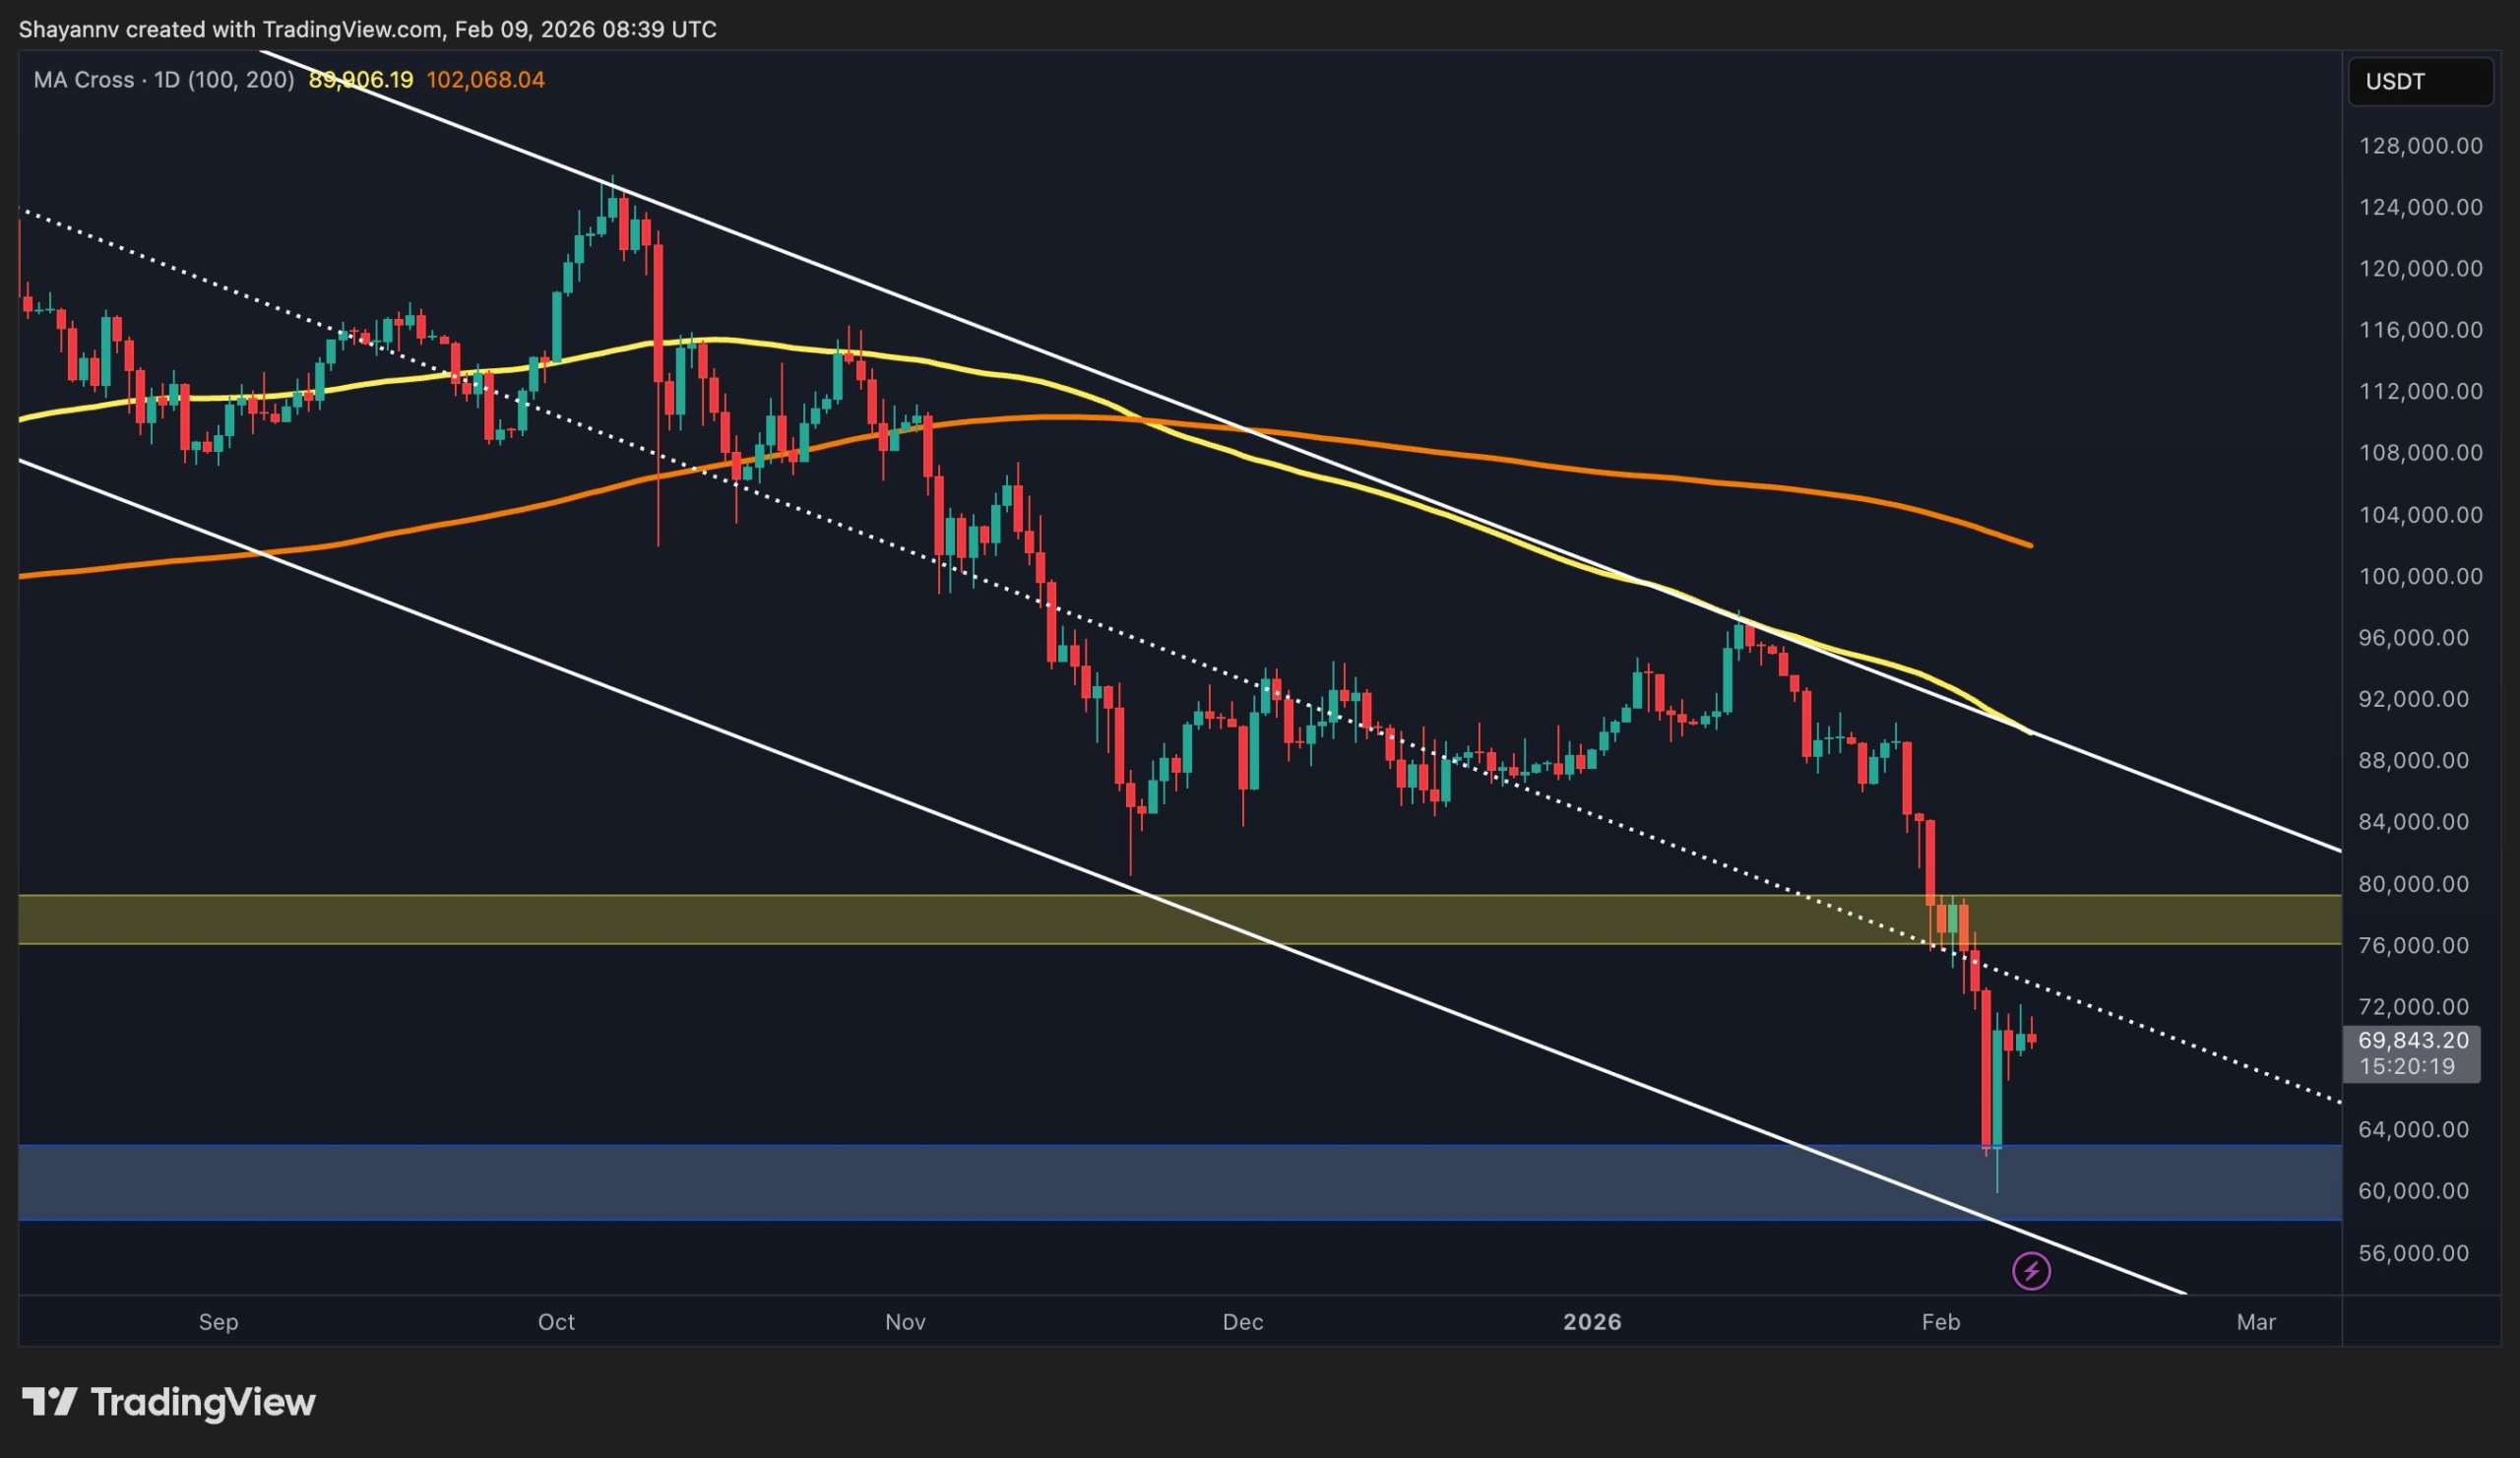
On the daily timeframe, Bitcoin remains structurally bearish, as the price has been printing major lower highs and has reached the channel’s lower boundary. The recent sell-off also resulted in a clear breach of the prior major daily low around $75K, confirming a breakdown in market structure and triggering forced liquidation flows.
However, once the asset reached the $60K–$62K demand zone, selling pressure decelerated sharply. This area has historically acted as a high-interest accumulation region, and the latest reaction reinforces its relevance. Since tapping this zone, Bitcoin has managed to recover toward the $69K–$70K region, but the rebound has lacked momentum and follow-through.
The daily chart now reflects balance rather than trend. Sellers are no longer pressing prices lower aggressively, yet buyers are also unable to reclaim the former support at $75K–$77K, which has now transitioned into a clear supply zone. As long as Bitcoin remains capped below that area, the broader daily bias stays cautious, with consolidation favored over continuation.
BTC/USDT 4-Hour Chart
Zooming into the 4-hour timeframe, it is evident that the price has rebounded from the $60K threshold, and is now oscillating around $69K–$70K. The character of price action has shifted from impulsive candles to overlapping ranges, signaling exhaustion on the sell side.
The channel’s mid trendline is considered the main supply range near the $73K area, while the internal resistance around the $70K consistently rejects upside attempts. On the downside, demand remains clearly defined between $60K and $62K, where buyers previously stepped in with conviction.
This creates a compressed environment where Bitcoin is effectively boxed between a rising demand floor and a descending resistance ceiling. Until price either loses the $60K–$62K support or reclaims $75K with strength, the most probable outcome remains range-bound price action rather than a directional move.

Sentiment Analysis
Bitcoin has now reached the realized price of the 18-month to 2-year holder cohort, placing this group in a breakeven state. This level, located around the $60K range, is particularly important because it often acts as a behavioral inflection point, where holders are more likely to either defend their cost basis or exit positions if confidence weakens.
From an on-chain perspective, this realized price currently functions as a key support zone. If buying pressure absorbs supply at this level, the market is likely to stabilize and transition into a consolidation phase. However, failure to hold this area could trigger additional sell pressure as this cohort moves into a loss.
On the upside, the realized price of the 12-month to 18-month cohort around $85K-$90K now represents a clear resistance, as these holders are underwater and may sell into any relief rally. Overall, Bitcoin is trading at a critical equilibrium zone where consolidation is favored unless a decisive break occurs in either direction.

SECRET PARTNERSHIP BONUS for CryptoPotato readers: Use this link to register and unlock $1,500 in exclusive BingX Exchange rewards (limited time offer).
Disclaimer: Information found on CryptoPotato is those of writers quoted. It does not represent the opinions of CryptoPotato on whether to buy, sell, or hold any investments. You are advised to conduct your own research before making any investment decisions. Use provided information at your own risk. See Disclaimer for more information.


The U.S. Department of Labor has proposed a rule that would make it easier for 401(k) plans to include alternative assets such as cryptocurrencies, private equity and real estate.
The proposal is in response to President Donald Trump’s executive order, released in August, which directed the Labor Department and the Securities and Exchange Commission to facilitate expanded access to alternative assets in 401(k)s.
“This proposed rule will show how plans can consider products that better reflect the investment landscape as it exists today,” Labor Secretary Lori Chavez-DeRemer said in a statement.
If adopted, the rule would mark a shift in how retirement plans are built. For years, most 401(k)s have focused on stocks and bonds. The new approach would allow plan providers to add a broader mix of assets, including digital tokens and private-market funds that are not traded on public exchanges.
The move builds on earlier changes. Last May, the Labor Department rescinded prior guidance that urged fiduciaries to exercise “extreme care” before adding crypto to retirement plans. Trump’s executive order went further, calling for digital assets to be treated on par with other investment options.
Still, the proposal has drawn criticism from some lawmakers and financial advisors.
“As cracks emerge in the private credit market, private equity returns fall to 16-year lows, and crypto keeps tumbling, President Trump has decided now is the time to stick all of these risky assets into Americans’ 401(k)s,” Senator Elizabeth Warren said in a statement. She warned the rule could expose workers to losses while benefiting large financial firms.
The stakes for crypto could be large. U.S. 401(k) plans hold trillions of dollars in retirement savings, and even a small shift into digital assets could send new capital into the market. If a large plan with tens of thousands of workers were to allocate just 1% of its portfolio to bitcoin, that would translate into millions of dollars flowing into crypto funds or tokens.
Key points:
-
Bitcoin’s recovery is expected to face selling near $69,000, but if the bulls prevail, a rally to $74,508 is possible.
-
Most major altcoins remain below their resistance levels, indicating that the bears continue to exert pressure.
Bitcoin (BTC) rose above $68,000, but the bulls are struggling to sustain the higher levels. Sellers are expected to exert pressure to achieve a negative monthly close in March. That will result in six consecutive months of losses for the first time since the 2018 bear market.
Analysts remain increasingly bearish on BTC’s prospects in the short term. Analyst Willy Woo said in a post on X that BTC may bottom between $46,000 and $54,000 according to various on-chain models.

The deeper the fall from the all-time high, the longer it is likely for BTC to take to record a new all-time high. According to an Ecoinometrics’ model, if BTC holds the $60,000 low, a full recovery is expected to happen in roughly 300 days from the October 2025 peak of $126,000. About 175 days have passed since BTC’s all-time high, leaving around 125 days for the full recovery to happen. If BTC falls to the $40,000 to $45,000 range, the recovery may stretch further into Q2 2027, as every 10% drawdown adds 80 days to the recovery duration.
Will buyers be able overcome the resistance levels in BTC and the major altcoins? Let’s analyze the charts of the top 10 cryptocurrencies to find out.
S&P 500 Index price prediction
The S&P 500 Index (SPX) turned down from the 20-day exponential moving average (6,620) on Wednesday, indicating that bears remain in command.

Sellers will attempt to sink the price to the 6,147 level, which is likely to attract solid buying by the bulls. A bounce off the 6,147 level may face selling at the 20-day EMA. If the price turns down sharply from the 20-day EMA, the bears will again attempt to sink the index below the 6,147 level. If they succeed, the next stop may be the 5,943 level.
On the other hand, a break and close above the 20-day EMA suggests that the bears are losing their grip. The index may then rally to the 50-day simple moving average (6,803).
US Dollar Index price prediction
The US Dollar Index (DXY) bounced off the 20-day EMA (99.40) on Wednesday, signaling a positive sentiment.

Buyers will attempt to strengthen their position by maintaining the price above the 100.54 overhead resistance. If they manage to do that, the index may start a new up move to the 102 level and later to the 103.54 level.
Time is running out for the bears. They will have to defend the 100.54 level and swiftly pull the price below the 20-day EMA to weaken the bullish momentum. The price may then slump to the 50-day SMA (98.25).
Bitcoin price prediction
BTC closed below the support line of the ascending triangle pattern on Sunday, but the bears could not sustain the lower levels.

The bulls have pushed the BTC price back above the support line and are attempting to pierce the moving averages. If they succeed, it suggests that the break below the support line may have been a bear trap. The BTC/USDT pair may rally to the $74,508 to $76,000 resistance zone.
To retain the advantage, sellers will have to successfully defend the moving averages and swiftly pull the price below the $65,000 level. That clears the path for a drop to the $62,500 to $60,000 support zone.
Ether price prediction
Ether (ETH) closed below the 50-day SMA ($2,040) on Friday, but the bears could not sink the price below the $1,916 support.

The bulls are attempting to push the ETH price above the moving averages and get back into the game. If they can pull it off, the possibility of a rally to $2,400 increases. Sellers will attempt to halt the up move at $2,400, but if the buyers bulldoze their way through, the next stop may be $2,600.
This positive view will be negated in the near term if the ETH/USDT pair turns down and breaks below the $1,916 level. That opens the doors for a drop to the $1,750 support.
BNB price prediction
BNB (BNB) has been trading below the moving averages, but the bears could not pull the price to the $570 support.

The bulls are attempting to start a recovery, which is expected to face resistance at the moving averages. If the BNB price turns down from the moving averages, the risk of a drop to $570 increases.
Contrarily, a close above the moving averages suggests that the BNB/USDT pair may remain inside the $570 to $687 range for some more time. Buyers will be back in the driver’s seat on a close above the $687 resistance.
XRP price prediction
XRP (XRP) remains below the moving averages, indicating that the bears continue to exert pressure.

The gradually downsloping moving averages and the RSI in the negative territory indicate that the bears have the upper hand. Buyers will attempt to defend the $1.27 level, but if the support cracks, the XRP/USDT pair may descend to $1.11.
Contrary to this assumption, if the XRP price turns up sharply and breaks above the moving averages, it suggests that selling dries up at lower levels. The pair may then march toward the $1.61 level.
Solana price prediction
Solana (SOL) remains stuck inside the $76 to $95 range, indicating a balance between supply and demand.

The flattish moving averages and the RSI just below the midpoint do not give a clear edge either to the bulls or the bears. Buyers will have to shove the SOL price above the $95 resistance to start a rally to the $117 level.
On the contrary, a break and close below the $76 level tilts the advantage in favor of the bears. The SOL/USDT pair may then retest the Feb. 6 low of $67.
Related: Bitcoin analysis says $65K ‘entry zone’ with oil back above $100
Dogecoin price prediction
Buyers have managed to maintain Dogecoin (DOGE) above the $0.09 support but are struggling to start a strong rebound.

That suggests the bears are selling on every minor relief rally to the moving averages. If the DOGE price again turns down from the moving averages, it increases the risk of a break below the $0.09 support. The DOGE/USDT pair may then plunge to the $0.08 level.
Instead, if the price continues higher and breaks above the moving averages, it signals that the bulls remain buyers near the $0.09 level. The pair may then rally to $0.11 and subsequently to $0.12.
Cardano price prediction
Cardano (ADA) closed below the $0.25 support on Friday, indicating that the bears are in control.

Buyers are trying to push the ADA price back above the $0.25 level, but the bears have held their ground. That suggests the sellers are attempting to flip the $0.25 level into resistance. If they manage to do that, the ADA/USDT pair may plummet to the Feb. 6 low of $0.22.
The bulls will have to swiftly thrust the price above the moving averages to trap the aggressive bears. That may drive the pair to the downtrend line. Sellers are expected to vigorously defend the downtrend line, as a close above it signals a potential short-term trend change.
Hyperliquid price prediction
Buyers are attempting to sustain the Hyperliquid (HYPE) price above the 20-day EMA ($37.86), but the recovery lacks strength.

If the HYPE price dips below the 20-day EMA and the $36.77 level, it suggests that the bulls have given up. That may pull the HYPE/USDT pair to the 50-day SMA ($33.73), which is likely to act as strong support.
Alternatively, if the price turns up from the current level, it is expected to face resistance at $41.59 and then at $44. Buyers will have to scale the $44 level to signal the resumption of the up move toward $50.
This article does not contain investment advice or recommendations. Every investment and trading move involves risk, and readers should conduct their own research when making a decision. While we strive to provide accurate and timely information, Cointelegraph does not guarantee the accuracy, completeness, or reliability of any information in this article. This article may contain forward-looking statements that are subject to risks and uncertainties. Cointelegraph will not be liable for any loss or damage arising from your reliance on this information.
Square, the payments platform of Block, has begun rolling out Bitcoin payments at its point-of-sale terminals for eligible US sellers, with the automatic feature going live today as part of a phased rollout over the coming month.
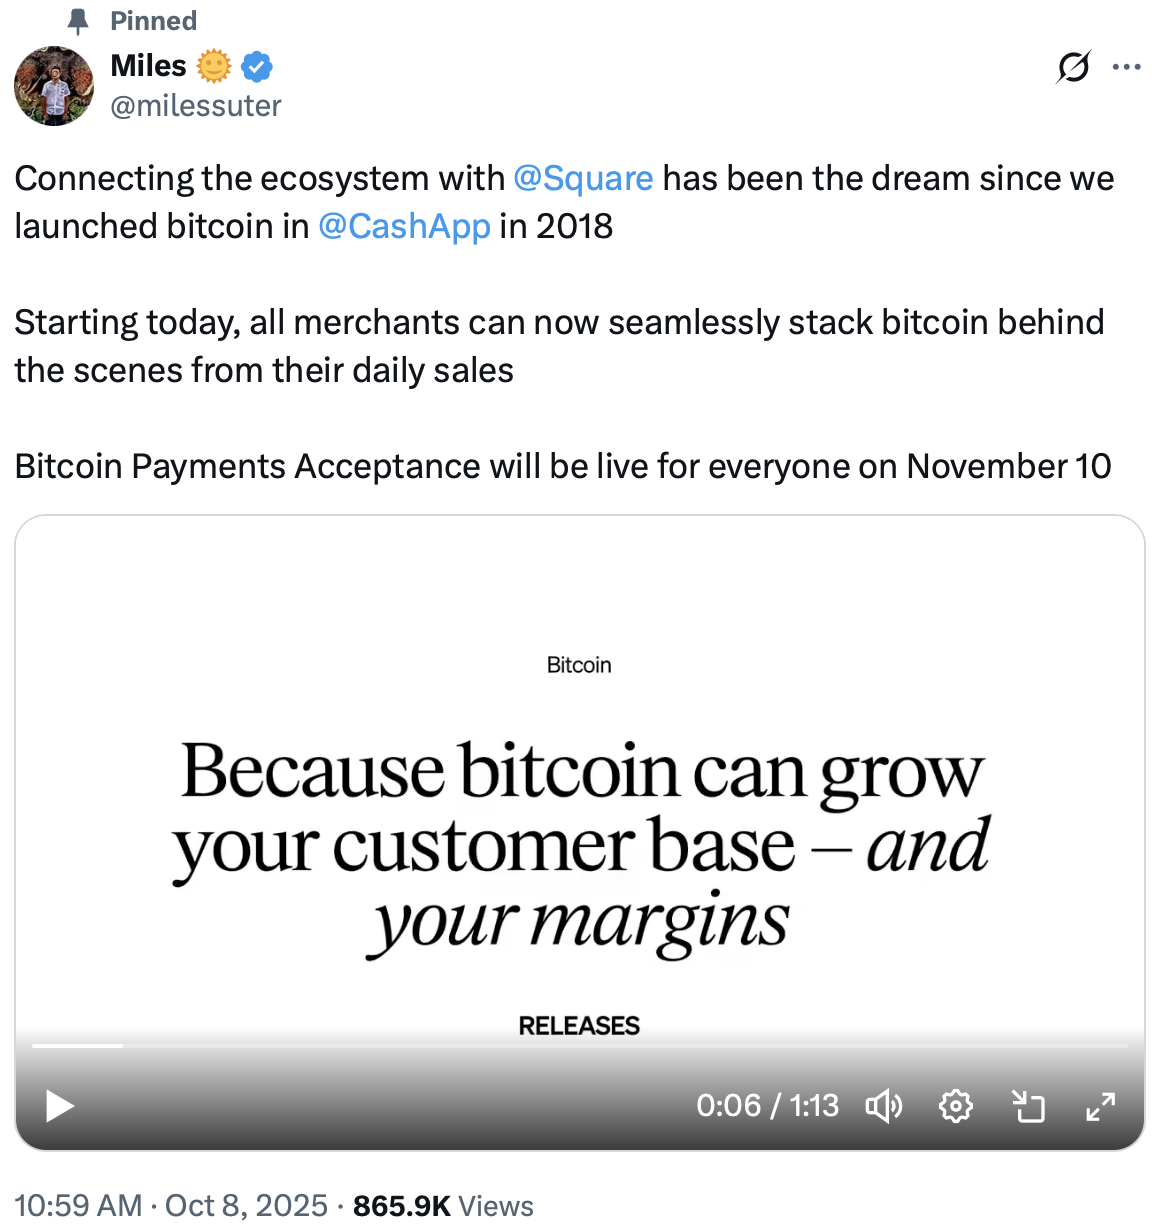
The announcement was shared Monday in a post on X by Miles Suter, Bitcoin product lead at Block, and reposted by CEO and longtime Bitcoiner Jack Dorsey.
Suter said the feature is designed to make it easier for “millions of businesses” to accept Bitcoin, adding that eligible US sellers will have payments automatically enabled and will receive US dollars by default when customers pay in Bitcoin (BTC). Merchants will also have the option to automatically “stack” Bitcoin from daily sales.
He described the move as a step toward using “Bitcoin as everyday money.” Bitcoin payment acceptance is expected to be available to all Square merchants by Nov. 10.

In a separate post, Square said transactions will convert instantly to cash at checkout, require no additional setup, and offer near-instant settlement. The company added that merchants do not need to hold Bitcoin and that the feature will carry zero processing fees through 2026.
According to Square’s website, the feature is currently available to US sellers that meet verification requirements, excluding businesses based in New York.
The rollout, which could lower barriers to Bitcoin payments by removing volatility and custody risk for millions of merchants, was first outlined by Block in May.
According to BitcoinTreasuries.net data, Block ranks as the 14th-largest publicly traded holder of Bitcoin, with 8,883 BTC on its balance sheet at an average cost of $32,939 per coin.

Related: Strategy pushes pause button on Bitcoin purchases, stock sales
Bitcoin-backed lending grows across crypto and traditional finance
Beyond payments and its role as a store of value, Bitcoin is increasingly being used in lending and broader financial infrastructure.
In January, Nexo launched a zero-interest lending product allowing Bitcoin and Ether (ETH) holders to borrow against their assets through fixed-term loans with predefined repayment conditions.
The offering builds on a structured model previously limited to its private and OTC channels, which facilitated more than $140 million in borrowing in 2025, according to the company.
The same month, Coinbase reintroduced Bitcoin-backed loans in the United States, enabling users to borrow up to $100,000 in USDC against BTC held on the platform, and in February, Kraken followed with fixed-rate crypto loans for Pro users, offering borrowing against digital assets at rates of 10%–25% APR for terms of up to two years.
https://www.youtube.com/watch?v=KlFRKMMpdmk
Traditional finance is also beginning to incorporate Bitcoin and crypto-backed credit. US mortgage lender Rate recently launched a program allowing borrowers to use verified cryptocurrency holdings to meet mortgage underwriting requirements without liquidating their assets.
Last week, Coinbase and Better Home & Finance introduced a structure that lets borrowers pledge crypto as collateral for loans used to fund down payments on Fannie Mae–compliant mortgages.
Magazine: Nobody knows if quantum secure cryptography will even work
Crypto World
Zcash’s (ZEC) upside hinges on a repricing of financial privacy in an AI-driven world, Grayscale says

Zcash (ZEC) is a wager that the rise of AI surveillance will make financial privacy more valuable, and the crypto market is underpricing that possibility, according to asset manager Grayscale.
“Zcash is nearly 10 years old but may be entering a new chapter. Use of its shielding technology is increasing, and new capital is entering the ecosystem to support wallet development and Zcash mining,” analyst Michael Zhao wrote in a Friday report.
ZEC is a privacy-focused cryptocurrency that uses zero-knowledge proofs to hide transaction details, allowing users to shield the sender, receiver and amount, while still verifying transfers on a public blockchain.
Designed as a more confidential alternative to bitcoin , the largest cryptocurrency, it aims to function as a closer approximation to digital cash in an otherwise transparent crypto ecosystem.
The token has seen multiple boom-and-bust cycles, most notably during crypto bull markets when its privacy narrative gained traction. In late 2025, ZEC surged to nearly $700, sharply outperforming much of the market as investors switched into smaller-cap assets with differentiated use cases.
The move proved short-lived. Prices retraced quickly, falling more than 60% in the following months as momentum faded and larger assets like bitcoin regained favor. The volatility underscores a recurring pattern for Zcash: sharp upside during narrative-driven rallies, followed by steep drawdowns when that narrative loses urgency.
ZEC makes up about 0.3% of the $1.6 trillion crypto “currencies” segment, according to Grayscale, a share it said reflects expectations that privacy stays marginal. If that view changes, even slightly, the upside could be significant.
Grayscale pointed to rising use of Zcash’s shielded transactions, now the majority of activity, as evidence that demand for privacy already exists onchain. But the firm said the market still treats privacy as an afterthought rather than a core monetary feature.
This is part of a broader structural shift. Just as digitization and the internet reshaped financial privacy debates in prior decades, Zhao argued AI and blockchain transparency could trigger a third wave, one where confidential transactions become more valuable.
In that scenario, Zcash’s design positions it as a direct analogue to cash, a property the analyst said is increasingly scarce in digital finance.
Still, there are risks, the report cautioned. Regulatory treatment remains uncertain despite Zcash’s selective disclosure tools. Execution risk persists given the network’s reliance on complex upgrades, and long-term concerns like quantum computing that apply across crypto, including ZEC, the report added.
ZEC was trading 5% higher over 24 hours, around $224.80, at publication time.
Read more: AI rout hits software stocks, but Grayscale says blockchains stand to benefit
Geopolitics and energy constraints shaped Bitcoin’s landscape in March as a notable drop in hashrate coincided with a geopolitical flare-up tied to Iran. Analysts estimated Iran accounts for a meaningful slice of global mining activity, with some figures placing it around 6–8% of hashrate, while military-linked operations reportedly account for a large portion of mining. Following a late-February cross-border operation involving the United States and Israel, the network’s total hashrate slid about 6% over the month, underscoring how disruptions to energy infrastructure and competing strategic priorities can ripple into crypto production.
Against this backdrop, Bitcoin’s price movement remained muted. Bitcoin traded near the $67,000 level as five-year U.S. Treasury yields rose roughly 4% in March, sharpening a risk-off mood and encouraging cash preservation among traders. In parallel, the ecosystem’s appetite for crypto-native forecasting marketplaces surged, with March transactions on prediction platforms hitting a record pace of about 192 million—an uptick of 24% from February and a staggering 2,880% year over year, highlighting a growing, crypto-adjacent activity thread even as regulatory headwinds persist.
Beyond price and hashrate, drivers of liquidity shifted toward euro-denominated stablecoins. A March report found that euro-backed stablecoins now account for about 85% of non-dollar stablecoin transfer volume, with participation by users also concentrated in euros (roughly 78%). The shift is widely interpreted as institutional comfort with euro-pegged coins growing under the Markets in Crypto-Assets framework, which has elevated regulatory clarity for euro-focused crypto liquidity.
On the corporate side of the crypto economy, Robinhood’s stock price weakened in March, sliding about 16% as uncertainty around new regulatory regimes and softer crypto trading revenues weighed on sentiment. The company’s crypto business has faced headwinds in recent quarters, with reports indicating a notable year-over-year decline in crypto-related revenue and app volumes. In response, Robinhood announced a $1.5 billion stock buyback program to be executed over the next three years, a move aimed at bolstering investor confidence amid a broader market pullback.
Within the alt-crypto strategies space, Strategy reported an 11% drawdown on its Bitcoin holdings for March, with an average entry cost near $75,669 and Bitcoin trading around $67,800 at the time of writing. Yet the firm pressed on with purchases, revealing two substantial Beaufort-style adds in March—about 17,994 BTC on March 9 and 22,337 BTC on March 16, totaling roughly $2.7 billion at the relevant prices. Financing these acquisitions, Strategy has leaned on high-yield stock issuances such as Stretch (STRC) to avoid diluting its primary common shares. Chairman Michael Saylor has highlighted that retail investors make up a large share of STRC buyers, framing the instruments as a way to access high-yield digital credit with relatively low volatility.
Key takeaways
- Bitcoin’s hashrate declined about 6% in March, reflecting Iran’s pivotal yet strained role as a mining hub amid energy and security pressures following the February operation against Iran.
- The BTC price hovered near $67,000 as five-year U.S. Treasury yields rose around 4% for the month, contributing to a cautious risk posture among traders.
- Prediction markets posted a record March, with roughly 192 million transactions—up 24% from February and about 2,880% year over year—indicating rising interest in crypto-native forecasting tools.
- Euro-stablecoins now dominate non-dollar liquidity, accounting for about 85% of non-dollar stablecoin transfer volume, with strong user participation, aided by MiCA-aligned regulatory clarity.
- Robinhood’s stock weakness continued into March amid crypto-revenue headwinds, even as the firm advanced a sizable buyback. Strategy’s ongoing BTC accumulation remained sizable but came with an 11% month-long drawdown on holdings.
Hashrate, geopolitics, and the mining cliff
March’s mining dynamics underscored how geopolitical shocks can directly influence the security and economics of Bitcoin’s network. The U.S.–Israel operation in Iran, dubbed by some observers as a pivotal event for regional stability, coincided with a sustained drag on Iran’s mining capacity. Bloomberg’s crypto and digital assets coverage has highlighted Iran as a major mining contributor—estimated at roughly 6–8% of global hashrate—with a large portion of mining activity tied to state or military entities. When energy infrastructure is strained or redirected toward defense, the country’s ability to sustain large-scale Bitcoin mining tightens, creating ripples across the global hashrate figure and potentially affecting network difficulty and block times in the near term.
As miners contend with energy constraints and shifting priorities, the broader mining landscape remains sensitive to policy and geopolitical developments. The global network’s resilience, measured by hashrate, continues to reflect a balance between mining economics, energy costs, and regulatory conditions across jurisdictions. While the immediate impact is a modest hashrate pull for March, it is a reminder of how external forces ultimately shape Bitcoin’s security fabric and the distribution of mining power around the world.
Macro currents, markets, and the march of crypto demand
Bitcoin’s price path in March did not showcase a strong breakout even as macro conditions shifted. The yield curve’s repricing—five-year Treasuries climbing toward a 4% monthly gain—fed a preference for cash or less risky yield assets, weighing on new capital inflows into high-volatility assets like BTC. The combination of macro pressure, a cautious risk stance, and a sense of regulatory caution contributed to a lack of sustained upside for Bitcoin during the month. Yet, the same environment also drew attention to non-price-driven activity, such as prediction markets, where participants speculate on outcomes across events and often use these markets as hedges against broader macro risk. The March surge in such activity indicates a growing appetite for crypto-native financial primitives beyond spot and futures trading.
Stablecoins, MiCA, and strategic balance sheets
The euro-dominated stablecoin footprint—now representing about 85% of non-dollar stablecoin volume and a dominant share of participant activity—reflects a notable shift in liquidity preferences. The trend is closely tied to regulatory clarity introduced by the European Union’s Markets in Crypto-Assets framework, which has elevated institutional comfort with euro-pegged tokens and cross-border use cases. Market participants point to MiCA as a catalyst for more predictable, compliant stablecoin operations, encouraging institutions to integrate euro-denominated liquidity into their crypto rails while reducing some of the regulatory ambiguities that previously constrained non-dollar activity.
On the corporate side, Robinhood’s ongoing struggle with crypto trading revenue underscores the challenge of sustaining a diversified platform in a regulatory-tightening environment. The firm’s decision to deploy a $1.5 billion buyback program signals an attempt to shore up equity value despite a softening revenue trajectory. Meanwhile, Strategy’s Bitcoin program continues to reflect a high-stakes approach to crypto accumulation, funded through high-yield instruments that offer an alternate route to expand BTC holdings without diluting existing equity. The company’s commentary on STRC buyers—where a large portion are retail investors—frames a broader narrative about retail participation in crypto-linked structures and the perceived advantages of branded digital credit offerings in volatile markets.
What to watch next is how MiCA’s rollout further shapes non-dollar liquidity and whether tail risks—ranging from geopolitical shifts to regulatory changes—alter the trajectory of euro-stablecoins and related market activity. Additionally, with prediction markets facing ongoing regulatory scrutiny at the state and federal levels, observers will be watching for any concrete moves that could curb or clarify their role in the broader financial ecosystem.
Markets continue to react to a blend of macro signals, geopolitical developments, and evolving regulatory regimes. The coming weeks will be telling for Bitcoin’s leadership in a climate where liquidity, risk appetite, and institutional confidence are being recalibrated in near real time.
Readers should stay tuned for updates on Iran’s energy and mining dynamics, the pace of MiCA implementation and its practical impact on euro-denominated liquidity, and the evolving regulatory stance on prediction markets in U.S. states. These factors will help determine whether the current risk-off tone persists or shifts toward renewed crypto demand driven by macro reorientation and regulatory clarity.

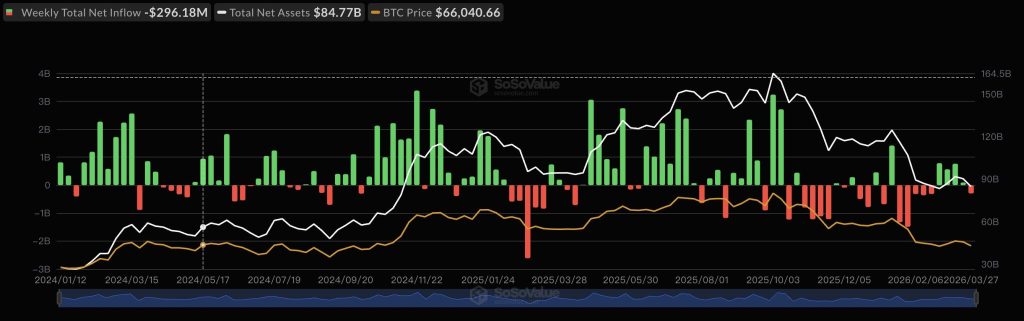
U.S. spot Bitcoin ETFs bled roughly $296 million in net outflows between March 24 and March 27, as a broad risk-off shift tightened its grip on global markets. The reversal was sharp – Monday opened with $167.2 million in inflows before sentiment collapsed entirely by week’s end.
Friday delivered the killing blow: $225.5 million in single-day outflows, led by heavy redemptions from BlackRock’s IBIT. The week’s total marks one of the most decisive institutional de-risking episodes since the ETF products launched in January 2024.
- $296M in net outflows recorded across U.S. spot Bitcoin ETFs, March 24–27, led by IBIT redemptions of $225.5M on Friday alone.
- Macro pressure is compounding – triple-digit oil, fading ceasefire hopes, and end-of-quarter rebalancing all cited as drivers by multiple analysts.
- BTC price support sits at $65,600–$65,107; a break below that zone would signal structural deterioration rather than tactical repositioning.
Discover: The best pre-launch token sales
ETF Flow Data Points to Institutional De-Risking – But Is It Structural?
Thursday, March 26, alone saw $171.12 million exit across all 11 spot Bitcoin ETF products – the largest single-day outflow in over three weeks. BlackRock’s IBIT shed $41.92 million that day, while Fidelity’s FBTC, Grayscale’s GBTC, Bitwise’s BITB, and ARK’s ARKB each recorded $20–30 million in redemptions. The breadth matters: this wasn’t an issuer-specific bleed – it was coordinated institutional de-risking across the board.
That distinction matters. When outflows concentrate in a single fund, the read is operational or reputational. When every major product sells simultaneously, the signal is macro.
Josh Gilbert, market analyst at eToro, put it plainly: “Risk-off is clearly the mood amongst markets,” pointing to Bitcoin’s slide to a three-week low and the S&P 500’s fifth consecutive weekly loss – its longest losing streak since 2022. “The macro forces working against it are compounding,” he added. “Triple-digit oil is fuelling inflation fears, which pushes rate cut expectations further out, which in turn removes the very catalyst that risk assets need to find a floor.”
Bitcoin’s slide below $67,000 amid rising treasury yields had already flagged deteriorating risk appetite before the ETF data confirmed it. Geopolitical escalation compounded the pressure – President Donald Trump’s comments to the Financial Times, suggesting the U.S. could “take the oil in Iran” and potentially seize Kharg Island, rattled commodity and risk markets simultaneously.
Peter Chung, head of research at Presto Labs, said the risk-off tone was the primary driver, though he noted the outflow “doesn’t seem that dramatic compared to the recent trends.”
Pratik Kala, head of research at Apollo Crypto, echoed that read, calling the $290 million figure “quite normal” and attributing it to “risk-off sentiment and end-of-quarter rebalancing.”
Long-term holder balances remain stable, indicating tactical repositioning rather than a structural exit from Bitcoin exposure. Cumulative ETF investments had surpassed $2 billion in recent weeks before this pullback, underscoring how quickly institutional adoption accelerated through early 2026.
Can Bitcoin ETFs Demand Recover – Or Is More Outflow Pressure Coming?
The price structure gives traders a clear framework. Key support sits at $65,631–$65,107, the February 12–19 lows, with a secondary floor at $65,619 – the March 8 low.
A clean break below $65,600 would shift the read from tactical reset to something more concerning for demand structure. Resistance is parked at $71,880, the March 25 high.

Gilbert flagged a ceasefire as the most immediate catalyst for a “strong relief rally,” but warned that without credible de-escalation, markets face “more choppy sessions ahead.” The Fed rate outlook is the second variable – geopolitical factors weighing on Bitcoin are compressing any near-term case for policy relief.
Three scenarios are live. A ceasefire or dovish Fed signal reopens inflow momentum, and BTC reclaims the $71,000 zone. Base case: choppy, range-bound flow data through April as macro uncertainty persists and ETF demand stays muted. Bear case: a break below $65,100 triggers forced selling and a second wave of institutional outflows that dwarfs last week’s total.
The week’s Monday-to-Friday reversal – from $167.2 million inflows to $225.5 million single-day outflows – is the clearest signal that institutional conviction is conditional right now, not structural. Traders navigating this environment should watch weekly ETF flow totals as a leading indicator for BTC price direction, not a lagging one.
Discover: The best crypto to diversify your portfolio with
The post Bitcoin ETFs See $290M in Outflows as Risk-Off Sentiment Intensifies appeared first on Cryptonews.


The ECB now accepts tokenized securities as collateral, lifting DLT into its toolkit while X erupts over Axiology’s XRP Ledger roots and “no XRP” disclaimer.
Summary
- The European Central Bank now accepts DLT‑issued tokenized securities as collateral for Eurosystem credit operations, effective March 30, 2026.
- Axiology, one of the first eligible platforms, is built on XRP Ledger open‑source code, but the ECB says this does not mean it uses public XRP.
- The distinction has split Crypto X, with XRP supporters trying to frame the move as de facto XRP adoption while critics push back.
The European Central Bank has started accepting tokenized securities issued on distributed ledger technology as eligible collateral for Eurosystem credit operations, in what many in European markets see as a watershed moment for on‑chain finance. The change, effective March 30, 2026, follows months of preparation under the ECB’s digital finance and wholesale DLT experimentation agenda, and gives banks a way to post properly structured tokenized assets against central bank liquidity. The decision has quickly become the most discussed topic on Crypto X, in part because one of the early platforms in focus, Axiology, is built using open‑source XRP Ledger code.
The nuance that is driving arguments is simple but politically charged. In documentation and technical clarifications around its collateral framework, the ECB has stressed that using XRP Ledger–based infrastructure “does not imply the use of the public XRP token” and that all eligible collateral must meet existing eligibility and risk‑control criteria regardless of the technology used. That has not stopped XRP‑aligned accounts from trying to spin the development as proof that “XRP is now ECB collateral,” while critics point out that the central bank is explicitly separating the underlying open‑source code base from the freely traded XRP asset tracked on the XRP price page.
Behind the social‑media noise, the policy shift fits into a broader pattern of European experimentation with DLT in wholesale markets. The ECB has run multiple trials on tokenized bonds and central bank money settlement, and has signalled that its collateral framework can be “technology‑neutral” as long as legal, operational and risk standards are met. According to a January discussion that first went viral when X user IOV_OWL highlighted the upcoming change, the new rules open the door for banks to use DLT‑issued securities from approved platforms as if they were conventional collateral, subject to familiar haircuts and eligibility checks.
Market participants say the move could gradually expand eligible pools of repo collateral and support the emerging real‑world asset segment, where tokenized bonds and funds aim to compress settlement cycles and reduce intermediaries. In a previous crypto.news story on tokenization, European pilots of tokenized government bonds were framed as a way to test whether on‑chain settlement can safely plug into the ECB’s monetary operations without undermining stability. Another crypto.news story on RWAs noted that infrastructure built on public‑chain code, including variants of ethereum and XRP Ledger, is increasingly being adapted for permissioned institutional contexts.
For XRP holders, any association between the XRP Ledger and a major central bank is fuel for a long‑running narrative that the token could one day sit at the heart of cross‑border settlement. XRP maximalists on X have seized on Axiology’s architecture to claim that “the ECB now backs XRP,” even as the official documents underline that collateral eligibility is tied to the legal issuer and risk profile of the tokenized security, not to XRP itself.
From a market‑structure perspective, analysts warn that conflating open‑source code usage with token adoption risks misleading investors about what central banks are actually doing. In another crypto.news story on central bank digital currency pilots, legal experts stressed that most wholesale DLT experiments are designed to remain walled off from public tokens such as bitcoin, ethereum or XRP, even when they borrow code or concepts. As the ECB’s framework beds in, the more substantive question will be how quickly volumes in tokenized collateral grow—and whether other central banks follow—rather than how far social‑media narratives can stretch the XRP connection.
Crypto World
Crypto News: Is the Market Dead Again ? While Pepeto Shows High Growth Potential and ETH and XRP Keep Building
Every crash produces the same headline: crypto is dead. The crypto news cycle printed that claim after FTX collapsed, after the 2022 bear wiped $2 trillion, and after Bitcoin fell 50% from its October 2025 high. Wallets that bought during peak fear built the returns the crowd paid a premium for later.
With over $8 million in presale capital and a Binance exchange debut drawing closer, Pepeto offers both real exchange tools and a clear path to early positioning. For anyone tracking crypto news, this presale gives the rare chance to lock in 150x potential before exchange trading begins.
Crypto News Says the Market Is Dead, but Three Events This Week Prove the Opposite
Strategy holds 762,099 BTC purchased for $57.69 billion and added another $76.6 million last week below its own cost basis (CoinDesk).
Square auto enabled Bitcoin Lightning payments for four million merchants on March 30, and BNP Paribas launched six crypto ETNs the same day (LiveBitcoinNews).
Crypto news calling the market dead while the largest corporate buyer, a major payment processor, and Europe’s biggest bank all expand crypto operations in the same week is noise, not signal.
Market Headlines, Presale Capital, and the Entry Fear Is Hiding
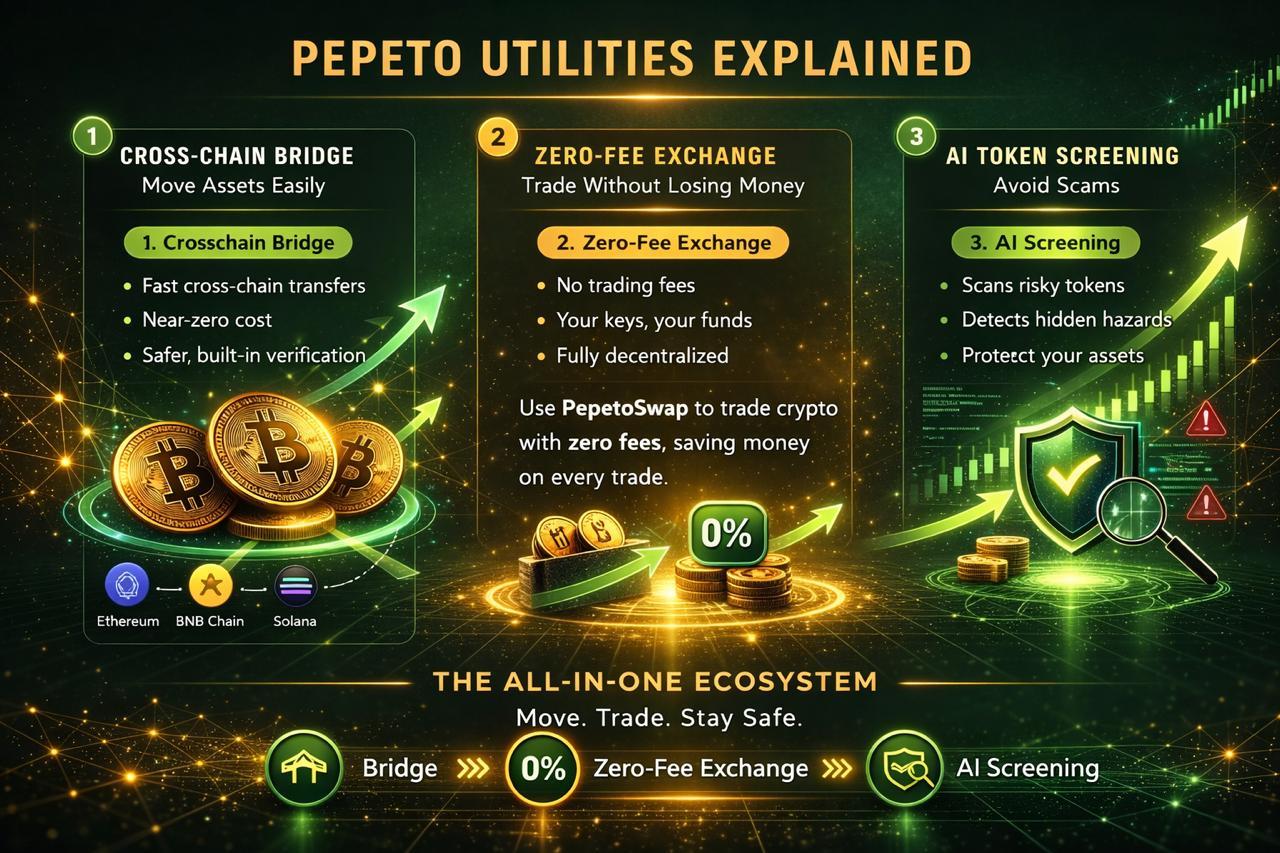
Why Pepeto Is the Crypto News Story the Headlines Have Not Written Yet
With the Binance exchange debut drawing closer, Pepeto is emerging as the presale the crowd discovers after the window closes, and committed wallets are already taking notice. Rounds are filling faster than projected, and passing on this entry risks losing the only presale with a confirmed exchange listing and working tools behind it.
Pepeto is not another token built on hype alone. The risk scorer catches scams and surfaces contract problems before a trade costs money, protecting capital the way no meme token has before. Every contract check flows through a transparent verification layer for holders who need answers before the trade, not after the loss.

That protection does not fade when narratives shift. Whether capital chases memes, DeFi, or AI tokens, the demand for contract verification before buying stays constant. That is why Pepeto attracts committed capital even while fear keeps the index at 9. PepetoSwap processes every trade at zero cost across multiple chains, and the bridge connects networks without charging a cent on transfers, both live before the exchange debut. A SolidProof review locked down every smart contract, and a former Binance expert on the dev team secured the exchange path that most presales chase for years without finding.
Staking at 191% APY compounds for wallets inside, building positions while the crypto news audience reads about recovery timelines. For wallets searching for the right entry, this is the moment to act because the presale at $0.000000186 gives the 150x distance from entry to exchange that the Pepe ATH math confirms, and the Binance debut closes that window permanently.
Ethereum (ETH)
Ethereum trades near $1,999 according to CoinMarketCap, down more than 60% from its October 2025 peak, with the ETH to BTC ratio at multi year lows.
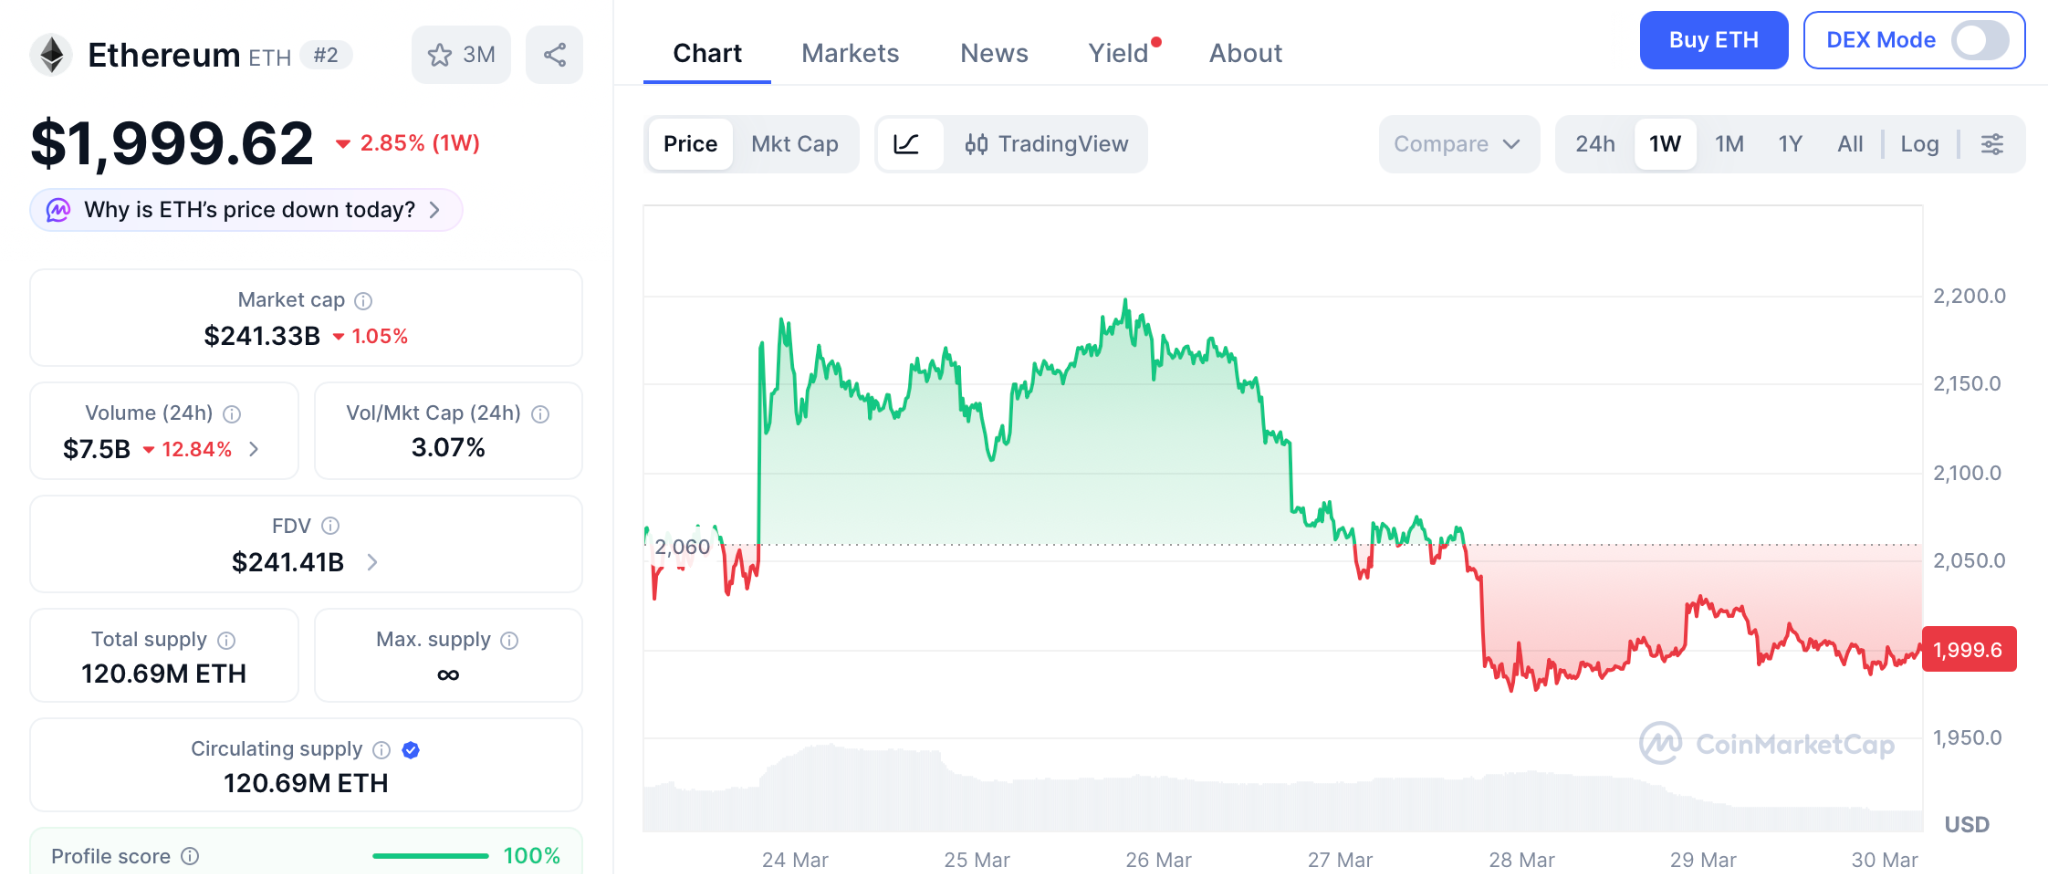
Pectra in April could shift sentiment. Declaring ETH dead ignores $233 billion in market cap, but recovery requires months of rotation the presale entry today does not need.
XRP
XRP holds $1.32 after the SEC classified it as a digital commodity on March 17, ending a five year legal battle (24/7 Wall St).
Spot ETFs hold $1.44 billion in inflows and Standard Chartered targets $2.80 to $8.00. From $1.32 with an $80 billion cap, returns measure in percentages while the presale multiplier measures in multiples.
Crypto News Will Shift From Fear to FOMO, and the Presale Closes Before It Does
With ETH underperforming and XRP waiting for institutional flows, Pepeto is clearly the crypto news entry the market has not priced yet. The listing approaches fast, marking the close of the entry early wallets acted on before the crowd had reason to look.
Searching for answers in the market news led here, and Pepeto through the Pepeto official website is the answer that search was pointing toward because a working exchange backs every token the listing will price.
Over $8 million flowing in during extreme fear proves the investors inside already see where this is going, and the ceiling on a project with real exchange tools has no comparison to anything built on hype alone. The investors who lock in their position before this presale closes are the ones who will remember this exact moment as the day everything changed, and the ones who hesitate will spend the rest of this cycle watching those returns belong to someone else.
Click To Visit Pepeto Website To Enter The Presale

FAQs:
What is the biggest crypto news story right now?
Strategy adding BTC below cost, Square enabling Lightning for four million merchants, and BNP Paribas launching ETNs all in one week proves crypto is expanding, not dying.
Why is Pepeto the crypto news entry to watch this cycle?
Over $8 million committed during extreme fear, the original Pepe cofounder, and a Binance debut make the Pepeto official website the presale institutional products cannot access.
Is it smart to enter crypto during extreme fear?
Every cycle’s biggest returns came from entries made during fear, and Pepeto at presale pricing with a SolidProof audit and exchange tools gives the verified entry serious wallets are choosing.
Disclaimer: This is a Press Release provided by a third party who is responsible for the content. Please conduct your own research before taking any action based on the content.


The Senate Banking Committee is targeting the week of April 13 for Kevin Warsh confirmation hearing as Federal Reserve chair, citing two sources familiar with the matter.
The timeline puts Warsh on a direct path to replace Jerome Powell before his May 15 term expiration – and it puts a known rate hawk one confirmation vote away from the world’s most influential monetary policy seat.
For crypto traders, that distinction matters.
- Confirmation Timeline: Senate Banking Committee hearing expected the week of April 13, contingent on Warsh completing his paperwork submission; hearing date described as “fluid.”
- Policy Implications: Warsh has publicly called for “regime change” in Fed rate and balance sheet policy, flagging the current Fed’s “hesitancy to cut rates” as a mark against it – signaling a more aggressive easing posture if confirmed.
- Market Signal: Confirmation resistance from Senators Warren and Tillis introduces delay risk; a stalled timeline past May 15 extends policy uncertainty that has historically pressured risk assets including BTC.
Warsh’s Rate Doctrine and What It Means for the Fed’s Next Move
Warsh is not a caretaker appointment.
The 55-year-old served on the Fed’s Board of Governors from 2006 to 2011, the youngest governor in the institution’s history, and helped navigate the 2008 financial crisis. Trump transmitted his dual nomination to the Senate on March 30: a 4-year term as Chairman and a 14-year term as Board Member. This is a structural reshaping of Fed leadership.
Warsh has already signaled the direction. He told CNBC in July that the Fed’s reluctance to cut rates was a mark against them and called for regime change in how the institution manages both rates and its balance sheet. That is not a continuation of Powell’s measured approach. It is an accelerant toward easier policy.
Political resistance is the live variable. Senator Elizabeth Warren is pushing back on structural grounds. Senator Thom Tillis has said he will oppose Fed nominees until a DOJ probe into Powell over renovation expenses at Fed office buildings reaches a resolution. Two opposition holds create a real confirmation drag risk.
For crypto, the directional read is constructive. Elevated Treasury yields have repeatedly compressed Bitcoin valuations during prior tightening cycles.
A Warsh-led Fed pivoting toward faster cuts relieves that pressure structurally. Every week of Senate delay extends Powell’s tenure and preserves the current cautious posture. Traders pricing in a Warsh pivot need to account for both wildcards. A stalled hearing pushes the inflection point into May and compresses the window before Powell’s term expires.
The Fed’s regulatory posture toward crypto is also in play. A new chairman with a mandate for institutional reform could reset how the Fed engages with digital asset firms seeking master account access and regulatory clarity.
Discover: The best pre-launch token sales
What to Watch
The April 13 week is the first hard date on the calendar. Warsh’s paperwork completion is the gating item – any delay in submission slides the hearing and tightens the confirmation window ahead of Powell’s May 15 exit. Watch for the Senate Banking Committee to formally schedule the hearing, which locks in the timeline.
After the hearing, the committee will vote next. A successful committee vote followed by Senate floor scheduling could deliver confirmation by late April. A hold from Tillis – or procedural delay driven by the DOJ-Powell probe – extends the process and leaves rate policy in Powell’s hands past the May deadline. Powell has confirmed he will remain chair until his successor is officially confirmed, meaning there will be no gap. But every day of delay is a day the current rate posture remains in place.
If Warsh clears the committee and reaches a floor vote without holds, confirmation before May 15 is achievable. That outcome would represent the clearest macro catalyst for risk assets – including crypto – since the rate cycle began.
Discover: The best crypto to diversify your portfolio with
The post Fed Nominee Kevin Warsh Confirmation Hearing Expected Week of April 13 appeared first on Cryptonews.


Siren (SIREN) price has surged 109% in 24 hours to a $1.21B cap, up 9,095% from its low, as traders on X argue over “real DeFi” versus a coordinated pump.
Summary
- Siren (SIREN) price has jumped 109% in 24 hours, lifting its market cap to about $1.21 billion with $164.5 million in daily volume, according to CoinGecko.
- The token has now risen roughly 9,095% from its March 2025 all‑time low and is trading near $1.75.
- The move has sparked heated debate on X over whether SIREN is a real DeFi success story or a coordinated pump.
Siren’s SIREN price has exploded into the top‑60 crypto assets by market capitalization after a 109% single‑day gain, putting the project at the center of one of this week’s most polarizing debates on X. CoinGecko data show SIREN changing hands at about $1.75, with a market cap around $1.21 billion and 24‑hour trading volume of roughly $164.5 million, numbers more commonly associated with established DeFi names than relative newcomers. At current levels, the token is up an eye‑catching 9,095% from its March 2025 all‑time low, prompting some traders to draw comparisons with earlier cycle hyper‑performers that went from obscurity to multi‑billion‑dollar valuations in a matter of months.
On X, one of the main threads tracking the move has framed the question bluntly: “Is this an actual DeFi protocol gaining traction, or just another coordinated pump?” That split tone captures the mood in trading circles, where some accounts point to rising on‑chain activity around SIREN’s contracts and liquidity pools, while others note that a large share of volume is concentrated on a small number of venues—often a red flag in past episodes of aggressive, short‑term speculation. For now, concrete protocol metrics remain sparse compared to more established DeFi platforms, leaving traders reliant on price, volume and address growth rather than audited revenue or fee data.
SIREN is marketed as a DeFi‑focused token, with community advocates describing it as part of a new wave of permissionless trading and liquidity tools rather than a meme coin or simple governance wrapper. That puts it, at least thematically, in the same broad category as tokens tied to platforms like Uniswap or GMX, where value is supposed to accrue from trading fees, liquidity incentives and protocol usage. But where those projects publish detailed dashboards and historical metrics, the information around SIREN’s underlying economics and roadmap is still patchy, which helps explain why the X debate has tilted so sharply toward the “pump versus traction” framing.
In previous crypto.news coverage of sudden DeFi rallies, similar patterns have emerged: thin float, concentrated holdings and aggressive social media campaigns can combine with low liquidity to produce triple‑digit daily moves, only for prices to retrace once early buyers take profits. Another crypto.news story on whale‑driven breakouts documented how large wallets moving into and out of small‑cap tokens can amplify these swings, especially when retail traders are chasing green candles without clear fundamentals. A separate crypto.news story on market structure highlighted how fragmented liquidity and high funding rates in derivatives can further magnify upside and downside in these episodes.
With SIREN now sitting near $1.75 and a $1.21 billion market cap, the immediate question is whether the token can sustain its top‑60 status or whether it will follow the pattern of past parabolic moves that faded once attention shifted elsewhere. Traders will be watching for signs of organic growth—such as rising unique users, protocol fees and total value locked—rather than just continued spikes in volume and social mentions. If SIREN does evolve into a genuine DeFi protocol with durable usage, this week’s 109% jump could be remembered as the moment it was “discovered.” If not, it risks joining the long list of tokens whose charts tell the story of a spectacular, but ultimately short‑lived, pump.

Jude Bellingham expected to miss England’s friendly against Japan
Students’ racist and misogynistic behaviour exposed as extreme online content fears grow

Functional benefits brewing in coffee innovation


-
 NewsBeat6 days ago
Manchester United reach agreement with Casemiro over contract clause amid transfer speculation
-

 News Videos5 days ago
Parliament publishes latest register of MPs’ financial interests
-

 NewsBeat3 days ago
The Story hosts event on Durham’s historic registers
-

 Business4 days ago
Instagram, YouTube Found Responsible for Teen’s Mental Health Struggle in Historic Ruling
-
 NewsBeat5 days ago
Tesco is selling new Cadbury Dairy Milk bar and people can’t wait to try it
-
 Tech4 days ago
Intercom’s new post-trained Fin Apex 1.0 beats GPT-5.4 and Claude Sonnet 4.6 at customer service resolutions
-
 Entertainment2 days ago
Lana Del Rey Celebrates Her Husband’s 51st Birthday In New Post
-

 Fashion6 days ago
Does It Matter What You Wear When You’re Laid Off and Looking?
-

 Business6 days ago
More women enter wealth management, but few in advisory roles: study
-
 NewsBeat7 days ago
NASA Artemis II Astronauts enter 14-Day quarantine as moon rocket reaches launchpad
-

 NewsBeat6 days ago
Entrepreneurs Forum survey reveals optimism in North East
-

 Business7 days ago
Late-paying firms face multimillion-pound fines under new crackdown
-

 Sports6 days ago
Fantasy Baseball Week 1 Preview: Top sleeper hitters for both five- and 12-day period led by Munetaka Murakami
-
 Crypto World6 days ago
BTC gives up $70,000 level as markets mull higher interest rates
-

 Fashion6 days ago
Coffee Break: Korean Skincare Set
-

 Tech6 days ago
Embedding compliance in AI adoption
-
Sports6 days ago
One Team in Particular Is Monitoring Kirk Cousins
-

 Tech6 days ago
US FCC Prohibits Approval Of New Foreign-Made Consumer Routers
-

 Politics6 days ago
Vets trips to have lower prices and fewer nasty surprises
-

 Fashion6 days ago
Althea Mink: Patrice Taylor’s Atlanta Couture Brand Built on Legacy, Resilience, and Architectural Glamour
You must be logged in to post a comment Login