

Crypto World
AMD vs Intel Stock Showdown: Which Chipmaker Deserves Your Investment in 2026?

Key Takeaways
- Advanced Micro Devices delivered $7.4 billion in Q1 2026 revenue, marking a 36% year-over-year increase powered by exceptional data center performance
- The Data Center division at AMD reached an all-time high of $3.7 billion, representing 57% growth driven by EPYC CPUs and Instinct accelerators
- Intel generated $13.6 billion in Q1 2026 revenue with only 7% growth, while posting a GAAP loss of $0.73 per share
- Analysts assign AMD a Moderate Buy rating with an average target of $430.68, compared to Intel’s Hold consensus around $83.35
- Intel’s Q2 guidance projects revenue between $13.8 and $14.8 billion, indicating stabilization without meaningful expansion
The semiconductor sector’s two biggest names—AMD and Intel—are experiencing dramatically different trajectories as we move through 2026.
While AMD continues its ascent as a growth powerhouse, Intel remains mired in proving its turnaround strategy can deliver tangible results.
AMD Demonstrates Powerful Momentum
Advanced Micro Devices announced first-quarter 2026 revenue of $7.4 billion, representing a robust 36% increase compared to the prior-year period.
Advanced Micro Devices, Inc., AMD
The company achieved GAAP net income of $709 million. The headline achievement came from the Data Center business, which posted unprecedented revenue of $3.7 billion—a 57% year-over-year jump.
This impressive performance was fueled by escalating demand for EPYC server chips and Instinct GPU solutions. Meanwhile, the Client division also delivered impressive results, climbing 68% to reach $2.3 billion.
These financial results demonstrate that AMD has successfully transformed from a traditional processor manufacturer into a major force in data center infrastructure and artificial intelligence hardware.
Analyst community response has been overwhelmingly positive. MarketBeat data reveals 44 analysts tracking AMD, with consensus landing at Moderate Buy—comprising 30 Buy recommendations, 12 Hold ratings, and only 1 Sell. The average price target over the next 12 months stands at $430.68.
Intel Continues Its Turnaround Journey
Intel reported Q1 2026 revenue of $13.6 billion, reflecting modest 7% year-over-year growth. However, the company recorded a GAAP loss of $0.73 per share.
Adjusted for non-GAAP items, the company posted earnings of $0.29 per share. For the second quarter, management provided guidance of $13.8 billion to $14.8 billion, suggesting the business is stabilizing but not experiencing meaningful growth.
Intel maintains significant advantages including substantial scale, an extensive customer base spanning personal computers, servers, and manufacturing operations. Yet the company hasn’t demonstrated the operational momentum visible at AMD.
The company’s recovery hinges on improved processor competitiveness, advancement in its foundry operations, and development of competitive AI solutions. These critical improvements haven’t yet materialized in financial performance.
Analyst opinion mirrors this cautious outlook. According to MarketBeat, Intel carries a Hold consensus from 41 analysts, with 10 Buy ratings, 26 Hold recommendations, and 4 Sell ratings. The average 12-month price target hovers around $83.35.
Investment Implications
The choice between these semiconductor giants ultimately depends on growth visibility. AMD demonstrates undeniable traction in data centers and AI infrastructure, supported by strong profitability.
Intel presents potential upside if its restructuring succeeds. However, that opportunity remains contingent on execution improvements that haven’t yet materialized.
AMD represents the proven growth play. Intel represents the speculative turnaround opportunity. Your choice depends on your risk tolerance and patience for uncertainty.


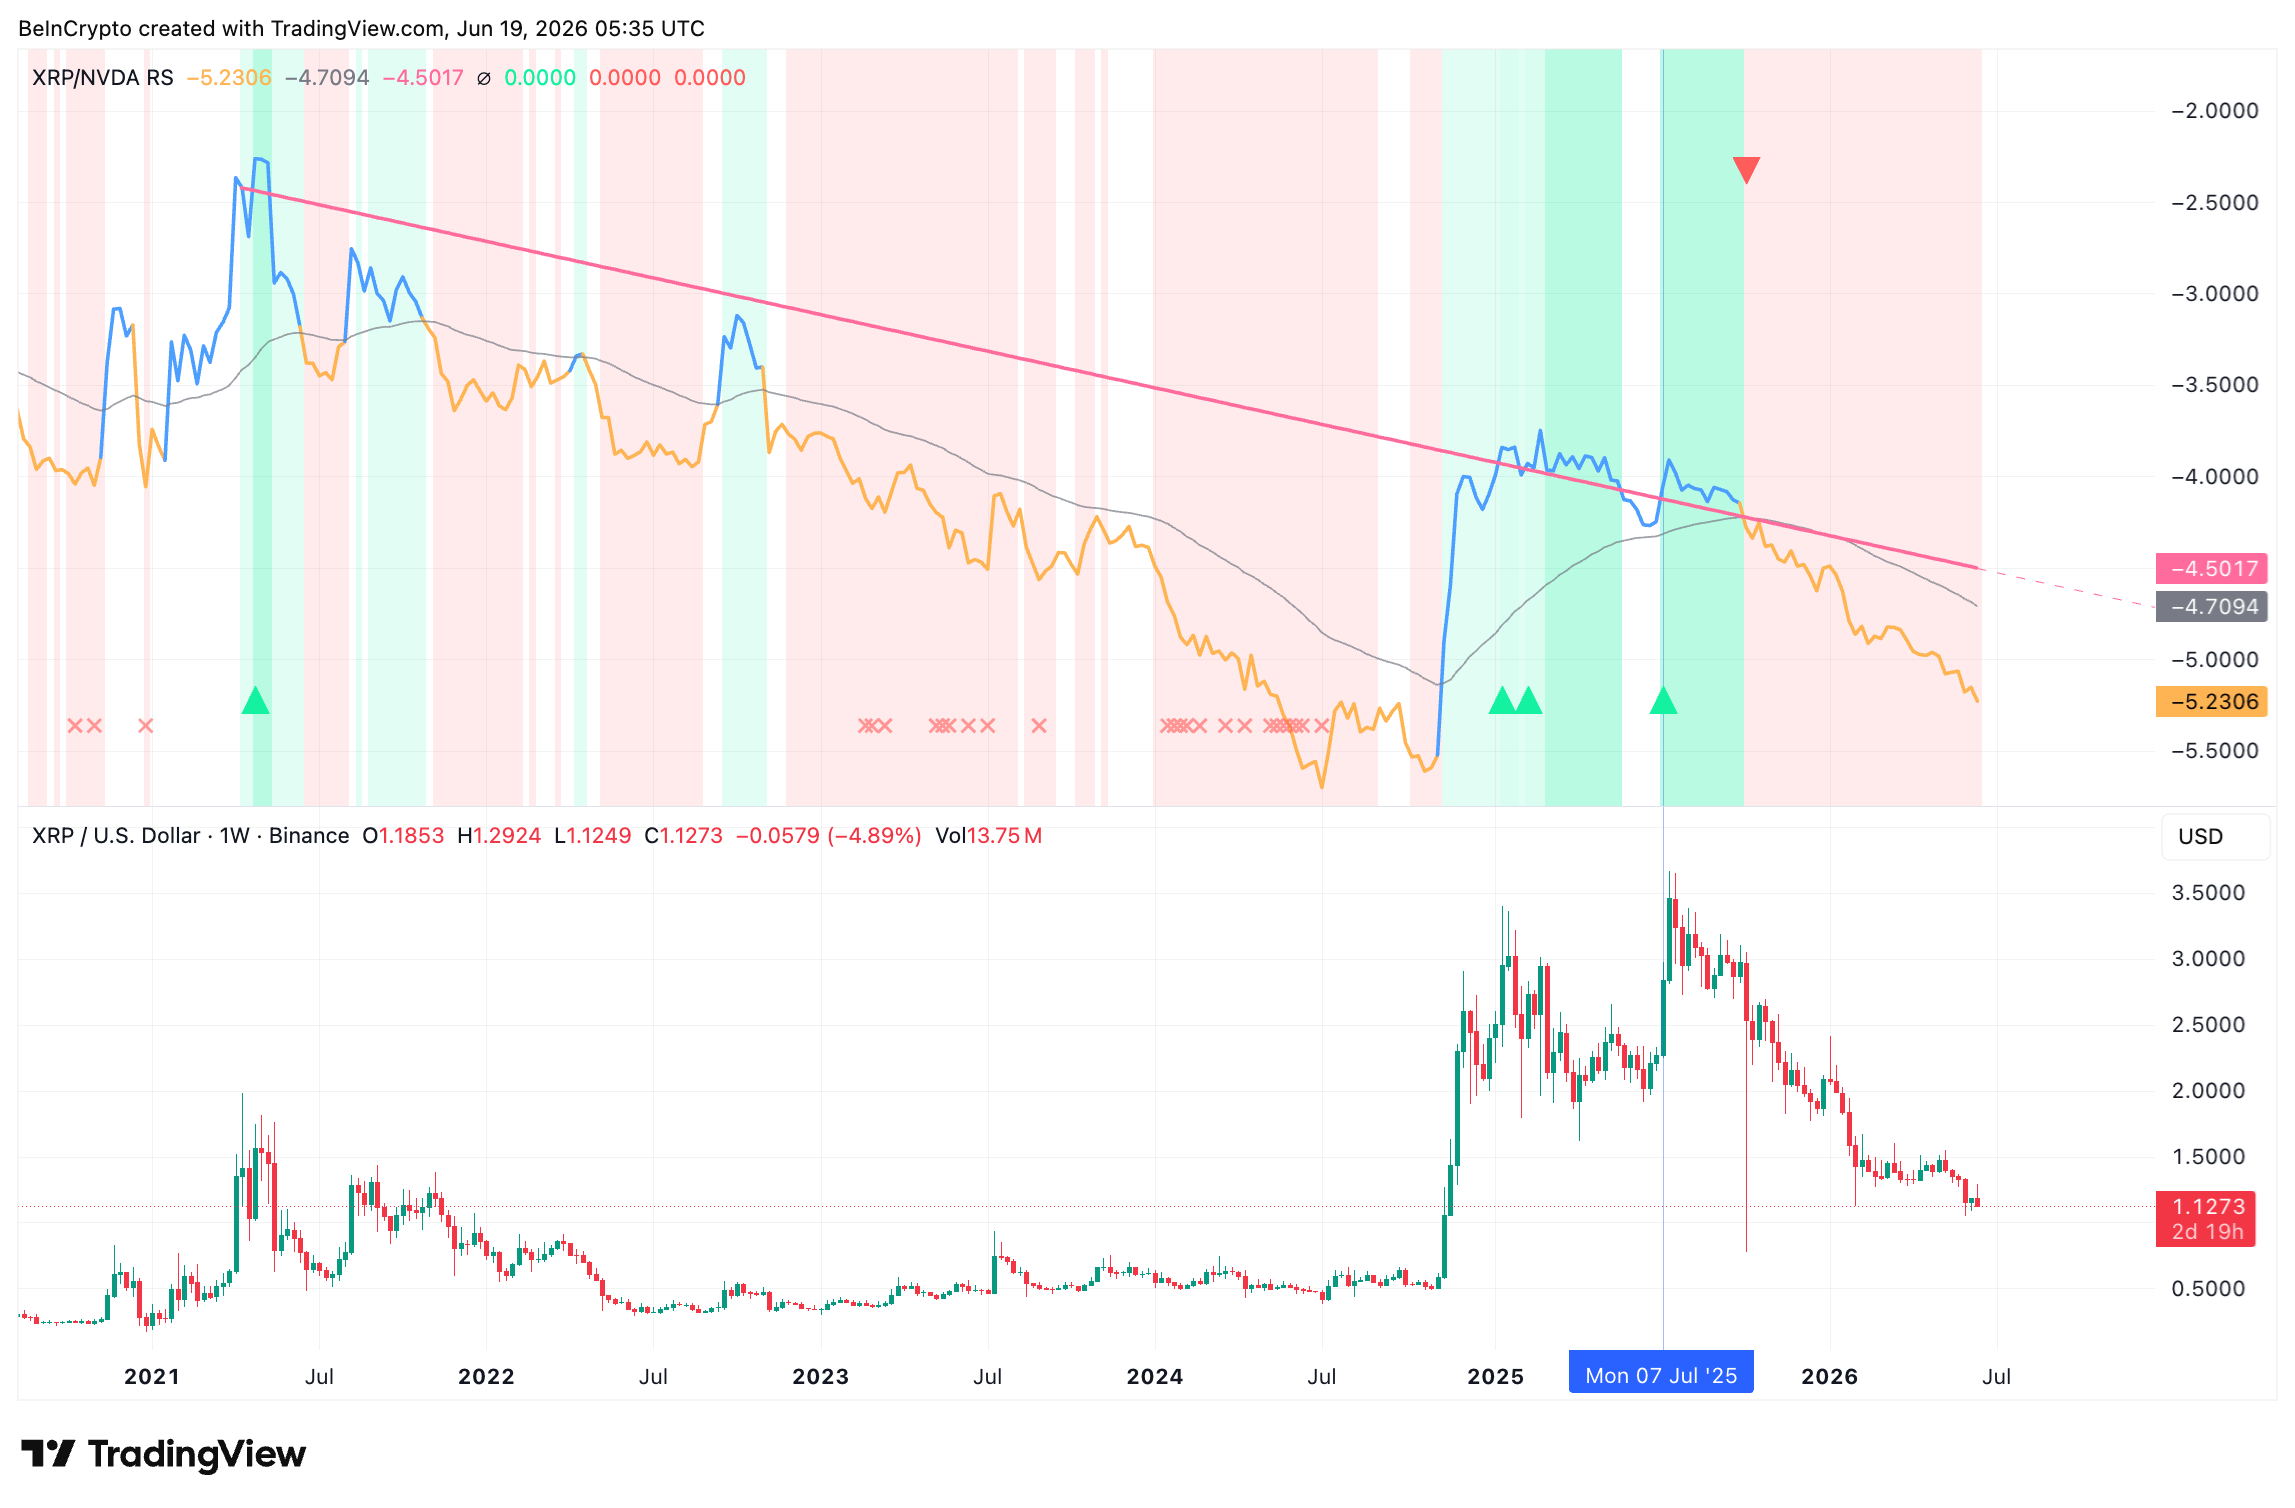
XRP has spent years losing ground against NVIDIA, one of the strongest assets in global markets. Now, a widely shared analyst chart suggests a break above a long-running resistance line could mark the start of XRP’s next major move.
The setup sounds bullish, but the history is less convincing. BeInCrypto rebuilt the XRP-to-NVIDIA comparison and tested past breakouts. Since 2021, those breaks have usually marked exhaustion, with XRP falling sharply afterward.
XRP Bleeds Against NVIDIA on a Long Falling Line
The following chart shows XRP’s relative strength, which means XRP’s price divided by NVIDIA’s price. When the line rises, XRP is winning. When it falls, XRP is losing.
Want more token insights like this? Sign up for Editor Harsh Notariya’s Daily Crypto Newsletter here.
For years, that line has dropped. Cryptollica marks a long descending resistance and argues that a break starts XRP’s real move. The 2018, 2021, and 2025 peaks all stalled there. It wasn’t until 2017 that a break occurred, pushing XRP higher.
A real breakout should also hold on a slower chart. So, BeInCrypto tested the idea on weekly closes, not the analyst’s five-day chart. A weekly relative strength move is harder to fake.
The rule was simple. BeInCrypto drew one descending line across the same relative-strength highs the analyst marks. His chart runs back to 2018, but this weekly view starts in 2021 and includes all the breaks. Price then sits above or below the line on its own.
A break counts when a weekly close finishes above that line. After each break, BeInCrypto measured XRP’s return over the next twelve weeks. That left four breaks since 2021, and each now needs a verdict.
Every Break Has Marked a Top, Not a Launch
So far, the pattern lacks conviction. All four breaks led to sharp drops from the peak rather than fresh rallies. Twelve weeks after a break, XRP fell a median 39%.

Two numbers show how reliable that was. The hit rate is the share of breaks that ended higher, and each window is measured separately. So one break can be up at one mark and down at the next.
That is why the readings differ. One of four breaks was up at four weeks. None were up at twelve weeks. One had recovered by twenty-six weeks. Twelve weeks is the washout low, where every break was underwater, so the piece uses that mark.
The base rate is the other number. A normal twelve-week stretch, any random period with no break, returned about negative 2%. Because the breaks did far worse, the break behaves like exhaustion rather than ignition.

Next, BeInCrypto checked whether NVIDIA is special. The test looks for a falling relative-strength line, meaning years of XRP steadily losing to an asset. XRP shows that falling line against only NVIDIA and Bitcoin. The S&P 500, the Nasdaq, and gold do not.
So only NVIDIA and Bitcoin match the analyst’s setup. A break against the S&P 500 preceded a 35% gain, yet the S&P has no falling line. Therefore, that number is not a fair comparison here.

Among the two that qualify, the gap is stark. A Bitcoin break preceded a small 5% rise. However, the NVIDIA break preceded a 39% drop. So the damage is unique to NVIDIA, even versus the only other asset with the same setup.
That record raises one question. Why did the most recent break fail so cleanly?
On-Chain Data Shows Why One of the Breaks Failed
The answer sits on the XRP Ledger. Around early July 2025, the XRP exchange net position change turned sharply positive. That metric tracks coins moving in and out of exchanges, and rising inflows often signal selling pressure.
This shift happened near XRP’s mid-2025 peak above $3. So holders appear to have moved coins onto exchanges to sell into the strength.

The next metric tells the same story. The XRP hodler net position change turned negative around July 17. It tracks whether long-term holders are adding or reducing coins, and it stayed red through August.
That timing matters. Because even high-conviction holders sold during the correction, the break appears to have lacked underlying demand.

On-chain weakness explained the last failure. So the next break needs the opposite signal.
What XRP Price Needs Before the Next Break Counts
Here is the catch for bulls. XRP must rise by about 459% against NVIDIA just to reach the line again, per the 7-day chart calculations. So, a break is nowhere close today.

Even a clean break alone would not be enough.
Instead, it would need continuous on-chain support, such as steady exchange outflows and holder accumulation.
Encouragingly, recent flows have turned more constructive. Coins have left exchanges lately, and long-term holders have started adding again. Still, XRP price near $1.16 sits far below its old highs.
History offers one caution, too. On the analyst’s chart, 2017 was the only break that truly worked. However, XRP was a micro-cap then, and NVIDIA was a fraction of today’s size. That single win came from a market that no longer exists.
So, What Do All of These Mean? Is XRP Bullish?
XRP has been losing badly against NVIDIA for years. Some analysts say XRP could finally rally if it breaks above a long-term comparison line, but BeInCrypto’s test shows the opposite has happened since 2021.
Every time XRP broke that line against NVIDIA, it usually marked a short-term top, followed by a sharp drop. The last failed breakout was likely because holders moved XRP to exchanges and sold.
For a real bullish signal, XRP would need much stronger demand, fewer coins moving to exchanges, and long-term holders buying again. Right now, the breakout is still far away.
The post XRP Has an NVIDIA Connection, But is It Strong Enough This Cycle? appeared first on BeInCrypto.
Crypto World
Pepeto Price Prediction: Why $5,000 Could Become $750K as G7 Leaders Put Crypto on the Global Stage
The pepeto price prediction gets sharper every week, and this time the signal comes from the highest level of global politics. G7 leaders at the Évian summit on June 17 placed digital asset security next to nuclear policy, calling for joint action against North Korean crypto theft totaling over $1.74 billion.
When the seven largest economies treat crypto as a sovereign concern, the market has moved past speculation. A $5,000 presale entry maps to 150x if Pepeto matches the cap the same builder already reached with Pepe.
The pepeto price prediction points to a Binance listing as the trigger, and $10.28 million committed proves the smart money already moved.
Meme Coins That Turned Small Wallets Into Generational Wealth
Every major crypto cycle produced at least one meme coin that rewrote the financial story of ordinary wallets. Dogecoin moved from $0.002 to $0.73 between 2020 and 2021, turning $1,000 entries into six-figure exits.
Shiba Inu repeated the pattern with one wallet putting $8,000 into SHIB in early 2021 and reaching over $5 billion at the peak per CoinDesk.
Pepe launched in April 2023 with zero product yet ripped past $11 billion on community conviction alone. Each token shared one trait: the biggest returns went to wallets that entered before the first listing. The pepeto price prediction follows that pattern, except this time a working exchange and verified contract sit behind the entry.
What Makes the Pepeto Price Prediction Different From Every Meme Coin Before It
The Builder, the Exchange, and Why This Entry Carries a Floor
Pepeto was created by the same person who took Pepe to an $11 billion market cap on 420 trillion tokens with nothing built behind it. This time, a former Binance executive with listing experience runs the exchange side.
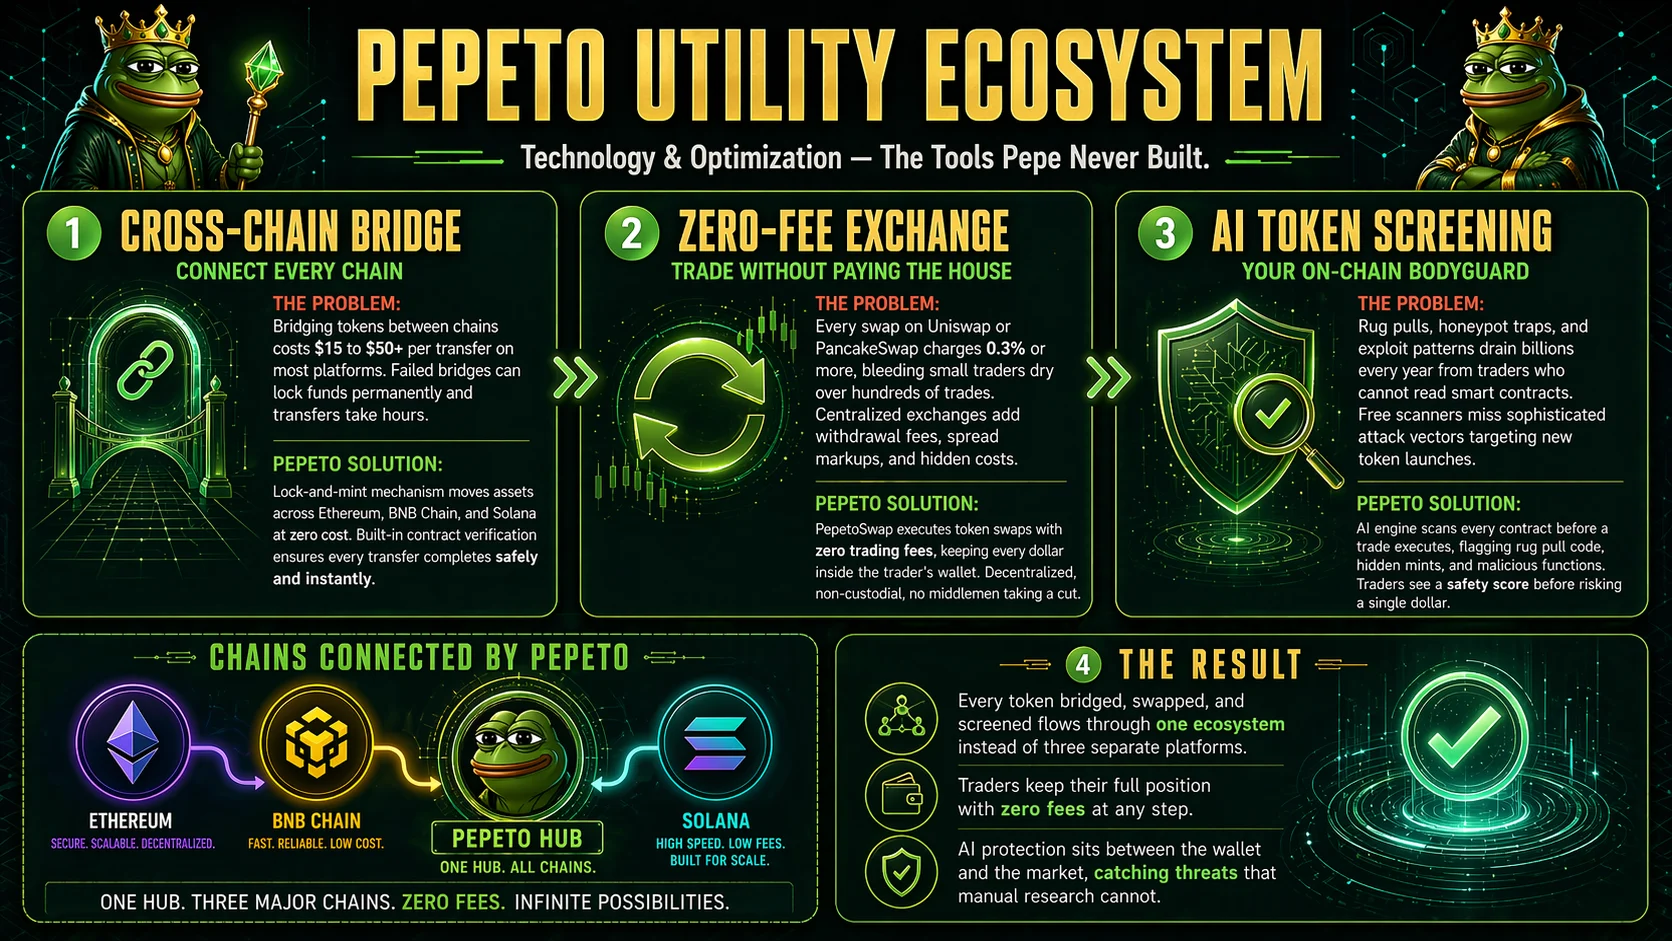
PepetoSwap handles trades across Ethereum, BNB Chain, and Solana at zero cost, keeping the full value inside the trader’s wallet. The bridge moves tokens between chains for free, and the built-in contract scanner reads every token’s code before capital gets close, catching traps that wiped billions from wallets across past meme runs.

Both SolidProof and Coinsult finished independent reviews before the presale opened. Staking at 170% APY grows every locked position daily while the listing timeline tightens.
And $10.28 million raised during a Fear and Greed reading of 22 shows this is not retail impulse, these are wallets that calculated the outcome before committing.
Pepeto Price Prediction: The Path From $0.0000001877 to Pepe’s All-Time High
Here is why the pepeto price prediction keeps drawing attention. The original Pepe hit $0.000028 on a $11 billion cap with the same 420 trillion supply and zero tools. Pepeto sits at $0.0000001877 today, and the distance lands at exactly 150x.
That turns $5,000 into $750,000 if the token reaches what the same builder already achieved. Even half of Pepe’s old cap delivers 75x.
The question is not whether 150x is possible when the person who produced it once is running it again. The question is why it would fall short, when every input that created $11 billion is back and a live exchange adds what Pepe holders always wanted.
The Binance listing expected ahead closes this window, and the pepeto price prediction math only works for wallets that enter before it arrives.
Conclusion
You have watched this exact pattern play out in every cycle, where early DOGE entries became millions and one Shiba Inu wallet turned $8,000 into a $5 billion peak, and the pepeto price prediction is pointing at that same window right now.
Because the person who already built an $11 billion meme coin is running Pepeto with a live exchange, verified audits, 170% APY staking, and a Binance listing that reprices $0.0000001877 the moment trading opens, so the question is whether you finally catch one early enough to feel what it is like when a single entry clears the debt and covers a year of freedom.
Whether you find this article after the listing and carry the weight of knowing you saw the pepeto price prediction math, understood it, and still did not move through Pepeto.
Click To Visit Pepeto Website To Enter The Presale

FAQs
What is the Pepeto price prediction based on the original Pepe market cap?
The pepeto price prediction targets 150x from the current $0.0000001877 presale price if the token matches Pepe’s $11 billion all-time high on the same 420 trillion supply. A $5,000 entry at this level grows to $750,000 at that cap.
What is Pepeto and why are large wallets entering during extreme market fear?
Pepeto is a zero-fee meme coin exchange built by the original Pepe creator with a former Binance executive and backed by SolidProof and Coinsult audits. Over $10.28 million raised at a Fear and Greed reading of 22 shows calculated conviction, not retail impulse.
Disclaimer: This is a Press Release provided by a third party who is responsible for the content. Please conduct your own research before taking any action based on the content.


The European Union has approved anti-money laundering rules that will ban regulated crypto firms from supporting privacy coins while leaving direct Bitcoin transfers between private wallets outside the scope of mandatory identification requirements.
Summary
- EU AML rules will bar regulated crypto firms from supporting privacy coins starting July 2027.
- Bitcoin transfers between self-hosted wallets remain outside direct EU identity verification requirements.
- The regulation also introduces a €10,000 cash payment cap and stricter KYC rules for crypto transactions.
According to Regulation (EU) 2024/1624, which will take effect on July 10, 2027, crypto-asset service providers operating in the bloc will face stricter customer verification obligations and new restrictions on services that enhance transaction anonymity.
The regulation arrives alongside a bloc-wide €10,000 (around $11,500) limit on commercial cash payments and introduces additional compliance requirements for several industries considered vulnerable to money laundering risks.
Bitcoin transfers between private wallets remain outside AML checks
Under the new framework, regulated crypto businesses, including exchanges and custodians, must conduct full customer due diligence for occasional crypto transactions worth €1,000 (around $1,150) or more.
For transactions below that threshold, providers must still identify customers, although they are not required to complete the same level of verification applied to larger transactions or ongoing business relationships.
At the same time, the regulation explicitly prohibits anonymous crypto accounts and services that allow transaction anonymization or increased obfuscation, including those involving anonymity-enhancing cryptocurrencies.
While the rules effectively prevent regulated crypto firms from listing, custodying, or facilitating transactions involving privacy-focused assets, the legislation does not prohibit individuals from owning or privately using those cryptocurrencies.
Clarification published alongside the regulation states that the identification requirements apply to crypto-asset service providers rather than every blockchain transaction. Direct transfers conducted between self-hosted wallets remain outside these obligations.
Separate requirements under Regulation (EU) 2023/1113, commonly known as the Travel Rule framework, require regulated providers to transmit sender and recipient information during crypto transfers. Additional checks apply when transfers involving self-hosted wallets reach €1,000 or more and a regulated intermediary is involved.
As a result, users transacting through exchanges and other regulated platforms must complete know-your-customer procedures, while peer-to-peer Bitcoin transactions conducted without an intermediary do not trigger direct identity verification requirements under EU law.
Cash payments face new limits across the bloc
Beyond crypto, Regulation (EU) 2024/1624 establishes a harmonized €10,000 ceiling for commercial cash payments throughout the European Union. Individual member states may continue enforcing lower limits if national authorities choose stricter controls.
For cash transactions valued at €3,000 (about $3,450) or more, traders and other obligated entities must verify customer identities and perform due diligence checks before completing the transaction.
The regulation notes that the new cap does not apply to deposits or payments made through banks, payment institutions, or electronic money issuers. Those transactions remain subject to existing monitoring systems and suspicious activity reporting requirements where warning signs are detected.
Another major component of the legislation expands the list of entities covered by EU anti-money laundering obligations. Professional football clubs, football agents, crowdfunding operators, investment migration businesses, luxury goods dealers, and several other sectors will now be required to carry out compliance checks and report suspicious activity.
Beneficial ownership transparency rules have also been strengthened. According to the regulation, legal entities across the bloc must disclose their ultimate owners through national registries, with ownership thresholds generally set at 25% and reduced to 15% for certain higher-risk structures.
Trusts, foundations, and non-EU entities involved in specific EU business activities or real estate transactions will also be subject to disclosure requirements, with trustees required to update ownership information within 28 calendar days.
Three altcoins are trading within striking distance of their record highs as the weekend begins. Rain (RAIN), Hyperliquid (HYPE), and ADI each sit close enough that one strong push could deliver a fresh all-time high (ATH).
Each token tells a slightly different story. RAIN is retesting its peak after a shallow dip, while HYPE and ADI recover from deeper corrections. The setups vary in strength, and the technical levels below explain why.
Rain (RAIN) Sits Less Than 3% From Its Record
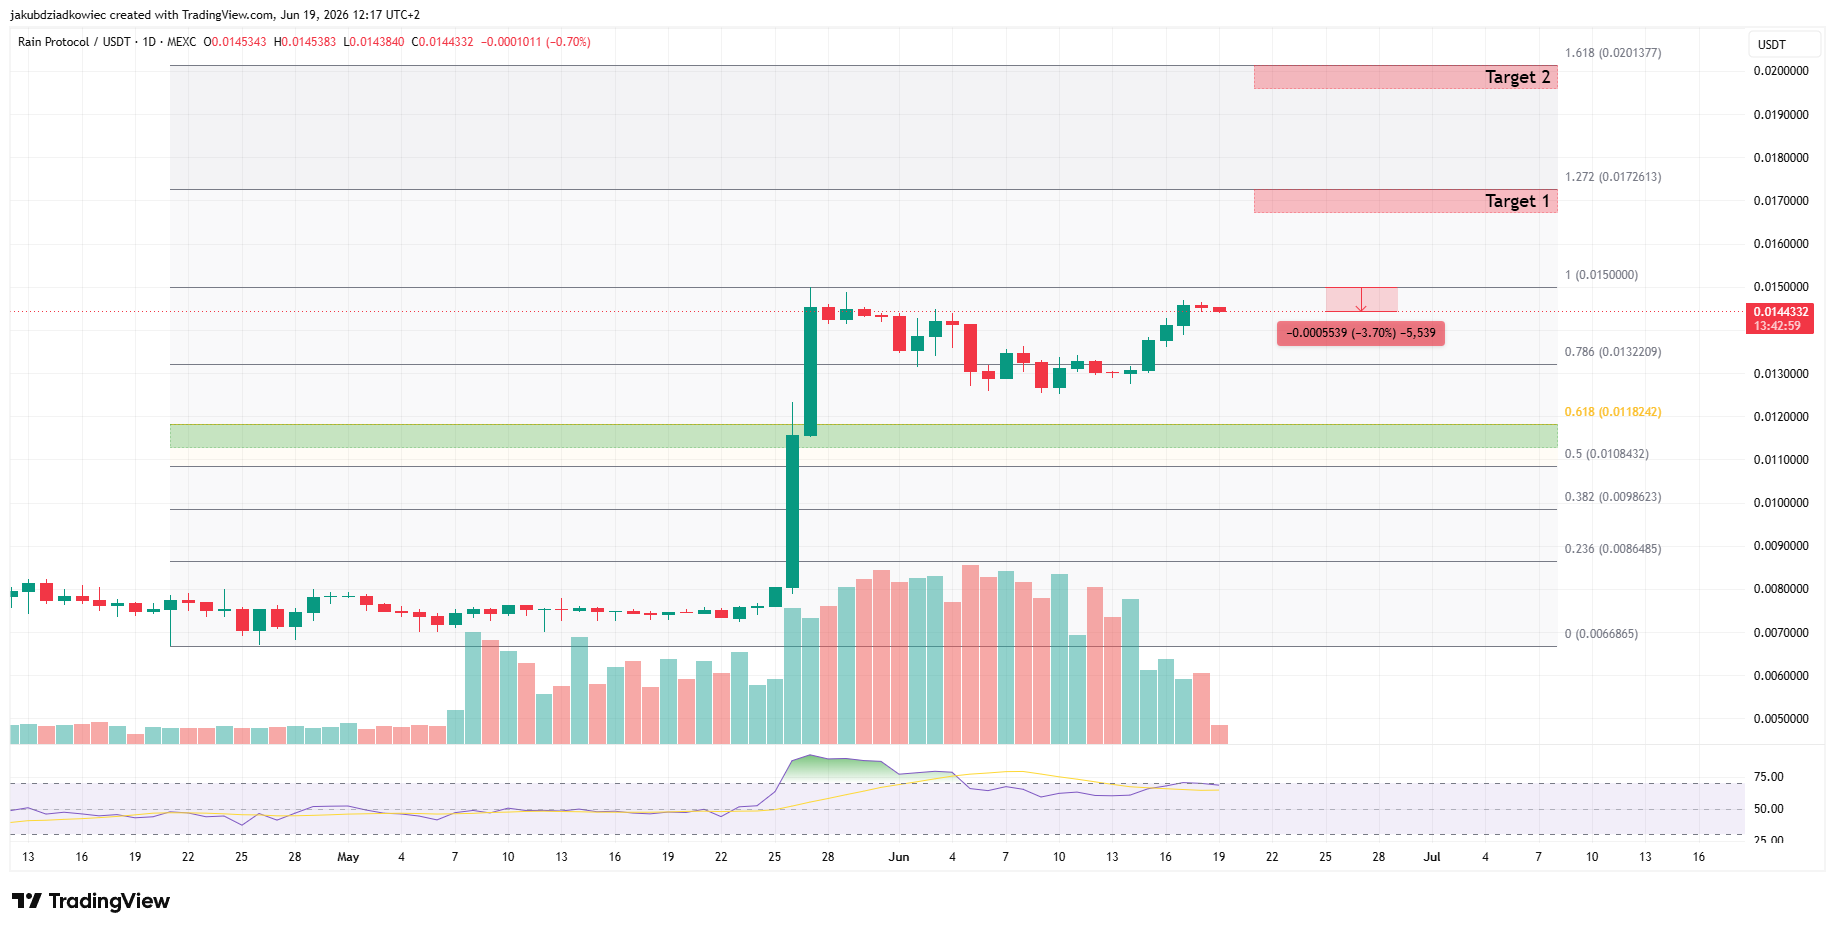
Rain Protocol (RAIN) is the closest of the three to a breakout. The token trades near $0.0144, about 2.4% below its all-time high of $0.0148 set on May 27.
The recent correction was shallow. Price held the 0.786 reversed Fibonacci level and bottomed near $0.0125 before turning higher. RAI is now pressing directly into prior resistance.

A clean break opens the 1.272 Fibonacci extension near $0.0173 as the first target. The 1.618 extension near $0.020 marks the second. On the downside, the 0.618 reversed Fib level near $0.012 should act as support.
Fundamentals add weight to the setup. Rain recently entered the top three prediction markets by value locked, helped by fresh liquidity ahead of the 2026 FIFA World Cup. That demand could fuel the final move toward records.
Hyperliquid (HYPE) Holds Above $63 in Price Discovery
Hyperliquid (HYPE) remains in price discovery despite a pullback. The token trades near $66.70, roughly 13% under its record high of $76.70 printed on June 16.
So far, the dip has held above the 0.236 Fib retracement near $63.66. A standard continuation correction would target the 0.382 level near $55.40, which lines up closely with the previous all-time high around $59.40. That confluence forms strong support.

A deeper flush could reach the golden pocket near $42, where an ascending trendline also sits. Buyers would likely defend that zone.
Momentum has cooled slightly, with volume easing and the RSI slipping back toward neutral. Even so, the broader trend stays bullish, and continued institutional demand for spot Hyperliquid products keeps the path toward $77 open.
ADI Shows the Strongest Momentum of the Three
ADI looks the most explosive of the group. The token trades near $3.96, about 13% below its all-time high of $4.55 from April 3, yet its recovery stands out.
Price corrected into the 0.618 golden pocket near $3.65 and held firmly. Since then, volume has expanded steadily, a sign that buyers are stepping back in with conviction.

One hurdle remains. The 0.382 retracement near $4.00 is acting as resistance, and ADI needs a daily close above it to clear the way back to records. The RSI has turned higher without reaching overbought territory, leaving room to run.
The token also carries real catalysts. ADI Chain recently launched its mainnet as an institutional network for stablecoins, and its Predictstreet platform was named an official prediction market partner of the 2026 FIFA World Cup.
The post 3 Altcoins Trading Near All-Time High This Weekend appeared first on BeInCrypto.
Crypto World
The Best Crypto to Invest in Right Now as XRP ETF Draws $5.3M and Cardano Builds Toward August Catalyst
The best crypto to invest in right now reveals itself when capital moves before headlines catch up. XRP spot ETFs pulled $5.3 million in weekly net inflows on June 18 while Bitcoin ETFs posted outflows per CoinGecko, and Cardano’s Leios testnet launches June 23 with the SEC spot ETF threshold landing in August per CoinMarketCap.
The wallets that captured the biggest returns in every past cycle shared one habit. They bought infrastructure setups before the product went live, and one presale is pulling heavier committed capital right now than anything sitting on exchanges.
Altcoin ETF Rotation Signals Where Smart Money Goes Next
On June 18, XRP-focused ETFs absorbed $5.3 million while Bitcoin products saw net redemptions per CoinGecko. Chainlink landed the official oracle deal for FIFA World Cup 2026 prediction markets through ADI Predictstreet per PRNewswire.
Cardano’s Leios protocol hit 705,000 lines of code with the testnet going live June 23, while CME ADA futures complete their six-month window in August, opening the door for Grayscale’s spot ETF per CoinMarketCap. Every signal points at institutional capital rotating into real infrastructure while retail sits on the sidelines in extreme fear.
Best Crypto to Invest in Compared: Chainlink, Cardano, and the Presale That Stands Apart
Pepeto: The Entry No Listed Token Can Match This Cycle
Anyone who sat through the last bull run holding nothing life-changing knows that feeling. The same builder who pushed Pepe past $11 billion is back on Pepeto alongside a senior Binance developer, and both SolidProof and Coinsult reviewed the entire contract set.
Every wallet that caught the biggest returns last cycle shares one move: they committed before the market priced in what they saw.
PepetoSwap runs a working zero-fee trading engine today, and its scanner reads every token contract for exploit code before a dollar touches the pool. Presale entries cost $0.0000001877, and 170% APY staking compounds every position while the Binance listing timeline draws closer. The best crypto to invest in this cycle fills in real time because the gap between entry and listing carries the entire return.
Locking in through Pepeto at this price sets up the kind of return that rewrites a financial story, and the $10.28 million committed during extreme fear proves the outcome is calculated.
Chainlink (LINK) Price at $8.02 as FIFA Oracle Deal Fuels Network Demand
Chainlink (LINK) trades at $8.02 per CoinMarketCap, sitting 85% below its $52.99 all-time high. The FIFA World Cup 2026 oracle partnership settled billions in prediction bets, and active Chainlink addresses hit 5,679 in June.
Changelly projects $7.73 to $10.03 for 2026. A $1,000 buy targeting $10 returns about $1,247, real but measured. From $8.02 the path to portfolio-level returns stretches months, and the best crypto to invest in for that move sits earlier in its lifecycle.
Cardano (ADA) Price at $0.1639 as Leios Testnet and ETF Threshold Approach
Cardano (ADA) trades near $0.1639 per CoinMarketCap, down 94% from its $3.10 all-time high. The Leios testnet launches June 23 and the SEC spot ETF threshold arrives in August. 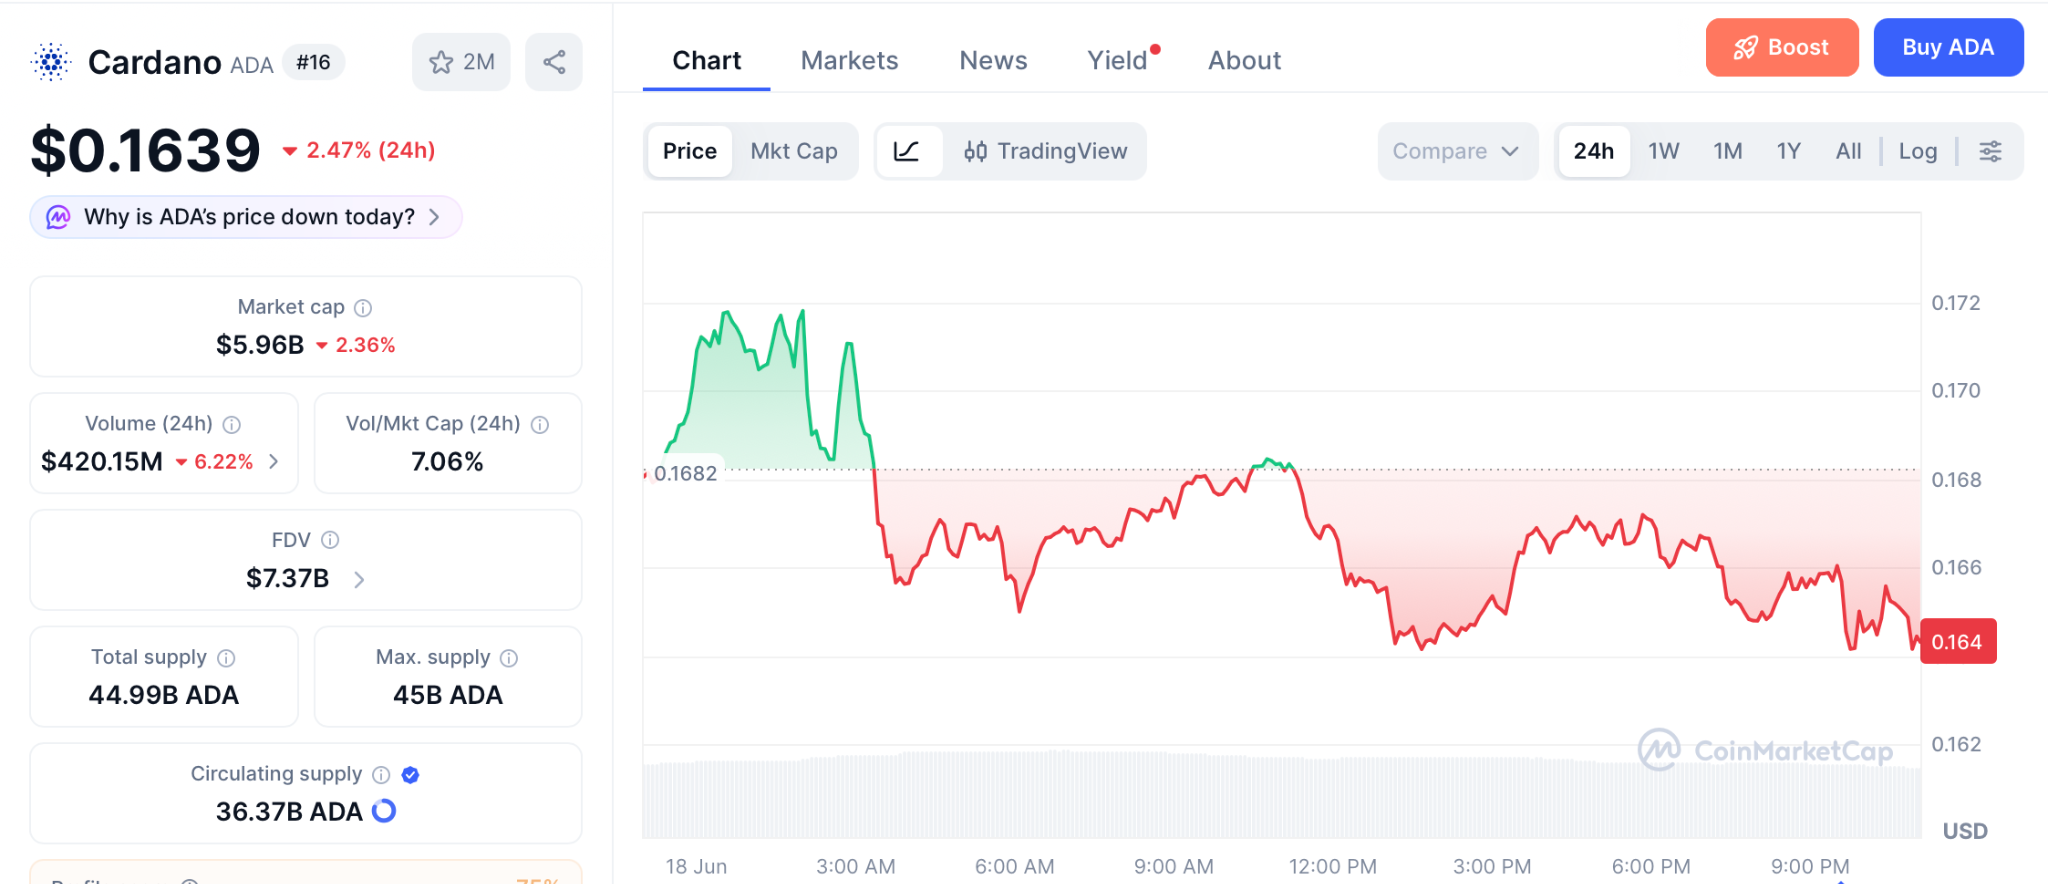
Coinpedia targets $0.28 by late 2026 if the breakout above $0.22 holds. A move from $0.1639 to $0.28 gives roughly 70% upside, solid for a large-cap hold but nowhere near the return math inside a presale at $0.0000001877 with a verified builder and listing ahead.
Conclusion
A 25% gain on LINK or a 70% recovery on ADA is not the kind of return that changes anything about the way you live, and the best crypto to invest in has always been the one you find before the listing when $250 can still become over $1 million like it did for one PEPE wallet and $8,000 can touch billions like Shiba Inu.
And Pepeto is sitting at $0.0000001877 right now with the same builder who proved this at $11 billion, a live exchange, verified audits, and 170% APY while the Binance listing gets closer.
So this is about whether you take the entry that erases the debt and turns one decision into the best crypto to invest in story you tell forever, or close this page and carry the same regret from the last cycle because you knew and did not move through Pepeto.
Click To Visit Pepeto Website To Enter The Presale

FAQs
What is the best crypto to invest in right now ahead of the next listing catalyst?
Pepeto stands out as the best crypto to invest in right now with $10.28 million raised at $0.0000001877, backed by the original Pepe builder and a former Binance developer. The SolidProof audit and live zero-fee exchange separate this entry from every other presale on the market.
How does Chainlink (LINK) at $8.02 compare to Pepeto for portfolio returns?
Chainlink at $8.02 targets roughly 25% toward $10 resistance following the FIFA World Cup oracle deal per CoinMarketCap. Pepeto targets 150x from $0.0000001877 through its upcoming Binance listing, with 170% APY staking compounding every position daily.
Disclaimer: This is a Press Release provided by a third party who is responsible for the content. Please conduct your own research before taking any action based on the content.
Bitcoin is approaching a key options expiration on June 26 with a skewed derivatives landscape that could make it harder for bulls to regain control. With roughly $13 billion in Bitcoin options open interest set to expire, market structure currently points toward downside risk—at least for the near-term window around the monthly settlement.
According to data from Deribit, where most of the activity is concentrated, put options (sell) are positioned more favorably than call options (buy). That imbalance has traders watching not only the current price around the $63,000 area, but also whether the positioning traps bullish momentum as the expiry approaches.
Key takeaways
- Deribit’s June 26 options open interest totals about $13B, with puts holding the advantage versus calls.
- Calls are heavily concentrated above $72,000, leaving upside bets more vulnerable if BTC fails to rebound quickly.
- Puts show less concentration at the deep-down strike area, increasing their odds of retaining value across more price outcomes.
- Market concentration matters: Deribit accounts for about 79% of the options open interest.
Deribit dominance and why the strike mix matters
Options positioning is not just about totals—it’s also about where the contracts are concentrated across strike prices. Deribit is the center of the June 26 contract universe, holding $10.4 billion in open interest, or 79% of the market share. OKX is next with around 6%, while Binance and CME each account for 5%. Bybit follows at 4%.
On Deribit specifically, total call open interest is about $6 billion, but 78% of that call exposure is tied to strikes at $72,000 or higher. With less than a week until expiration, that type of concentration is typically less forgiving if price fails to climb quickly.
Put options tell a different story. Deribit’s put open interest is about $4.5 billion, and only 28% of it is dependent on BTC falling to $57,000 or below. In practical terms, that means a larger share of put exposure could remain relevant across a wider range of downside scenarios leading into settlement.
The broader implication for holders of call options is straightforward: if BTC doesn’t regain higher levels fast enough, a major portion of call OI may lose effective value. Meanwhile, the structure of the put book creates a more durable hedge profile for bears as the expiry nears.
Strategy activity, ETF flow pressure, and regulatory uncertainty
The derivatives setup doesn’t exist in a vacuum. Earlier bullish expectations appear to have been influenced by spot buying and optimism around the US policy outlook—but the macro signals have shifted.
Some of the earlier bullish overreach is traced to Strategy’s aggressive BTC accumulation in April and May. The firm added 62,841 BTC in four weeks, a move that helped support price strength and pushed BTC above $73,000 in May. However, sentiment deteriorated as US-listed spot Bitcoin ETFs began experiencing outflows starting in mid-May, according to coverage linked to Cointelegraph’s reporting on ETF outflows beginning in mid-May.
Market pressure also intensified alongside regulatory uncertainty. Bulls had placed hopes on the Digital Asset PARITY Act, which—if passed—would have aimed to exempt certain mining and staking rewards from taxes until sold. Those hopes faded as the outlook worsened, and the market reacted to Strategy’s sale of 32 BTC, as referenced in Cointelegraph coverage at Strategy’s purchase activity and related context. The resulting ETF outflows added further weight to the bearish narrative, even as parts of traditional markets showed strength.
For investors, the key tension is that bullish spot narratives are not translating into consistent support in derivatives positioning. When ETF flows weaken and regulatory timelines become less favorable, call-side conviction often struggles to hold through expiry cycles—even if large holders continue to buy at times.
What the June 26 expiry scenarios suggest for bulls
With calls clustered above higher strikes and puts distributed across a broader downside band, the June 26 outcomes are currently modeled to favor bearish instruments. Based on current price trends and the cited open interest distribution, four scenario bands have been outlined for the Deribit expiry at June 26:
- $57,000–$61,000: net result favors puts by $3.4 billion
- $61,001–$65,000: net result favors puts by $2.7 billion
- $65,001–$69,000: net result favors puts by $1.7 billion
- $69,001–$71,000: net result favors puts by $1 billion
Even under a bullish attempt to regain ground, the structure remains unfavorable for call holders. The analysis indicates that a 12% rally from around $63,000 would not be enough to swing the June expiry decisively in favor of calls. That doesn’t necessarily confirm control through the next month, but it does suggest that the June 26 settlement could weigh on bullish sentiment as traders reset positions for July.
Investors should note the asymmetry: for calls to materially benefit, BTC likely needs to move toward—and ideally sustain above—levels where the call OI is concentrated, particularly around the $72,000 and higher strikes. If price remains below that zone, call-side exposure may decay faster with time, while put-side positions can still retain value across more moderate downside outcomes.
Why this matters beyond one expiry
Monthly options expirations often act like psychological and liquidity inflection points. When call dominance is absent and put advantages remain consistent across plausible price ranges, traders may treat rallies as less “clean” and more likely to face selling pressure into key levels.
Going forward, the market will likely focus on whether BTC can regain levels fast enough to challenge the concentrated call strikes before June 26. Until then, the most immediate question for traders is whether the current bearish derivatives balance will amplify sell pressure into settlement—or whether a late-stage rebound can force a repricing of call value as expiration approaches.

Hsiao-Wei Wang has stepped down as the Ethereum Foundation’s co-executive director and board member following the end of her sabbatical.
Vitalik Buterin praised her role in shaping Ethereum’s research culture and building the ecosystem’s community.
Ethereum Foundation Hit By Another High-Profile Exit
Wang took to social media to announce her departure from the non-profit after a long career break that she says gave her the space to reflect on life’s priorities.
“After my sabbatical, I have decided to step down as co-executive director and board member of the Ethereum Foundation effective today,” she wrote.
She revealed that Bastian Aue, another executive at the organization, had guided the transition while she was on her break. Reflecting on her time at the foundation, Wang said she was proud of what the community had achieved and credited its continued growth to the builders, researchers, educators, validators, users, and other contributors who support the network.
The EF has experienced several high-profile departures across its team this year, with senior figures like Tomasz Stańczak, Julian Ma, Carl Beek, Tim Beiko, Trent Van Epps, and Barnabé Monnot all leaving. The latest exit from the board now leaves Vitalik Buterin, Patrick Storchenegger, and Aya Miyaguchi as its remaining members.
This has led to a lot of uncertainty and speculation from the community, with some seeing the exits as evidence of internal disagreements and governance issues. But Ryan Berckmans, a long-time community figure, says people are looking at it the wrong way, and that the organization is still very committed to the network.
Meanwhile, Wang said she is still figuring out what comes next, but remains a proud member of the community. Her announcement ended with an acknowledgment of its role in driving the ecosystem forward, and a thank you to those who contributed along the way.
Buterin Praises Wang’s Contribution
Wang assumed the co-executive director job last year alongside Stańczak, leading the organization through one of its toughest periods. Buterin acknowledged the former’s decade-long contribution to the ecosystem, noting that she has always handled her work with the utmost skill and grace.
“She handled the task skillfully and gracefully, and has constantly strived to find and insist on outcomes that are right both for the Ethereum protocol and for the human beings that build and maintain it,” he wrote.
Recalling her early days at the foundation, he praised her for helping make Ethereum’s research and consensus work more organized and accessible and for building a strong community in Taipei through people and events.
The post Ethereum Foundation Co-Executive Director Hsiao-Wei Wang Steps Down appeared first on CryptoPotato.
-
A stress test that showed both strengths and weaknesses
When large sums leave a financial system quickly, hidden weaknesses often become visible. In traditional finance, such situations often lead to emergency lending programs, withdrawal limits or government-backed bailouts.
Decentralized finance (DeFi) works differently.
Aave is one of crypto’s biggest lending platforms. In April 2026, users withdrew about $8.45 billion from the protocol after the KelpDAO rsETH bridge exploit raised concerns across DeFi markets.
Aave’s own smart contracts were not compromised. The pressure came from an external rsETH bridge incident that affected Aave through collateral, borrowing and liquidity channels. The protocol’s core logic continued to function, but the episode was not smooth. Some markets came under severe liquidity pressure, and emergency controls were used to contain the damage.
That made the outcome more complicated. Aave avoided a full breakdown, but the event also showed how quickly stress can spread when assets, collateral and liquidity are closely connected.
For Aave founder Stani Kulechov, the event showed that DeFi had become more mature. But independent analysts reviewing the same data took a more cautious view.
While Aave survived, many questioned whether surviving the event was enough to answer concerns about the real strength of DeFi lending protocols.
-
What led to the $8.45B in withdrawals
The pressure did not begin with a hack on Aave itself. It began with the KelpDAO rsETH bridge exploit in April 2026.
Attackers stole about $292 million worth of rsETH from KelpDAO’s LayerZero bridge. That raised concerns about whether some rsETH tokens were fully backed. The concern quickly spread because rsETH was used across DeFi, including as collateral in Aave markets.
This created a direct problem for Aave. If collateral tied to rsETH lost trust or value, lenders could face bad-debt risk. Users began withdrawing funds as they tried to reduce their exposure before conditions became worse.
The withdrawals then added pressure to Aave’s liquidity. As more users pulled funds, some markets became highly utilized. In simple terms, most of the available liquidity had already been borrowed or withdrawn, making it harder for some users to exit immediately.
The incident showed how an external asset problem can still affect a lending protocol. In DeFi, assets often move across bridges, lending markets and other protocols. A problem in one part of the system can quickly affect another.
That is what made the episode look like a DeFi bank run. Users were not waiting for branches to open or banks to approve transfers. They could react in real time. But the event also showed an important limit: users can try to withdraw at any time, but actual withdrawals still depend on available liquidity and protocol conditions.
Did you know? The largest bank runs in history often unfolded over days or weeks. In DeFi, similar events can happen within hours because blockchain protocols never close, and users can move funds instantly from anywhere in the world.
-
Stani Kulechov’s view: The system held firm
Kulechov framed the incident as evidence of Aave’s resilience. In his view, the core protocol worked as designed, even during a period of heavy stress.
That distinction matters. Aave did not suffer a protocol exploit, but the markets around it still came under pressure.
As withdrawals increased, some markets reached full utilization. That meant liquidity became limited in those markets, making it harder for some users to withdraw immediately. Aave’s risk managers also had to use built-in controls, including emergency freezes and changes to risk parameters, to contain the damage.

Seen this way, Aave did pass an important real-world stress test, but not without strain. Supporters of the platform point to several features that set DeFi apart from traditional finance.
- Collateral is visible on-chain.
- Risk settings are publicly available.
- Liquidations follow smart contract rules.
- Anyone can inspect protocol activity in real time.
These features can reduce some of the information gaps that have contributed to banking crises in the past. But they do not remove every risk. DeFi lending protocols can still face problems from external assets, bridges, liquidity shortages and fast-moving user behavior.
To supporters, Aave’s survival showed that open, rule-based systems can keep operating under heavy pressure. To critics, the incident showed that transparency alone is not enough. DeFi can still require emergency action when liquidity stress spreads across connected markets.
-
Survival does not mean safety
Critics warn against treating the outcome as full proof that Aave’s design is safe. The protocol survived, but that does not mean every part of the system worked perfectly.
Stress events can be read in different ways. Strong design may explain part of Aave’s performance, but favorable market conditions may have also helped.
External analysts noted that large exposure remains concentrated across many DeFi platforms. When a small group of users controls very large positions, their actions can affect the stability of the whole protocol.
Concentration risk has long been a concern in traditional finance. The same concern applies to DeFi.
If several major borrowers close their positions at the same time during market stress, the impact could be bigger than current risk models expect.
Avoiding a crisis this time does not guarantee the same result next time.
Did you know? Aave first launched in 2017 under the name ETHLend. It later rebranded and grew from a peer-to-peer lending marketplace into one of the largest liquidity pool-based lending protocols in crypto.
-
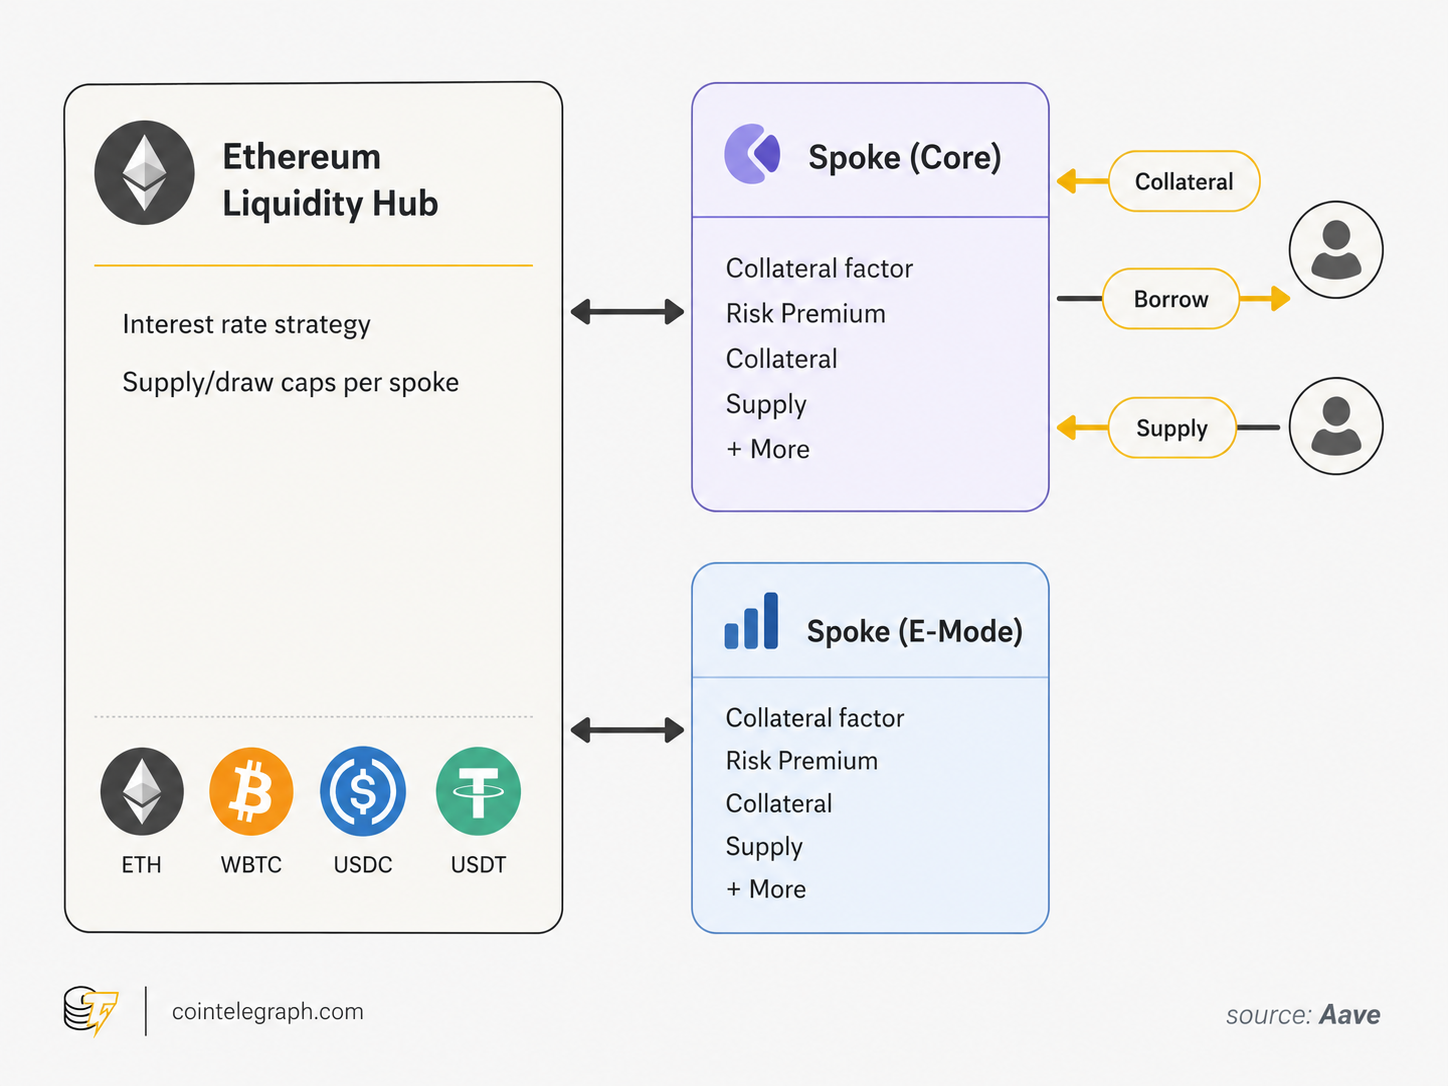
How Aave manages risk
Aave is more than a basic lending platform. Over time, it has added several layers of protection to help reduce wider risks.
Borrowers on Aave can take loans only within set loan-to-value limits. Liquidation thresholds decide when collateral can be sold. Supply caps limit how much exposure can build around certain assets. Borrow caps limit how much users can borrow.
Isolation Mode helps limit the impact of higher-risk collateral. Efficiency Mode, known as E-Mode, uses special settings for assets that usually move together. Governance, supported by expert risk advisers, adjusts these settings when needed.
During the recent withdrawal surge, these safeguards generally worked as planned. Core protocol functions continued, but some markets came under strain. Utilization reached 100% in major pools, limiting withdrawals for some users.
Still, observers argue that DeFi risk management needs to keep improving. Governance decisions can still take time, and risk models may not adjust quickly enough during fast-moving events.
Stress tests often rely on past events, which may miss new types of spillover risk. The real task is not only to avoid earlier problems. It is also to prepare for threats that have not appeared yet.
-
The hidden risk of connected DeFi platforms
One of DeFi’s biggest strengths is also one of its biggest risks. The same connections that make it useful can also make it fragile.
Composability allows applications to connect and work together. Funds placed in one protocol can support activity in another. This helps new products grow faster and can make the system more efficient. But it also creates more links between platforms.
A loan on one platform may depend on collateral from another. That collateral may then be tied to leveraged positions across other systems. Over time, this can create a complex financial network.
In normal market conditions, composability opens up possibilities that are difficult to find in traditional finance. But during stressful periods, it can increase the risk of problems spreading from one platform to another.
A platform’s strength cannot be judged in isolation. The condition of the wider DeFi system also matters.
Did you know? Traditional banks carry out regular stress tests under regulatory supervision. In DeFi, stress tests often happen unexpectedly in live markets, with real users, real assets and no chance to rehearse.
-
What users should take away
For depositors and investors, the episode is an important reminder. A protocol’s size and reputation should not be confused with complete safety. Users need to understand the assets supporting the protocols they use.
Governance proposals also deserve close attention because they decide the protections around deposited funds. Diversification still matters, even in DeFi.
For builders, the takeaway is just as clear. They should design for extreme conditions and keep testing their basic assumptions. They also need to recognize that transparency alone does not remove wider risks.
The incident shows that strength is best judged through repeated performance across several tests, not one event. One stress test provides evidence, but it does not provide certainty.
-
Aave passed this test, but questions remain
Aave’s ability to handle roughly $8.45 billion in withdrawals deserves attention. The protocol kept working during one of the largest liquidity shocks DeFi has faced.
The result is important, but it should not be treated as the final word on Aave’s risk profile.
Supporters see it as proof that open and transparent systems can survive panic without bailouts or emergency measures. Critics, however, see it as a sign that hidden weaknesses may still exist beneath the surface.
Both views have some truth.
Aave showed that DeFi can withstand heavy pressure. The bigger challenge is making sure that strength holds when the next crisis arrives in an unexpected way.
Key takeaways:
- Puts (sell) options dominate the June 26 expiry with net advantages of $1B to $3.4B, leaving bulls exposed.
- Despite Strategy buying BTC again, heavy call (buy) positioning above $72,000 will likely reinforce bearish momentum.
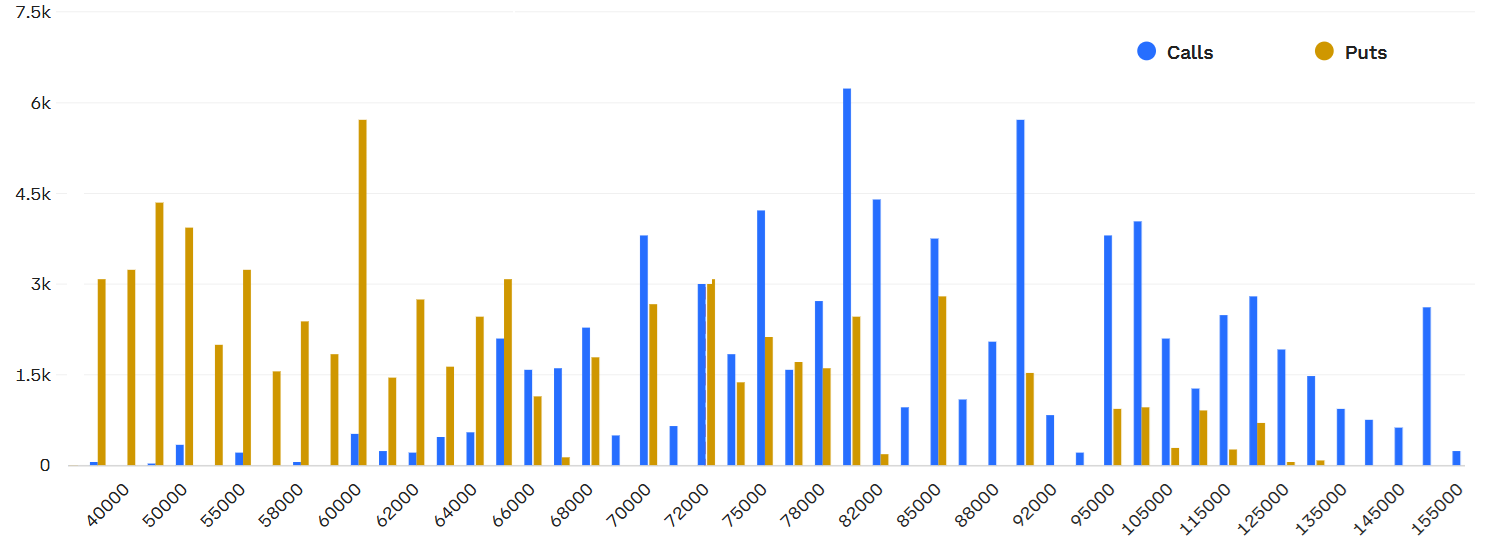
$13 billion in Bitcoin (BTC) options open interest is set to expire on June 26, potentially giving bears fresh ammunition for more downside pressure on BTC price. Bitcoin’s 14% price drop in June so far has caught bulls flat-footed, since most call (buy) options were stacked at $68,000 or higher. Will this monthly expiry open the door for a July recovery?
Deribit options dominate the scene with $10.4 billion in open interest, representing a 79% market share. OKX sits in second at 6%, followed by Binance and CME at 5% each, and Bybit with 4%. It’s worth digging into how Deribit traders are positioned ahead of the monthly expiry.
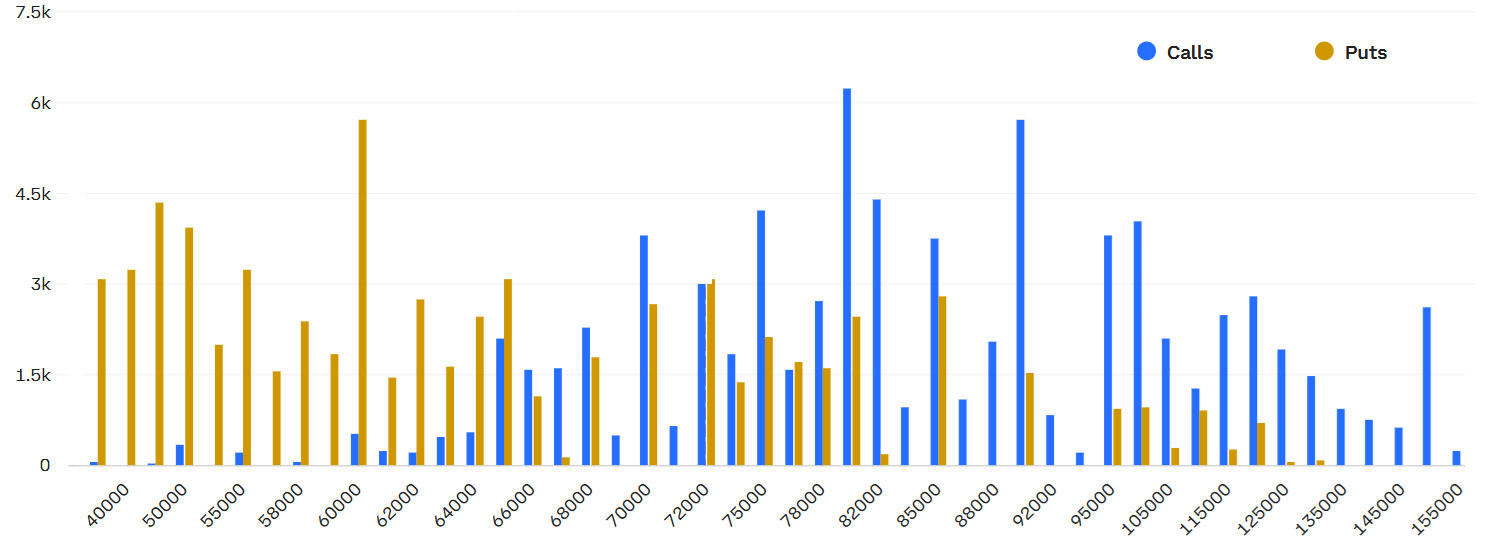
Bitcoin June 26 options open interest at Deribit, BTC. Source: Deribit
Total call options open interest at Deribit hit $6 billion, but 78% of that sits at $72,000 or higher. With less than a week to go, the effective open interest will likely shrink fast. In contrast, out of the $4.5 billion in put (sell) options open interest, only 28% hinge on Bitcoin falling to $57,000 or below. This setup makes matters significantly worse for bulls overall.
Bitcoin bulls made the wrong call on Strategy and US regulation
Some of the bulls’ over-the-top optimism traces back to Strategy’s (MSTR US) aggressive BTC buying spree in April and May. The firm added 62,841 BTC in just four weeks, helping push prices above $73,000 in May. But sentiment soured as US-listed spot Bitcoin ETFs saw outflows kick off in mid-May.
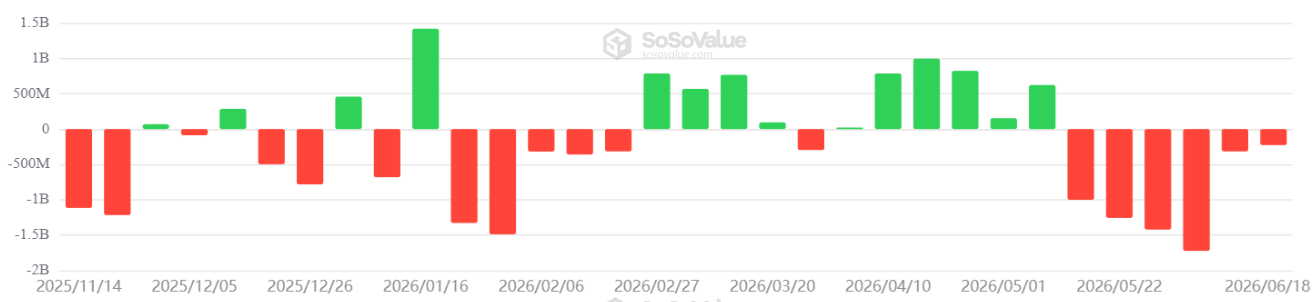
US-listed spot Bitcoin ETFs weekly net flows, USD. Source: SoSoValue
Hopes for quick passage of the Digital Asset PARITY Act in the United States also faded. The bill would have spared mining and staking rewards from taxes until sold. The market took another hit from Strategy’s sale of 32 BTC and the resulting ETF outflows, even as excitement around tech stocks grew after Google (GOOG US) and Nvidia’s (NVDA US) cash raises.
Related: Bitcoin decouples from tech stocks–Is $60K BTC’s next stop?
Bulls still have time to cut losses, but puts clearly hold the stronger hand right now. Here are four likely scenarios for Friday’s BTC options expiry at Deribit based on current price trends:
- Between $57,000 and $61,000: The net result favors the put (sell) instruments by $3.4 billion.
- Between $61,001 and $65,000: The net result favors the put (sell) instruments by $2.7 billion.
- Between $65,001 and $69,000: The net result favors the put (sell) instruments by $1.7 billion.
- Between $69,001 and $71,000: The net result favors the put (sell) instruments by $1 billion.
Even a 12% rally from the current $63,000 level won’t flip the June expiry in favor of calls. While this doesn’t lock in bear control for July, the expiry outcome will probably weigh on bullish sentiment heading into the new month.

Morgan Stanley has lodged amended S-1 registration statements with the Securities and Exchange Commission for its Solana and Ethereum ETFs.
The development is a positive sign of ongoing engagement with the regulator, while the final launch dates remain dependent on the review timeline.
Morgan Stanley Moves Closer to ETH & SOL ETF Launch
The Wall Street bank updated the filings on Thursday, disclosing that both funds would hold a 0.14% sponsorship fee. Bloomberg ETF analyst Eric Balchunas commented on the development, noting that this rate would be the lowest in the ETH and SOL ETF markets worldwide.
“Morgan Stanley Ether and Solana ETFs nearing launch. The fee on each is going to be 14bps, making them the cheapest in the U.S. and world,” he wrote.
For context, Grayscale’s Mini Ethereum Trust (ETH) offers the lowest sponsorship fee of 0.15%, while Franklin Templeton’s SOEZ ranks at the bottom among SOL ETFs with a rate of 0.19%.
The documents also show that Morgan Stanley has included staking arrangements for both investment products, with plans to stake a portion of their held assets to generate additional rewards. Figment and Galaxy Blockchain Infrastructure have been selected as the staking providers for the funds.
Furthermore, the custodians will be paid a 5% fee for their services, whilst the remaining 95% stays in the fund. For investors, this means that they can earn staking rewards as well as the potential gains from the exposure to SOL and ETH’s price.
Morgan Stanley first filed their application with the SEC for a SOL and ETH ETF in January 2026, with the latest revision being the second time they were altered. If the regulator greenlights both ETFs, the former is expected to trade under the ticker MSOL, while the latter under MSSE.
MSBT Surpasses $300M Mark
The firm also filed for its Morgan Stanley Bitcoin Trust (MSBT) around the same time and was later launched in April, debuting with $34 million on its first day and offering a competitive 0.14% sponsorship fee. The product also experienced a zero outflow streak during its first month, with only one day since then (May 29) seeing capital go out.
Meanwhile, the latest data from SoSoValue shows that spot BTC ETFs recorded a net outflow of $90.66 million on June 18, with most of these investment products remaining in the negative territory for the past few weeks. But MSBT had the largest single-day inflow of $10.43 million, bringing its total net inflow to $301 million.
The post Morgan Stanley Files Amendments, Clearing Path for Cheapest ETH, SOL ETFs appeared first on CryptoPotato.

Edinburgh Airport evacuated after ‘potentially suspicious package’ found | News UK

XRP Has an NVIDIA Connection, But is It Strong Enough This Cycle?

Early Reactions To Supergirl Are Overwhelmingly Positive As Milly Alcock Earns Widespread Praise : Coastal House Media


-

 Business5 days ago
No Jackpot Winner as $257 Million Prize Rolls Over to $269 Million Monday Draw
-
 Crypto World5 days ago
Zimbabwe Requires Crypto Businesses to Register Annually Under New FIU Regulations
-

 Crypto World7 days ago
Bitget enters Argentina’s regulated crypto market through PSAV registration
-

 Tech7 days ago
NanoClaw integrates JFrog registries to secure AI agent downloads
-
 Entertainment5 days ago
Matt Damon’s Viral Sci-Fi Thriller Has Taken Over HBO Max
-

 Business5 days ago
Anthropic staff to meet White House officials next week, Axios reports
-

 Tech5 days ago
As AI companies race to go public, who else is along for the ride?
-
 Crypto World5 days ago
Bitcoin could crash to $48,000, if this historical pattern is triggered
-

 Politics5 days ago
“Israel’s” ban on ICRC visits ruled illegal, but Knesset moves to stop them permanently
-
 NewsBeat5 days ago
Warning of disruption as Cardiff Crossrail works to start
-

 News Videos5 days ago
Financial Accounting | Last Day Revision Strategy and Booster | CMA Inter – June 2026
-
 NewsBeat5 days ago
what doctors are seeing in ebike crashes
-
 NewsBeat5 days ago
Tributes to former deputy head teacher at Cambridge school among death and funeral notices
-

 Entertainment6 days ago
Deion Sanders Shares Powerful Post After Viral Advice To Deiondra
-
 Entertainment5 days ago
Kate Middleton Glare Goes Viral After Kids Booed At Royal Event
-
 Crypto World5 days ago
XRP ETFs Outperform As Bitcoin And Ethereum Funds Extend Outflow Trend
-
 Crypto World5 days ago
Market Preview: SpaceX (SPCX) IPO Record, Federal Reserve Meeting, and Iran Nuclear Agreement
-

 Tech5 days ago
Over 400 Arch Linux packages compromised to push rootkit, infostealer
-

 Business5 days ago
Invesco Quality Income Fund Q1 2026 Commentary
-
 Entertainment7 days ago
44 Years Later, This Is the Greatest Star Trek Quote in Sci-Fi History
You must be logged in to post a comment Login