

Crypto World
Will ETH lag Bitcoin in 2026?
Ethereum has fallen harder than Bitcoin, down nearly 70% from its high while the ETH/BTC ratio sits near multi-year lows. Will Ether keep lagging the market leader through 2026, or is the underperformance setting up a reversal? Here is the case on both sides, and what would flip it.
Summary
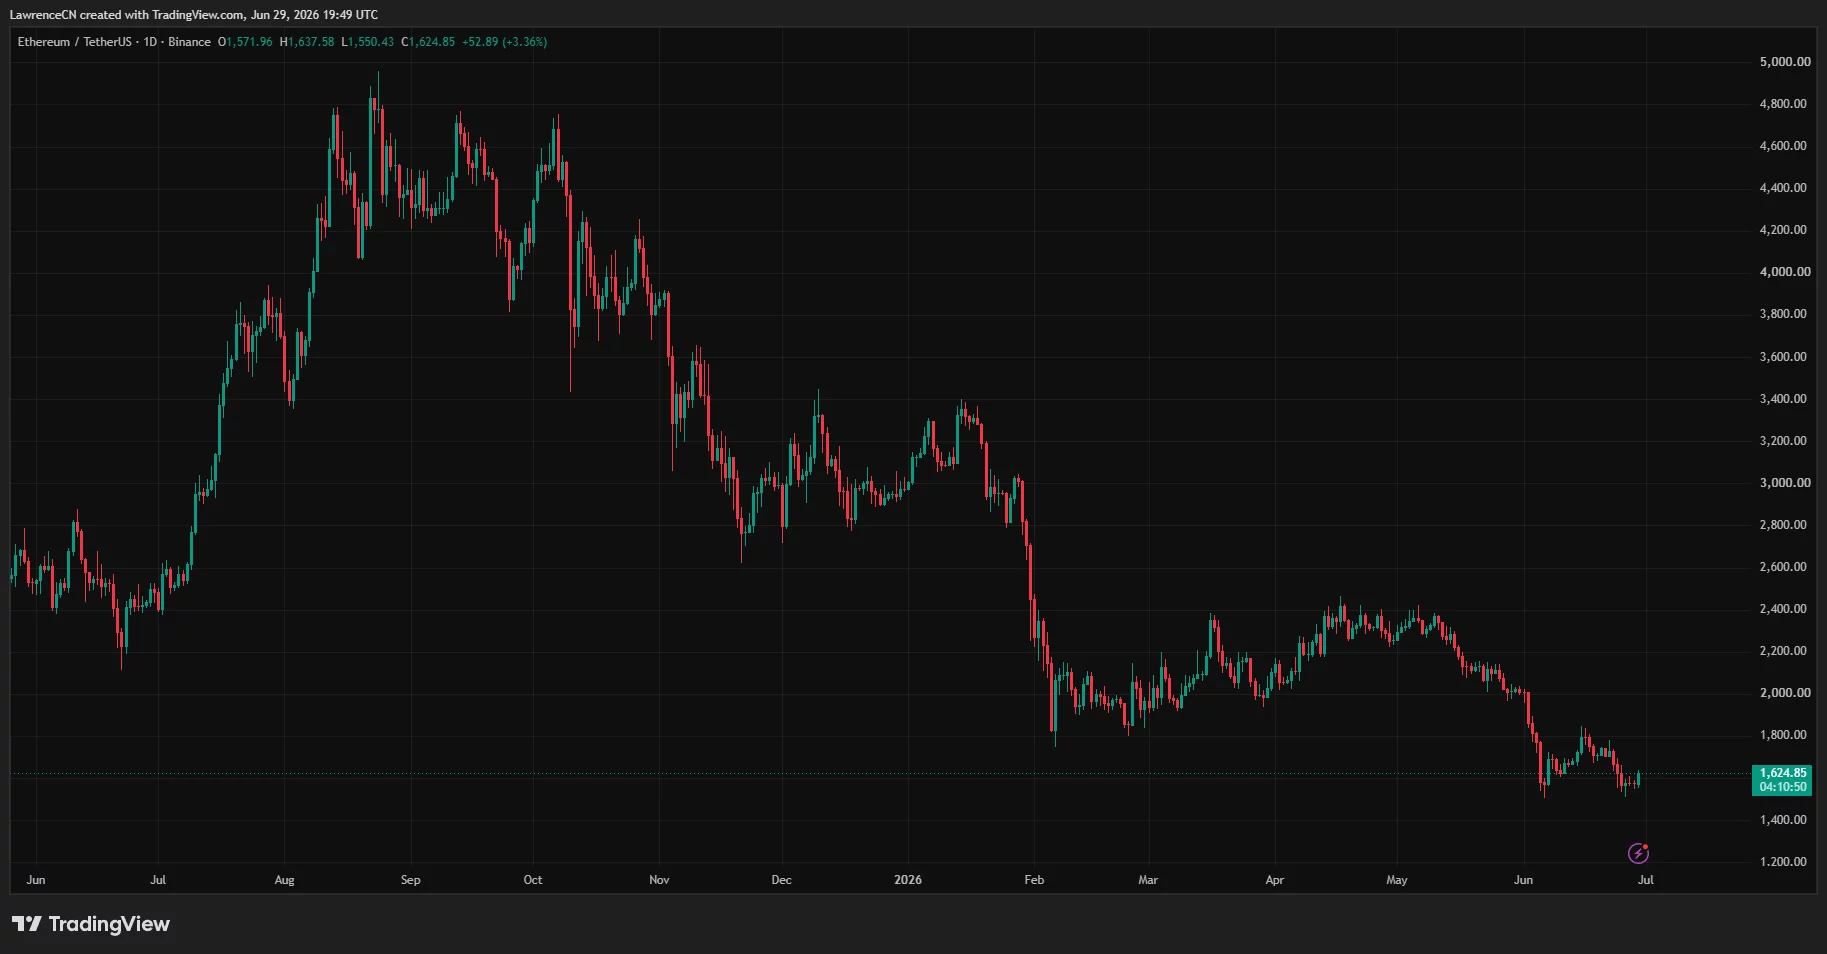
- Ethereum trades near $1,550 as of late June 2026, down roughly 68% from its August 2025 all-time high near $4,950 and below every major moving average, the weakest technical picture among the large-cap majors.
- The ETH/BTC ratio sits near multi-year lows because Ether has fallen harder than Bitcoin’s roughly 52% drawdown, extending a multi-year stretch of underperformance against the market leader.
- The case for continued underperformance rests on Bitcoin’s ETF and treasury-driven institutional dominance, competition from Solana for on-chain activity, and a muddier investment narrative for Ether.
- The case for a reversal rests on deep-value pricing, staking yield, the Layer-2 and tokenization ecosystem, potential rotation of ETF flows, and the tendency of Ether to outperform in late-cycle altcoin phases.
- Year-end forecasts span roughly $1,266 at the bearish end to $4,400 to $5,300 at the bullish end, a gap that turns on whether capital rotates back toward Ether or stays concentrated in Bitcoin.
Ethereum (ETH) is trading near $1,550 as of late June 2026, and it has fallen harder than almost any other large-cap crypto asset, which raises the question this article addresses: will Ether keep underperforming Bitcoin through the rest of 2026, or is the very depth of its decline setting up a reversal?
The numbers frame the problem starkly. Ether is down roughly 68% from its August 2025 all-time high near $4,950, a far deeper drawdown than Bitcoin’s roughly 52% fall from its own peak, and it trades below every major moving average, from the 20-day exponential average on up through the 200-day near $2,317, with a completed death cross and a relative strength index near 30.

The Fear and Greed reading sits around 13, even deeper in extreme fear than Bitcoin’s, and the $1,500 to $1,600 zone has become the line in the sand that bulls are defending; a clean loss of it opens $1,450 and then $1,400. Most tellingly for this question, the ratio of Ether’s price to Bitcoin’s sits near multi-year lows, the clearest single expression of how badly Ether has lagged the asset the market treats as its anchor.
That ratio, ETH measured against BTC, is the real subject of this piece, because the question is not only where Ether’s dollar price goes but whether it keeps losing ground to Bitcoin specifically. This article works through it from both directions: where Ethereum stands technically, what the ETH/BTC ratio actually measures and why it matters, the structural reasons Ether has underperformed, the case that the underperformance continues, the case that it reverses, what the analysts forecast, the specific conditions that would flip the ratio one way or the other, and three scenarios for both the ratio and the absolute price into year-end. The aim is to give a fair hearing to both sides, because this is a genuinely contested question on which thoughtful people disagree.
The forecasts here are information, not advice. And the framing to carry throughout is that Ether’s 2026 outcome has 2 layers: its dollar price, which depends heavily on the broad market, and its performance relative to Bitcoin, which depends on whether capital rotates back toward Ether or stays concentrated in the market leader. Both layers point to the same underlying question of whether Ethereum can reclaim the narrative momentum it has lost.
Where Ethereum stands right now
The technical condition of Ethereum is the weakest among the large-cap majors, and being honest about that is the starting point. Near $1,550, Ether trades below its 20-day, 50-day, 100-day, and 200-day exponential moving averages, the last of which sits up near $2,317, meaning price is far beneath even its slowest-moving trend line. A death cross, the bearish crossover of shorter and longer averages, has completed, confirming the downtrend on the technical framework many traders use.
The relative strength index near 30 indicates oversold conditions and weak buying momentum, and the broader structure since the spring has been one of lower highs and lower lows, with sellers in control through a steep decline from the $2,000-plus range earlier in the year down to the current zone. The $1,500 to $1,600 area is the critical support, having acted as the 2026 floor, and below it the next levels are $1,450 and $1,400.
Sentiment is correspondingly grim. The Fear and Greed reading around 13 is a deeper extreme fear than Bitcoin’s, reflecting how thoroughly the market has soured on Ether specifically. The drawdown of roughly 68% from the August 2025 high near $4,950 is severe even by crypto standards and significantly worse than Bitcoin’s contemporaneous decline, which is the heart of the underperformance story. To improve the picture,
Ether needs, at minimum, to reclaim short-term resistance near $1,700 to $1,750, and a genuine trend change would require recovering the higher averages up toward $2,000 and then $2,317. Until then, the structure is bearish, and the burden of proof sits with buyers.
This is the uncomfortable backdrop against which the underperformance question must be answered: Ether is not merely down; it is down harder than Bitcoin, deeper in fear, and weaker on the charts, which is exactly why some see capitulation and opportunity while others see a structurally lagging asset with further to fall.
What the ETH/BTC ratio is telling us
To analyze underperformance properly, you have to understand the ETH/BTC ratio, because it strips out the broad market and isolates the question of Ether versus Bitcoin specifically. The ratio simply expresses Ether’s price in terms of Bitcoin rather than dollars, and it rises when Ether outperforms Bitcoin and falls when Ether lags. Right now it sits near multi-year lows, which is the precise, quantified statement of the problem: over an extended period, and especially through the 2025 to 2026 drawdown, Ether has lost value against Bitcoin, not just against the dollar. When both assets fall, but one falls more, the ratio captures the difference, and Ether’s roughly 68% drawdown against Bitcoin’s roughly 52% means Ether has shed a meaningful chunk of its value relative to the market leader.
Why does this matter beyond bookkeeping? The ETH/BTC ratio is one of the most-watched gauges in crypto because it functions as a barometer of risk appetite and capital rotation within the asset class. When the ratio rises, it typically signals that capital is rotating out of Bitcoin and into Ether and the broader altcoin complex, the classic risk-on, altcoin-season dynamic. When it falls, as now, it signals that capital is concentrating in Bitcoin, treating it as the safer, more institutionally endorsed crypto asset while shunning the higher-beta alternatives.
A ratio near multi-year lows therefore tells a story: the market, in its current risk-off and Bitcoin-dominated mood, has been choosing Bitcoin over Ether decisively. For the question of whether Ether underperforms again in 2026, the ratio is both the scoreboard and the leading indicator.
A continued decline or stagnation in the ratio means underperformance persists; a sustained turn upward would be the clearest sign that Ether is regaining ground. Everything that follows, the structural arguments and the catalysts, ultimately expresses itself through which way this ratio moves.
Why Ethereum has underperformed
Understanding the causes of Ether’s underperformance is essential to judging whether it continues, and several structural forces have converged against it. The 1st and arguably most important is the institutional bid for Bitcoin that Ether has not matched in kind.
Spot Bitcoin ETFs and a wave of corporate Bitcoin treasuries have created sustained, price-insensitive demand that treats Bitcoin as digital gold and a primary reserve asset, a role with no clear Ether equivalent. While Ether has its own ETFs, the institutional narrative around Bitcoin as a macro reserve asset has been far more powerful, channeling the bulk of institutional crypto allocation toward Bitcoin and leaving Ether to compete for a smaller, more speculative pool of capital. In a risk-off market, that distinction is decisive: capital flows to the asset with the strongest institutional endorsement, which has been Bitcoin.
The 2nd force is competition for Ethereum’s core use case. Solana and other high-throughput chains have captured a large share of the on-chain activity, particularly the memecoin and high-frequency trading culture, that once would have flowed to Ethereum, challenging Ether’s status as the default smart-contract platform and muddying its growth narrative.
The 3rd is a narrative problem of Ether’s own. Following its technical upgrades, the relationship between network activity and value accrual to the token has become more complicated, with much activity migrating to Layer-2 networks whose fees do not always translate cleanly into demand for Ether, leaving the investment case harder to articulate than Bitcoin’s simple scarcity story.
Together, these forces- Bitcoin’s institutional dominance, Solana’s competitive pressure, and a muddier value-accrual narrative- explain why capital has favored Bitcoin and why the ETH/BTC ratio has fallen to multi-year lows. They are real and structural, not merely cyclical, which is what gives the continued-underperformance thesis its force.
The case that the underperformance continues
The bearish-on-ratio case holds that the forces just described are durable and that Ether keeps lagging Bitcoin through 2026. Its strongest pillar is that the institutional preference for Bitcoin is structural rather than temporary. As long as the dominant institutional narrative casts Bitcoin as the crypto reserve asset and digital gold, with ETFs and treasuries channeling allocation toward it, Ether will struggle to attract a comparable bid, and in any risk-off phase capital will continue concentrating in Bitcoin.
This is not a sentiment that flips quickly; it reflects how large allocators have categorized the two assets, and that categorization has only deepened through the current drawdown. On this view, the ETH/BTC ratio at multi-year lows is not an anomaly poised to mean-revert but the accurate reflection of a lasting shift in how the market values the two.
The competitive and narrative pillars reinforce the case. If Solana and other chains continue to capture on-chain activity and developer attention, Ethereum’s growth story weakens further, and a weakening fundamental narrative makes it harder for Ether to outperform regardless of price level. The muddled value-accrual picture, with activity on Layer-2 networks not cleanly driving Ether demand, means that even genuine ecosystem growth may not translate into the token appreciation that would lift the ratio. Bears also note that Ether’s deeper drawdown is itself a warning: an asset that falls harder than the market leader in a downturn is displaying higher beta and weaker relative strength, traits that tend to persist until a clear catalyst changes them.
In this reading, the most likely path for 2026 is that Ether’s dollar price may rise or fall with the broad market, but it continues to underperform Bitcoin specifically, with the ratio grinding sideways to lower, because none of the structural forces working against it have meaningfully reversed. The underperformance, on this thesis, is a feature of the current market regime, not a temporary dislocation.
The case for a reversal
The bullish-on-ratio case is equally serious and rests on the proposition that Ether’s underperformance has gone far enough to create the conditions for its own reversal. The 1st pillar is deep value. After a 68% drawdown that has driven Ether to multi-year lows against Bitcoin and into extreme fear, the bull argument is that the selling has been overdone, that much of the bad news, the competition, the narrative confusion, the risk-off flight to Bitcoin, is now priced in, and that assets this oversold relative to the leader have historically offered strong mean-reversion potential when sentiment turns.
The 2nd pillar is Ether’s genuine fundamental base, which remains the deepest in the smart-contract world: it anchors the largest decentralized finance ecosystem, hosts the bulk of tokenized real-world asset activity, supports a sprawling Layer-2 network of scaling solutions, and offers a staking yield that gives holders a return Bitcoin does not. These are real assets that a reversal thesis can build on.
The 3rd pillar is the potential for capital rotation, which is how ratio reversals historically happen. In past cycles, after Bitcoin leads a move and its dominance peaks, capital has frequently rotated into Ether and the broader altcoin complex in a late-cycle altcoin season that drives the ETH/BTC ratio sharply higher, and bulls argue the current extreme in Bitcoin dominance and Ether weakness is exactly the kind of setup that precedes such a rotation.
Specific catalysts could trigger it: ETF flows rotating from Bitcoin toward Ether, particularly if Ether ETF staking features attract yield-seeking institutional capital; a stumble in Solana’s momentum that returns activity and attention to Ethereum; a broad macro shift to risk-on that lifts the higher-beta assets most; and the growth of tokenization and institutional finance building on Ethereum translating into clearer token demand.
On this view, the very severity of Ether’s underperformance, the multi-year-low ratio and the extreme fear, is the contrarian signal, and 2026 could be the year the ratio turns as capital rotates back toward a deeply discounted asset with the strongest fundamental ecosystem in its category. The reversal is not guaranteed, but it is a coherent thesis grounded in real catalysts and historical precedent.
What the analysts forecast
The analyst forecasts for Ether’s dollar price in 2026 span a wide range that maps onto the underperformance debate. On the bearish side, model-driven and cautious forecasters see continued weakness: Traders Union’s statistical model projects a year-end average near $1,266, and DigitalCoinPrice has pointed to a 4th-quarter low around $1,370, both implying Ether stays near or below current levels and, by extension, likely keeps underperforming a Bitcoin that most forecasters see holding higher absolute levels. These bearish targets are consistent with the thesis that the structural forces against Ether persist and that the ratio does not recover.
On the bullish side, forecasters such as BitScreener have projected Ether reaching toward $4,676 by year-end, and others, including Cryptopolitan and the optimistic scenarios at LiteFinance, point to ranges of roughly $4,400 to $5,300, which would imply a powerful recovery and, if Bitcoin does not rise proportionally, a sharp improvement in the ETH/BTC ratio.
The gap between roughly $1,266 and $5,300 for the same asset in the same year is enormous, and like Bitcoin and XRP, it reflects genuine uncertainty rather than careless modeling. The bearish numbers assume the structural underperformance continues and Ether stays pinned near its lows; the bullish numbers assume a reversal driven by rotation, deep-value mean reversion, and Ether’s fundamental strengths reasserting themselves.
What the forecasts collectively reveal is that Ether’s 2026 outcome is even more binary than Bitcoin’s, because it depends not only on the direction of the broad market but on whether capital rotates back toward Ether specifically. An investor who believes the rotation comes will lean toward the high forecasts; one who believes Bitcoin’s dominance is structural will lean toward the low ones.
The forecasts cannot settle the debate; they can only show how much rides on it. For the underperformance question specifically, the spread is a reminder that Ether is the higher-variance bet, capable of both deeper losses and sharper recoveries than the market leader, which is precisely the profile of an asset whose relative performance is genuinely up for grabs.
What would flip the ratio, and what would keep it down
The underperformance question ultimately resolves into a set of watchable conditions, and naming them is more useful than guessing. The ratio would flip in Ether’s favor on several developments. The clearest would be a broad rotation into altcoins, the classic late-cycle dynamic in which Bitcoin dominance peaks and capital flows down the risk curve into Ether first; a sustained turn upward in the ETH/BTC ratio off its multi-year lows would be the signal that this is underway. ETF flows rotating toward Ether, especially if staking-enabled Ether products draw yield-seeking institutional capital, would provide a concrete demand catalyst.
A stumble in Solana’s momentum that returns on-chain activity and developer attention to Ethereum would repair the competitive narrative. A macro shift to risk-on, with the Federal Reserve easing and liquidity improving, would favor the higher-beta asset, which is Ether. And technically, reclaiming resistance near $1,700 to $1,750 and then the higher averages toward $2,000 and $2,317 would confirm a trend change. If these align, the reversal thesis gains the upper hand.
The conditions that keep Ether underperforming are the mirror image. Continued institutional concentration in Bitcoin, with ETFs and treasuries channeling allocation toward the market leader and away from Ether, would preserve the structural imbalance. Ongoing Solana strength and further erosion of Ethereum’s on-chain dominance would keep the fundamental narrative weak.
A persistent risk-off market would keep capital huddled in Bitcoin instead of rotating into higher-beta Ether. And technically, a loss of the $1,500 support that opens $1,450 and $1,400 would confirm that sellers remain in control and that the ratio is still falling. The practical discipline for anyone watching this question is to track the ETH/BTC ratio directly as the scoreboard, alongside Bitcoin dominance, ETF flow data, Solana’s activity trends, and the macro backdrop. Those signals will reveal whether 2026 is another year of Ether lagging the leader or the year the long underperformance finally reverses. The market will answer the question through the ratio; the job is to watch it instead of to assume.
Three scenarios for Ethereum in 2026
Translating the debate into scenarios captures both the dollar price and the relative-performance dimension. In the bull scenario, the underperformance reverses. Capital rotates into Ether in a late-cycle altcoin phase, ETF flows and staking demand pick up, Solana’s momentum cools, the macro turns risk-on, and Ether recovers toward the $4,400 to $5,300 range that the optimistic forecasts describe, with the ETH/BTC ratio turning sharply higher off its multi-year lows.
In this world, Ether not only rises in dollar terms but decisively outperforms Bitcoin, rewarding the deep-value and rotation thesis. It is a coherent path, grounded in historical precedent and real catalysts, but it requires the structural forces that have favored Bitcoin to loosen.
In the base scenario, Ether broadly tracks the market without a clean resolution of the underperformance question. It stabilizes around current levels, recovers modestly if the broad market does, but continues to lag Bitcoin or merely matches it, with the ETH/BTC ratio grinding sideways near its lows instead of reversing decisively. Ether’s dollar price spends 2026 in a wide, volatile band, and the relative-performance question stays unresolved into 2027. This middle path reflects how balanced the structural arguments are and is a reasonable central expectation. In the bear scenario, the underperformance deepens.
Bitcoin’s institutional dominance persists, Solana continues to pressure Ethereum, the market stays risk-off, Ether loses the $1,500 support and slides toward $1,400 and below, validating the bearish forecasts near $1,266, and the ETH/BTC ratio falls further as capital keeps choosing Bitcoin. Which scenario unfolds depends on capital rotation, ETF flows, the Solana competition, and the macro backdrop, all of which express themselves through the ETH/BTC ratio. All 3 are live, and the breadth between them is exactly why Ether is the higher-variance bet among the majors heading into the rest of 2026.
Frequently Asked Questions
Will Ethereum underperform Bitcoin in 2026?
It is truly contested. Ether has underperformed Bitcoin badly, down roughly 68% from its 2025 high versus Bitcoin’s roughly 52%, pushing the ETH/BTC ratio to multi-year lows. The case for continued underperformance rests on Bitcoin’s structural institutional dominance through ETFs and treasuries, competition from Solana for on-chain activity, and a muddier value-accrual narrative for Ether. The case for a reversal rests on deep-value pricing after the severe drawdown, Ether’s strong fundamental ecosystem and staking yield, and the potential for capital to rotate into Ether in a late-cycle altcoin phase. The deciding signal is the ETH/BTC ratio itself; a sustained turn higher would mark a reversal, while continued weakness would confirm more underperformance.
Why has Ethereum fallen harder than Bitcoin?
Several structural forces have weighed on Ether more than Bitcoin. The biggest is the institutional bid for Bitcoin as digital gold and a reserve asset, channeled through ETFs and corporate treasuries, with no equally powerful equivalent for Ether. Competition from Solana and other high-throughput chains has captured on-chain activity that once flowed to Ethereum, weakening its growth narrative. And Ether’s value-accrual story has grown more complicated, with much activity migrating to Layer-2 networks whose fees do not cleanly translate into demand for the token. In a risk-off market, capital concentrates in the asset with the strongest institutional endorsement, which has been Bitcoin, leaving higher-beta Ether to fall harder.
What is the ETH/BTC ratio and why does it matter?
The ETH/BTC ratio expresses Ether’s price in terms of Bitcoin instead of dollars; it rises when Ether outperforms Bitcoin and falls when Ether lags. It matters because it strips out the broad market and isolates the question of Ether versus Bitcoin specifically, and because it functions as a barometer of risk appetite and capital rotation within crypto. A rising ratio typically signals capital rotating out of Bitcoin into Ether and altcoins, the classic altcoin-season dynamic; a falling ratio, as now near multi-year lows, signals capital concentrating in Bitcoin. For the underperformance question, the ratio is both the scoreboard and the leading indicator, so watching it directly is the best way to judge whether Ether is regaining or losing ground.
What would make Ethereum outperform again?
A reversal would likely require capital rotation into Ether, the late-cycle dynamic in which Bitcoin dominance peaks and money flows into Ether and altcoins, signaled by the ETH/BTC ratio turning up off its lows. Concrete catalysts include ETF flows rotating toward Ether, especially staking-enabled products attracting yield-seeking capital; a stumble in Solana’s momentum returning activity to Ethereum; a macro shift to risk-on that favors higher-beta assets; and Ether reclaiming technical resistance near $1,700 to $1,750 and then the higher averages toward $2,000 and $2,317. The bull thesis also leans on deep value after the 68% drawdown and Ether’s strong fundamentals in decentralized finance, tokenization, Layer-2s, and staking. If these align, the long underperformance could reverse in 2026.
What are analysts forecasting for Ethereum in 2026?
The range is very wide. Bearish, model-driven forecasts see continued weakness, with Traders Union projecting a year-end average near $1,266 and DigitalCoinPrice pointing to a 4th-quarter low around $1,370, implying Ether stays near its lows. Bullish forecasts are far higher, with BitScreener toward $4,676 and others, including Cryptopolitan and optimistic scenarios at LiteFinance, in the $4,400 to $5,300 range, implying a strong recovery. The gap from roughly $1,266 to $5,300 reflects genuine uncertainty: the low end assumes structural underperformance continues, while the high end assumes a reversal driven by rotation and deep-value mean reversion. Ether’s outcome is more binary than Bitcoin’s because it depends on whether capital rotates back toward Ether specifically.
Is Ethereum a better buy than Bitcoin right now?
This article does not give buy recommendations, and the honest answer is that it depends entirely on the question it examines. Ether offers higher potential reward if the underperformance reverses, because it is more deeply discounted and has more room to mean-revert, but it carries higher risk because the structural forces favoring Bitcoin- institutional dominance, Solana competition, and a muddier narrative- may persist. Bitcoin has been the safer, more institutionally endorsed asset that capital has favored in the risk-off market. Choosing between them is really a bet on whether capital rotates back toward Ether in 2026 or stays concentrated in Bitcoin, which is the unresolved question at the center of this analysis. Both are highly volatile and can lose value.
This article is information, not financial or investment advice. Ethereum and Bitcoin price levels, the ETH/BTC ratio, indicator readings, and analyst forecasts reflect data available as of June 28, 2026, are point-in-time, and can change rapidly. Cryptocurrency is highly volatile, and you can lose money. Price predictions are inherently uncertain, and the scenarios described are not guarantees. Do your own research and consult a qualified financial professional before making any investment decision.


Key Takeaways
- Alphabet (GOOGL) jumped 3.7% to $350.24 during its inaugural trading session as a Dow Jones Industrial Average constituent, taking over from Verizon Communications.
- The index reshuffle was revealed by S&P Dow Jones Indices on June 23; Alphabet’s elevated share price makes it one of the Dow’s heaviest-weighted stocks.
- With this addition, five of the Magnificent Seven tech giants—Alphabet, Nvidia, Amazon, Apple, and Microsoft—are now Dow components.
- Reports indicate Google has restricted Meta Platforms’ access to Gemini AI infrastructure as computing resource demand reaches unprecedented levels.
- Cloud services revenue at Alphabet surged 63% in Q1 2026—the fastest expansion since the segment’s disclosure began in 2019—with projections hitting $480 billion by 2031.
Alphabet (GOOGL) made its official entrance into the Dow Jones Industrial Average on Monday, and investors responded enthusiastically. Shares advanced 3.7% to reach $350.24 during its debut session as a Dow constituent.
S&P Dow Jones Indices publicly disclosed the index modification on June 23. Alphabet secured the position formerly occupied by Verizon Communications, which ranked among the index’s least impactful members.
Given the Dow’s price-weighted methodology, Alphabet instantly assumes significant influence within the 30-company benchmark. Its premium share valuation grants it substantially greater weight than Verizon commanded.
This development elevates the Magnificent Seven representation in the Dow to five companies. Alphabet now joins Nvidia, Amazon, Apple, and Microsoft within this prestigious index.
The previous restructuring occurred in November 2024, when Nvidia and Sherwin-Williams displaced Intel and Dow Inc.
Passive funds that replicate the Dow must acquire GOOGL shares to maintain proper index tracking. Approximately $115 billion in assets were indexed or benchmarked to the Dow as of December 31, 2024—considerably less than the roughly $20 trillion following the S&P 500, where Alphabet already maintains membership.
Consequently, mandatory purchasing activity stemming from this index revision remains modest compared to potential S&P 500 inclusion.
Tech Giants Rebound and Gemini Capacity Constraints
Monday’s upward movement extended beyond mere index mechanics. The broader Magnificent Seven cohort experienced a robust recovery. Meta, Amazon, and Tesla each advanced over 3%. Nvidia and Microsoft recorded gains exceeding 1%. Apple trailed with a modest 0.1% increase.
The Roundhill Magnificent Seven ETF had declined 13% throughout June leading up to Friday—tracking toward its steepest monthly decline since its April 2023 inception. Monday provided welcome respite.
Additional developments contributed momentum to Alphabet’s rally. The Financial Times disclosed that Google has been throttling Meta Platforms’ access to its Gemini AI infrastructure, alongside certain smaller customers, citing overwhelming demand for computational resources.
Neither Google nor Meta provided immediate commentary on the matter.
Cloud Expansion Validates AI Investment Thesis
While restricting client access might superficially suggest revenue constraints, it actually underscores extraordinary demand for Google’s artificial intelligence capabilities.
Alphabet’s cloud business delivered 63% revenue expansion in Q1 2026—representing the division’s most robust performance since the company initiated segment reporting in 2019.
TD Cowen analyst John Blackledge projects cloud revenue will compound at a 37% annual rate, escalating from approximately $100 billion this year to $480 billion by 2031.
Alphabet shares had appreciated roughly 11% year-to-date through the preceding Friday, positioning it among the strongest performers within the Magnificent Seven collective this year.


The chances of the CLARITY Act becoming law in 2026 have narrowed after Galaxy Digital reduced its approval odds to 50%, even as Senate Republicans continue pushing for a vote when lawmakers return from recess.
Summary
- Galaxy Digital has lowered the probability of the CLARITY Act becoming law in 2026 to 50% despite ongoing Senate negotiations.
- Senator Tim Scott has backed a July Senate vote while lawmakers continue working to resolve key policy differences.
- Negotiators are still discussing ethics rules, anti-money laundering measures, and digital asset market oversight before the Senate returns.
According to journalist Eleanor Terrett, congressional staff, White House officials, and crypto industry representatives have continued negotiating behind closed doors while the U.S. Senate remains in recess until July 13. Their discussions are focused on resolving differences between separate versions of the crypto market structure bill produced by the Senate Banking and Agriculture Committees before senators reconvene.
The negotiations are centered on several unresolved issues, including ethics requirements, anti-money laundering provisions, and the framework for regulating digital asset markets. Reaching agreement on those points is considered necessary before the legislation can move toward a Senate floor vote.
July timeline faces procedural hurdles
Even if negotiators finalize the bill before lawmakers return, the Senate calendar could delay its progress.
Terrett reported that Senate Majority Leader John Thune has indicated that the National Defense Authorization Act will take priority once the Senate resumes work in mid-July. As a result, consideration of the CLARITY Act could slip to the latter half of July or even the opening week of August.
The timing has become increasingly important because many observers believe the legislation needs Senate approval before Congress leaves for its August recess. Missing that legislative window could make it substantially harder for the bill to advance before the end of the 2026 congressional session.
Passing the measure will also require bipartisan support. The legislation needs at least 60 votes in the Senate, while Republicans currently hold 53 seats. Full Republican backing is not guaranteed, as Senators Josh Hawley and Rand Paul opposed the earlier GENIUS Act, making Democratic support important for the CLARITY Act as well.
Republican support remains intact despite lower approval odds
Although negotiations remain unfinished, senior Republicans have continued encouraging a July vote.
In a recent post on X, Senator Tim Scott endorsed Majority Leader John Thune’s proposed timeline for bringing crypto market structure legislation before the Senate. Scott said the bipartisan proposal would provide clearer regulatory rules for digital assets, strengthen consumer protections, and help keep innovation in the United States. He also urged lawmakers to move the legislation forward for the benefit of Americans.
While Republican leaders continue pressing ahead, market expectations have become more cautious. Galaxy Digital has lowered its estimate for the CLARITY Act’s chances of becoming law in 2026 to 50%, highlighting the political and procedural challenges that still remain before the legislation can clear the Senate.
The next two weeks are expected to play a decisive role as negotiators work to settle outstanding policy differences before senators return to Washington. Whether those talks produce a compromise could determine if the CLARITY Act reaches the Senate floor in July or loses momentum ahead of Congress’s summer recess.

TLDR:
- Chainlink holder count climbed to 892.8K Ethereum wallets after adding more than 8K holders in five days.
- Recent wallet growth accelerated sharply and pushed LINK closer to the 900K holder milestone.
- Santiment linked the increase to growing interest in tokenized assets and institutional blockchain projects.
- LINK holder growth continued even while the token traded near recent local price lows.
Chainlink has surpassed another important adoption milestone amid the recent surge in wallet growth over the last few days. The network now has 892,800 non-empty Ethereum wallets, which have swelled by over 8,000 in the last five days, according to fresh on-chain data.
The boost is part of a growing spotlight on the crypto market on tokenized assets and institutional blockchain projects. Despite LINK trading near recent lows, the latest stats suggest more people are joining the network.
Chainlink Holder Count Rises as More Wallets Join the Network
On-chain analytics platform Santiment reported that Chainlink’s holder count has entered a much steeper growth phase. The platform tracks non-empty Ethereum wallets holding LINK.
Its latest data shows the network added more than 8,000 holders over five days. That pushed the total number of wallets holding LINK to roughly 892,800.
The recent increase stands out from previous growth trends. According to Santiment, Chainlink could move beyond the 900,000-holder mark before the week ends if the current pace continues.
Holder growth remains one of the clearest ways to measure network adoption. A larger holder base often reflects increasing participation across an ecosystem, regardless of short-term market movements.
While price often attracts the headlines, wallet data can tell a different story. In Chainlink’s case, more users continue entering the network even as LINK remains close to recent local lows.
Institutional Blockchain Activity Keeps Chainlink in Focus
Santiment linked the recent wallet expansion to several developments involving real-world assets and institutional finance.
These include Project Pangea, DTCC’s collateral initiatives, tokenized assets, and 24/5 equity data streams.
Chainlink has become part of a growing number of blockchain projects supporting tokenized financial infrastructure.
Its oracle network provides external data that decentralized applications and financial platforms rely on. The latest wallet figures arrived during a period when institutional blockchain projects continue expanding.
Real-world asset tokenization has also remained one of the industry’s most active development areas throughout the year.
Although LINK has yet to stage a major price recovery, wallet growth has continued moving higher.
Santiment noted that the increase in holders has taken place while the token trades near local lows, suggesting network participation continues to build despite subdued market conditions.
Chainlink’s expanding holder base adds another metric to watch as adoption develops across the ecosystem. The latest on-chain figures show users continue accumulating LINK while institutional blockchain and tokenized asset initiatives remain active across the broader crypto market.


Securitize, a tokenization specialist backed by BlackRock, said Monday it cleared a final major hurdle to becoming a public company after shareholders of Cantor Equity Partners II (CEPT) approved the firms’ proposed merger on Monday.
The transaction is expected to close on Wednesday, subject to customary closing conditions, with the combined company beginning trading Thursday on the New York Stock Exchange under the ticker SECZ, the company said in an X post.
Shares of CEPT surged as much as 20% during the Monday session.
Founded in 2017, Securitize has become one of the leading providers of tokenization infrastructure, helping asset managers including BlackRock, Apollo, KKR and VanEck issue blockchain-based versions of traditional investment products. The company counts BlackRock and ARK Invest among its early investors.
The listing comes as tokenization — the process of representing traditional assets such as funds, bonds and private credit on blockchain networks — gains traction across Wall Street. Citi has projected tokenized assets could reach $5.5 trillion by 2030, while Standard Chartered estimated the market could grow to $2 trillion by 2028 as financial institutions increasingly move real-world assets onto blockchain rails.
The NYSE debut will give public market investors one of the few pure-play opportunities to gain exposure to the rapidly growing tokenization sector.
The UK’s Financial Conduct Authority (FCA) has published its landmark crypto regulatory framework, marking the completion of its crypto roadmap seeking to bring digital assets under the regulator’s purview.
Significant new elements include mandatory licensing for crypto firms, capital stress-testing requirements, improved market manipulation and insider trading rules, as well as simplified capital requirement standards for stablecoin issuers, according to a Tuesday press release shared with Cointelegraph.
The licensing window for crypto companies will open from September until Feb. 28, 2027, before the regime goes live on Oct. 25, 2027.
The new framework means that crypto companies in the UK will be held to “similar standards” as other financial service providers in the country, wrote David Geale, executive director of payments and digital finance at the FCA, adding:
“We’ve created a framework that doesn’t force firms to choose between regulatory certainty and room to innovate – this regime means they can have both in a stable, competitive home to build and grow.”
Cryptocurrency firms, including trading platforms, custodians, stablecoin issuers, staking companies and other intermediaries, must obtain FCA authorization to operate in the UK under the new framework.
The framework comes nearly a month after the regulator concluded its consultation window on the guidelines for the country’s future crypto regime on June 3.

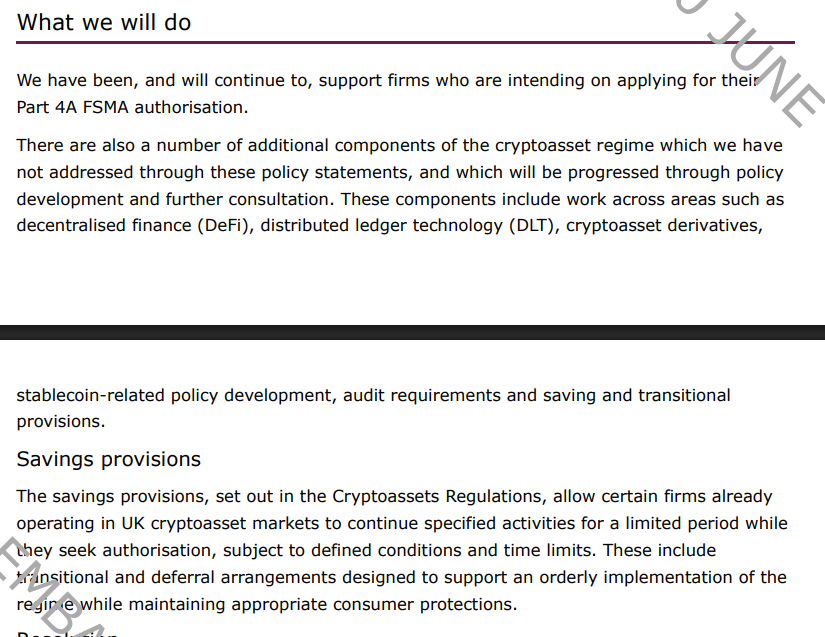
Overview of FCA crypto regime, next steps and savings provisions. Source: FCA
AML-authorized crypto firms need new licenses in the UK
Crypto firms with existing authorization under the money laundering regulations will not have their licenses automatically converted and will have to obtain new authorization.
Certain companies already operating in the UK may continue specified activities for a limited period as they seek authorisation under the framework’s transitional “savings provisions.”
The FCA said that pre-application support meetings for companies will be available starting next month.
The regulator will set out its policy statements during a webinar on July 17. It will also publish a further policy statement in September to establish how the regulatory perimeter applies to cryptoasset activities.
Related: Aave Labs’ Push gains UK FCA crypto registration
FCA simplifies stablecoin capital standards, promises tailored DeFi guidance
The FCA has maintained the core stablecoin framework but made minor adjustments, including simplifying the backing asset composition requirement by no longer requiring estimated redemption forecasts, adding requirements for statutory trust over reserves and removing unallocated backing fund accounts.
The guidelines will also require issuers to offer specific withdrawal rights to users, permit a 5% excess to be held in the backing asset pool and allow limited intragroup custody subject to safeguards.
The FCA noted that this establishes a “baseline regime for stablecoin issuance” and added that it will consult with the Bank of England later this year on how the the agency’s rules will apply to stablecoin issuers recognized as systemic by HM Treasury.
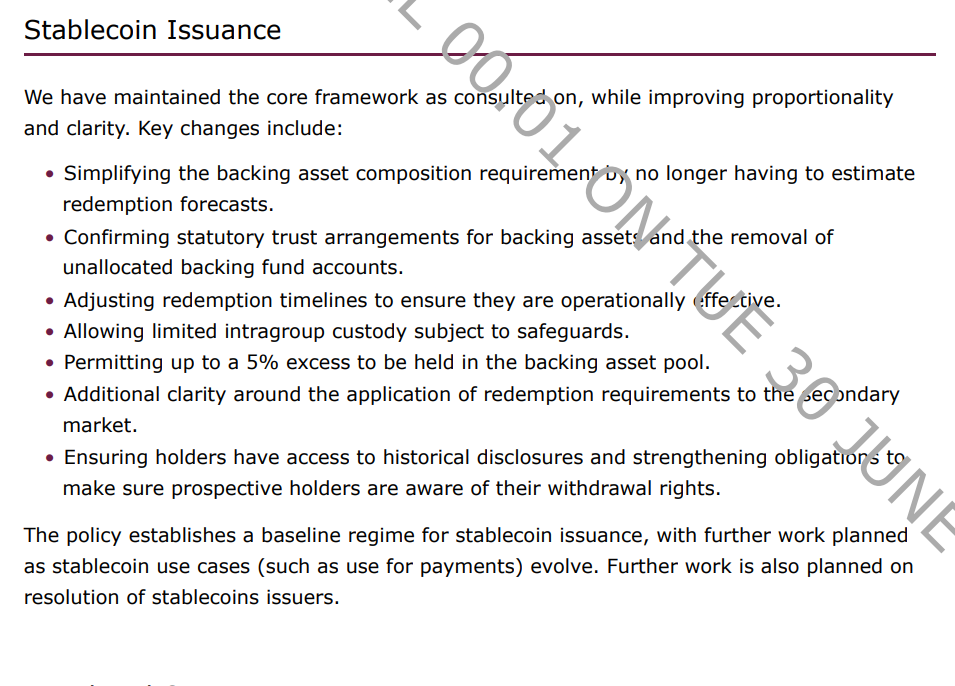
New guidelines for stablecoin issuance. Source: FCA
Later this year, the FCA will also host a separate consultation on decentralized finance (DeFi) guidance and operational resilience guidelines for firms using distributed ledger technology (DLT).
It also plans to consult on updates to the Financial Crime Guide relevant to crypto asset firms.
“We’re going to continue to work on DeFi,” said Matthew Long, director of payments & digital assets at the FCA, adding that they are seeking a case-by-case approach as “true DeFi” with “no identifiable person undertaking the activity” will fall out of the scope of the regulation.
Magazine: How crypto laws changed in 2025 — and how they’ll change in 2026

Key Points
- Shares of Velo3D advanced 7.1% Monday following the company’s inclusion in both the Russell 3000 and Russell Microcap indexes
- The metal 3D printing firm officially entered both benchmarks on June 29 during the 2026 annual reconstitution process
- Approximately $12.2 trillion in investment assets track Russell US indexes based on May 2026 data
- The company’s market capitalization reached around $496 million, with shares posting gains exceeding 126% year-over-year
- The additive manufacturing specialist will maintain Russell 3000 membership through December 2026’s next reconstitution
Shares of metal additive manufacturing specialist Velo3D (VELO) rallied 7.1% Monday following the company’s addition to both the Russell 3000 Index and Russell Microcap Index, which became effective June 29.
The inclusion occurred during the initial 2026 reconstitution of Russell indexes, an annual process that evaluates and ranks the top 4,000 U.S. companies by total market capitalization based on April 30 data.
For smaller publicly traded companies, Russell index inclusion carries significant weight. As of late May 2026, approximately $12.2 trillion in investment capital was benchmarked to Russell US indexes.
This massive pool of passive investment capital typically flows into newly added stocks, as fund managers who track these indexes must purchase shares to maintain accurate index representation.
Prior to Monday’s announcement, VELO had already demonstrated impressive momentum. Over the preceding 12-month period, the stock had appreciated more than 126%, bringing its market capitalization to approximately $496 million entering June.
CEO Arun Jeldi expressed enthusiasm about the development. “Being added to the Russell 3000 and Russell Microcap indexes is an important milestone for Velo3D,” he stated.
“We have made meaningful strides in transforming the company, advancing our technology leadership, and creating value for shareholders. Inclusion in these widely followed indexes broadens our exposure to the investment community.”
Companies included in the Russell 3000 are automatically categorized into either the large-capitalization Russell 1000 or small-capitalization Russell 2000, along with corresponding growth and value style indexes.
Based on Velo3D’s present market capitalization, the firm qualifies for inclusion in both the Russell 2000 and Russell Microcap categories — representing the smaller end of the market spectrum while still delivering significant institutional investor visibility.
Velo3D’s Business Model
Velo3D specializes in metal 3D printing solutions designed primarily for aerospace and defense industry supply chains. The company’s product portfolio encompasses Flow print preparation software, the Sapphire printer series, and the Assure quality assurance platform.
Notable clients include SpaceX and Honeywell — relationships that underscore the company’s credibility within defense and aerospace manufacturing sectors.
Duration of Index Membership and Future Outlook
Velo3D’s Russell 3000 membership remains guaranteed through December 2026’s semi-annual reconstitution event. During that review, the company could potentially migrate between the Russell 1000 and Russell 2000 based on market capitalization fluctuations.
FTSE Russell oversees these benchmark indexes, which rank among the most extensively utilized standards for U.S. equity portfolio managers.
Monday’s 7.1% stock appreciation follows a familiar trend observed when smaller companies gain entry to major indexes — an initial buying surge fueled by passive fund inflows and heightened institutional interest.


Stream Finance, the collapsed DeFi yield protocol behind the depegged xUSD token, has begun collecting information from potential creditors and claimants as a step toward what it called a "potential global resolution." The protocol said in a post on X that it is gathering and confirming claim… Read the full story at The Defiant


Crypto influencer Ansem has airdropped about $7 million worth of the $ANSEM memecoin to Solana users, and said he will keep distributing tokens as the price rises in a push to grow the holder base to 1 million wallets. Ansem, who posts under the handle @blknoiz06 and counts close to 1 million… Read the full story at The Defiant
US President Donald Trump has about 10 days to decide whether or not to sign bipartisan housing legislation containing a ban on a central bank digital currency (CBDC) into law after saying he planned to prioritize a controversial voting bill.
According to reports, House Speaker Mike Johnson sent the 21st Century ROAD to Housing Act to Trump’s desk on Monday, kicking off a 10-day timeline for the president to decide whether to ignore, sign or veto the bill under the US Constitution, excluding Sundays. The bill, passed by the House of Representatives last week, included language barring the Federal Reserve from issuing or creating a CBDC “or any digital asset that is substantially similar” until the end of 2030.

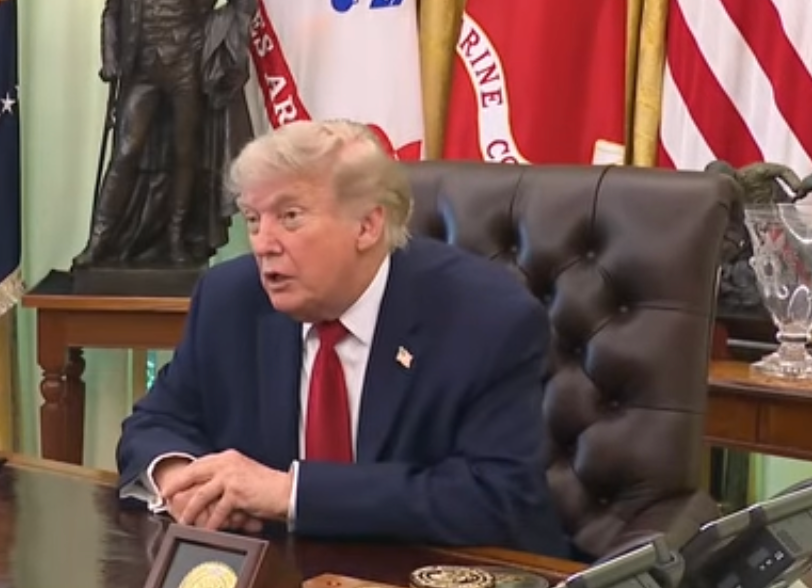
Donald Trump signing executive orders on Monday. Source: The White House
Trump reportedly called the legislation a “yawn” and sarcastically referred to the situation as a “big deal.” He canceled the signing ceremony for the bill on Wednesday, saying that Republicans in Congress should focus on passing the SAVE America Act. The legislation would require voters to provide proof of US citizenship in person to register, potentially disenfranchising millions of people.
The 21st Century ROAD to Housing Act received significant bipartisan support from Democrats and Republicans, with members of both parties lauding progress ahead of Trump’s potential signature. Sponsored by Senator Elizabeth Warren, the Democrat-led legislation included a CBDC ban in an attempt to garner support from Republicans and the White House.
Related: Senate leaders push for July passage of CLARITY Act
“We should be celebrating a bipartisan housing law,” said Warren on Monday. “Instead, we have a call to action. Mr. President: sign the damn bill.”
Senators on state work periods, chamber set to consider market structure
The US Senate broke on Friday for state work periods, with lawmakers expected to return by July 13. The chamber’s calendar gives lawmakers about four weeks to address the Digital Asset Market Clarity (CLARITY) Act before another state work period in August.
Trump said in March that he would “not sign other bills” until the SAVE America Act was passed, but also made a social media post signaling that he supported CLARITY. Should the president veto the bill, Congress could override his action with a two-thirds majority in both chambers.
Magazine: SBF will never get a pardon, Trump peace deal boosts Bitcoin: Hodlers Digest June 14-21
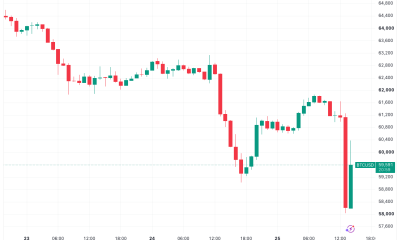
Bitcoin (BTC) trades at an important inflection point as retail investors are selling, big institutions are in a hold despite the discounted valuation and the market is paused at $60,300—awaiting the next significant move. The situation reveals two very different investor groups making opposite bets.
Retail investors sell, TradFi watches
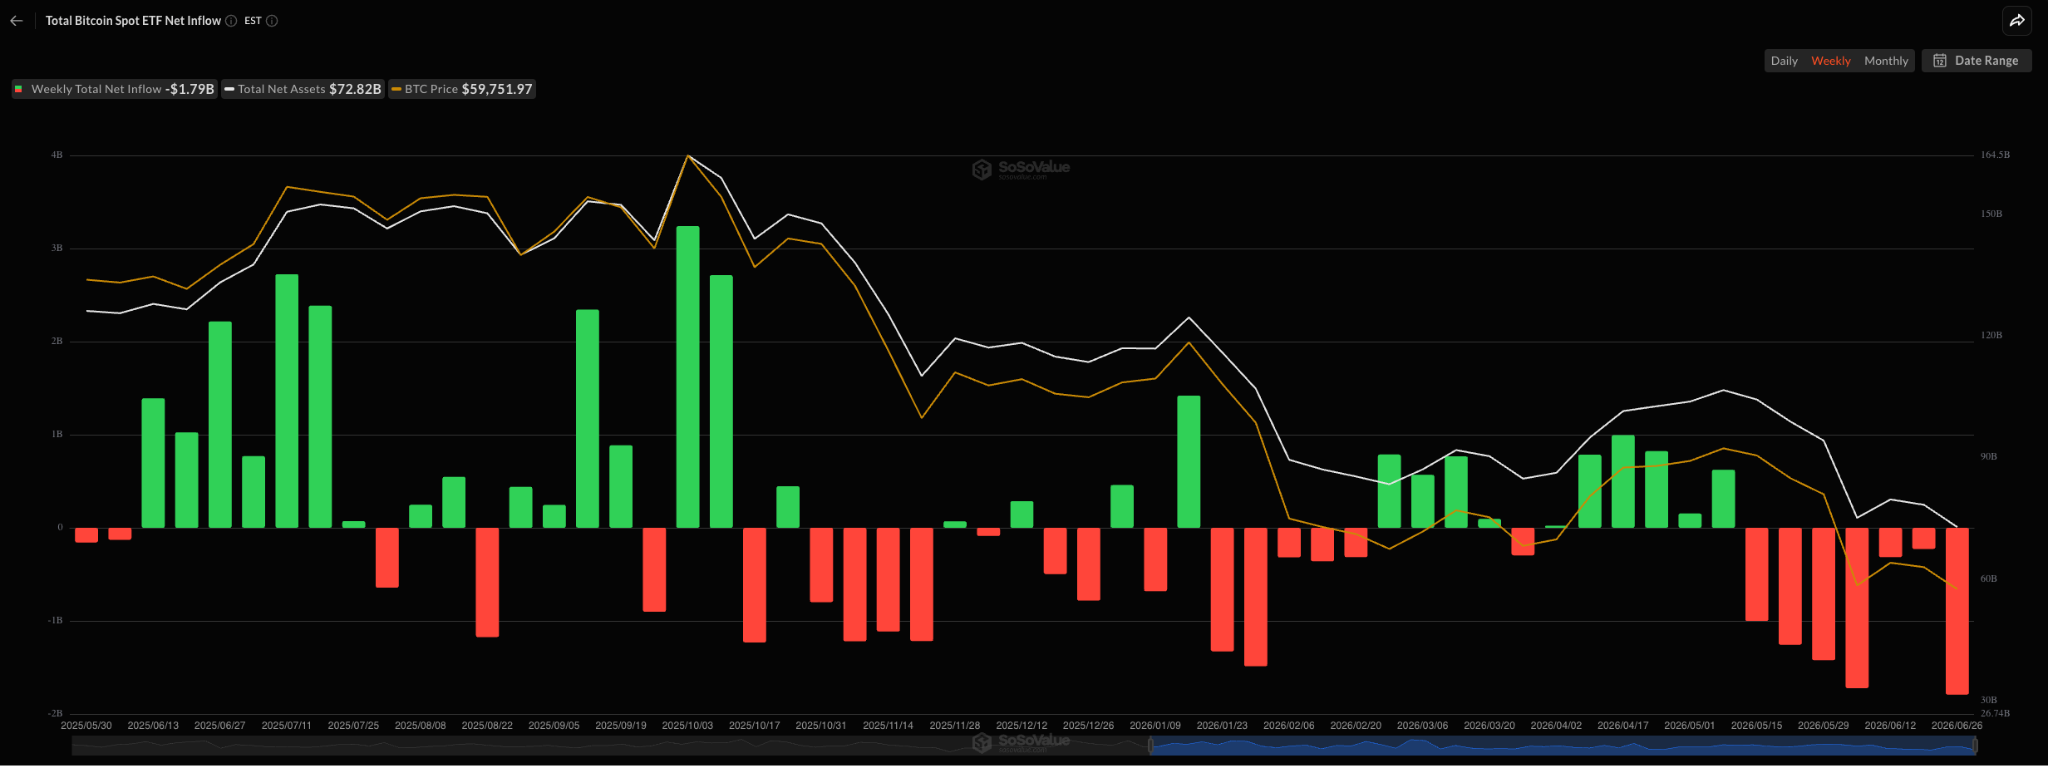
The general mood is fearful, with the Crypto Fear & Greed Index sitting at 36 out of 100, indicating fear but not total panic. This number masks a sharp divide. In June alone, investors pulled $4.4 billion from US spot Bitcoin ETFs—the worst month this year. At the same time, Strategy continues to buy BTC, although the pace and size of its purchases have slowed. While ETF flows and Bitcoin treasury accumulation are not in a buying phase, a majority of corporate BTC treasuries have not reduced their existing positions.

Spot Bitcoin ETF net flows. Source: SoSoValue.com
Leverage unwinds, but slowly
The aggregate open interest in Bitcoin futures contracts across all exchanges is $19.92 billion. Two weeks ago, it was $20.1 billion. This unwinding—when traders close positions to reduce risk—is happening in an orderly way, not in a panic.
The borrowing costs for holding long positions have dropped from 0.25% to 0.12%, suggesting that the worst of the forced selling is over. However, longs are still paying to hold their positions, meaning traders believe in a recovery but aren’t willing to bet their full account on it.
The current danger zone is $58,800, Bitcoin’s low for the day. If the price breaks below this level, the next $500 million worth of traders holding long positions could be forced to close their trades, sending Bitcoin toward $56,000. That move may extend the selling pressure into next week.
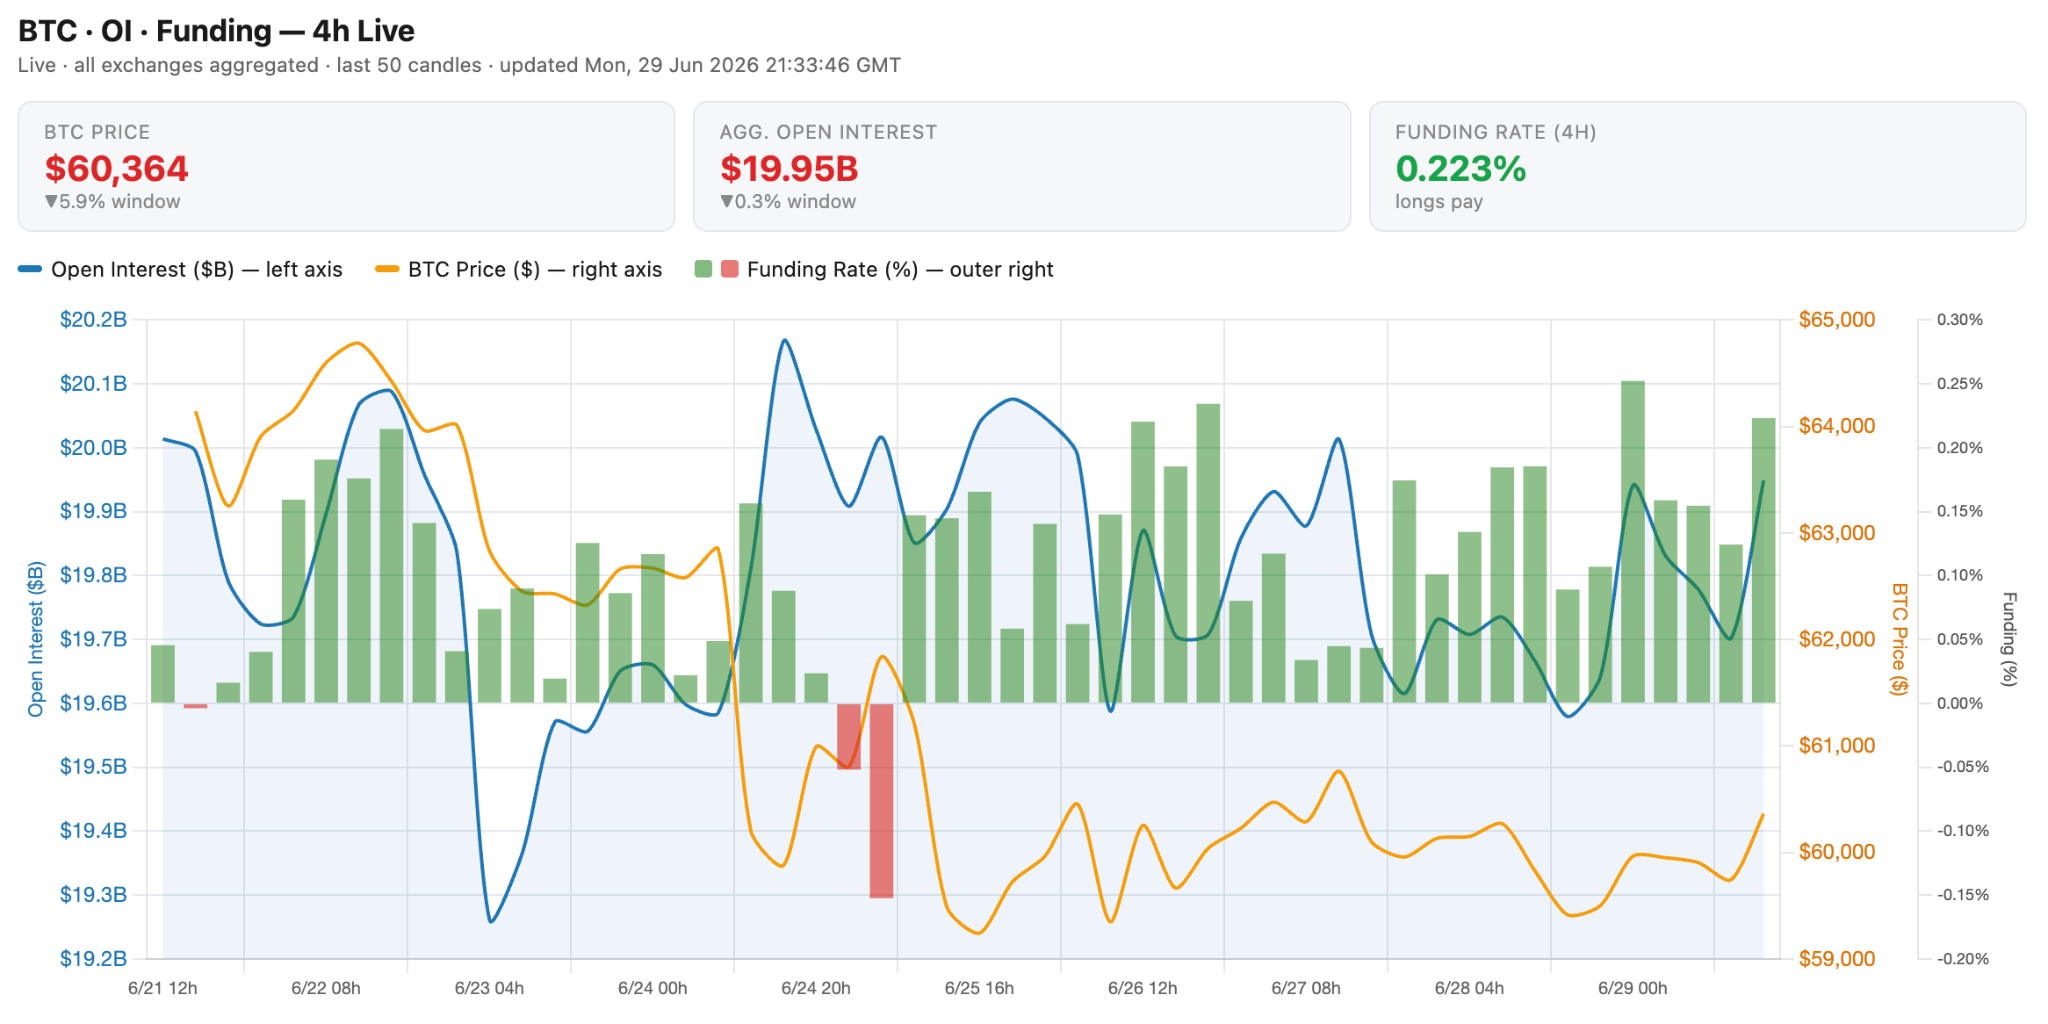
Bitcoin open interest, funding rate. Source: Hyblock
The market is waiting, not acting
When fresh capital flows into Bitcoin, volume spikes and the action shows up in the data. Right now, it doesn’t, as trading volume is down, and open interest changes are small. This suggests the market is in an indecisive phase where retail traders may be done selling, but nobody is confident enough to buy in size yet. That’s not surprising.
Related: Bitcoin balances $60K tightrope as US stocks rebound on fresh Iran peace deal hopes
MicroStrategy, which has accumulated Bitcoin for corporate reserves, did buy 3,600 Bitcoin in June for $236 million, betting on a recovery. But overall, institutions are holding rather than aggressively buying. This pause could break in either direction: lower (if one more wave of sellers emerges) or higher (if confidence returns).
For Bitcoin to move meaningfully higher, it needs to reclaim $62,000. The risk is real: a macro news event at any point in the week, like the June employment report or the resumption of military action in Iran, could weigh on investor sentiment and tip BTC back under the $60,000 handle.

IBM Says It Can Fit Nearly 100 Billion Transistors On a Chip

Consultation to close on new council wards for Darlington

Homes harder to sell as high mortgage rates frustrate buyers


-
 Sports6 days ago
Two goals and an assist by sheer aura: Cristiano Ronaldo just entered the World Cup chat
-

 Fashion3 days ago
Weekend Open Thread: Staud – Corporette.com
-

 Politics4 days ago
The House | Manchesterism won’t survive the painful trade-offs unless it gets citizens on board
-

 Politics4 days ago
Potential 2028er World Cup attendee leaderboard
-

 News Videos1 day ago
MAJOR BITCOIN & MARKET UPDATE!!!! (MUST WATCH ASAP!!!)
-

 Business4 days ago
Asia stock markets slide as tech shares slump
-

 Tech4 days ago
A Look At A Gaggle Of Transputer Boards
-
Crypto World6 days ago
Bitcoin (BTC) Dips Below $62K, Ethereum (ETH) Plunges 6% Daily: Market Watch
-
 Crypto World4 days ago
Dell (DELL) Shares Tumble Over 5% Following Analyst Downgrade to Hold
-

 Crypto World2 days ago
Coinbase, Circle Deepen Crypto Stock Losses Despite Resilient S&P 500
-

 Crypto World6 days ago
Securitize Wraps Roubini's SEC-Registered ETF as Dubai VARA Digital Security
-
Business6 days ago
Entergy settles forward sale agreements, raises $672 million in cash proceeds
-

 Crypto World3 days ago
Kraken's xStocks Opens Bending Spoons IPO Registration to EEA Retail
-

 Sports3 days ago
FIH Pro League: India defeat Pakistan 7-1, register biggest win of campaign | Other Sports News
-

 Tech2 days ago
Russian hackers now target Signal backup recovery keys
-

 Tech2 days ago
Bluekit phishing kit adopts browser-in-the-middle for login theft
-
 Crypto World4 days ago
Bitcoin Sparks $600M Hourly Liquidations With $65,000 Set To Become Resistance
-

 Crypto World3 days ago
RTX holders must register wallets before token distribution begins
-
Crypto World3 days ago
Hyperliquid Named on Singapore MAS Investor Alert Register
-
 Crypto World5 days ago
Ripple and SBI launch RLUSD in Japan after JFSA approval
You must be logged in to post a comment Login