

Business
T. rex sells for $50M, most expensive dinosaur fossil in auction


“Gus”, a mounted Tyrannosaurus Rex skeleton, one of the largest T. rex ever found, is pictured during a press preview at the Sotheby’s Breuer building in New York, on July 1, 2026.
Timothy A. Clary | Afp | Getty Images
A Tyrannosaurus rex specimen sold at Sotheby’s for $50.1 million, becoming the most expensive dinosaur ever sold at auction.
Riding a boom in dinosaur prices at auction, the T. rex, named “Gus,” blew past its price estimate of $20 million to $30 million after a 10-minute bidding war between seven bidders. It broke the record sale by Sotheby’s of a Stegosaurus skeleton nicknamed “Apex” in 2024 for $44.6 million, bought by billionaire hedge funder Ken Griffin.
Gus was discovered in South Dakota and is about 67 million years old. Touted as one of the most complete dinosaur specimens ever found, Gus has 183 fossil bone elements and is about 61% complete by bone count. It is about 38 feet long, about 12.5 feet tall and has a skull length of 54 inches, making it one of the largest T. rex fossils ever found, according to Sotheby’s.
Gus also displayed a number of injuries, including fractured and healed bones in several ribs and gastralia, as well as bite marks to several skull bones.
“Gus is not only an exceptional find, but a specimen that’s been excavated, documented, prepared and cared for with real excellence,” said Cassandra Hatton, Sotheby’s vice chairman and worldwide head of science and natural history.
Dinosaur fossils have become one of the fastest growing segments of the collectibles market, as the wealthy search for rare stores of long-term value and auction houses look to categories beyond art to diversify their sales. A T. rex named “Stan” sold at Christie’s in 2020 for $31.8 million.
While the success of Gus is likely to encourage the sale of more dinosaur bones, paleontologists and other experts warn that there are few safeguards for authenticity or verification in the industry.


Live TV streaming services have officially overtaken traditional cable in subscriber count, with more than 18 million Americans now paying for a streaming alternative to a cable or satellite bundle, according to research firm Leichtman Research Group. As of this month, the field has grown crowded, with YouTube TV, Hulu + Live TV, Sling TV, Fubo, DirecTV Stream and Philo all competing for cord-cutters seeking access to live news, sports and entertainment channels without a traditional pay-TV contract.
YouTube TV remains the market leader by subscriber count, with more than 8 million subscribers as of earlier this year, according to Cord Cutters News. The service’s base plan now costs $82.99 per month for more than 100 channels, including local ABC, CBS, NBC and Fox affiliates in nearly all U.S. markets, along with full ESPN coverage spanning ESPN, ESPN2, ESPNU, the ACC Network, SEC Network and Big Ten Network. YouTube TV pairs that broad lineup with what several reviewers describe as the best-in-class DVR setup currently on the market: unlimited cloud storage with recordings kept for up to nine months, plus support for three simultaneous streams away from home and unlimited streaming on the home network. Regional sports networks remain available depending on market, with the strongest coverage in areas served by Bally Sports and MSG Networks.
Hulu + Live TV sits close behind YouTube TV on both price and channel count, also priced at $82.99 per month when bundled with Disney+ and ESPN+, for a lineup of more than 90 channels that closely mirrors YouTube TV’s core offering while adding access to Hulu’s on-demand streaming library. Hulu’s DVR matches YouTube TV’s nine-month retention window but caps simultaneous streams at two rather than three, requiring an additional $9.99 monthly upgrade to unlock unlimited screens for larger households. Reviewers generally describe YouTube TV and Hulu + Live TV as near-identical premium cable replacements, with the deciding factor for most households coming down to whether they place additional value on Hulu’s on-demand catalog and Disney-ESPN bundle.
Sling TV occupies the budget end of the market, undercutting its larger rivals by a wide margin. The service’s Orange plan runs $45.99 per month for roughly 30-plus sports, news and entertainment channels built primarily around ESPN, while the Blue plan, also $45.99, offers a broader roughly 40-channel lineup with some local coverage depending on market. Combining both tiers into the Orange & Blue plan costs $60.99 monthly for more than 50 channels, still the cheapest full-featured option among the major services. Sling’s biggest tradeoff is local channel coverage: NBC and Fox affiliates are available in only about 30 markets, while ABC and CBS require either an over-the-air antenna or a separate service entirely. Sling’s base DVR is also considerably more limited, offering just 50 hours of storage, expandable to 200 hours for an additional $5 to $9.99 per month depending on the current promotional pricing.
Fubo has carved out a distinct niche as the sports-focused option among the major streaming bundles, particularly for soccer and international programming, with a base plan priced around $79.99 to $82.99 per month for more than 100 channels. Fubo and DirecTV Stream remain the only two major streaming services that continue to carry regional sports networks, since both YouTube TV and Hulu dropped all RSN coverage between 2020 and 2021 due to high carriage fees, though some individual teams have since moved their broadcasts to over-the-air television or their own standalone streaming platforms. Fubo has also faced its own carriage disputes in recent periods, including a stretch earlier this year in which NBC-owned channels, including local NBC affiliates, were dropped from the service, complicating access to events including the Olympics and Super Bowl for Fubo subscribers during that window.
DirecTV Stream sits at the higher end of the pricing spectrum, with an Entertainment plan starting around $89.99 to $94.99 per month for roughly 90 to 95 channels, scaling up to a Choice plan priced near $114.99 to $124.99 monthly that adds regional sports networks and additional specialty channels. Reviewers note that DirecTV Stream’s advertised pricing often understates the real monthly cost once regional sports and broadcast fees are factored in, with the base Entertainment plan effectively running closer to $95 to $100 after those additional charges, and the Choice plan closer to $125 to $130. DirecTV Stream also offers the strongest local channel coverage among the major services in rural markets, according to PCWorld’s testing, followed by YouTube TV, with Sling TV described as largely unusable for local programming without a supplemental antenna.
For viewers seeking an even lighter, lower-cost option, Philo offers a stripped-down entertainment-focused package priced around $33 per month for more than 70 channels spanning entertainment, lifestyle and documentary programming, including access to HBO Max, Discovery+ and AMC+. Philo deliberately omits local channels, sports programming and major cable news networks, a tradeoff that keeps its price significantly below the other major services but limits its appeal for viewers who prioritize live news or sports.
Across all six major services, cross-platform compatibility remains broadly consistent, with each supporting Apple TV, Roku, Amazon Fire TV, Chromecast, Android TV, Samsung and LG smart TVs, along with iOS, Android and web browser access. Reviewers generally point to YouTube TV as offering the smoothest overall interface and the tightest integration with Google’s own hardware ecosystem, including Chromecast and Google Nest devices.
Ultimately, industry analysts covering the live TV streaming space say the right choice depends heavily on individual viewing priorities. Households that rely on live local news and network programming, along with a full DVR feature set, are generally steered toward YouTube TV or Hulu + Live TV despite their higher price points. Budget-conscious viewers willing to pair a service with a one-time antenna purchase for local coverage are more often pointed toward Sling TV. Sports fans specifically seeking regional team coverage are typically directed toward Fubo or DirecTV Stream, the only two remaining major streaming services carrying regional sports networks. And viewers whose habits skew toward general entertainment and documentary programming, with minimal need for live news or sports, may find Philo’s lower price point the most cost-effective option among the current field of live TV streaming alternatives.
Business
Colorado Man Says Switching From Ford F-150 to Tesla Cybertruck Felt Like Instantly Leaping Into Future

A Colorado man who traded in his Ford F-150 for a Tesla Cybertruck says the transition felt like jumping straight from the Victorian era into the future, becoming the latest in a growing string of traditional truck owners publicly documenting their switch to Tesla’s angular electric pickup.
The man shared his experience in a post on the Cybertruck Owners Club forum, describing an early adjustment period that quickly gave way to enthusiasm. “I’ve had a 2025 AWD truck for 3 weeks now,” the post began. “I’ve regretted purchasing FSD, but only because this truck is so much fun to drive.” He was referring to Tesla’s Full Self-Driving software package, an optional add-on he said he had come to view as almost unnecessary given how much he simply enjoyed being behind the wheel of the truck itself.
The owner singled out the Cybertruck’s steering system as the feature that most changed his perception of the vehicle relative to his previous gas-powered truck. “The steer-by-wire combined with rear wheel steering is mind-blowing. Seriously feels like driving the future,” he wrote. He drew a direct comparison to the vehicle he had traded in, along with a popular competitor. “Technically, an F150 or Tundra does the same basic things, but nowhere near with this capability and ease of use.” The owner also relayed a comparison his wife made about the difference between the two vehicles, likening the Cybertruck to a laptop and the F-150 to a typewriter.
Reflecting on the roughly $85,000 he spent on the truck, the owner said he considered it money well spent and encouraged skeptics to withhold judgment until they had experienced the vehicle firsthand. “Tesla would move a whole lot more of these if people could experience driving them. Don’t judge it til you drive it!” he concluded.
The Colorado man’s account adds to a broader pattern industry observers say has become increasingly common as more owners of internal combustion engine trucks make the switch to electric alternatives, including the Cybertruck specifically. John Higham, vice president of communications at the Electric Vehicles Association, said the phenomenon of skeptics converting to EV believers after actually driving one is familiar territory for his organization. “We hear this all the freaking time. We call it the butts in seats conversion,” Higham said. “It’s why we hold Arrive and Drive events in all of our 100+ chapters across the US twice a year,” he added, referring to hands-on demonstration events the association organizes specifically to give prospective buyers direct experience behind the wheel of electric vehicles before making a purchasing decision.
The comparison between the Ford F-150 and the Tesla Cybertruck has become something of a recurring flashpoint within the broader truck and EV enthusiast community, extending well beyond individual owner testimonials. The two vehicles have been pitted against each other in a series of highly publicized head-to-head contests, including drag races and tug-of-war competitions, each drawing significant online attention and often producing contested or debated results among viewers over which truck genuinely came out on top.
Sales figures have added another layer to the rivalry. According to 2025 sales data, Ford’s electric F-150 Lightning variant outsold the Cybertruck over the course of the year, giving traditional truck loyalists ammunition in the broader debate over which vehicle better represents the future of the pickup truck segment, even as Tesla’s more radically styled offering has continued to draw outsized media and public attention relative to its actual sales volume.
The Cybertruck itself has had an unusually long and turbulent path to market. Tesla first unveiled the vehicle’s prototype in November 2019, with production originally targeted to begin in late 2021. That timeline slipped repeatedly in the years that followed, with Tesla postponing its production target again in 2022 before confirming in January 2023 that manufacturing would finally begin later that year. The first Cybertruck was assembled at Tesla’s Gigafactory Texas in July 2023, with serial production beginning that November, followed shortly after by the vehicle’s first customer delivery event.
Despite finally reaching the market after years of delay, the Cybertruck has faced a mixed reception commercially, falling short of some of the ambitious sales expectations Tesla and its supporters had set for the vehicle in the years leading up to its release. Even so, the truck has continued to generate significant cultural attention, in part because of its unconventional angular design, which stands in stark visual contrast to the more traditional styling of established competitors like the F-150 and Toyota Tundra, and in part because of the kind of enthusiastic, sometimes evangelistic owner testimonials exemplified by the Colorado man’s recent forum post.
Stories like this one have become a recurring feature of automotive media coverage as the broader shift toward electric vehicles continues to unfold across the truck segment specifically, a category that has historically been viewed as more resistant to electrification than passenger cars given traditional truck buyers’ emphasis on towing capacity, range under heavy load and established brand loyalty built up over decades. Advocacy groups like the Electric Vehicles Association have leaned into that dynamic directly, framing hands-on driving experiences as the most effective tool for overcoming skepticism among longtime gas truck owners, a strategy Higham’s comments suggest has produced consistent results across the organization’s national network of chapters.
For now, the Colorado owner’s account stands as one of the more vivid recent examples of that conversion narrative playing out in real time, with his comparison of the shift to leaping from the Victorian era into the future offering a distinctly colorful entry into an increasingly well-documented genre of EV conversion stories circulating within online truck and Tesla enthusiast communities.

Tim Riesner was among those who took out various loans, including BNPL, only to face problems when his life changed.
“It didn’t feel like debt. It felt like convenience. You’re buying something online and it says ‘split it, pay later’. You think you’re being sensible. But you can have multiple plans running at once,” he said.
“Before you know it, it’s thousands. Add in loans, credit cards, bits of finance here and there, and suddenly I owed £24,000.”
His finances unravelled after having to give up well-paid work in construction after suffering problems with his eyesight.
“Nobody should have any sympathy for me at all. I’m an adult. I knew what I was doing. The responsibility lies with me. However, advertising is very seductive. It draws you in, because the society that we live in is the society that says you can have it, and you can have it right now,” he told the BBC.
After a tough and dark period, he spoke to charity Business Debtline, where staff helped him to go through his debts, organise a Debt Relief Order, and he is now well on his way to being debt-free.
Jack Sporcic, debt adviser at National Debtline, said: “We are urging consumers to treat Buy Now Pay Later in exactly the same way as any other form of borrowing.
“We often see people using Buy Now Pay Later for everyday essentials such as food, energy bills and household basics.”

AlexSecret/E+ via Getty Images

The Bristlemoon Global Fund returned -25.5 percent for the March 2026 quarter, with a -3.4 percent return for the month of March 2026, net of fees. Key performance contributors in the month of March included Woodside Energy (WDS), Grindr (GRND), and our Dollar General (DG) short. Notable performance detractors over the same period included Floor & Decor (FND), Fair Isaac Corporation, and Hemnet Group (HMNTY). The Australian dollar appreciated by 3.4% against the USD in the March 2026 quarter, presenting a headwind to the Fund’s performance given that the Bristlemoon Global Fund is denominated in Australian dollars.
This was the most severe drawdown the Fund has experienced since inception. Importantly, it was not driven by a deterioration of the underlying earnings power of the businesses owned by the Fund, but rather by a sharp and rapid repricing of what investors were willing to pay for those earnings. In this letter we will explain what contributed to the weak performance and how we plan to address this with our compounding/conviction position sizing framework, discuss how we have adjusted the Fund’s positioning in light of developments from the Iran War, and provide an update on the Fund’s AppLovin position.
We believe the current opportunity set is the most compelling we have seen since the Fund was launched. It is worth reiterating that the Fund owns a collection of high-quality business that we believe are trading far below their intrinsic worth. Based on our estimates, we believe that a number of the Fund’s core holdings are worth multiples of where they are currently trading. As a result, we remain confident that the stocks held by the Fund offer a highly asymmetric risk/reward.
SaaSocalypse fallout
The first quarter of 2026 saw a brutal selloff in software companies, with the IGV software ETF declining by -24% over the period. First, it was software-as-a-service (SaaS) companies getting sold off on AI fears as the range of future value outcomes widened. But those fears steadily reached a crescendo, and subsequently many other non-SaaS businesses suffered significant drawdowns, simply because they were digital, asset-light businesses that were perceived to be at higher risk of disruption from the spectre of AI.
The Fund’s holdings have been skewed towards quality, high growth, asset-light companies. We believe these businesses are exceptional, continue to possess fantastic growth prospects, and in the case of the companies owned by the Fund, are insulated from the AI threat. However, these are also the exact sorts of businesses that have been in the firing line of the recent “AI loser” trade, with many investors dumping these stocks in a “shoot first, ask questions later” panic.
We have consistently cautioned our investors and readers of these quarterly letters of the potential volatility from a concentrated portfolio. We continue to believe that concentrating the Fund’s capital in our highest conviction ideas is the path to solid long term returns. However, this concentration can also exacerbate the downside of the portfolio in the event that multiple positions sell off in tandem. We have seen this play out since the beginning of the year.
While the stocks held by the Fund span across different industries, geographies, and have idiosyncratic business drivers, this has provided no reprieve. That diversification was rendered moot because the market traded the bulk of these companies as if their fate as AI losers was a fait accompli. This has led the Fund to have a drawdown that was far greater than what we thought would be probable, as these various businesses traded in a highly correlated manner as the market applied a blanket narrative across these fundamentally different businesses.
The stock market so far this year has, in a reductive fashion, bifurcated into perceived AI winners and losers. At the index level it has been fairly calm, with indices not too far off their all-time highs. However, looking at the various index constituents, there has been enormous dispersion based on an industry’s likelihood of winning or losing from AI.
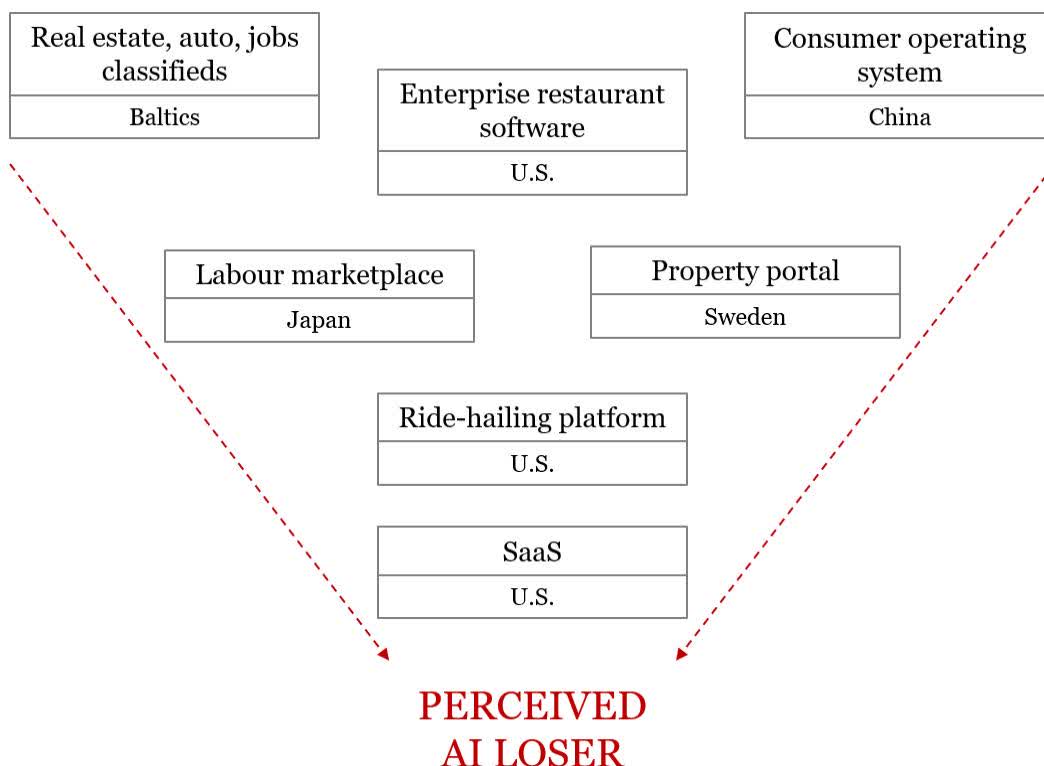
We believe that there are software companies that will almost certainly be disrupted by AI. Daniel Wu’s recent article on Adobe (ADBE) highlights one such company that is likely to face veritable headwinds from AI. However, we disagree with the market’s indiscriminate application of this AI disruption narrative to the broader universe of asset-light, digital businesses. In many instances, the earnings expectations remained stable or increased for the Fund’s holdings, yet these company’s share prices declined materially. To us, this reflects a narrative-driven selloff rather than a deterioration in the fundamentals of the businesses owned by the Fund.
We have thus used this period of dislocation to add to the Fund’s holdings of high-quality businesses at lower prices. Ultimately, it is long-term earnings growth that will drive returns, and we retain strong conviction that the Fund’s holdings are positioned to compound earnings at attractive rates over time.
Update on Bristlemoon Global Fund key holdings
Fair Isaac Corporation (FICO)
Many of the Fund’s holdings suffered multiple compression during the quarter, despite a number of these businesses reporting phenomenal earnings results. For example, Fair Isaac Corporation (FICO) reported a solid Q4 2025 result with, in our view, a highly conservative earnings guidance for fiscal year 2026. Earnings expectations for the business have continued to creep up, yet the share price declined by almost -37% in the March quarter. FICO’s FY27 earnings multiple derated from above 50x at the start of the year, to 25x at the end of March, a more than 50% decline in the multiple over the span of a quarter.
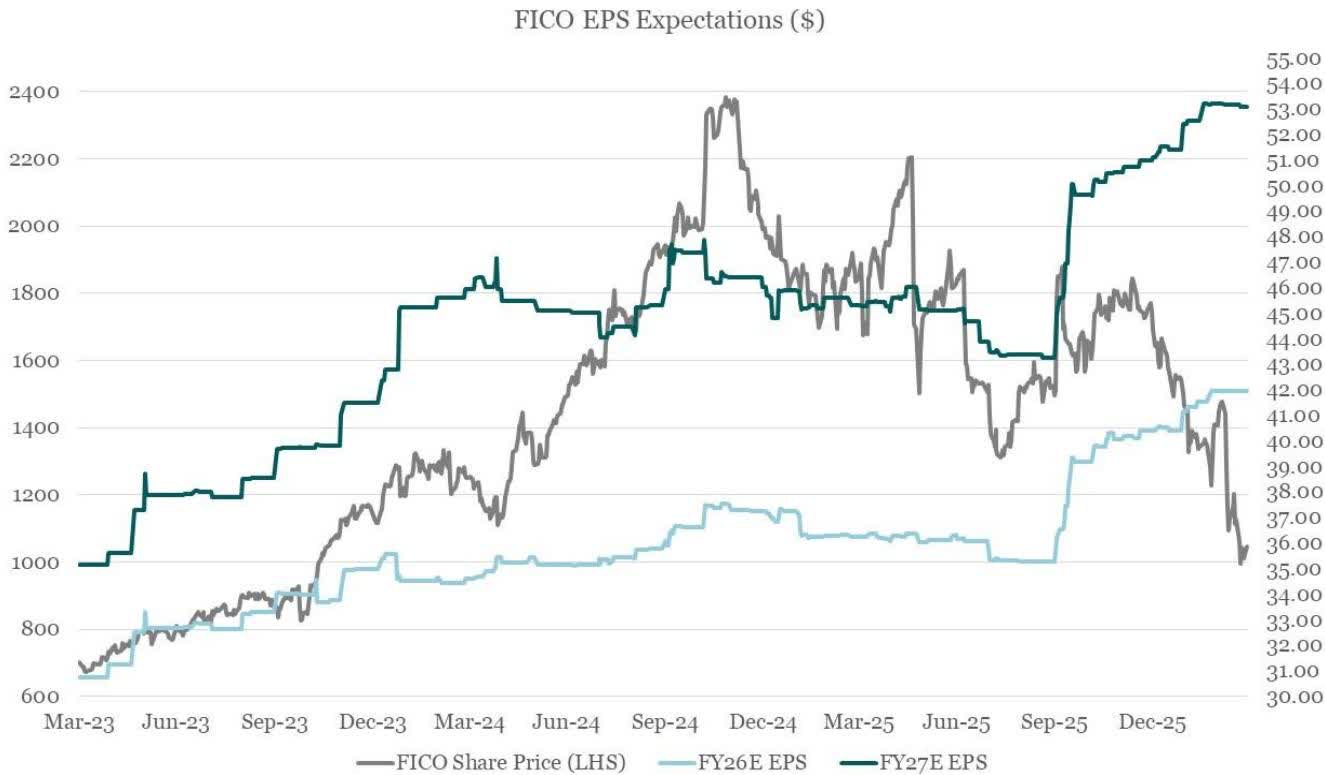
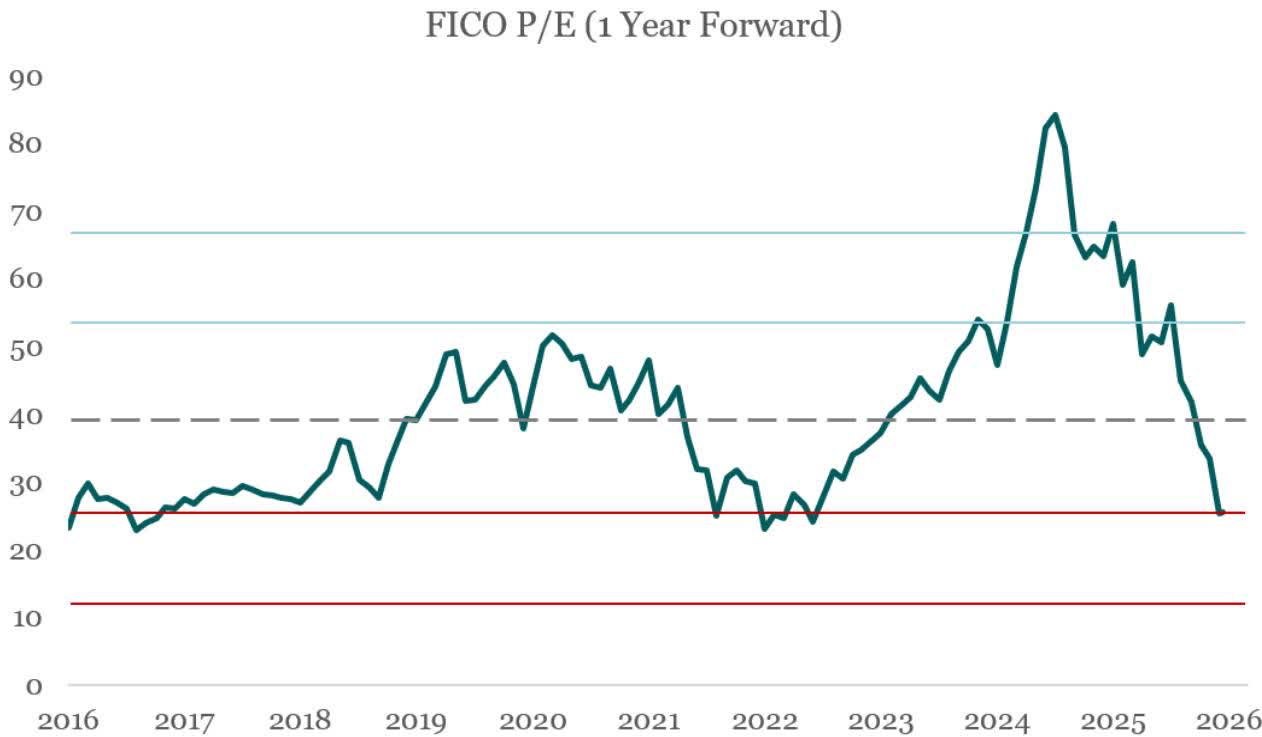
FICO’s multiple is now more than one standard deviation below its 10 year average, and the P/E ratio has declined to a level that has historically only been reached during periods of heightened pessimism. Notably, when FICO’s multiple reaches these depressed levels, it has historically staged a sharp rebound back through the long-term average multiple when the narrative improves. There is 50% upside alone in FICO returning to its long-term average multiple.
While we continue to believe that the barriers to entry protecting FICO from competitive incursions remain incredibly strong, as we expanded upon in our deep dive report, there has been a lot of change in the credit scoring space (credit bureaus cutting the price of VantageScore, talk of the GSEs testing a VantageScore securitisation pool, and rumblings that the FHFA might pressure the GSEs to release VantageScore LLPA grids that are unfavourable for FICO) in recent months that have left investors less certain about FICO’s future growth prospects.
It is this greater uncertainty that has driven the multiple lower. However, we believe that FICO’s moat remains intact and that the company will continue to demonstrate strong earnings growth, particularly with the rollout of the Direct Licensing Program, which should help restore investor confidence in the business.
As a reminder, the FICO Score is incredibly entrenched in the US mortgage ecosystem, and it is infused into multiple systems, workflows and regulatory requirements across the point of loan origination, as well as the secondary market securitisation value chain. We would note that there are significant challenges to VantageScore, the competing score to the FICO Score, gaining market adoption, even if the credit bureaus were to distribute VantageScore for free:
• The FICO Score is tightly integrated into the mortgage value chain, with the score being relied upon by multiple parties (lenders, GSEs, MBS investors, insurers, regulators, and a range of other intermediaries). Any switch to VantageScore would require buy-in from all these parties, many of which do not directly benefit from using VantageScore. Progress in operationalising VantageScore for the conforming loan market has been glacial, and right now it is currently not possible to sell a VantageScore-scored mortgage to the GSEs.
• The gating factor to VantageScore adoption has always been the securitisation market, and there are reasons to believe that there will be resistance to VantageScore acceptance by MBS investors. This is due to VantageScore’s limited history that fails to capture past credit cycles, a lack of demonstrated predictive superiority versus FICO 10T, and the GSE’s previously having endorsed FICO over VantageScore, reinforcing FICO as the industry standard.
• It is our view that the additional uncertainty of VantageScore would translate to a discount on VantageScore-backed paper. This would ultimately flow through to higher borrowing costs for VantageScore-scored loans, which is precisely the opposite of what the FHFA is trying to achieve.
As we can see below for a typical mortgage, for every 1 basis point of risk premium from using VantageScore instead of the FICO Score, the borrower will pay an additional $926 over the life of the loan. And this is all an upfront saving on the credit report cost that is likely to be in the tens of dollars.
We believe that FICO, in a scenario where there’s a modest recovery in mortgage origination volumes, can grow its earnings at north of 40% per annum over the next two years. If this unfolds, we expect FICO to be worth more than $2,400 per share, or 2.2x where the stock is trading today. And in the event that mortgage market activity stages a more significant rebound to normalised levels, then the upside to FICO’s stock materially increases.
Hemnet Group
The most extreme case of multiple compression in the portfolio has been Hemnet.
Hemnet P/E (1 Year Forward)
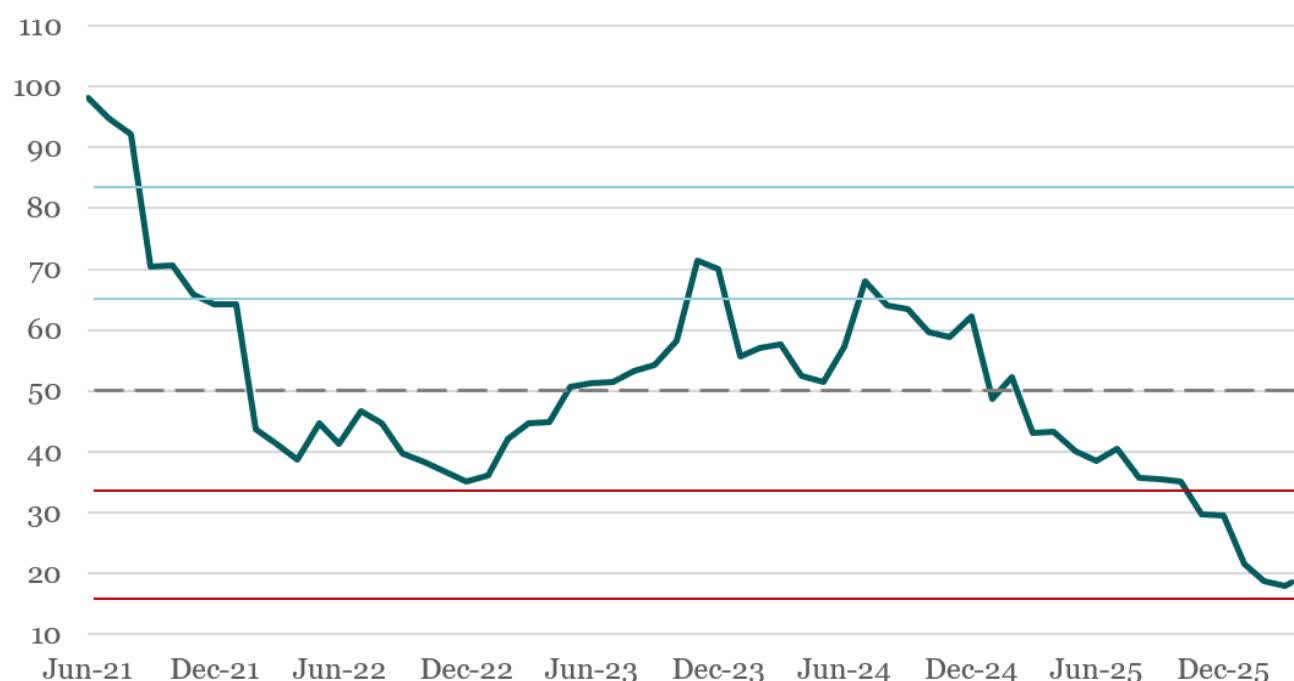
Unlike many of the Fund’s other holdings which have experienced stable to increasing earnings estimates, Hemnet’s multiple deterioration has been accompanied by a reduction in consensus earnings estimates (in this sense, the decline in the earnings multiple afforded to Hemnet has not been totally unfair). We underestimated the cyclical nature of the housing market as well as rising competitive pressures. This has resulted in a particularly severe decline in Hemnet’s stock price, making Hemnet the largest detractor from the Fund’s returns since inception.
Hemnet, in our view, remains a quality business with a bright future ahead. The narrative, however, has been muddled by a very weak Swedish property market, competition concerns, and fears of AI disintermediation. We believe that these concerns are overblown and our view is that they should begin to fade once listings volumes start growing again.
However, this deteriorating narrative has reduced the earnings multiple that investors are willing to pay for Hemnet, with the P/E multiple declining from north of 50x at the beginning of 2025, to just 18x today. In other words, in a little over a year, there was a -64% decline in the share price just from the multiple alone. Furthermore, Hemnet’s multiple is almost two standard deviations lower than its average P/E multiple of 50x since the business went public in 2021, which statistically speaking is a very low probability event. When layering on the decline in earnings estimates, Hemnet stock has declined by around -75% since the February 2025 share price peak.
The stock had always traded at a rich multiple, and we felt that this was an acceptable price of admission to gain access to our view at the time of a strong earnings growth trajectory. In hindsight, we paid too high of a price for Hemnet in light of the downturn in the Swedish housing market, which has changed agent behaviour in a way that has fed increasing listings supply to Booli, Hemnet’s competitor. The price we paid left no margin of safety for a deterioration in near-term earnings expectations for the business. Over a longer time frame, we believe that Hemnet will return to growth and this episode will be but a bump in the road. But in the short-term we have suffered a significant drawdown in the Fund’s Hemnet position that has materially weighed on the overall returns of the portfolio.
Importantly, our mistake was not necessarily in purchasing Hemnet on the basis of our assessment of the long-term earnings power of the business. It was in anchoring too heavily to this long-term view, while not being nimble enough with adjusting our position size as investor confidence deteriorated and as the market became less willing to look out at those future earnings. We have channelled these reflections into the position sizing framework we discuss later in this letter.
We are thankfully starting to see some green shoots with Hemnet, stemming from the Sell First Pay Later (SFPL) payment option rollout, as well as the LVR rule changes that came into effect April 1, 2026.
As a reminder, Hemnet is in the process of rolling out a new payment option where property sellers can list their home on Hemnet at no upfront cost, and will only pay Hemnet in the event that their property sells. We believe this removes the largest friction to sellers listing on Hemnet – that is, the upfront outlay without a guarantee that the property will sell – and our thesis was that this would lead to a significant improvement in listings volumes over time.
This is already beginning to occur. For example, in the first week of February 2026 in Stockholm where the SFPL model was introduced, Stockholm listings were down -5% year-over-year compared to listings being down -22% year-over-year for Hemnet as a whole. Hemnet’s share of listings in Stockholm jumped from 78% on an LTM basis to 95% in the first week of February. And we have observed further improvements in listing volumes, with the number of published homes on Hemnet declining by -1.8% year-over-year in the first week of April 2026, compared to a -40% year-over-year decline in the preceding week. Listing volumes in the first week of April surged by an incredible 67% week-over-week. We believe that if Hemnet can show a continued improvement in the listings volume trajectory, then investors will begin to rebuild confidence in the stock and the multiple should rerate.
From these incredibly beaten down levels, we are projecting a more than 40% IRR from the Fund’s Hemnet investment over the next three years.
PAR Technology Corporation (PAR)
PAR Technology Corporation (PAR) is another holding in the Fund that has experienced a severe drawdown, despite healthy underlying business performance. The difficulty with PAR is that the business is only in the early stages of ramping up its earnings profile. The corollary of this is that with minimal near-term earnings support, and in a market that has been particularly unforgiving towards software businesses, PAR’s stock has struggled to find a floor.
To highlight how savage the selloff has been for PAR, the stock fell from around $70 per share in mid-2025 to around $13 per share today, a more than -80% decline. On FY27 consensus adjusted EBITDA estimates of $66 million, the stock trades at a 13x multiple, and this is despite a long runway to continue winning new logos, with PAR in discussions with multiple mega tier 1 restaurant chains for deals that would provide strong visibility over robust annual recurring revenue (ARR) growth for years to come. Our thesis of PAR becoming the operating system for enterprise restaurants continues to play out, with PAR continuing to sign deals with new restaurants, and an increasing number of these deals starting off as multi-product deals. PAR charges just 15-20 basis points of a restaurant’s sales for a mission-critical product that restaurants cannot function without.
Notably, the last time PAR traded below $20 per share was during the COVID sell off of March 2020, with the stock remaining below this level for less than two months. And from the COVID lows, the stock increased by 8.3x over the next year. While we are not anticipating an exact repeat of this meteoric share price performance, noting that 2021 was an unusually speculative period for the US stock market and a time when investor confidence in the SaaS business model remained intact, it does highlight how quickly investor sentiment can shift.
What is perhaps the most striking datapoint for us is that during March of 2020, PAR had less than $30 million of ARR. Fast forward to today and PAR has $315 million of ARR. However, despite a more than 10x larger base of ARR, the stock currently trades at the same price it did in March 2020. This to us is remarkable, and highlights just how bearish investors have gotten on PAR. We continue to hold the stock and believe that as the company executes on its long-term strategy and improves its margin profile, the current level of pessimism will prove unsustainable.
Reflecting on our recent poor performance has prompted us to conceptualise our approach to stock selection and position sizing using the frameworks we will describe below.
Investing in mispriced quality
The strategy of the Fund is to invest in “mispriced quality”. We define a high quality business as one that has the following characteristics:
1. The ability to forecast future earnings and cash flows with a high degree of confidence; and
2. The ability to achieve and sustain high future returns on capital.
But a high-quality business that is fully valued is unlikely to deliver attractive future risk-adjusted returns. Thus, under our framework, we avoid overpriced compounder stocks with no clearly defined catalyst or mispricing. Rather, we characterise mispricings as inflection mispricings, narrative mispricings, or duration mispricings, and our deep due diligence is focused on forming variant perceptions around these mispricings.
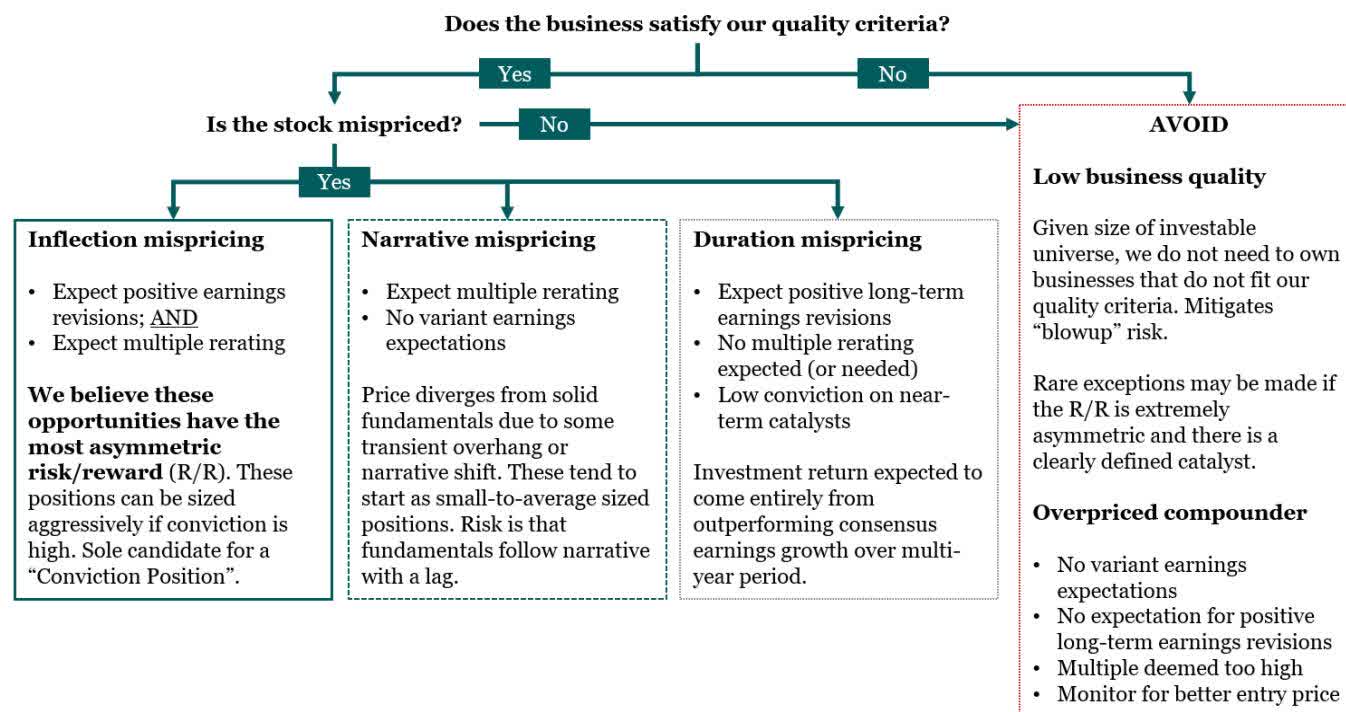
Our mispriced quality framework guides us on what to own while the below position sizing framework guides us on how large we should own that stock. Notably, it is only inflection mispricing positions that should be sized aggressively with a conviction position.
Position sizing: two positions in one
We previously discussed our position sizing framework in our December 2024 quarterly letter. We felt it would be helpful to pen some additional thoughts on the topic as a way to refine our approach, embed the lessons learned, and reduce the likelihood of future large drawdowns arising from multiple compression.
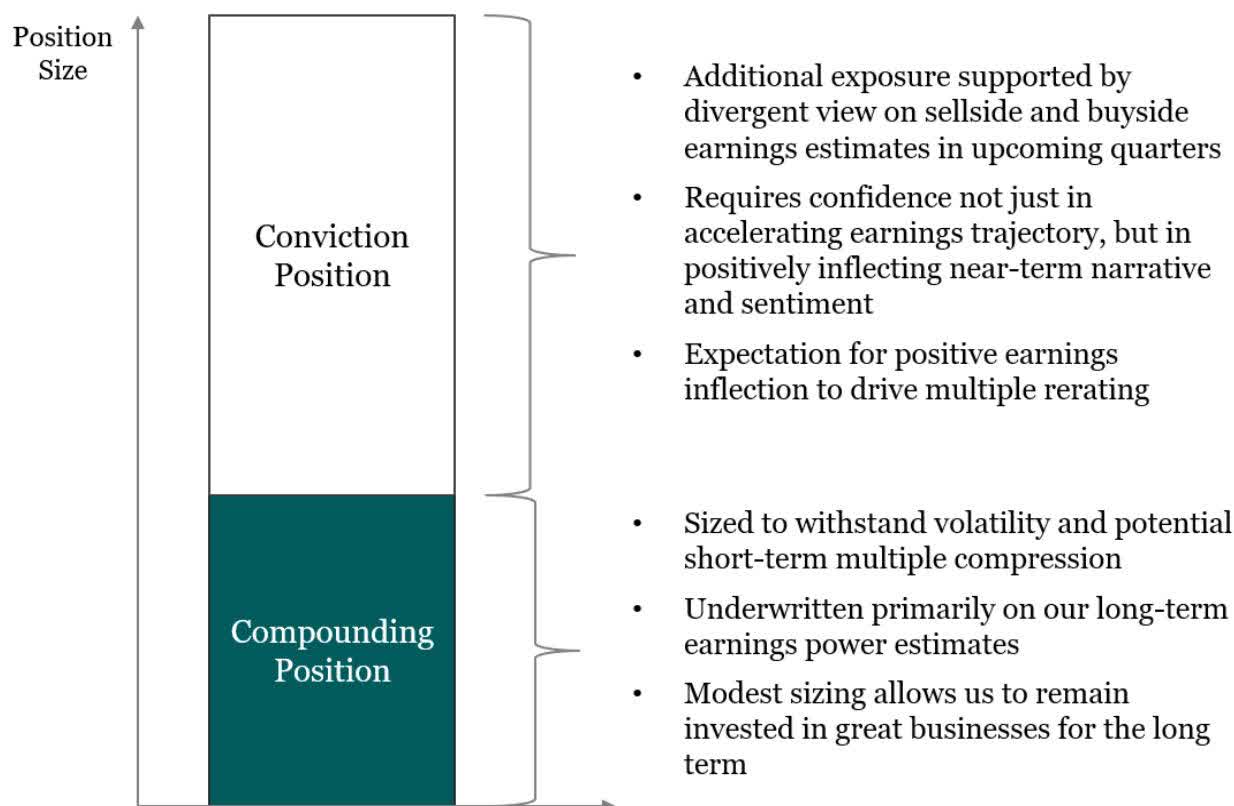
We increasingly think about each investment position as two distinct exposures: 1) the compounding position; and 2) the conviction position.
The compounding position
The size of the compounding position varies for each stock and is determined by the risk/reward skew, our level of conviction in our investment thesis, and the expected volatility of the stock. Essentially, a compounding position is where we recognise there to be compelling value in the stock based on our estimates of future earnings, but we lack a high-conviction divergent view on the earnings path over the next 12-18 months. These positions are typically sized in a range of 2-5% and fall into the narrative mispricing and duration mispricing buckets, as described above.
The compounding position is sized at a level that allows us to hold the stock through any periods of volatility and multiple compression, provided that our thesis remains intact. In other words, the position is small enough that we can tolerate the volatility along the way, provided that the underlying business remains on the correct trajectory towards our longer-term earnings estimates.
Taking a stock exposure beyond just a standard compounding position involves scaling into what we label a conviction position, and this requires a higher standard of evidence.
The conviction position
For a conviction position to be considered, we need to have stronger conviction around an accelerating earnings profile that other investors do not yet fully appreciate. Thought of another way, we must be confident that our earnings estimates over the next 12-18 months meaningfully diverge from consensus estimates.
Tying this back to our abovementioned stock selection framework, the types of investments that are eligible for a conviction position are “inflection mispricings” – that is, where we expect both positive earnings revisions and the multiple to rerate.
Importantly, stocks can traverse these various buckets. For example, our position in Alphabet (GOOGL) in June of 2025 started as a “narrative mispricing” investment, and our initial exposure of 3% was a compounding position. However, upon doing further work on the stock and after several positive catalysts materialised, we formed the view that consensus earnings estimates for Alphabet were unduly low. We thus scaled up the Fund’s Alphabet position to 9% in September of 2025, with this additional exposure classified as a conviction position. Alphabet, while no longer owned by the Fund, was a material winner and a good example of flexing up a position size based on this compounding/conviction position framework as a way to capitalise on our high conviction divergent view of Alphabet’s near-term earnings trajectory.
It is worth noting that in a conviction position, our tolerance for potential downside to the earnings multiple is much lower. What we mean by this is that to add to a stock exposure with a conviction position, we need to have confidence that the earnings multiple will expand.
We believe this compounding/conviction position framework prevents over-sizing positions that lack near term catalysts and may be vulnerable to negative narrative shifts. It also prevents under-sizing opportunities where we believe we have a clear edge that allows us to take a view that consensus estimates are wrong.
The point of separating these two positions is to recognise that while the Fund can be concentrated, it shouldn’t be the norm. There must be very specific criteria that are satisfied before sizing up a position. Where we’ve suffered drawdowns is where we’ve deviated from this framework. Our intention is to double down on this sharpened framework to reduce the risk that we oversize positions where we like the long-term earnings potential of the business, but the stock sells off due to an interim narrative shift that catches us off guard.
If the facts change or incremental evidence emerges that makes us less confident in our variant perception around upside to earnings estimates in the ensuing quarters, our framework dictates that the conviction position should be reduced or, if warranted, eliminated entirely. The point of the framework is to conceptualise and understand why we’re tilting our exposure into a given stock, and to allow for swift changes to position sizes in the event that the reasons for a conviction position no longer hold.
But being able to keep a smaller compounding position avoids the risk of exiting a position too quickly simply because its run hard, given that the stock might remain at elevated levels if earnings continue to surprise to the upside in ways that we don’t anticipate.
Our framework is evidence based and Bayesian in nature. It requires us to constantly ingest datapoints and update our investment thesis, monitoring the investment to make sure it is on track to hit our numbers. Disconfirmatory evidence is sought after, and used to flex down a conviction position.
If paying a higher multiple that is underpinned by others retaining confidence around a company’s business model and future growth prospects, you must be willing to swiftly adjust your position size to the extent that doubt is cast on any of those factors. And this is the key problem with high conviction investing: your deep work might cause you to remain confident in a stock’s prospects when others lose faith and run for the exits.
The result is often multiple compression that can be detrimental to returns in the short term, even if our assessment of the fundamentals of a business remains correct. This dynamic is exacerbated with complexity. As a rule of thumb, the more complex the investment, the greater the potential for multiple compression when the trajectory of the narrative around that stock shifts negatively. It exposes those who haven’t done the work.
Our compounding/conviction framework aims to take all of these factors into account as a way to ensure that we are able to decisively adjust position sizes where warranted.
Iran War and positioning changes
We wanted to briefly touch on portfolio positioning changes that occurred in March following the outbreak of the Iran War. We will qualify any statements made by noting that we are not macroeconomic or geopolitical prognosticators. We don’t place great faith in our ability to predict the outcome of what is a rapidly evolving conflict. However, we are capable of determining what is priced into stocks, and adjust our positioning as new risks emerge relative to what we believe is being priced in.
We flexed down the Fund’s net exposure from c.94% at the beginning of March to less than 60% shortly following the closure of the Strait of Hormuz in early March. We viewed this as a serious escalation in the conflict that caused a new left tail risk to emerge, and notably one that the market was tardy to price in. Our approach was to short companies that we believed were negatively exposed to fallout from the Iran conflict, and where this potential deterioration of business fundamentals was not being reflected in the share price.
Our view on shorting is that it is ordinarily a low return on time spent form of stock picking. It is also hard, even dangerous, as we elucidate in our piece titled The Perils of Short Selling . We do not seek to have an “always on” short book; we are perfectly comfortable having no shorts if there is nothing compelling to short. However, there are periods where the alpha from shorting becomes very rich, and the ability to rapidly flex up a short book becomes incredible valuable. We believe we entered such a period in March as the Iran conflict unfolded. The Fund’s short book served to insulate against the declining market in the month of March.
Our view is that it is typically foolhardy to drastically shift portfolio positioning for anticipated geopolitical risks. One can easily jump at shadows, and we are firm believers that time in the market is more important than timing the market. We have since increased our net exposure, trimming and exiting many of the shorts that were put on in March.
We are sceptical that this Iran conflict will be smoothly resolved and remain prepared to re-short companies in the event that the conflict starts to escalate again.
Update on the Fund’s AppLovin position
AppLovin (APP), the largest position in the Fund, declined by almost -41% in the March quarter. This drawdown in the stock was a material hit to the Fund’s performance for the quarter. Like many of the Fund’s other holdings, expectations for future earnings for APP have steadily increased, yet the share price plummeted due to misplaced AI-disruption fears. In other words, all of the APP stock price decline was driven by a decline in the earnings multiple.
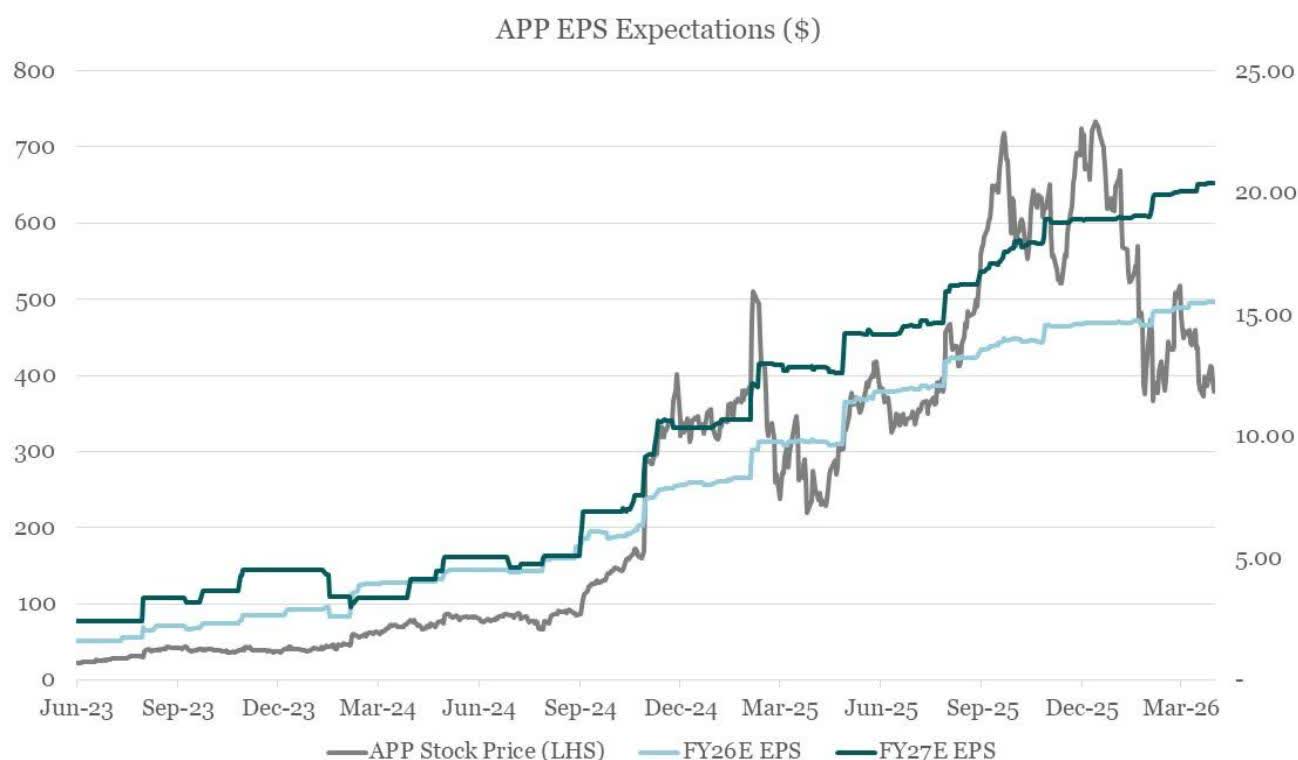
Some of the APP stock price movements during the quarter are worth recounting to highlight the bizarre trading activity we observed. For example, APP declined by -30% in January 2026. This included a -17% single-day selloff following Google (GOOGL)’s announcement of Project Genie – a generative-AI tool enabling users to create 3D playable worlds via text prompts. This price decline appeared irrational to us, given that this development is more likely to be positive for APP. In a world where AI reduces the barriers to game content creation, we would likely see an explosion of new mobile games. And in a world flooded with games, content becomes commoditised, and distribution – that is, getting your game in front of people who want to play it and spend money – becomes the scarce asset.
This plays into AppLovin’s strengths. The company allows mobile game publishers to monetise their games via ads, historically by showing in-game ads for other mobile games (although more recently this has expanded to e-commerce ads). The more games that are created, the more in-game ad inventory which AppLovin can monetise and earn revenue from. More likely than not, an initiative like Project Genie would be a boon for AppLovin’s business, yet the market ruthlessly sold off the stock. This gives some context as to the market environment we have been operating in.
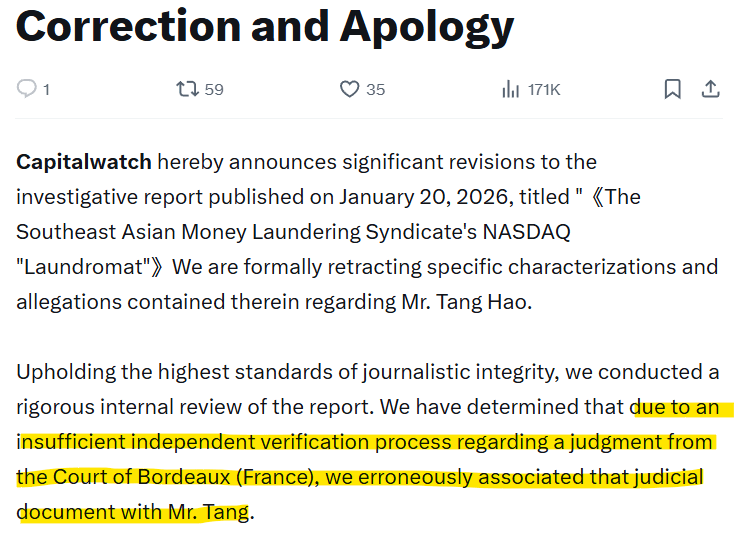
In the same month, AppLovin also came under perhaps the most frivolous short seller attack yet, this time allegedly linking the company’s largest non-insider individual shareholder to all manner of Chinese money laundering and Cambodian “pig butchering” scams. We spent 30 minutes on Google and realised the short seller had mistaken the identity of this shareholder (Mr. Tang Hao) – the central figure of the entire short report – with an entirely unrelated third party.

Three weeks later, the short seller retracted substantially the entirety of its short report after realising the error:
We would note that at its recent all-time high in late December 2025, AppLovin’s stock had more than 10x’d in price since our initial purchase in August 2024. We would also point out that this is a stock that fell by 57% in a less than two month period earlier in 2025. In other words, AppLovin is an unusually volatile stock. Despite this, we have chosen to hold AppLovin as a material position in the Fund because we understand the business well and are of the view that the future growth opportunity is very significant, and, crucially, the market is mispricing this growth potential.
We remain very constructive on APP’s future earnings growth potential for a number of reasons:
Core mobile game ads growth still robust
The core mobile game ads business continues to grow very strongly. For example, in Q4 of 2025, with AppLovin’s e-commerce revenues still in their infancy, the business still managed to grow revenues by 66% year-over-year. This was primarily driven by continued algorithm improvements in AppLovin’s core mobile gaming business. Moreover, AppLovin grew its adjusted EBITDA by 82% year-over-year in Q4 of 2025. The company had 84% adjusted EBITDA margins, with incremental margins of more than 95% in the quarter. In other words, AppLovin is phenomenally profitable and growth is being attained at incredible margins. This is an important point as it relates to the company’s nascent e-commerce initiative.
Promising e-commerce ads rollout
AppLovin has been rolling out its e-commerce initiative in various phases. Firstly, it was a pilot limited to 600 advertisers, that later expanded into a referral program. The company is rolling out its self-service product to advertisers in 1H26. AppLovin has been measured with the rollout of this initiative, spending the time to build out various functions and integrations to ensure that greenlighting the initiative for General Availability will go smoothly. The crux of the self-service platform is that it automates the onboarding of advertisers so that smaller merchants can launch ad campaigns without needing hands-on support from AppLovin’s team. This means that the growth of advertisers on AppLovin’s platform could be explosive. They can bond their credit card to the portal and start spending in short order. This opens up a veritable wall of spend that we believe will find its way to AppLovin’s platform, given positive early return on ad spend (ROAS) feedback we’ve heard from advertisers and the desire for a credible third platform for scaled user acquisition spend outside of Google and Meta (META).
Growth carries attractive economics
The economics of this e-commerce initiative are unusually compelling for AppLovin. The company pools together ad dollars and purchases ad impressions on a CPM basis (we explain APP’s business model in more detail in our September 2024 quarterly letter ). APP CEO Adam Foroughi disclosed at the Morgan Stanley (MS) TMT Conference in March 2026 that the company had a 1.3% conversion rate (CVR) on the ads served by AppLovin. This means that AppLovin loses money on 98.7% of the ads they serve; in other words, APP purchased that ad impression but there was not a monetisation event against the impression from which they could earn revenue. This is an incredibly bullish data point for a number of reasons:
• APP can serve e-commerce ads against the ad impressions that are likely to be wasted on gaming ads. Given that AppLovin has already paid for these ad impressions, the effective take rate on these impressions for an e-commerce ad that converts is 100%.
• The introduction of e-commerce ads will lead to a greater diversity of ads on AppLovin’s platform, producing additional signal to improve the company’s ad targeting algorithms. Foroughi has spoken about eventually getting to a 5% CVR, up from the current 1.3%.
• Such an increase in the CVR could drive a multiple-times increase in AppLovin’s revenue without any increase in advertiser ad spend (stylised example below). Of course, higher CVR should also deliver improved return on ad spend (ROAS), prompting advertisers to spend more with AppLovin. And given the wonderful economics of AppLovin’s platform, these revenues would come in at close to 100% incremental margins.
APP is an applied AI winner
Finally, AppLovin’s self-service rollout is coinciding with the exponential improvement in video generation models. Historically, mobile game studios have had dedicated teams churning out highly interactive, long-form, unskippable video ads and playable end cards. E-commerce merchants and direct-to-consumer brands usually don’t have those resources; they are accustomed to putting standard image or short video assets onto platforms like Meta or TikTok (TIKTOK) where watch time is less than five seconds.
Simply porting over these ads is suboptimal. AppLovin’s video-based ad network operates in a full attention environment: the average watch time of ads on the platform is an unskippable 30 seconds, with 81% of ads served being longer than 30 seconds. AppLovin is rolling out automated video ad generation, significantly easing the burden of ad creation for e-commerce brands, which should have two key impacts: 1) it should improve AppLovin’s top-of-funnel efficiency with converting brands to active advertisers, given that only 57% of qualified leads currently convert to active campaigns (with the biggest cause of lead breakage due to those brands not having video ads); and 2) it is likely to dramatically increase the velocity of spend on the platform, precipitating an explosion in ad dollars flowing through AppLovin’s platform.
We were able to add to the Fund’s AppLovin position at sub-$400, a level which we believe represents compelling value. At these levels the business is being valued at 25x forward GAAP EPS, despite sellside expecting earnings to more than double from 2025 to 2027. In talking to a number of investors, it seems that they are put off by the complexity of AppLovin’s business. However, to the extent that APP’s robust growth continues, it becomes harder for investors to ignore this stock.
We would like to sincerely thank you for your continued support and patience. Periods such as this most recent quarter test conviction, but they also create the conditions from which strong long-term returns are ultimately generated. We remain highly confident in the businesses we own in terms of their competitive positions, ability to compound earnings, and the gap we see between price and intrinsic value. Our capital is invested alongside yours, and we remain focused on navigating the near term with discipline, sticking to our process while positioning the Fund to capture the substantial opportunity we believe lies ahead.
Kind regards,
Bristlemoon Capital
References
- * Excludes derivative positions.
- Source: Bristlemoon Capital
- Source: Bristlemoon Capital; Bloomberg
Editor’s Note: The summary bullets for this article were chosen by Seeking Alpha editors.

Form 4 Beyond Meat Inc For: 14 July
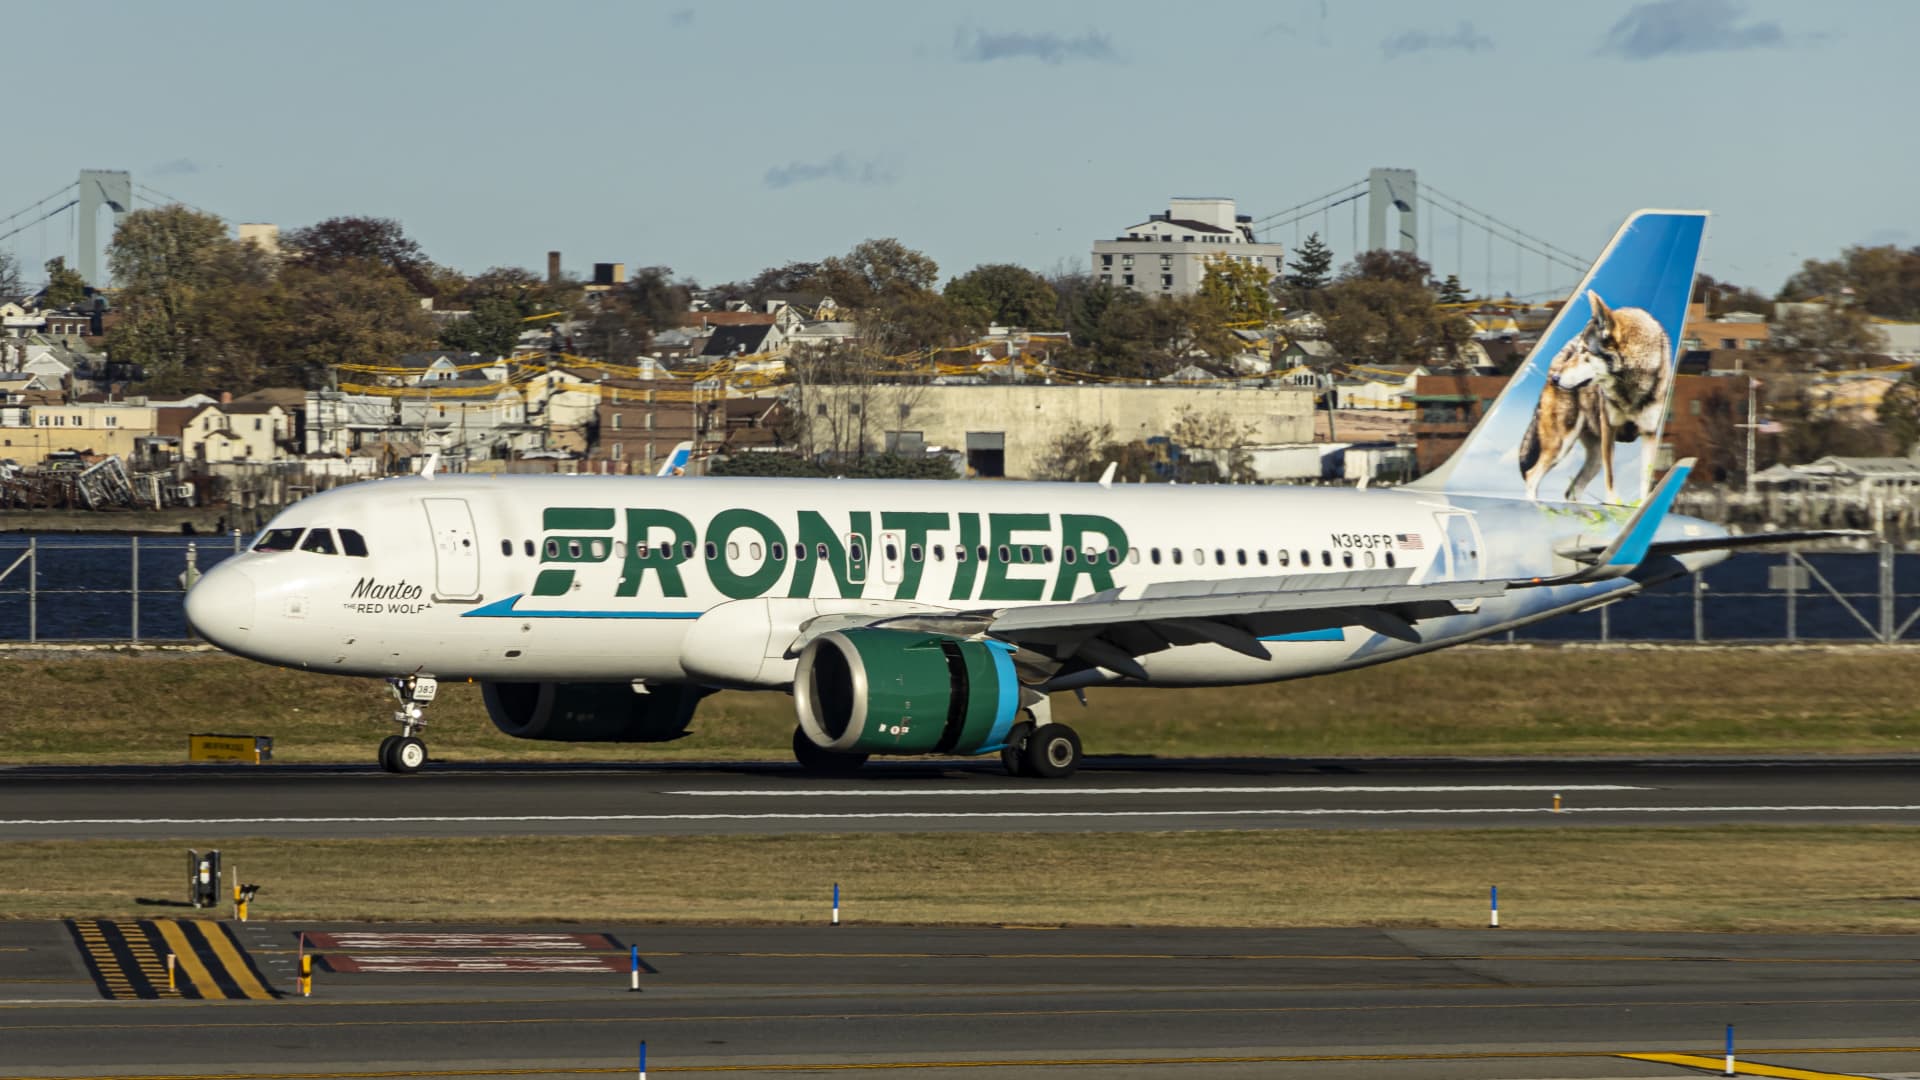
Frontier Airlines
Nurphoto | Nurphoto | Getty Images
Frontier Airlines and four other budget carriers with more than 1,000 planes between them will debut in-flight Wi-Fi early next year from SpaceX‘s Starlink, another win for the satellite internet provider.
Frontier’s first Airbus plane equipped with Starlink internet will roll out in early 2027, the airline said Tuesday. CNBC reported in 2022 that Frontier was in talks with Starlink to add its first in-flight Wi-Fi service.
A Frontier spokeswoman declined to say whether flyers could use the service for free. Major airlines that have signed deals with Starlink have been offering Wi-Fi complimentary for loyalty program members.
Frontier was one of the last U.S. holdouts to add Wi-Fi. Former CEO Barry Biffle previously said the airline was hesitant to to add weight to its planes with the equipment it would need for the service.
Starlink, a part of Elon Musk‘s SpaceX, has signed deals with more than 40 carriers around the world, including United Airlines and American Airlines, as airlines ramp up their in-flight services and customers grow to expect at-home-quality internet in the sky. The airlines declined to disclose the terms of the agreements. SpaceX didn’t immediately comment.
The carriers in the latest Starlink deal — Frontier, Mexico’s Volaris, European budget carrier Wizz, Chile’s Jetsmart, and the Philippines’ Cebu Pacific — all share private equity firm Indigo Partners as an investor, which is led by serial airline investor Bill Franke.
Budget carriers have been under pressure to go upmarket as larger rivals post revenue growth from the front of the cabin, upending discounters’ once-profitable model of no-frills seating and amenities. Frontier is planning to debut first-class seats next year.


The World Cup’s biggest economic boost is arriving later than expected as the tournament enters its final days.
But for the U.S. businesses hoping for a soccer boom, it’s better late than never.
This week’s semifinals pit France against Spain in Dallas on Tuesday and England versus Argentina in Atlanta on Wednesday. Travel bookings have accelerated as the field of competitors narrows and fans converge from around the world to see the high-stakes matches.
Every U.S. host city has seen an economic lift from soccer fans, according to Bank of America Institute.
“You can see the World Cup effect on the ground,” said David Tinsley, senior economist at Bank of America Institute. “Spending picked up after the tournament kicked off, with restaurants and bars seeing some of the strongest gains as consumers turned matches into social events.”
In-person spending in U.S. host cities rose 5% over last year from June 10 to July 5, with Kansas City leading the gains, according to analysis from Bank of America credit and debit cards.
Argentina supporters dine at Joe’s Kansas City BAR-B-QUE barbecue restaurant in Kansas City, Missouri, United States on June 14, 2026, ahead of the 2026 World Cup football match between Argentina and Algeria.
Juan Mabromata | AFP | Getty Images
The impact could be much higher, since the results capture only spending with BofA cards in U.S. households and does not include cash, checks and spending by international tourists or on corporate cards.
Kansas City also saw the biggest weekly hotel performance gain among host markets, with revenue per available room (RevPAR) up nearly 50%, according to data from industry analysis firm CoStar. Philadelphia also saw a strong lift, with weekend RevPAR up more than 74% as its World Cup match coincided with Fourth of July celebrations and America 250 events.
That was a relief to hotel owners who worried before the World Cup kicked off about soft advance hotel bookings and FIFA releasing large blocks of rooms back into the market.
Fans react during a watch party for a FIFA World Cup 2026 round of 16 match between France and Paraguay at Lion Sports Bar on July 4, 2026 in Philadelphia, Pennsylvania.
Joe Lamberti | Getty Images
It’s not that hotels are sold out. During the final week of the tournament’s group stage, occupancy actually declined almost 3% over last year in U.S. host cities, indicating some business and leisure travelers altered their plans. But even in early stages of the World Cup, host city hotels charged 21% higher rates, according to CoStar.
As the tournament moved into the knockout stage, demand from June 28 to July 4th increased 2.4% from last year and RevPaR rose 23%, despite the World Cup having 50% fewer matches than the previous week.
Demand for short-term rentals also increased beside higher stake matches, according to analytics company AirDNA.
“I guess, for some of the later stage games, people waited until they knew who was going to be playing,” said Braham Gallagher, AirDNA’s director of economic forecasting
“Argentina shows what it looks like when fans book a trip the moment their team wins,” said Bhanu Chopra, founder of RateGain Travel Technologies and creator of the FIFA World Cup 2026 Market Pulse Index. “Argentina fans are following the tournament closely and responding with bookings in real time.”
Chopra said flight bookings from Argentina are up nearly 46% year over year since the tournament kicked off. Bookings from Argentina to Atlanta — where the team played its round of 16 match and will play its semifinal Wednesday — more than doubling over that time, rising nearly 108%.
Overall bookings to World Cup host cities are up nearly 4% over last year, according to the data. After the opening match, flight reservations jumped nearly 75% from the previous week.
Flight bookings to New York/New Jersey for the final from Argentina are still lagging, down about 15% year over year, while bookings from Argentina into Miami — host of the third-place match — are up nearly 17%.
Chopra said that suggests some Argentina fans are hedging rather than assuming their team will make the final. If Argentina beats England, he expects New York bookings to increase quickly.
AirDNA data shows short-term rentals for the final match in Newark and Jersey City, New Jersey are already 45% higher than last year. Gallagher says it indicates overall appetite for the last big hurrah of the World Cup and the way New York City’s strict rules against short-term rentals affect demand.
That’s driving prices higher. Corporate travel agency Navan said the average hotel room rate in New York City was already above $1800 nightly before the tournament even began.
Fans who reserve now are ready to spend, on last minute international flights, scarcer hotel or AirBnB rentals and on meals to celebrate their teams. And don’t forget tickets to the match!
After the U.S. and Mexico were eliminated, resale prices for several quarterfinal matches fell sharply. Still, FIFA still had nearly 1,200 mid-tier tickets for the final late last week, available at $7,380 each.

United Airlines will upsell customers to sit in a row with an empty middle seat.
United Airlines
United Airlines has a new way to entice customers to pay more on board: no middle seat neighbor.
The carrier said Tuesday that one of the rows on its Airbus A321XLRs will have an empty middle seat with a tray table for the aisle- and window-seat customers to share. The seats, which are in the extra legroom section, go on sale later this year so it’s not clear just how much more United will charge. The seating plan is more common on European airlines where it’s sold as business class for short-haul flights.
United said it could later add them to other aircraft beyond those new, long-range narrow-body planes.
The new upsell is just one of many airlines are throwing out to get customers to pay more to fly. Last week, Delta Air Lines joined United in launching basic business-class and premium economy fares that don’t come with perks that used to be included in the ticket. For example, Delta will no longer include access to its top-tier Delta One lounge or seat selection with its cheapest long-haul business-class tickets.
United in March also said it plans to launch a set of three economy seats that can be converted into a bed, which it’s calling the “Relax Row” on some of its wide-body planes.
Airlines have spent years adding more premium-class seats to make bigger business-class cabins where spending has been more resilient. The bottlenecks of ever-more-elaborate seats have even delayed deliveries of new planes.
Free VPNs are not all built the same. Some give you unlimited data, others let you pick a location but cap how much you can use each month. The differences become much clearer once you compare them side by side.
For this X-VPN review, we tested all three under comparable free-plan conditions. We compared their speeds, kill switches, ads, protocol options, privacy practices, device limits, and data restrictions.
The goal is simple: to see how X-VPN Free performs in everyday use, where it stands out, where it falls behind, and how it compares with Proton VPN Free and Windscribe Free.
X-VPN Free vs Proton VPN Free vs Windscribe Free
X-VPN, Windscribe, and Proton VPN all offer a permanent free plan, but they place the limits in very different places.
Here is how the three free plans compare before testing:
| Feature | X-VPN Free | Windscribe Free | Proton VPN Free |
| Registration | Not required | Account required | Proton Account required |
| Not required | Optional; 2GB without a verified email, 10GB with one | Required; verification was not needed to use the free plan in our test | |
| Data allowance | Unlimited | 2GB or 10GB per month | Unlimited |
| Simultaneous connections | Unlimited devices | Unlimited personal devices | 1 device |
| Free locations | 15 countries | 10 countries | 10 countries |
| Manual location selection | Available on iOS and Android | Available | Not available |
| Server switching | 15 countries in the tested iOS app; automatically assigned on macOS | Manual selection available | Automatically assigned, with cooldowns between server changes |
| Kill switch | Included | Included as Firewall | Included |
| In-app ads | No ads on desktop; ads on iOS and Android | No ads | No ads |
| No-logs audits | 2026 ISAE 3000 no-logs audit by Deloitte | App and server infrastructure audits | Five consecutive years of public no-logs audits |
On features alone, X-VPN is the least restrictive of the three. It combines unlimited data with no registration, unlimited device use, and a larger selection of free locations. Windscribe offers more control than Proton VPN, but its monthly allowance makes it harder to use continuously. Proton VPN takes the opposite approach: there is no data cap, but free users give up server choice and can connect only one device at a time.
That does not make the feature table a final ranking. A free VPN can offer more locations and still be slow, or include a kill switch that behaves differently across platforms.
The rest of this review tests whether these differences matter in practice. We will check how reliably the security features work, how the three services perform on the same network, and whether restrictions around ads, servers, protocols, and device use change the everyday experience.
How We Tested the Three Free VPNs
We tested X-VPN Free, Windscribe Free, and Proton VPN Free in the United States using the same Wi-Fi connection. Testing was carried out on a 13-inch MacBook Pro running macOS 26.2 and an iPhone 17 running iOS 26.5.1. All speed tests were measured with Speedtest by Ookla.
Every test was run strictly on the free plan. We did not use trials, paid accounts, premium servers, or paid-only features. We also did not keep reconnecting until a VPN produced a better result. If a service assigned the server automatically, we treated that lack of choice as part of the free experience.
How Restrictive Is Each Free Plan?
The three free plans place their limits in different areas. X-VPN removes most account, data, and device restrictions. Windscribe offers stronger server control but caps monthly usage. Proton VPN provides unlimited data but limits both devices and server choice.
Account and Email Requirements
| VPN | Account required | Email required | What we found |
| X-VPN Free | No | No | We could open the app and connect immediately without providing any information. |
| Windscribe Free | Yes | Optional | A username and password were enough to connect. Adding an email increased the monthly data allowance. |
| Proton VPN Free | Yes | Yes | Proton sent a verification email, but we could use the free VPN without verifying it. |
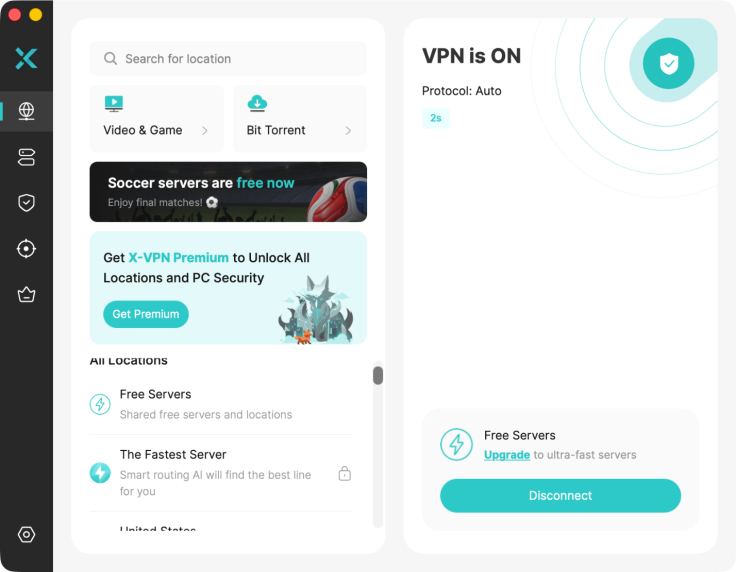
X-VPN free
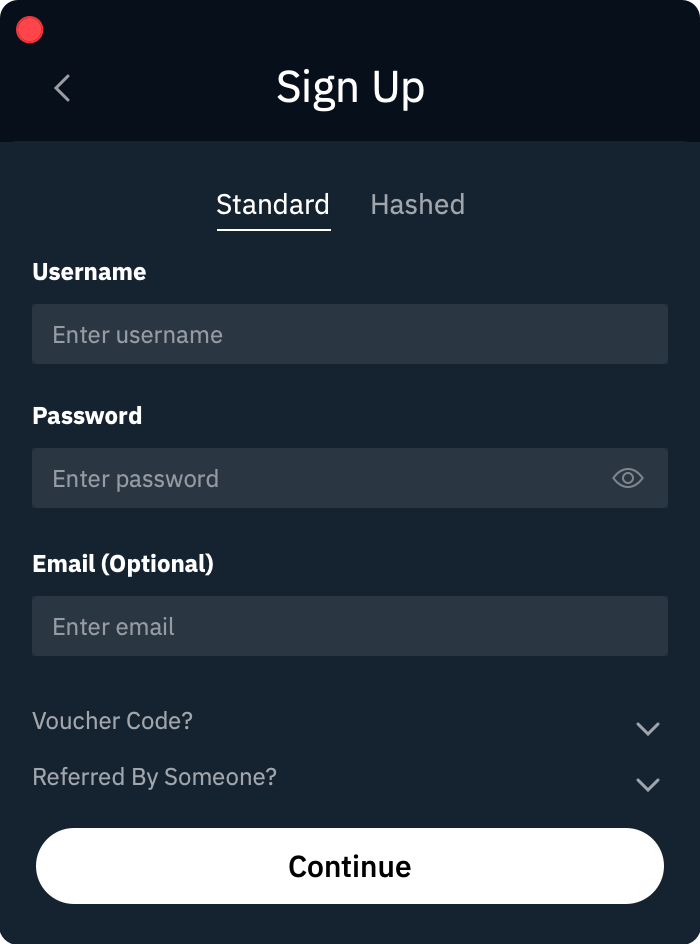
Windscribe free
Proton VPN free
X-VPN had the lowest entry barrier and collected the least information during setup. Windscribe offered a middle ground by requiring an account but not an email.
Data Limits
| VPN | Data allowance | Usage counter |
| X-VPN Free | Unlimited | No |
| Windscribe Free | 2GB per month without an email; 10GB with one | Yes |
| Proton VPN Free | Unlimited | No |
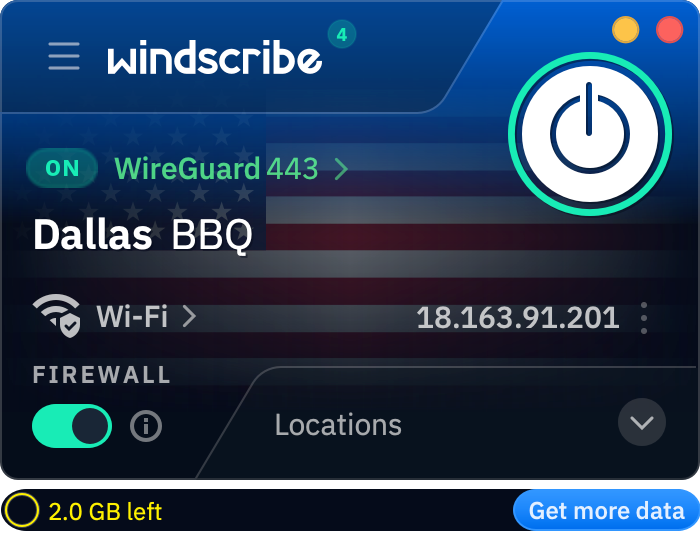
Windscribe limits users to 2GB per month without a verified email address, or 10GB with one
Windscribe clearly displayed the remaining allowance in the app. Its cap may be enough for occasional browsing, but it is more restrictive for continuous use.
Device Limits
| VPN | Free device policy |
| X-VPN Free | Can be used on multiple devices at the same time without an account |
| Windscribe Free | Supports multiple devices |
| Proton VPN Free | Limited to one active device |
X-VPN and Windscribe were easier to use across a laptop and phone. Proton required an upgrade for additional simultaneous connections.
Server Access and Location Control
| VPN | Free locations | Manual selection | City-level servers |
| X-VPN Free | 15 countries in the tested iOS app | Mobile: yes; macOS: automatic connection only | 13 US cities on iOS |
| Windscribe Free | 10 countries | Yes | Available in supported locations |
| Proton VPN Free | Automatically assigned free server | No | No |
Windscribe provided the most consistent manual server control. X-VPN offered country and city selection on mobile, but not on macOS. Proton gave free users the least control, since both the initial server and any replacement were assigned automatically.
Overall, X-VPN was the least restrictive for registration, data, and device use. Windscribe offered better server control but imposed a monthly cap, while Proton combined unlimited data with stricter device and location limits.
Do the Kill Switches Actually Work?
All three free VPNs included a working kill switch, although they handled it slightly differently.
X-VPN and Proton VPN both left the feature off by default, so we had to enable it manually. Windscribe calls its version Firewall rather than Kill Switch, but it serves the same purpose and switched on automatically when we connected to a free server.
| VPN | Feature name | Available on free plan | Default behavior |
| X-VPN Free | Kill Switch | Yes | Off by default |
| Windscribe Free | Firewall | Yes | Turns on automatically when connected |
| Proton VPN Free | Kill Switch | Yes | Off by default |
Kill Switch Test Results
We first opened IPLeak without a VPN and confirmed that it showed our real location and IP address. We then connected each VPN, enabled its kill switch where necessary, and refreshed the page to confirm that the VPN server IP had replaced the original one.
Next, we forced the VPN connection to drop and tried to reload the page.
| VPN | VPN IP shown while connected | Internet blocked after VPN drop | Result |
| X-VPN Free | Yes | Yes | Passed |
| Windscribe Free | Yes | Yes | Passed |
| Proton VPN Free | Yes | Yes | Passed |
In all three tests, the page stopped loading completely once the VPN connection was interrupted. None of the apps allowed the browser to fall back to the regular internet connection.
Speed Test: Which Free VPN Is Fastest?
Speed is where the three free plans showed the clearest difference. X-VPN kept the largest share of our original connection speed, while Proton VPN recorded the biggest slowdown, particularly on uploads.
Test Conditions
We tested all three VPNs in the United States using the same MacBook, Wi-Fi network, and testing period. All results were measured with Speedtest by Ookla.
X-VPN was tested over WireGuard, Windscribe over its Stealth mode, and Proton VPN connected over IKEv2 in our test. We recorded a fresh no-VPN baseline before testing each app. Since the baseline changed slightly between runs, the percentage loss gives a fairer comparison than the raw Mbps figures alone.
Speed Test Results
| VPN | No-VPN Download | VPN Download | Download Loss | No-VPN Upload | VPN Upload | Upload Loss |
| X-VPN Free | 248.01 Mbps | 198.65 Mbps | 19.9% | 216.53 Mbps | 138.03 Mbps | 36.3% |
| Windscribe Free | 247.90 Mbps | 114.31 Mbps | 53.9% | 213.25 Mbps | 91.61 Mbps | 57.0% |
| Proton VPN Free | 235.27 Mbps | 88.05 Mbps | 62.6% | 203.97 Mbps | 5.76 Mbps | 97.2% |
X-VPN delivered the fastest result in our test configuration. It retained about 80% of the baseline download speed and remained comfortably fast for browsing, downloads, and high-resolution video.

X-VPN baseline speed without a VPN: 248.01 Mbps download and 216.53 Mbps upload
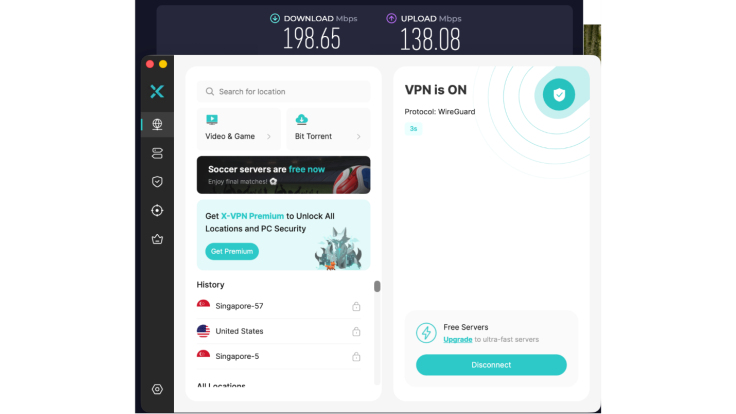
X-VPN Free speed over WireGuard: 198.65 Mbps download and 138.03 Mbps upload
Windscribe remained usable, but its download speed fell by about 54%, while uploads dropped by 57%.

Windscribe baseline speed without a VPN: 247.90 Mbps download and 213.25 Mbps upload
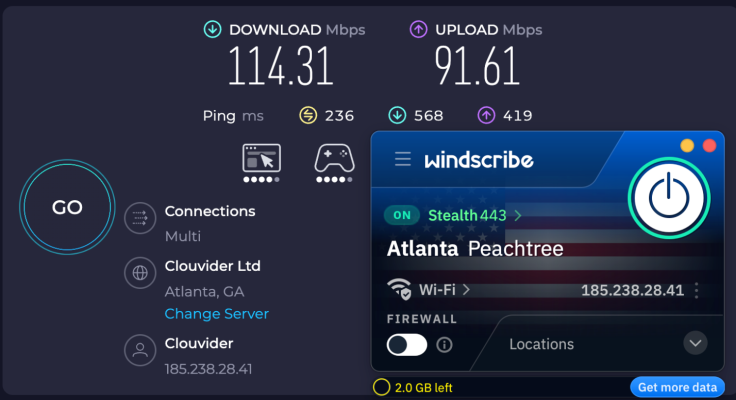
Windscribe Free speed over Stealth mode: 114.31 Mbps download and 91.61 Mbps upload
Proton VPN had the weakest result. Download speed fell from 235.27 Mbps to 88.05 Mbps, and upload speed dropped to just 5.76 Mbps. The download connection was still sufficient for everyday browsing and other download-heavy tasks, but the upload result could be restrictive for cloud backups, large file transfers, or video calls.

Proton VPN baseline speed without a VPN: 235.27 Mbps download and 203.97 Mbps upload
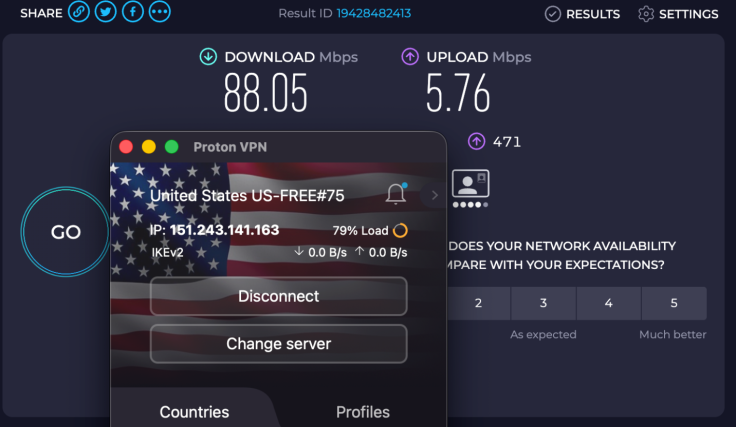
Proton VPN Free speed over IKEv2 during our test: 88.05 Mbps download and 5.76 Mbps upload
Speed Verdict
Based on this round of testing, X-VPN Free delivered the best balance of download and upload performance. Windscribe placed second, while Proton VPN showed the largest speed loss.
These results reflect the free server assigned or available during our test, rather than the maximum speed each service can achieve. Free-server load, distance, and automatic server selection can all affect performance, so results may differ by location and time.
Ads
The three free apps handled ads very differently.
| VPN | Desktop ads | Mobile ads | What we found |
| X-VPN Free | None | Yes | The macOS app was completely ad-free. On mobile, an ad appeared when connecting and closed automatically after a short wait. |
| Windscribe Free | None | None | We did not encounter ads during testing. |
| Proton VPN Free | None | None | We did not encounter ads during testing. |
X-VPN’s desktop experience was just as clean as Windscribe and Proton VPN. Its mobile ads added some friction, but they did not prevent us from connecting or using the VPN normally. Windscribe and Proton VPN provided the cleaner overall experience because neither displayed ads.
Protocol Choice on the Free Plans
Which Protocols Are Available?
| VPN | Available protocols | Manual selection |
| X-VPN Free | WireGuard, OpenVPN, Everest | Yes |
| Windscribe Free | WireGuard, OpenVPN, IKEv2, Stealth | Yes |
| Proton VPN Free | Managed automatically; IKEv2 in our test | No |
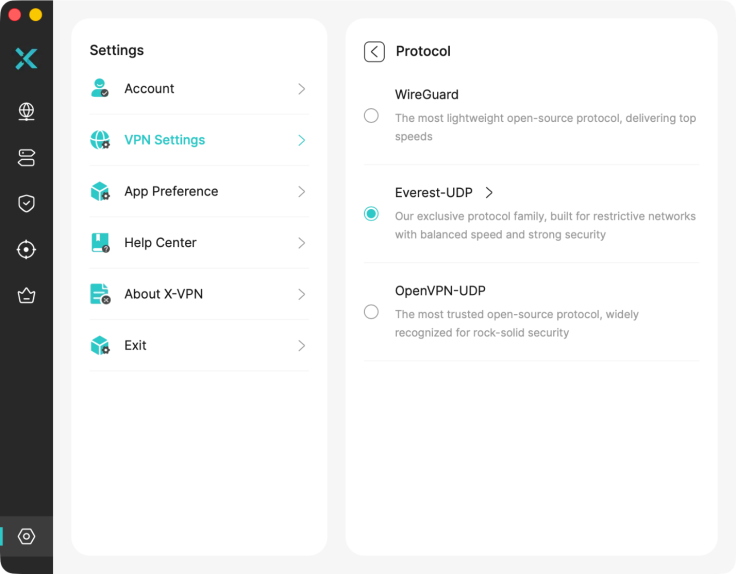
X-VPN Free let us manually select Everest, OpenVPN, or WireGuard. These options were available without upgrading or signing in.
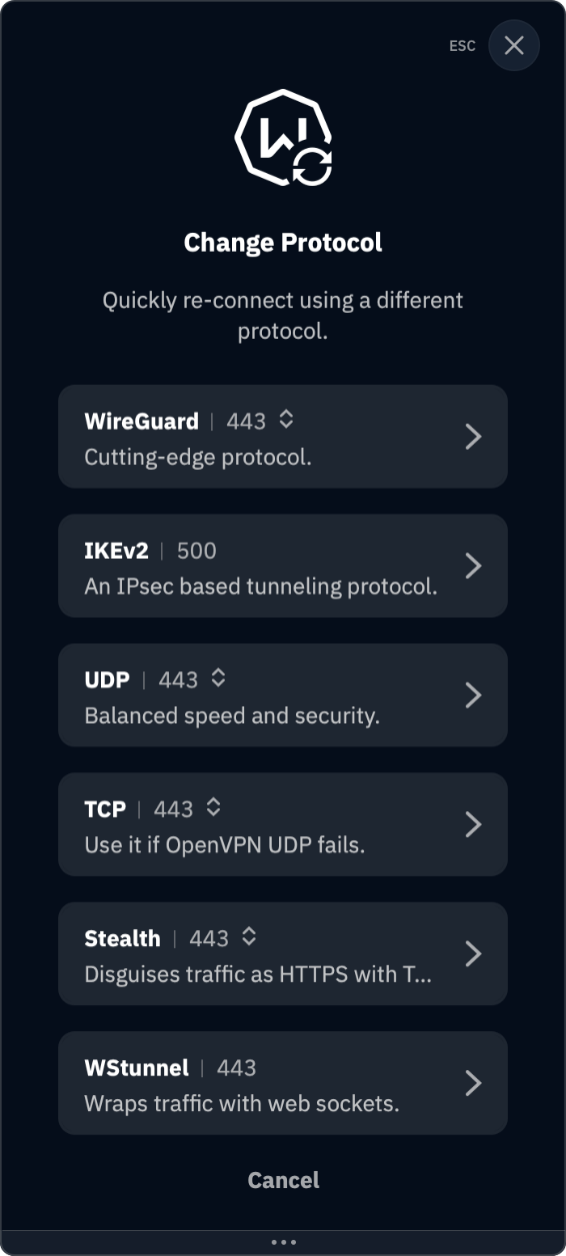
Windscribe also offered several protocols, including WireGuard, IKEv2, OpenVPN, and its Stealth mode.
Proton VPN took a simpler approach: the free app selected the connection protocol automatically and did not provide a manual protocol menu.
Are the Protocols Easy to Find?
X-VPN displayed each protocol by name under VPN Settings > Protocol, making the options easy to find and switch between.
Windscribe also showed protocol names inside the app.
Proton VPN required no protocol setup, which may be easier for beginners, but it also gave free users no control over which protocol was used.
Overall, X-VPN and Windscribe offered the most flexibility. Proton prioritized automatic configuration over manual choice.
Privacy: What Do Free Users Give Up?
All three services extend their core no-logs protections to free users. The main difference is how much information they require at signup and how much limited account data they retain.
X-VPN Free
X-VPN applies the same no-logs policy to free and paid users. Its systems and supporting operations underwent an independent limited assurance engagement by Deloitte Singapore under ISAE 3000 (Revised), with testing concluded on February 28, 2026.
According to the report and privacy policy, X-VPN does not collect or store user or destination IP addresses, browsing activity, visited websites, VPN server information, DNS queries, downloaded content, connection timestamps, or sensitive payment details. Free users can also connect without creating an account or providing an email address, giving X-VPN the strongest data minimization at signup.
Windscribe Free
Windscribe requires a username and password, but an email address is optional. Its privacy policy states that it does not store source IP addresses, visited websites, or historical VPN sessions.
It does retain the total amount of data transferred over a 30-day period, the timestamp of the account’s last activity, and the number of simultaneous connections. Windscribe says this information is used to enforce free-plan limits and prevent abuse rather than track browsing activity.
Windscribe has also published independent audits of its FreshScribe server stack, desktop app, and mobile apps. These are presented as infrastructure and application security audits rather than a recurring annual no-logs assurance program.
Proton VPN Free
Proton VPN’s no-logs policy covers both free and paid users. It states that it does not log internet traffic, communication content, or VPN session data.
Its no-logs infrastructure has undergone five consecutive annual audits by Securitum. The 2026 review examined whether Proton stored browsing activity, DNS queries, destination services, traffic content, or user-identifiable connection metadata and found no persistent records linking a user to activity through the reviewed servers.
Proton required us to create an account and provide an email address. That adds more account data than X-VPN or an email-free Windscribe account, although it does not mean Proton records VPN activity.
Ease of Use
| VPN | Setup | Server control | Protocol controls | Ads |
| X-VPN Free | Install and connect; no account required | Automatic on macOS; manual country and US city selection on mobile | Clearly labeled and manually selectable | None on desktop; connection ads on mobile |
| Windscribe Free | Install, create a username and password, then connect | Manual country and city selection | Clearly labeled and manually selectable | None |
| Proton VPN Free | Install, create an account with an email, then connect | Server list is clear, but selection is automatic | Protocol selected automatically | None |
Final Scorecard
Because stability and streaming were not included in the final comparison, we used the following weights:
| Category | Weight | X-VPN Free | Proton VPN Free | Windscribe Free |
| Free-plan value | 20% | 9.5 | 7.5 | 7.5 |
| Privacy and data handling | 25% | 9.0 | 9.5 | 8.0 |
| Security and kill switch | 20% | 9.0 | 9.0 | 9.5 |
| Speed | 20% | 9.0 | 4.5 | 7.0 |
| Ease of use and ads | 10% | 8.5 | 8.0 | 8.0 |
| Protocol choice | 5% | 9.5 | 4.0 | 9.5 |
| Overall | 100% | 9.1/10 | 7.6/10 | 8.1/10 |
Final Verdict: Is X-VPN Free Worth Using?
Yes. X-VPN Free is worth considering for users who want a VPN they can install and use immediately without creating an account, watching a data counter, or managing device slots.
Its main advantage over Proton VPN and Windscribe is not a single feature. It is the combination of no registration, unlimited data, unlimited device use, a working kill switch, manual protocol selection, and the best speed result in the configuration we tested. Its main compromises are mobile ads and more limited server control on macOS.


Paramount Skydance is still aiming to close its proposed acquisition of Warner Bros. Discovery by the end of September despite a recent lawsuit filed by state attorneys general challenging the deal, Paramount’s lead trial counsel Jeffrey Kessler told CNBC’s David Faber in an interview on Tuesday.
On Monday, a group of state attorneys general led by California’s Rob Bonta filed a lawsuit aimed at blocking the merger due to antitrust concerns. Later in the day, the group filed court papers seeking a temporary restraining order to put the deal on hold so that legal proceedings could move forward.
Either way, Kessler said that the company is prepared to bring the matter to the Supreme Court if it faced a prolonged blockade in closing the deal.
“The company believes strongly in this,” Kessler said of the combination of the entertainment and media companies.
Kessler told Faber on Tuesday the temporary restraining order came after Paramount “indicated” that its intention was to be able to close as early as July 22, when the company expects to have all regulatory clearances.
The July date stems from the next big hurdle Paramount needs to clear. The European Union has been reviewing the deal for approval and recently set July 22 as a new provisional deadline. Paramount recently submitted concessions to the EU as it looks to smooth concerns regarding the deal.
In an aerial view, the Paramount logo is displayed on a water tower at the Paramount Studios lot on July 13, 2026 in Los Angeles, California.
Justin Sullivan | Getty Images
The proposed acquisition that would bring together the two storied film studios of Warner Bros. and Paramount, as well as a sprawling portfolio of pay TV networks, has already received approval from the Antitrust Division of the U.S. Department of Justice, as well as other global jurisdictions.
“Or we could work out a schedule to get this all decided by early September, that would be perfectly acceptable to the company if we could create an orderly procedure,” Kessler said. “The states rejected both alternatives so right now we have a [temporary restraining order] that’s been filed.”
If granted, it would pause the deal for 14 days. Up to two temporary restraining orders could be granted before the coalition seeks a preliminary injunction, putting the deal on ice while it’s sorted out in court. Kessler said on Tuesday the company doesn’t expect it to get to that point, arguing this isn’t an antitrust issue.
A long delay could be costly for Paramount. As part of the deal, Paramount has agreed to pay a so-called ticking fee, meaning that if the closing goes past Sept. 30, Paramount would pay additional fees to WBD shareholders per quarter until closing. That fee would equal roughly $650 million in cash value per quarter.
For it to be delayed or blocked, “the merger has to be anti-competitive. This merger is pro-competitive,” Kessler told Faber.
“Anybody who knows the entertainment industry knows it is in deep trouble,” he added, noting widespread challenges as consumers flee pay TV bundles and competition among streaming giants like Netflix intensifies.
He added that the merger would create a competitor that could “go toe to toe with a Netflix or Disney or [Amazon’s] Prime,” which would be a positive for the theater industry and Hollywood workers.
On Monday, Bonta said in a release that the merger would “lead to higher prices, lower quality, and less content for film and television, harming movie theaters, basic cable distributors, and ultimately, audiences on every sofa and movie theater seat in the U.S.”
As Hollywood has expressed concerns since the deal was announced, Paramount CEO David Ellison has promised that once merged, the film studios would together put out a slate of 30 movies annually.
“We’ve told the states if they have what they think are legitimate concerns, they should come to the table and we talk about them,” said Kessler, noting the question of whether Paramount could deliver the 30 films per year.
Kessler said that Paramount has told state attorneys general the company is willing to put in writing that it would commit to the 30 films, and if it doesn’t happen, litigation could then take place.

Mr Waterville’s flat run to prepare him for 2026 Grand National Hurdle

Grok Build was uploading entire Git repositories to xAI’s cloud, including committed secrets

Coinbase Says AI Now Writes Over 95% of Its Code


-

 Fashion6 days ago
Loro Piana Fall 2026 Enters Houston’s Art Scene
-

 Fashion4 days ago
Weekend Open Thread: Nutriplenish Leave-In Conditioner
-
 Sports5 days ago
2026 Genesis Scottish Open Thursday TV coverage: Round 1
-

 Tech7 days ago
Anthropic brings Claude Cowork to mobile and web as usage data shows most users aren’t coding
-

 Sports5 days ago
Super Eagles star Moses Simon opens up on Liverpool transfer regret
-

 Tech5 days ago
Character.AI enters the microdrama arena with its own productions, but there’s a twist
-

 News Videos6 hours ago
XRP BOMBSHELL… XRP OMBOARDED FOR TRANSACTIONS!!!
-
 Tech20 hours ago
Get Your ESP32 Sunny Side Up With This Solar Dev Board
-

 Tech5 hours ago
Dark Secrets Emerge When Jailbreaking LLMs
-

 News Videos6 days ago
Crypto Just Entered Its Most Important 6-Month Candle (Could Decide Everything!)
-

 Business7 days ago
ASX 200 Slides Over 0.6% as Rare Earths and Lithium Stocks Tumble Amid Global Semiconductor Sell-Off Today
-
 NewsBeat6 days ago
Major update after Huntingdon train attack as man enters plea
-
 Business7 days ago
Will Trent shares rebound after Q1 update triggers 13% crash? Here’s what technical charts indicate
-

 News Videos1 day ago
how to make coin bank box with cardboard #scienceproject #money #diy #shorts
-

 Business7 days ago
SpaceX Shares Slide Nearly 6% Amid Post-IPO Volatility and Starship Test Focus
-

 Sports6 days ago
39-year-old Djokovic wins five-hour thriller to enter Wimbledon semis | Other Sports News
-

 Tech6 days ago
Level Infinite Launches Gangstar Mirage City in India with Pre-Registrations
-
 Tech1 day ago
Cloudflare Precursor Watches Your Mouse and Keyboard To Decide If You Are Human
-

 Tech6 days ago
Entra passkey enrollment vishing targets Microsoft 365 users
-
 Crypto World6 days ago
DeFi Dashboard Zapper to Shut Down After 7 Years
You must be logged in to post a comment Login