

Crypto World
Bitcoin, Ethereum Reverse CPI-Fueled Gains as Strategy Stays Quiet: Your Weekly Crypto Recap

Bitcoin dipped on a couple of occasions below $62,000 during the previous business week, prompted by Strategy’s largest sale to date and the renewed attacks in the Middle East. However, it recovered a lot of ground by the weekend and spent it trading sideways at around $64,000.
Monday began with another nosedive to under the aforementioned level as the market priced in the new attacks between the US and Iran from Saturday and Sunday. Nevertheless, the bulls showed strong conviction and managed to defend that level.
All eyes turned to the US CPI data for June, which went live on Tuesday. Most market experts believed there would be a significant reduction from the May multi-year record, from 4.2% to somewhere around 3.8%-3.9%. However, the actual data was even more promising, showing a drop to 3.5%.
The primary cryptocurrency reacted immediately to the seemingly slowing inflation, rocketing to $64,000 within hours and up to $65,500 on Wednesday. The latter became its highest price tag in approximately three weeks.
However, BTC’s rally came to a halt at that point. The cryptocurrency started a gradual decrease, which pushed it south to $62,400 earlier today. Although it has recovered about a grand since then, it’s still down by more than 2% weekly. Many altcoins have shown even more profound losses, with HYPE leading this adverse trend.
Hyperliquid’s native token has plunged by more than 12% since this time last Friday, followed by SOL’s 6.5% drop and ADA’s near 6% decrease. In contrast, ONDO has jumped by almost 12%, while ZEC is up by 3.7%.
Market Data

Market Cap: $2.254T | 24H Vol: $61B | BTC Dominance: 56.5%
BTC: $63,210 (-2.45%) | ETH: $1,825 (+0.74%) | XRP: $1.08 (-3.2%)
This Week’s Crypto Headlines You Can’t Miss
Trump’s New Iran Strategy Revealed: Will Bitcoin Pay the Price Again? After the ceasefire breakdown, reports emerged during the past week outlining Trump’s new strategy against Iran. The new wave of attacks will reportedly involve strikes with a wider scope than the previous ones, which increases the pressure on risk-on assets like BTC.
CRO Surges as Crypto.com Secures $400M in Citadel Securities-Led Funding. In its first-ever institutional funding round, the popular crypto exchange secured a $400 million investment from Citadel Securities. Its native token jumped immediately by 25%, but it was quickly halted and returned to its starting point.
Ripple (XRP) Peaked at $3.65 Exactly a Year Ago: What Went Wrong? It was a year ago today that the cross-border token flew to $3.65 to set a new all-time high. The following 12 months, though, have been quite painful, with the asset dumping by 70%. Nevertheless, the company behind it continues to make major moves. Here are many of them.
Jesse Pollak Leaves Base Leadership After Failed Social Strategy. Base creator Jesse Pollak admitted to adopting the wrong strategy when developing the network, focusing mainly on the social side of the market. Consequently, he decided to step down from his leadership position.
Peter Schiff: Bitcoin Holders Will Soon Regret Not Selling at Current Levels. The full-time BTC critic did in the past week what he has been doing for many years. He used the opportunity to urge bitcoin investors to offload their positions at current levels, as they might regret not doing so soon.
Saylor’s Strategy Boosts USD Reserves by $450M Without Selling BTC: Here’s How. Mondays have become quite intriguing lately due to Strategy’s pivot. After the previous week’s sale, investors expected new controversial announcements from the largest corporate holder of bitcoin. Instead, the firm simply boosted its USD reserve and refrained from making any BTC-related moves.
The post Bitcoin, Ethereum Reverse CPI-Fueled Gains as Strategy Stays Quiet: Your Weekly Crypto Recap appeared first on CryptoPotato.

Ethereum price has fallen as much as 3.5% to $1,820 on July 17 after its latest rally stalled below $2,000 and weak Democratic support for the CLARITY Act hurt sentiment across the crypto market.
Summary
- Ethereum price fell 3.5% after its latest rally failed to break the $2,000 resistance.
- Weak Democratic support for the CLARITY Act hurt sentiment and triggered leveraged liquidations.
- ETH must reclaim $1,875, while a break below $1,800 risks deeper losses.
According to data from crypto.news, Ethereum (ETH) later recovered to around $1,835, but sellers erased most of the gains recorded during its push to $1,940 earlier this week. A Politico report that Senate Democrats do not currently support the market structure bill reduced its chances of securing the 60 votes needed for passage.
Democratic lawmakers have demanded conflict-of-interest restrictions tied to President Donald Trump’s crypto holdings before supporting the legislation. Analysts now assign the bill less than a 30% chance of passing this year, according to Barron’s, while Congress faces a narrowing window before its August recess.
At the same time, more than $400 million in leveraged crypto positions were liquidated over the past 24 hours, according to CoinGlass data.
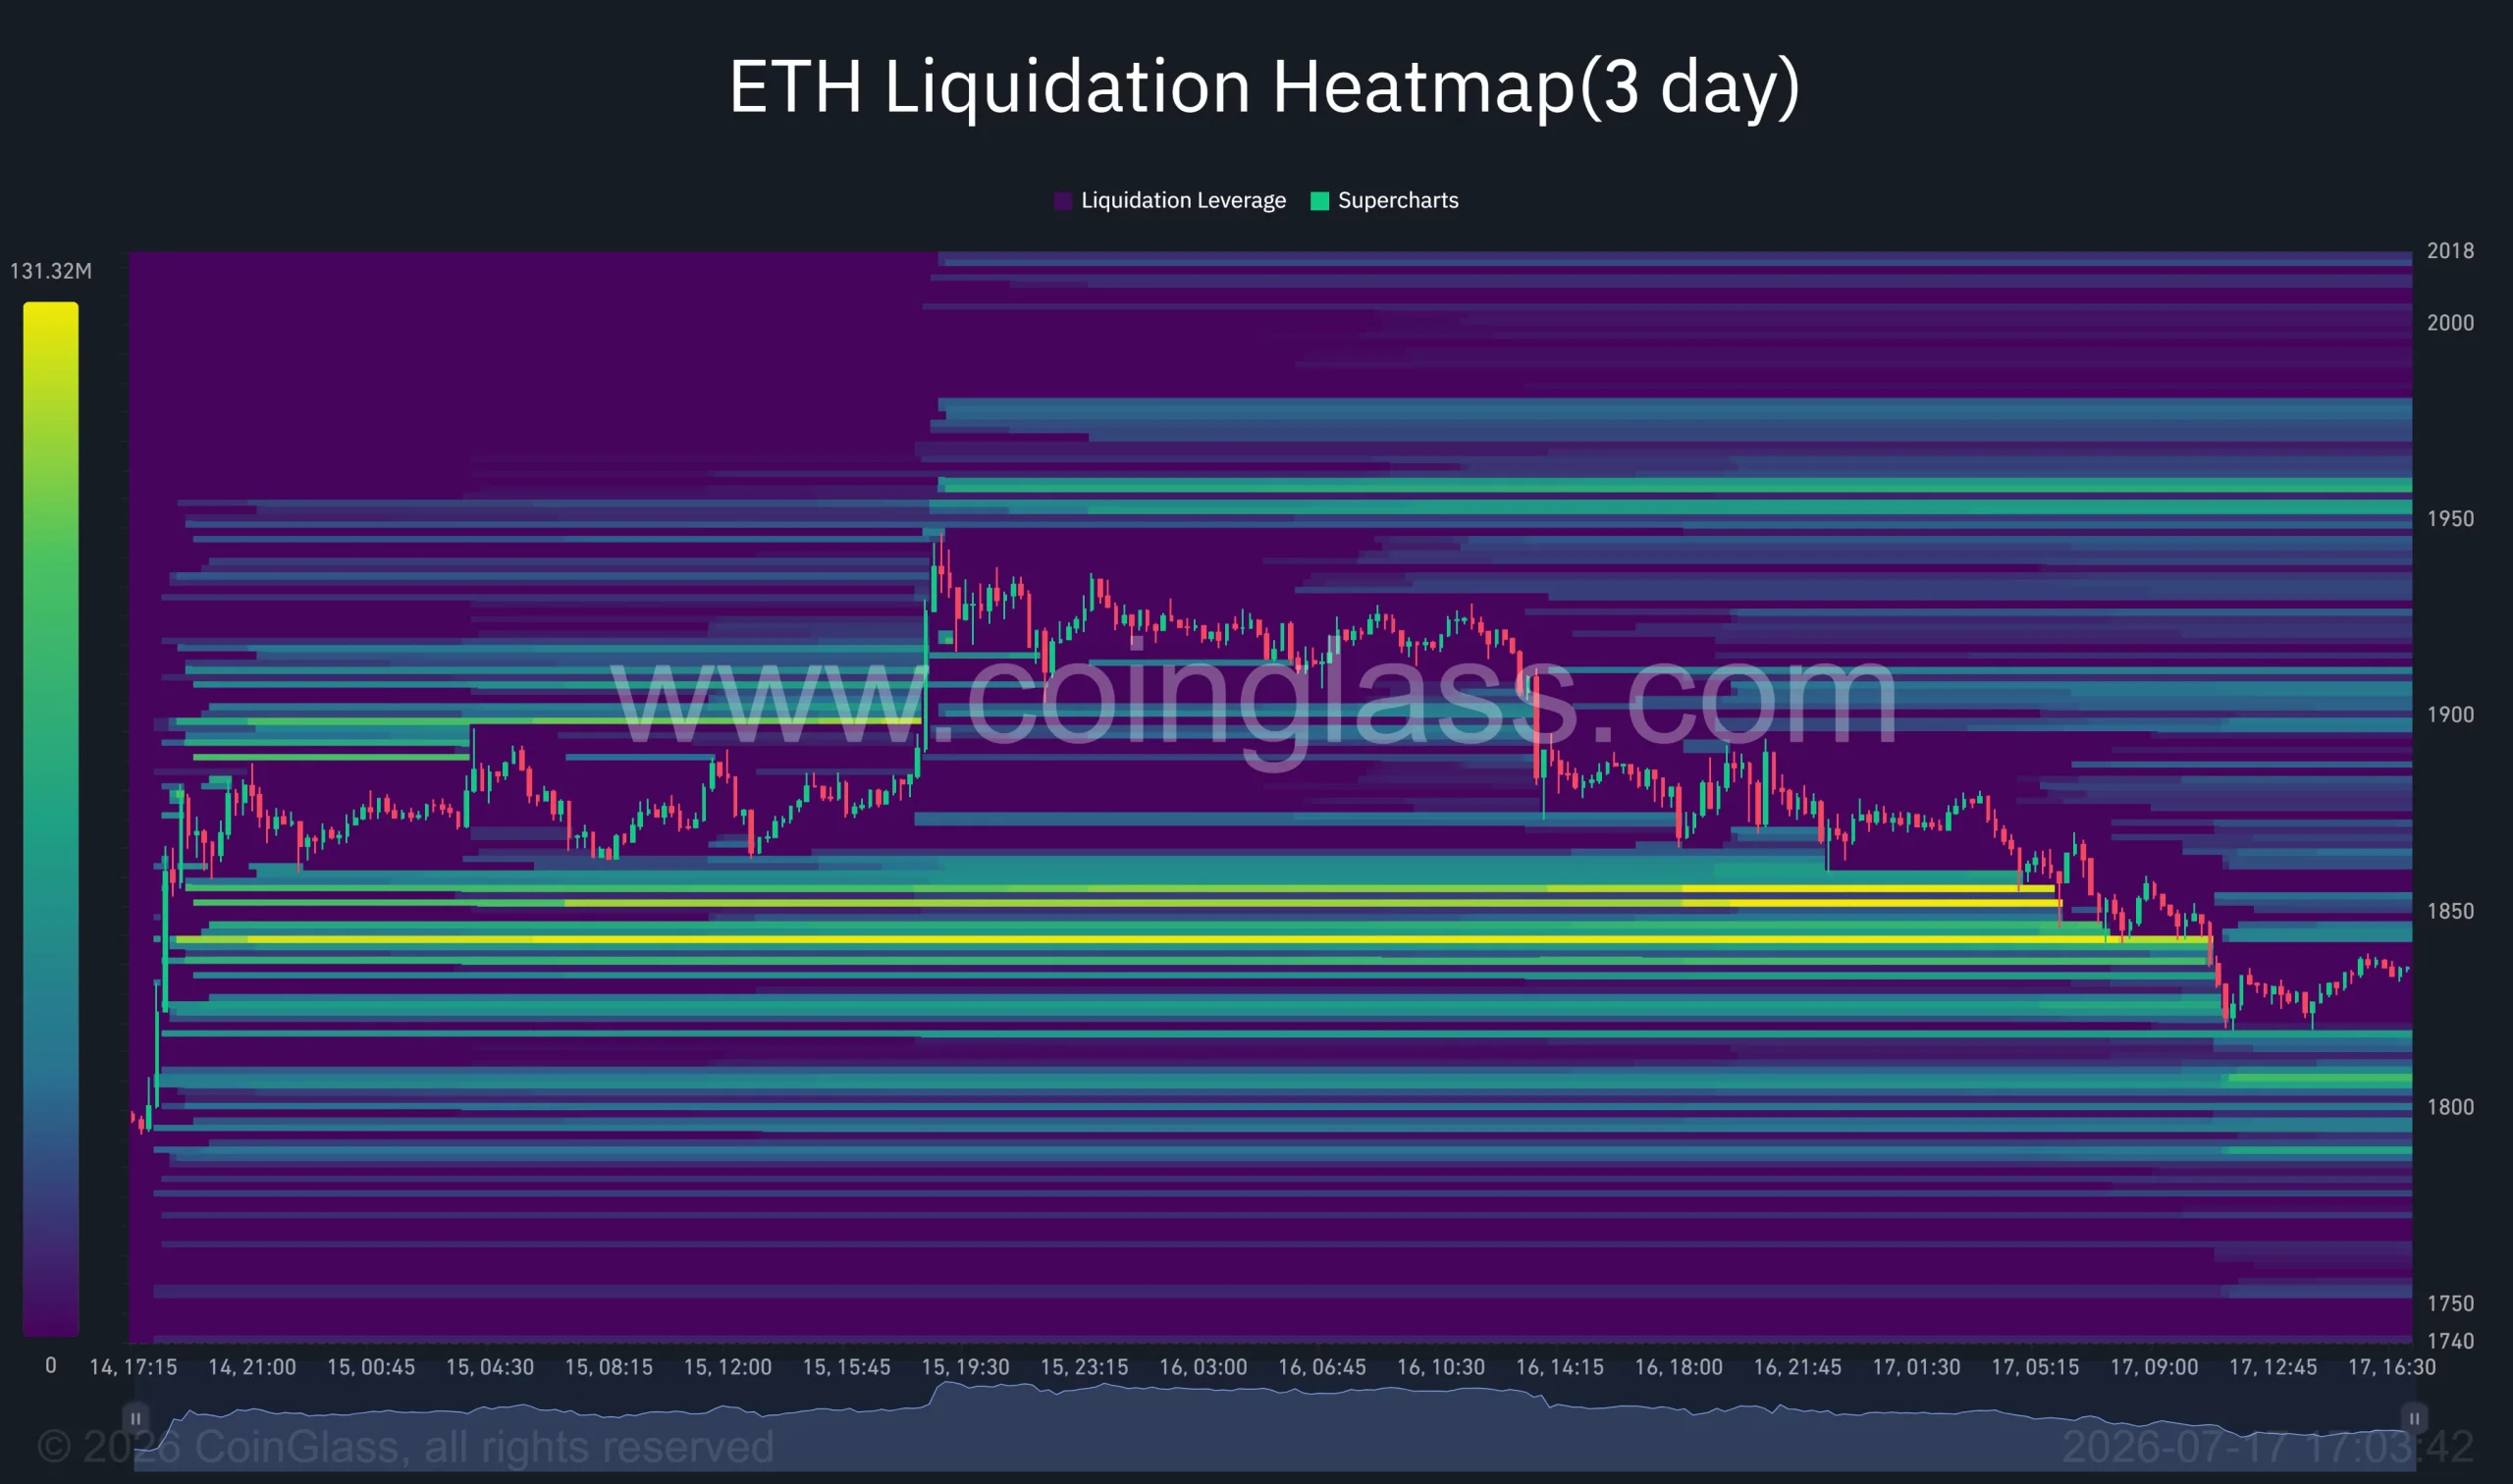
CoinGlass’ three-day ETH liquidation heatmap shows dense leverage around $1,800–$1,810, placing the zone just below Ethereum’s current price. On the upside, liquidation clusters sit near $1,845–$1,860, while the largest overhead concentration appears around $1,950–$1,960.
A move through $1,860 could therefore accelerate toward $1,950, but a break below $1,800 may trigger another wave of long liquidations.
U.S. spot Ethereum ETFs have offered only limited support. The funds attracted $84.42 million during the week ended July 11, breaking eight consecutive weeks of net outflows, but Fidelity’s FETH recorded a $15.4 million withdrawal on July 13. ETF demand has therefore remained uneven despite ETH’s recovery from its late-June low near $1,500.
Economic data added pressure as initial jobless claims fell to a two-month low of 208,000. June retail sales rose 0.2%, while core sales advanced 0.5%, prompting some economists to lift second-quarter growth estimates to as high as 2.4%.
Those figures reduced expectations for aggressive Federal Reserve rate cuts. The 10-year Treasury yield climbed to 4.596%, while the two-year yield reached 4.179%, raising the opportunity cost of holding risk assets such as Ethereum.
Ethereum must reclaim $1,875 before another $2,000 test
Ethereum’s daily chart shows that the rebound lost strength after reaching approximately $1,940. ETH has since returned to the $1,832 breakout level, which previously capped several recovery attempts during June and early July.
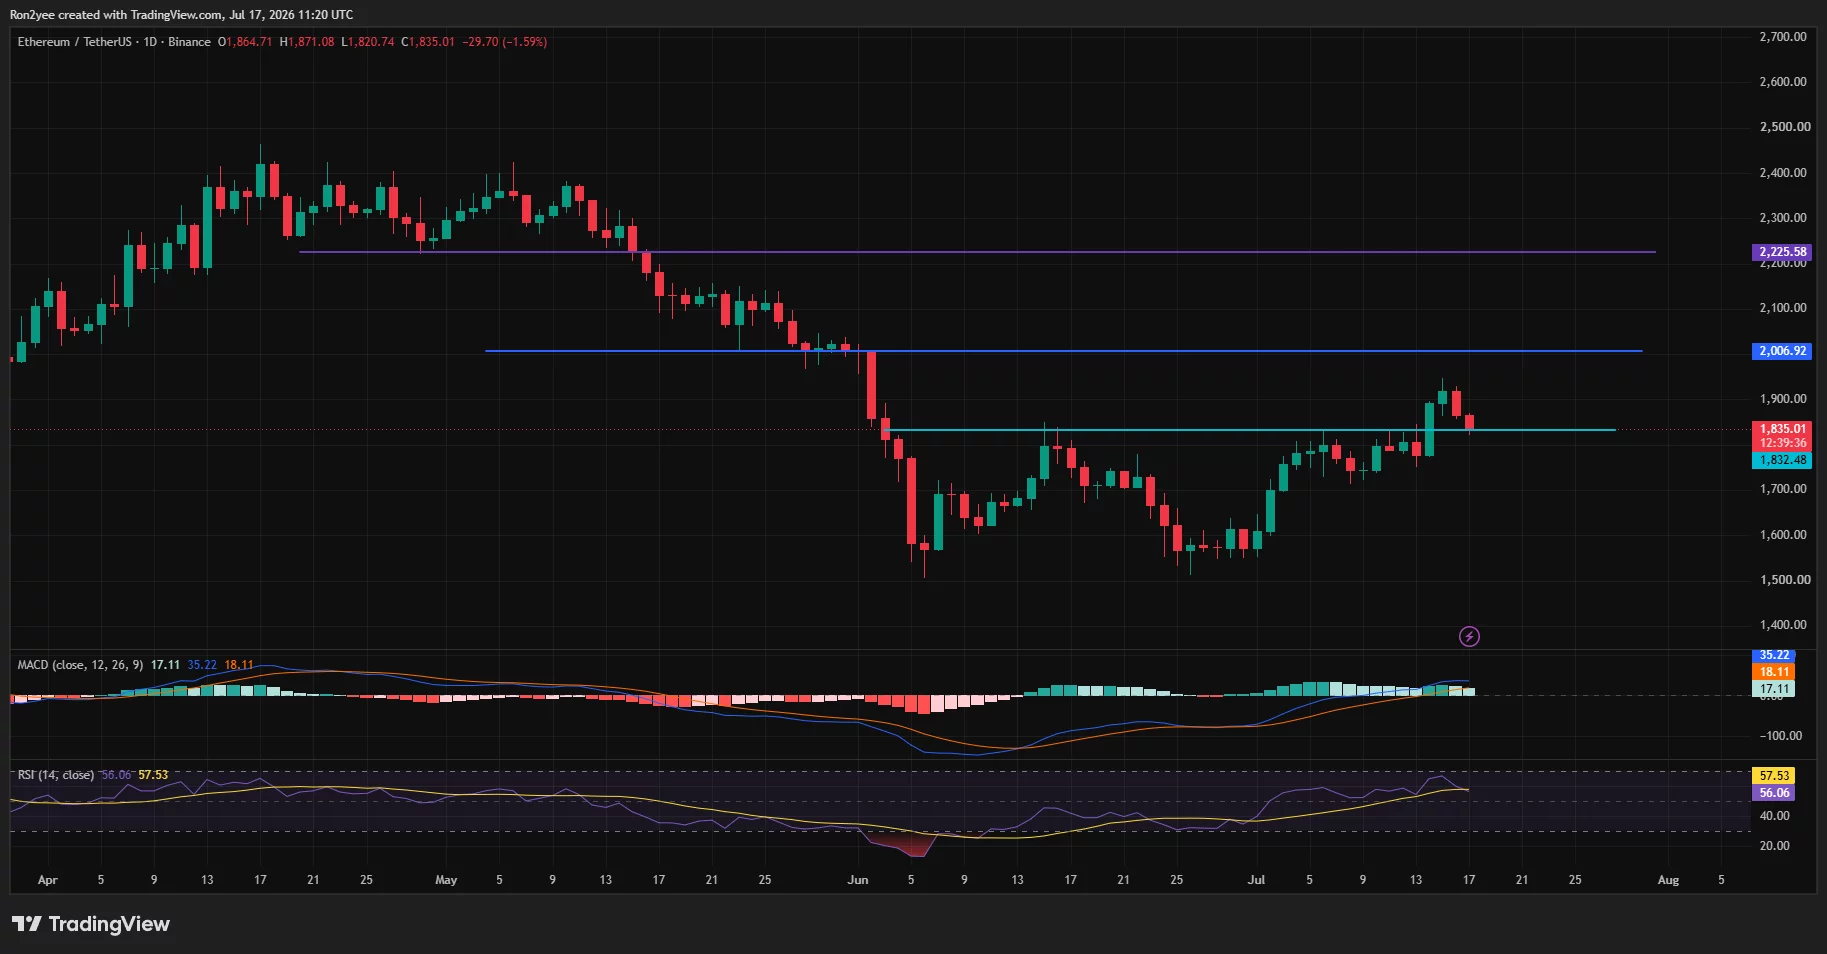
Daily momentum remains positive but has started to weaken. The MACD line stands at 35.22 against a signal line of 18.11, with the histogram still above zero at 17.11. The relative strength index has slipped to 56.06 and now sits below its moving average at 57.53, showing that buyers have lost some control without pushing ETH into bearish momentum.
On the four-hour chart, ETH has dropped below the Bollinger Band midpoint at $1,874. The lower band near $1,796 now forms the next volatility-based support, while the upper band at $1,952 sits just below the psychological $2,000 barrier.
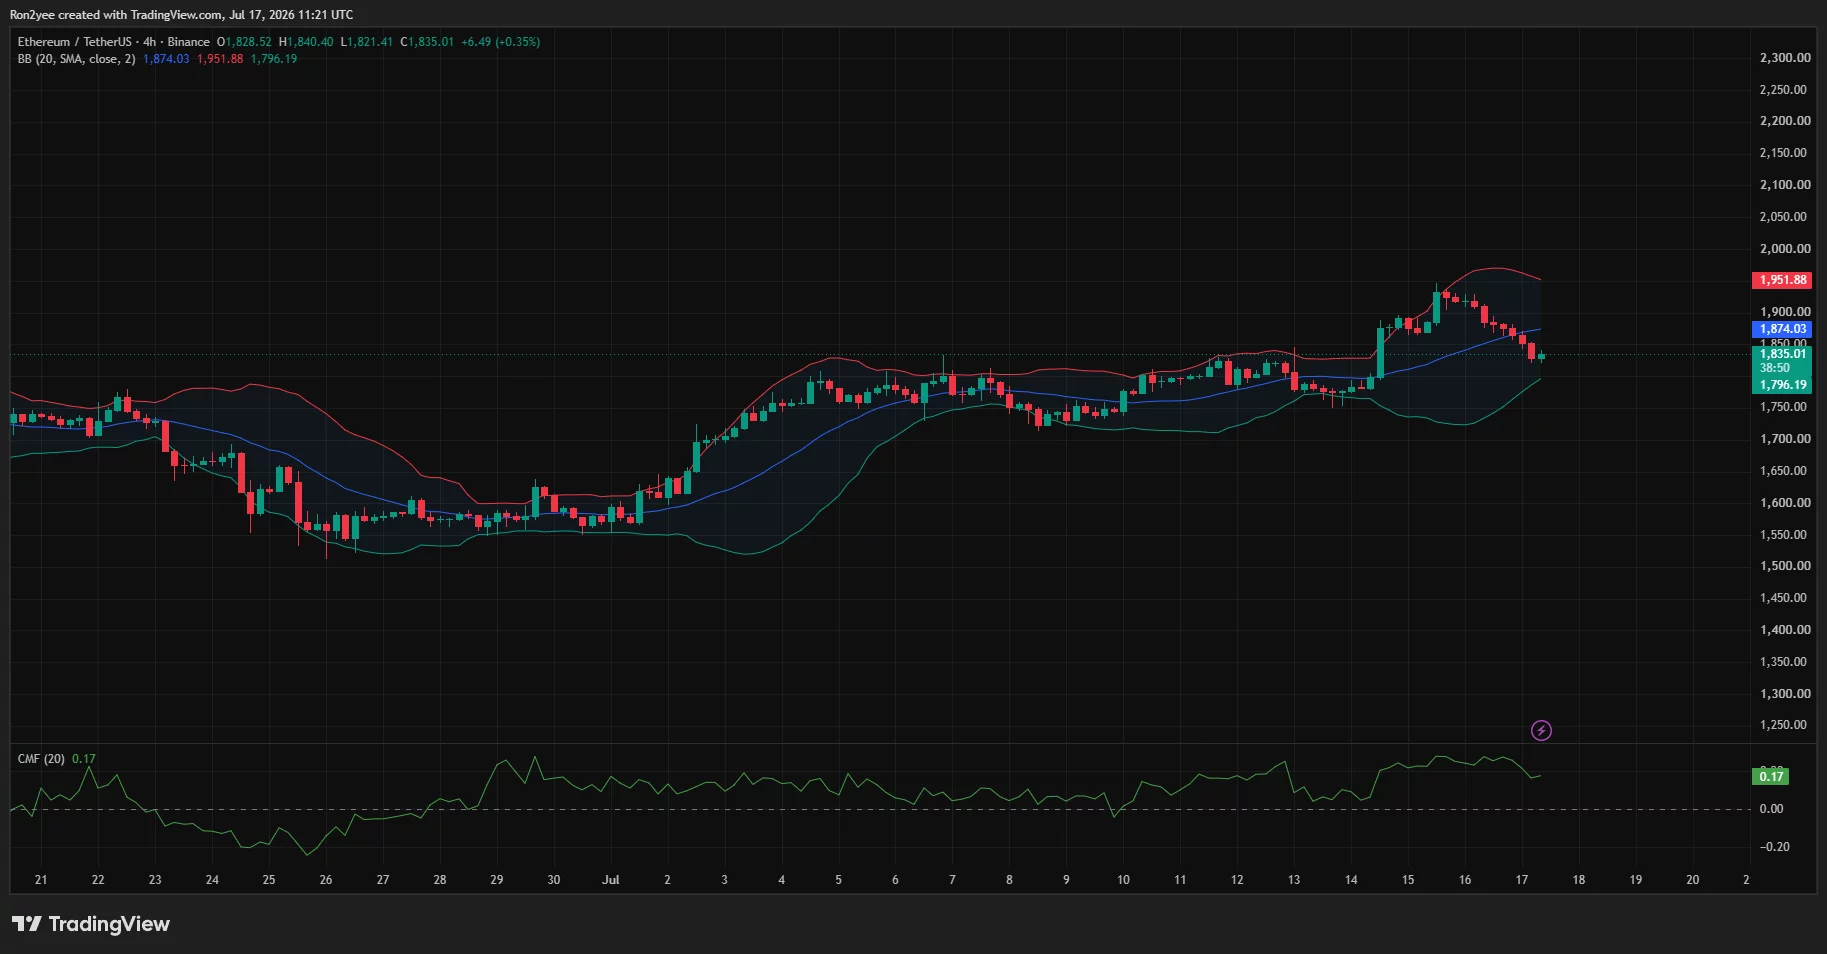
Chaikin Money Flow remains positive at 0.17, showing that capital has not fully left the market. Buyers must recover $1,875 and then clear the $1,940–$1,952 area before ETH can challenge the daily resistance at $2,006. A successful daily close above that level would expose the next major chart barrier near $2,225.
A close below $1,800 would put the recovery at risk
According to analyst Ted Pillows, Ethereum has entered an important support zone after surrendering its recent gains.
“A daily close above $1,850 should happen; otherwise, Ethereum will end up giving all its short-term gains.”
Failure to hold the $1,800–$1,832 area would strengthen the bearish case and expose the four-hour lower Bollinger Band near $1,796. Below it, the daily structure leaves room for a decline toward $1,715, followed by the June support region between $1,550 and $1,600.
The bullish case therefore requires a close above $1,850, followed by a recovery to $1,875. Continued ETF withdrawals, higher Treasury yields, fresh technology-stock losses, or further delays to the CLARITY Act would invalidate that path and keep $2,000 out of reach.
Disclosure: This article does not represent investment advice. The content and materials featured on this page are for educational purposes only.
Dogecoin price has fallen 3.17% to $0.071 on July 17 as its exchange-traded funds completed one month without recording fresh inflows.
Summary
- Dogecoin price fell 3.17% to $0.071 as its ETFs completed one month without fresh inflows.
- T. Rowe Price allocated 1.28% of its new active crypto ETF to DOGE.
- A break below $0.0711 could expose Dogecoin to declines toward $0.070 and $0.068.
SoSoValue data shows that U.S. Dogecoin ETFs attracted no new capital between June 17 and July 17, despite the meme coin gaining additional exposure through T. Rowe Price’s newly launched active crypto fund. The products also posted $871,000 in net outflows during July.
The weak ETF figures have accompanied a steep decline in DOGE, which has lost about 54% since reaching $0.156 in January. Dogecoin’s latest drop has brought the token back to a support area that buyers have repeatedly defended since late June.
During the same period, the meme coin sector has suffered a $1.2 billion sell-off, according to the original market report. The decline indicates that T. Rowe Price’s entry has yet to revive demand for DOGE among retail or institutional investors.
T. Rowe Price exposure has failed to revive DOGE demand
T. Rowe Price launched its first actively managed cryptocurrency ETF on July 16, adding Dogecoin alongside Bitcoin, Ethereum and several other digital assets. The asset manager oversees about $1.8 trillion and supplied $15 million in seed capital to the fund.
According to the fund allocation, Dogecoin received a 1.28% weighting. The position consists of roughly 2.6 million DOGE worth about $192,000, making it a limited part of the ETF’s portfolio.
Bloomberg ETF analyst Eric Balchunas described T. Rowe Price as a legacy stock picker. In his assessment, the firm’s decision to hold Dogecoin alongside larger cryptocurrencies gives the meme coin a degree of Wall Street recognition.
Even with the new allocation, SoSoValue data indicates that existing Dogecoin ETFs have failed to attract fresh money for a full month. The T. Rowe Price product is set to become the fourth ETF offering exposure to the largest meme coin by market capitalization, according to the original report.
Dogecoin price remains exposed below $0.0755
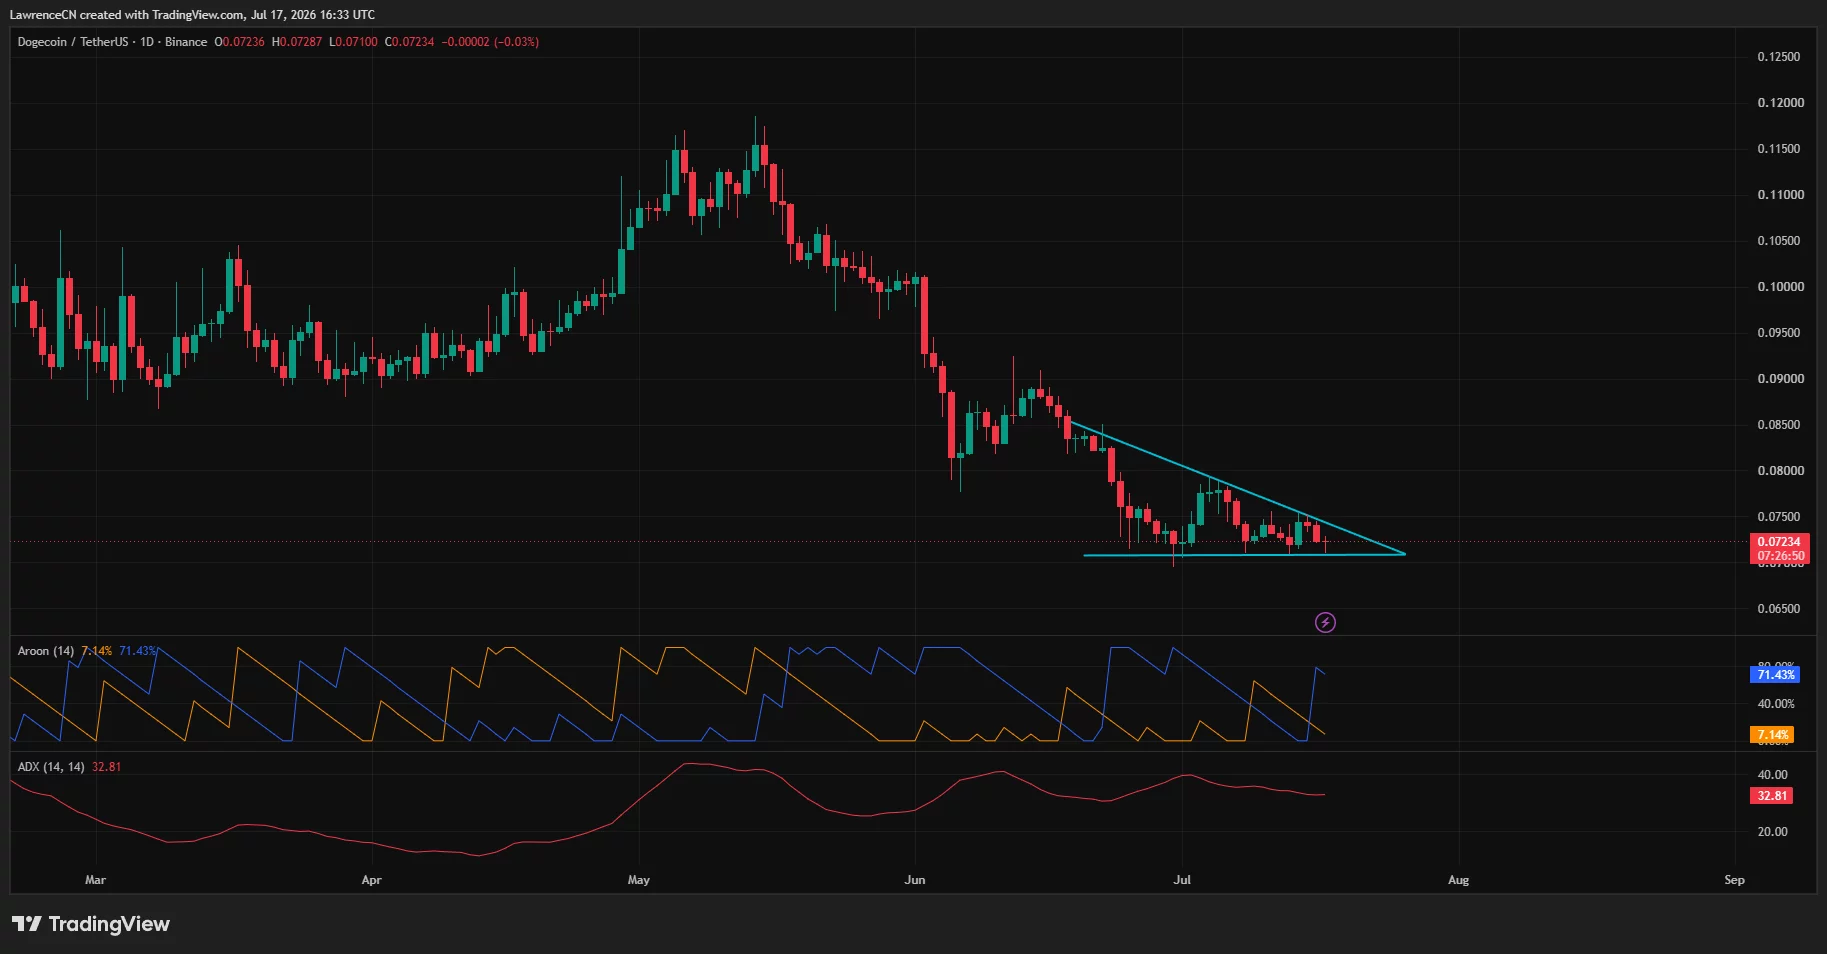
The daily DOGE chart shows a descending triangle, with a series of lower highs pressing the price toward horizontal support near $0.071. The structure would remain bearish unless DOGE breaks above the falling trendline and the nearby $0.0755 resistance level.
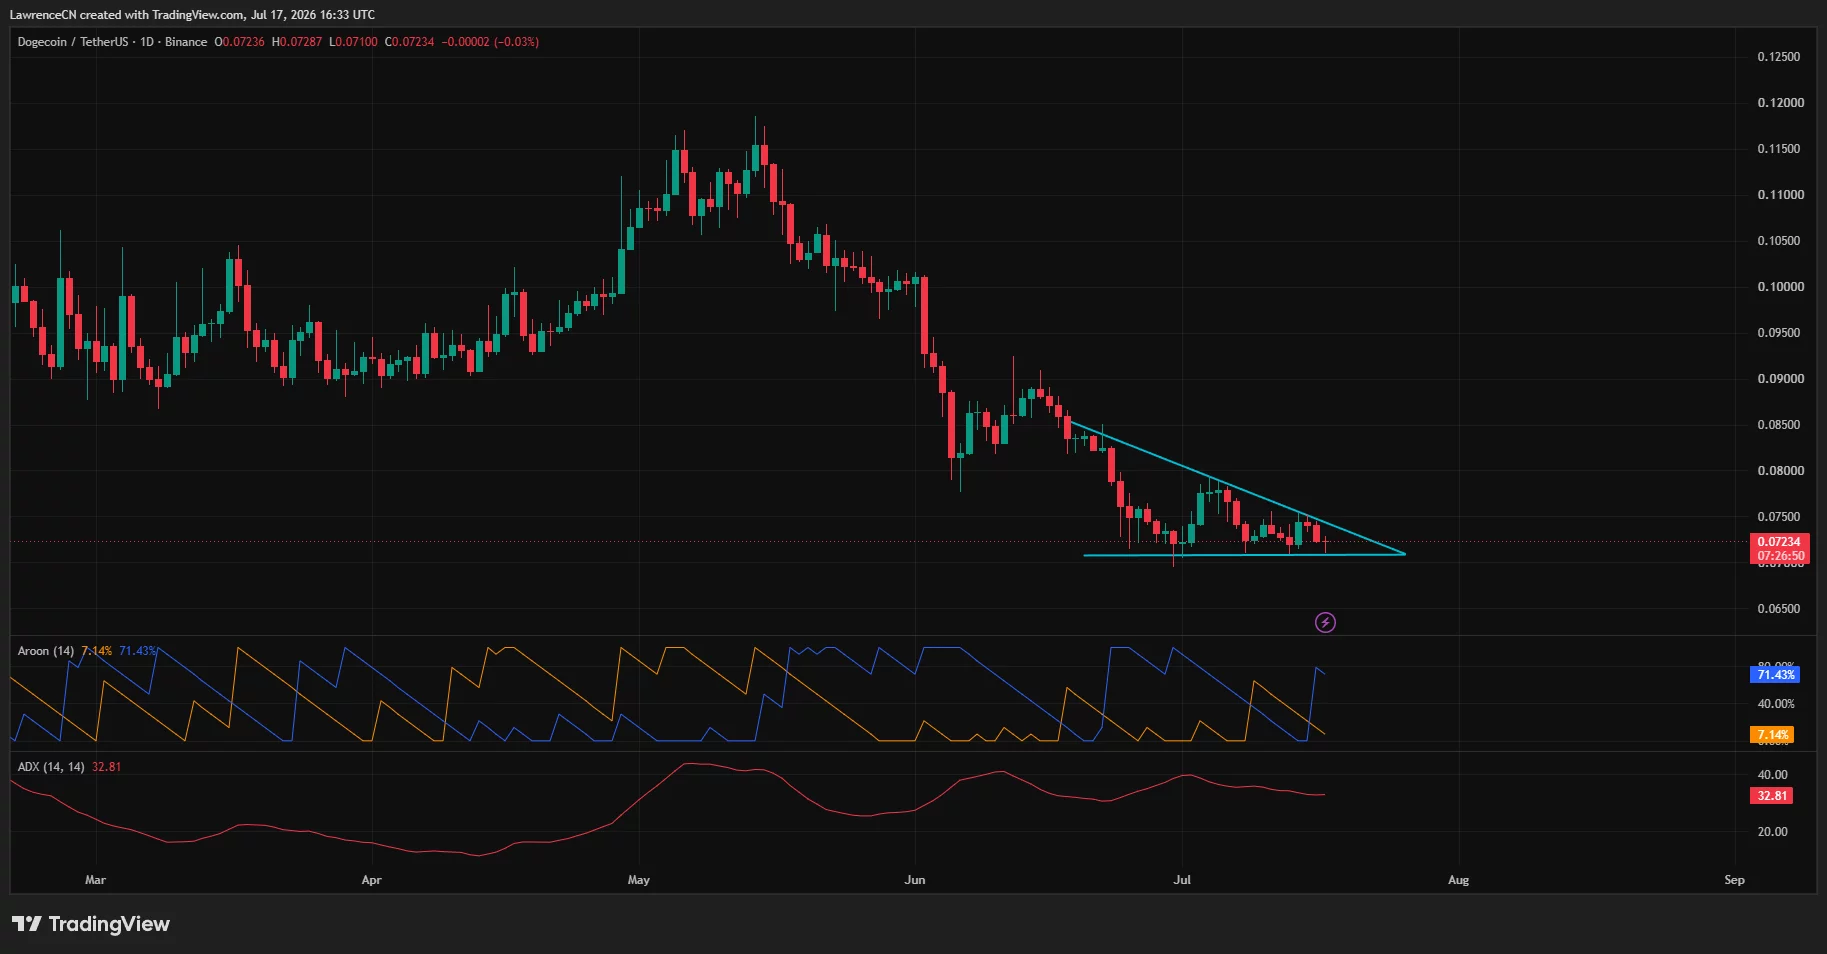
Momentum readings on the same chart favor sellers. TradingView places Aroon Down at 71.43% and Aroon Up at 7.14%, while the Average Directional Index stands at 32.81. An ADX reading above 25 indicates that the current trend retains strength.
On the 4-hour chart, the MACD line is below its signal line and shows a negative histogram, both pointing to continued selling pressure. The Relative Strength Index is also at 42.89, below its moving average of 46.75, suggesting that buyers have not regained short-term momentum.
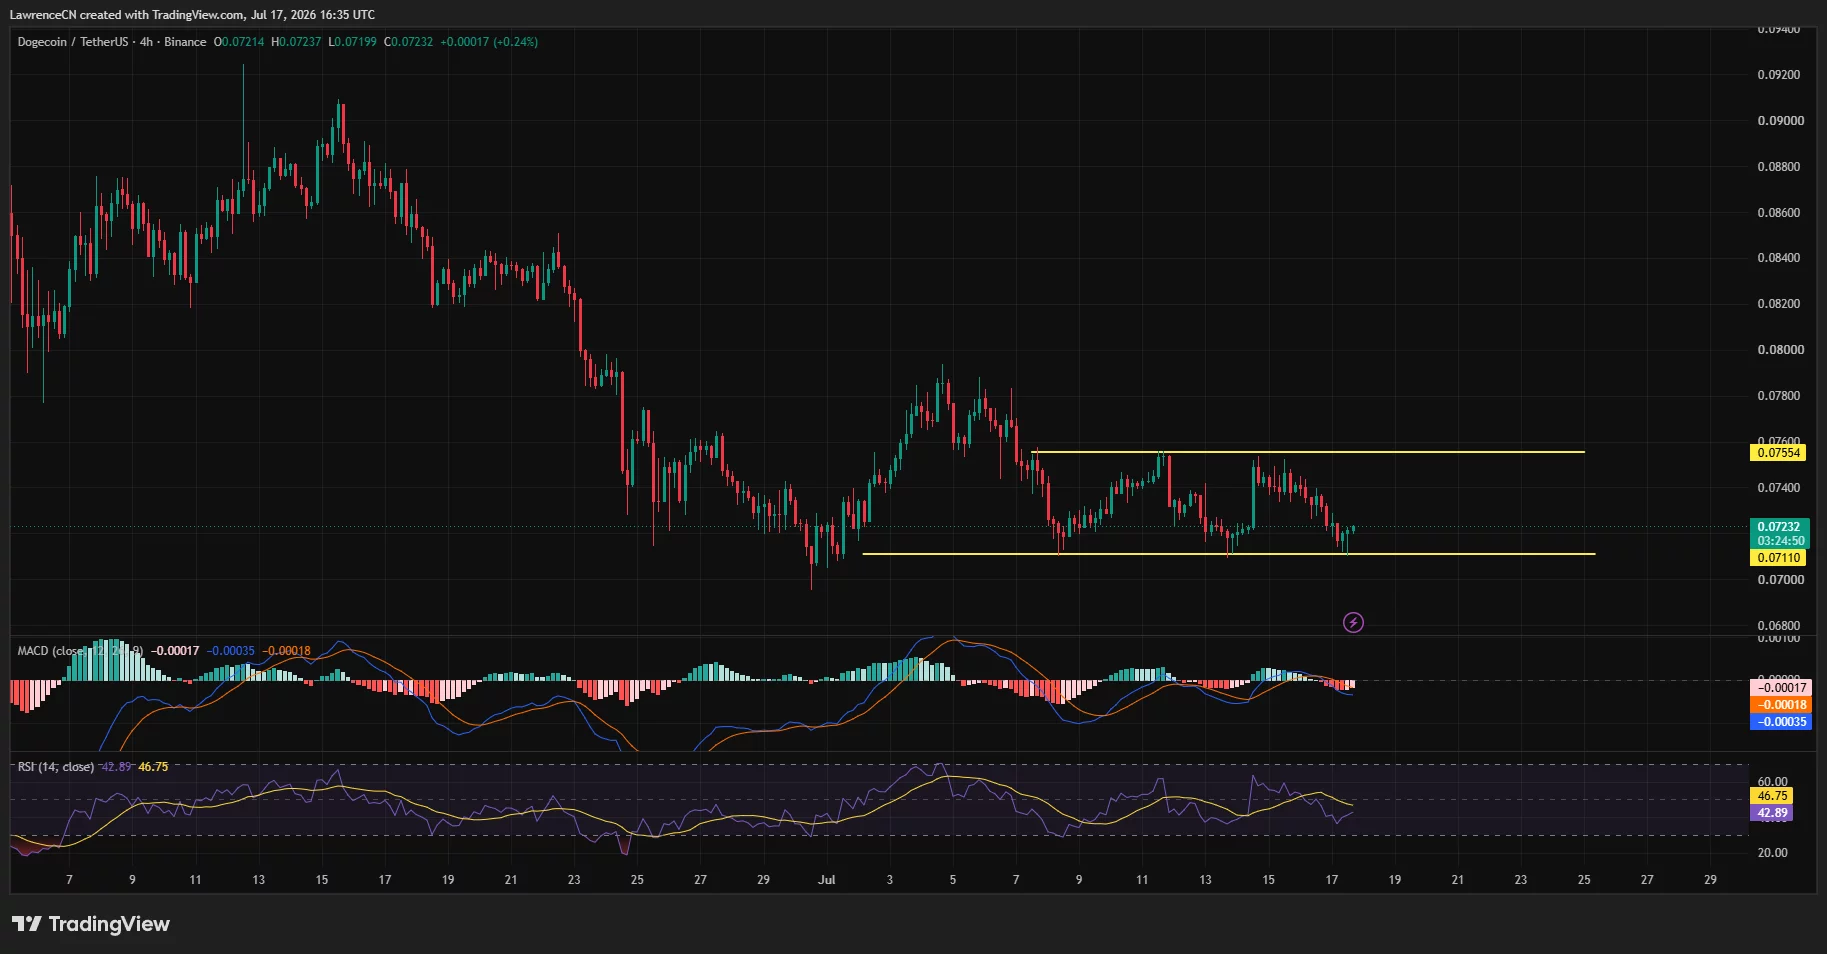
A confirmed 4-hour close below the $0.0711 range floor could expose $0.070, followed by $0.068 and $0.065, based on the support levels visible on TradingView. Conversely, a rebound above $0.0755 would break the current range and place the July high near $0.079 back in view.
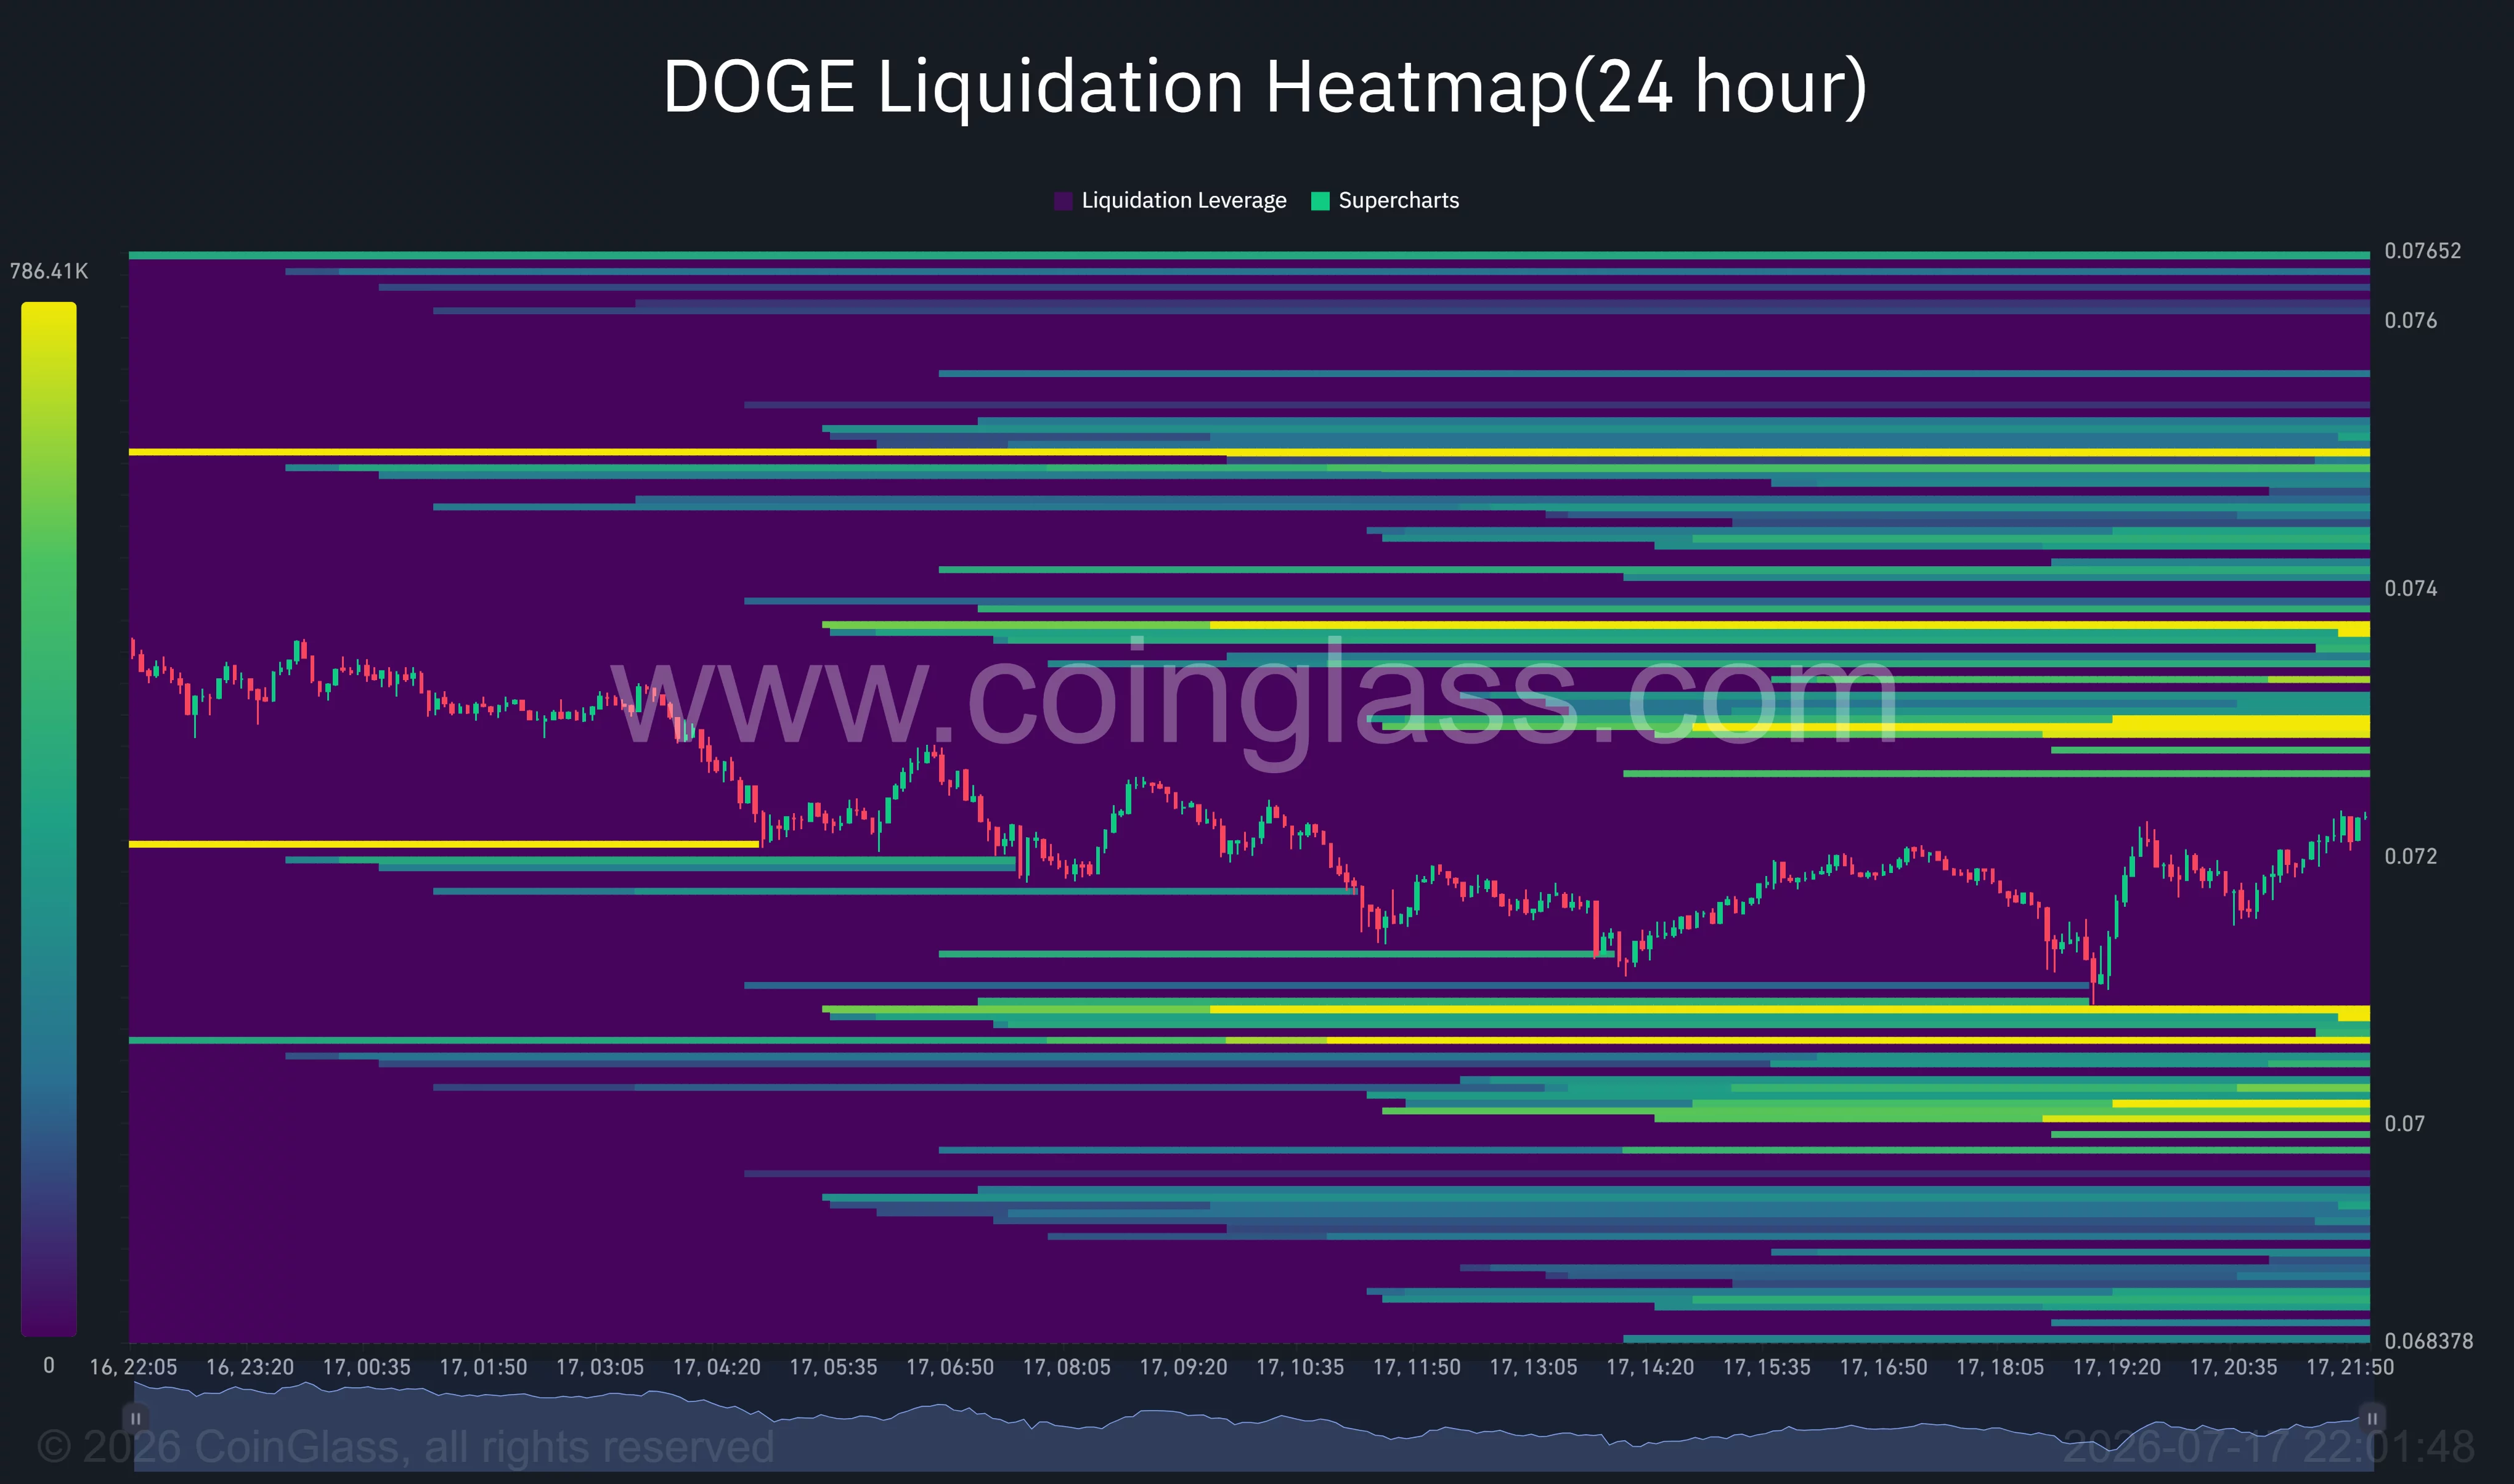
CoinGlass’ 24-hour liquidation heatmap places notable leveraged positions around $0.073 and $0.075 above the market. Below the current price, concentrated liquidity near $0.0705 and $0.070 could attract DOGE if the $0.0711 support fails.
Disclosure: This article does not represent investment advice. The content and materials featured on this page are for educational purposes only.
OKX Europe has launched a one-way conversion feature allowing customers to deposit USDT and convert it into USDC, offering a regulated migration path as the European Union’s Markets in Crypto-Assets (MiCA) rules limit support for the world’s largest stablecoin.
According to a company announcement shared with Cointelegraph, the feature lets customers deposit Tether’s USDt (USDT) into their OKX Europe account and convert the tokens into USDC (USDC), one of the largest stablecoins available under the European Union’s MiCA framework.
Tether has not obtained authorization to issue USDT under MiCA, prompting many European platforms to restrict deposits, delist trading pairs or convert customer balances into compliant alternatives as the European Union completed the framework’s rollout on July 1.
OKX Europe said the feature is designed for customers whose existing platforms no longer accept USDT or plan to migrate their balances automatically. The exchange said conversions can be completed at the customer’s discretion rather than through a platform-imposed deadline.
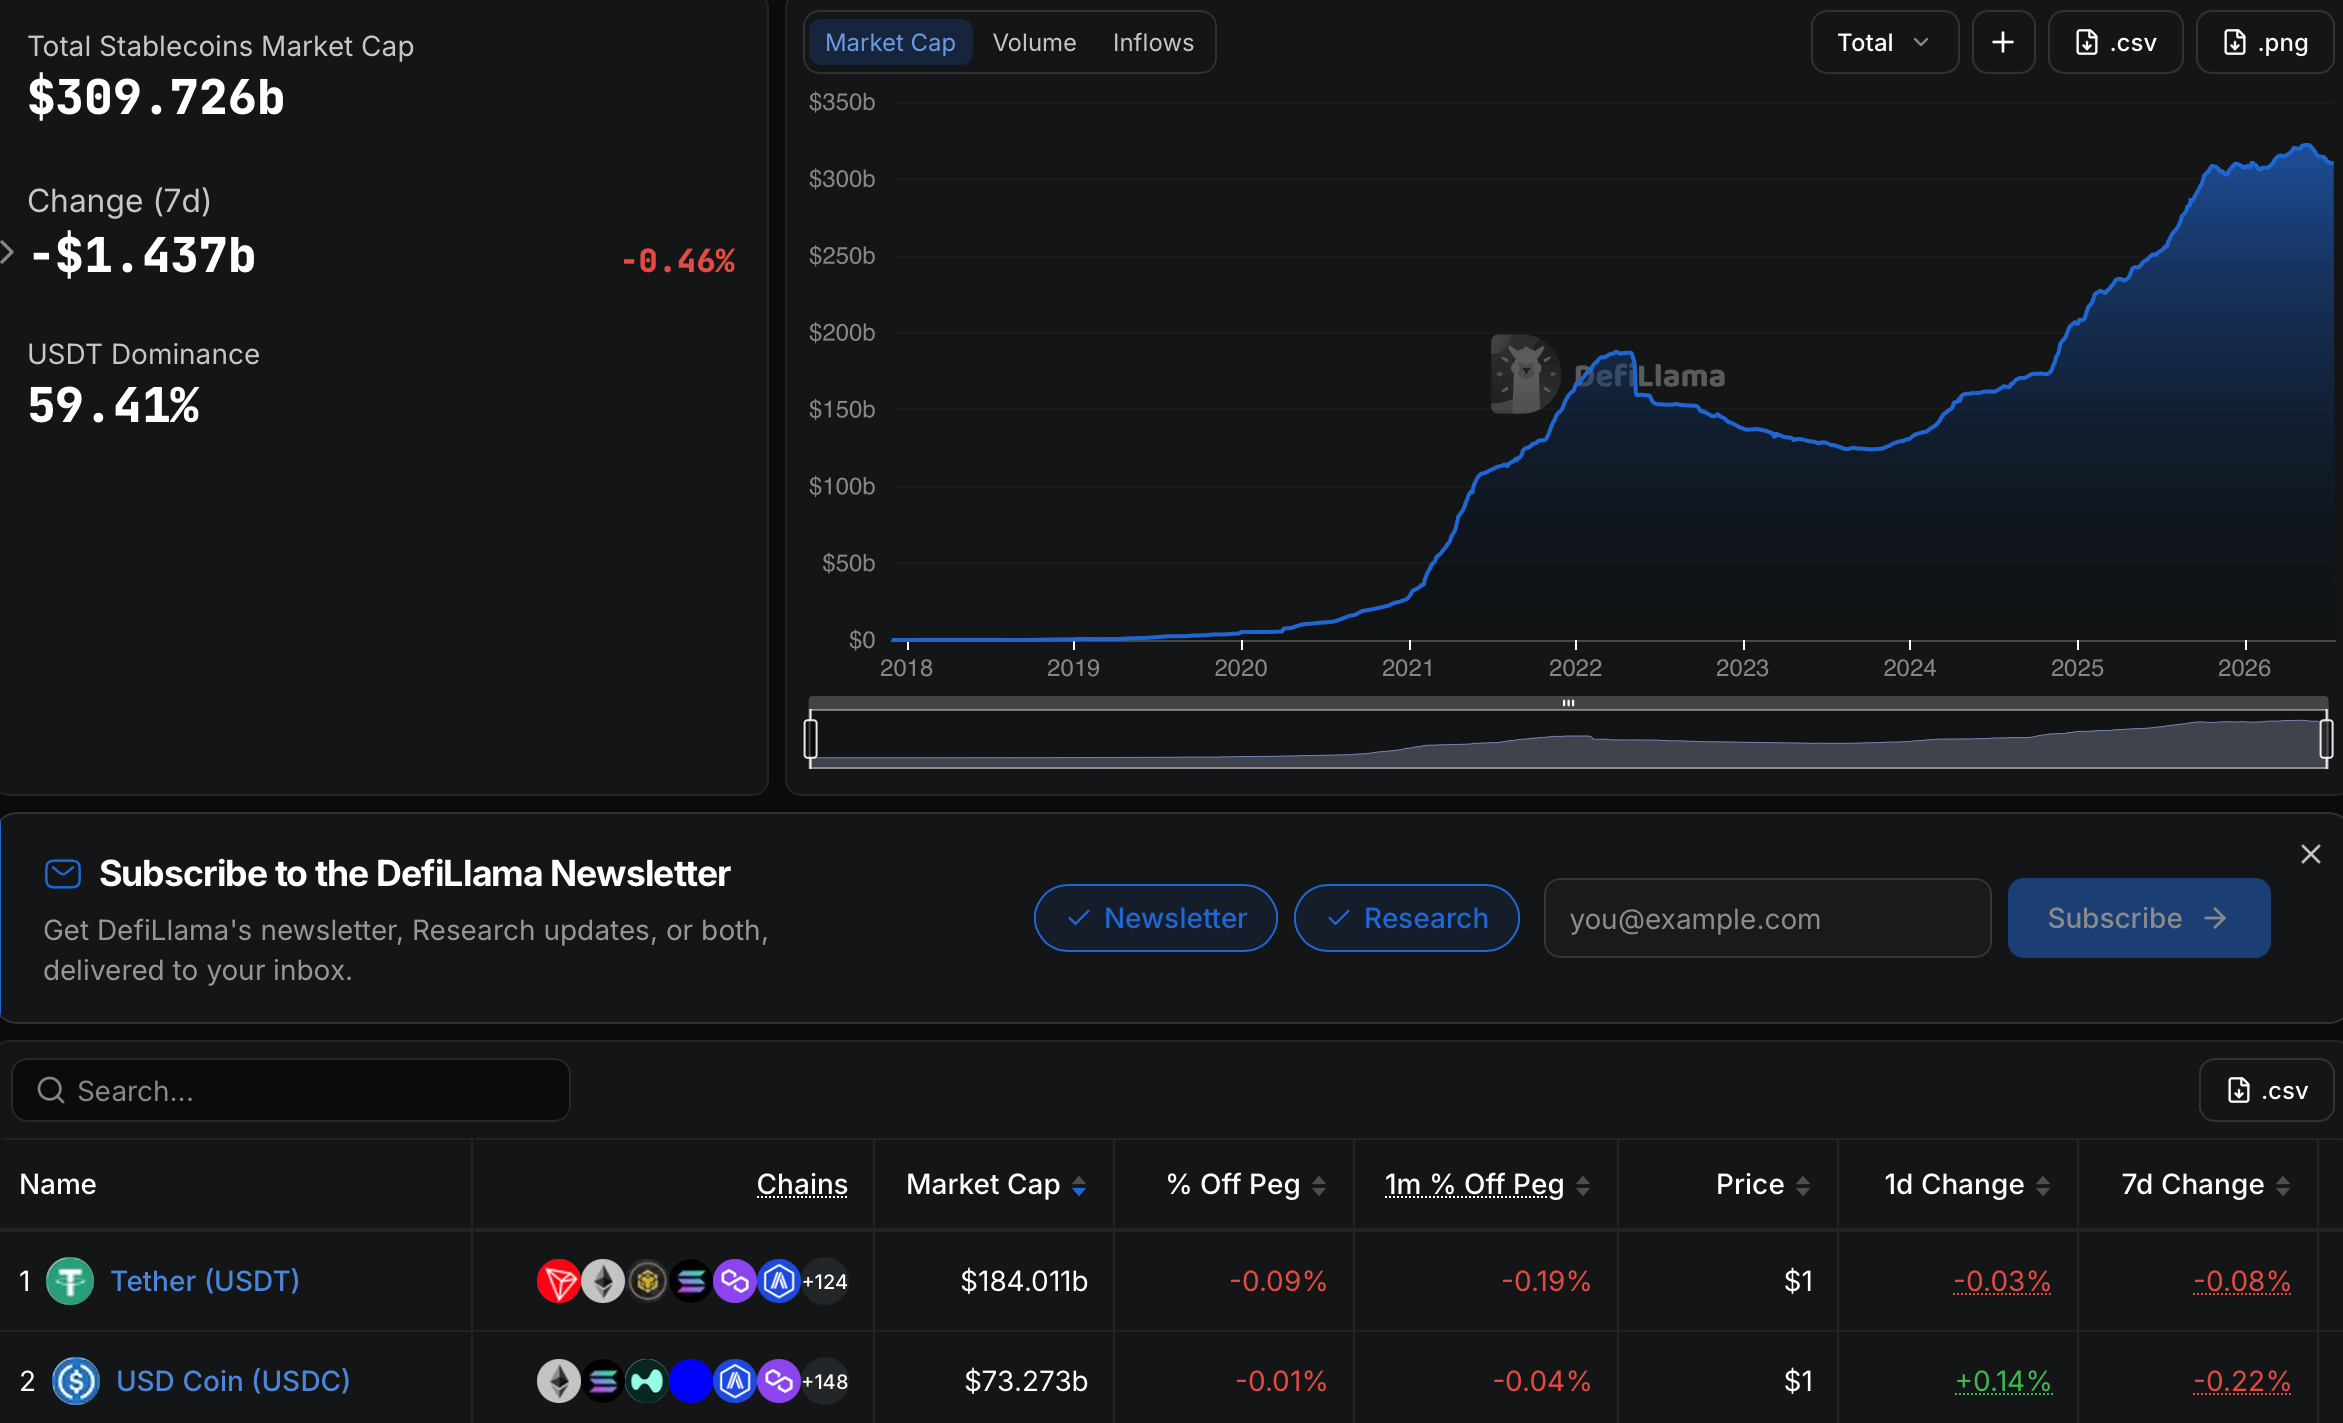
The move comes even as USDT remains the dominant stablecoin globally. According to DefiLlama, Tether accounts for about 59% of the nearly $310 billion stablecoin market, with a market capitalization of roughly $184 billion, compared with about $73 billion for Circle’s USDC.
OKX Europe serves customers across 30 EU and European Economic Area countries under its MiCA license.
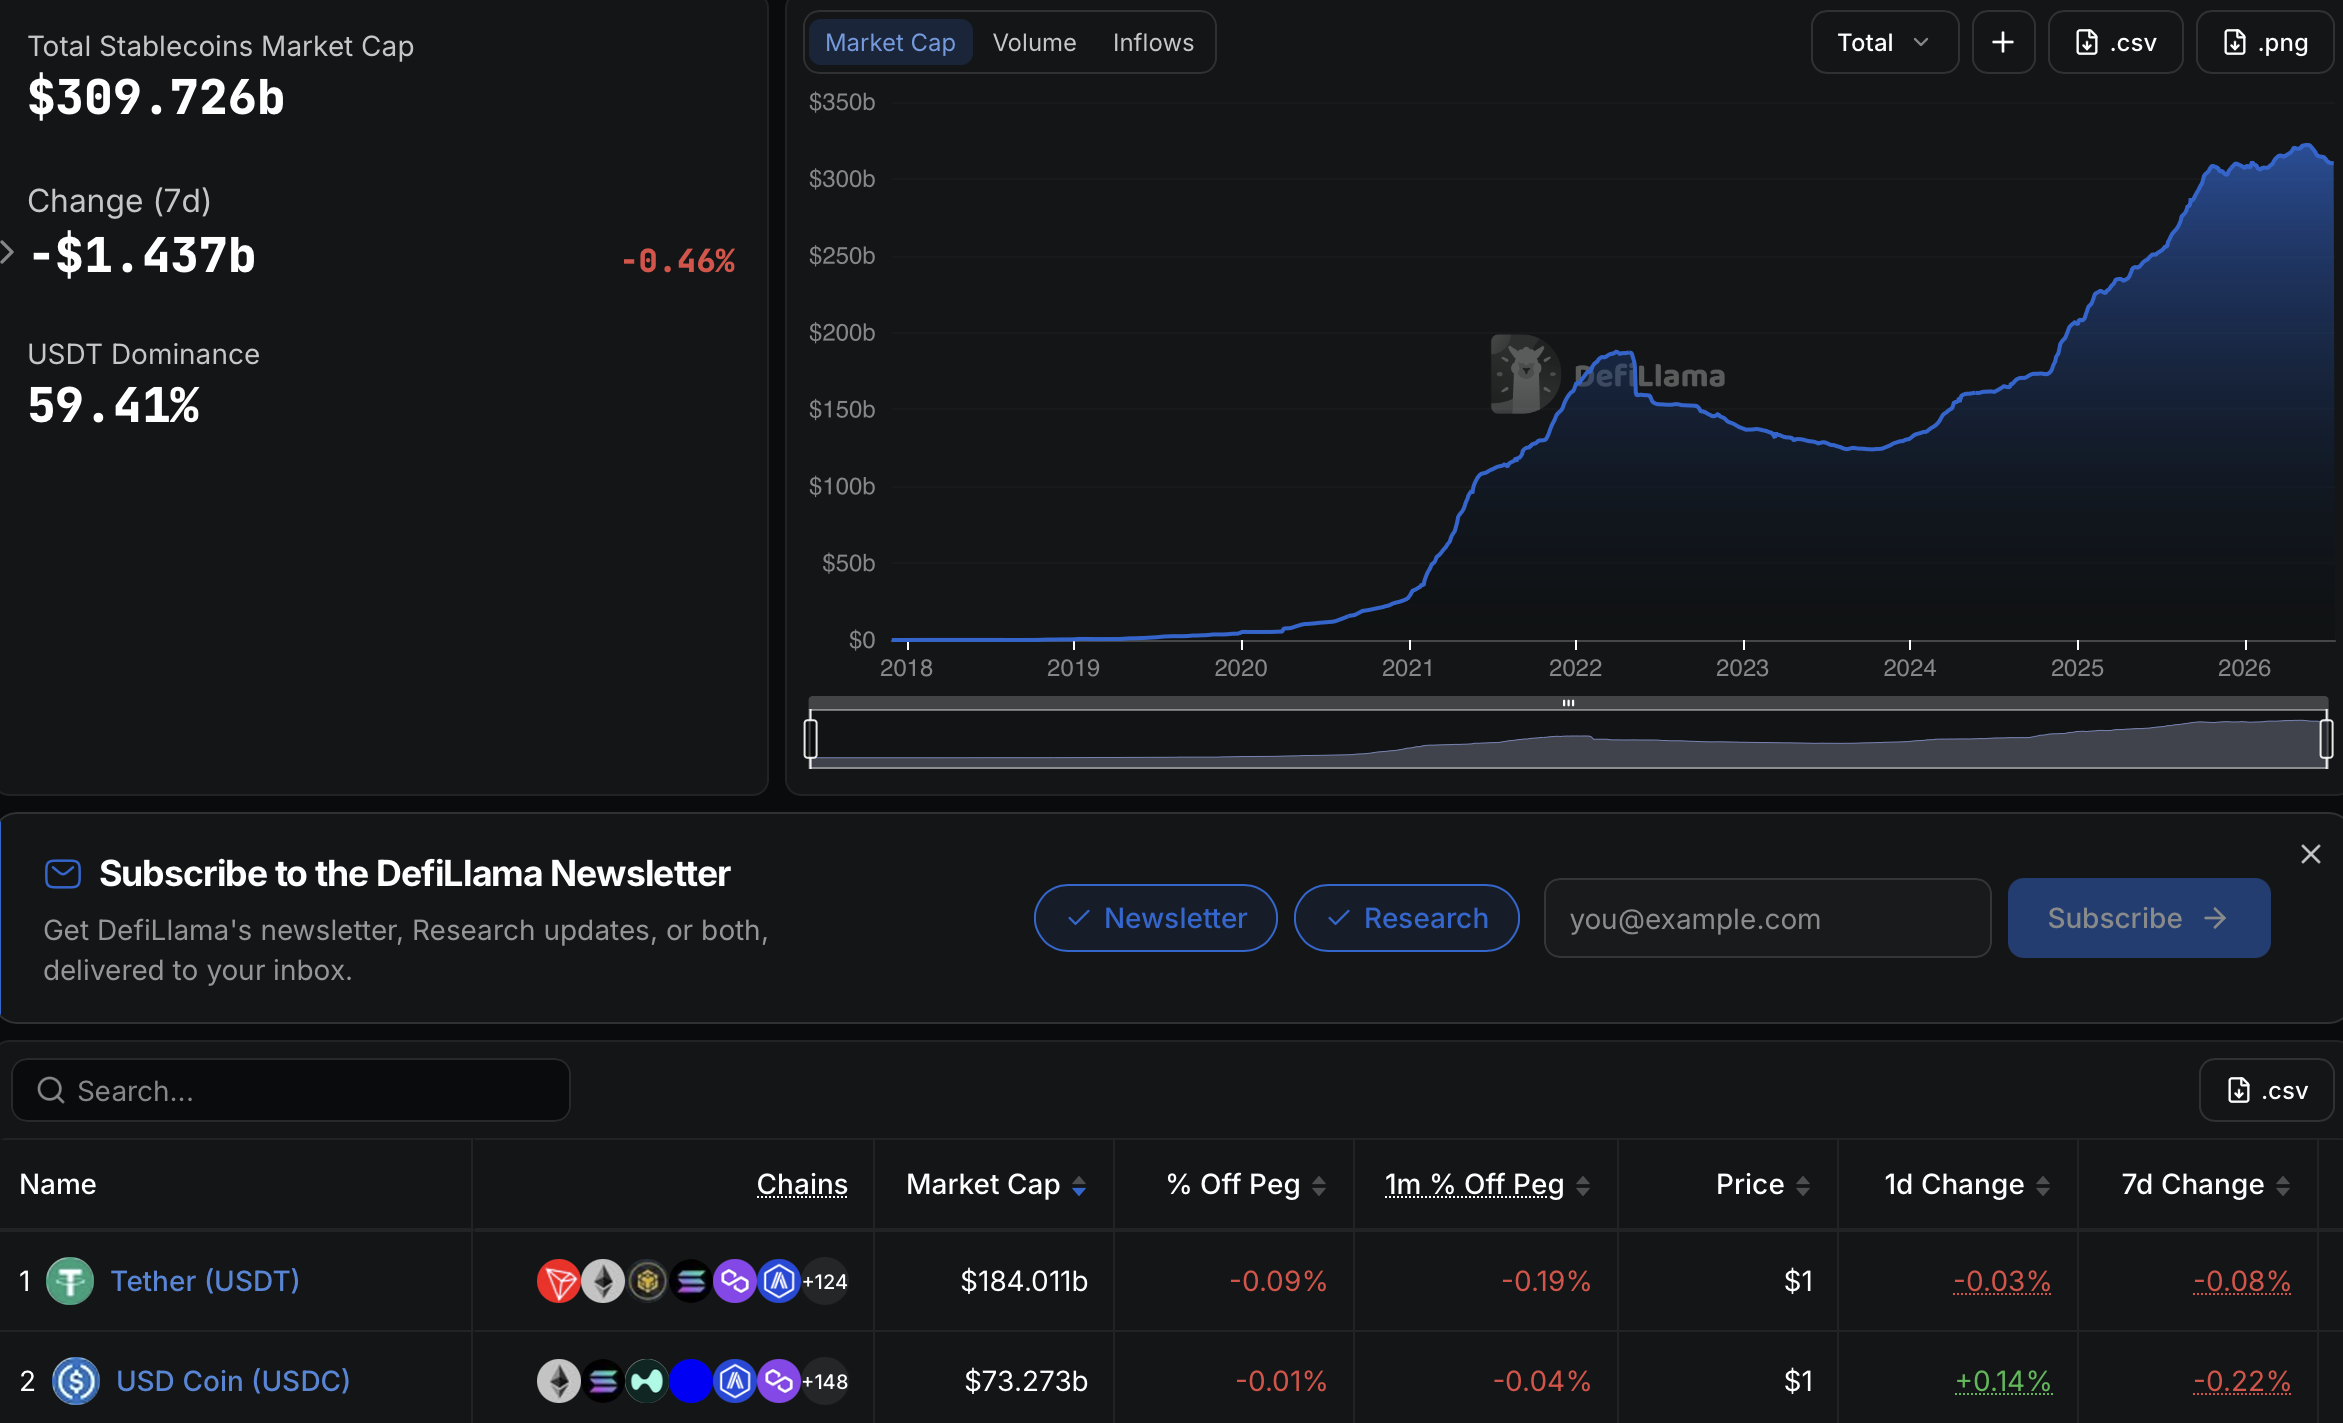
Source: DefiLlama
Related: ESMA adds 14 new CASPs to MiCA register as licensing slows
Why did Tether reject MiCA?
Tether has defended its decision not to seek MiCA authorization for USDT, even as the move prompted many European crypto platforms to delist or restrict the stablecoin. Since the EU’s regulatory framework began taking effect in late 2024, exchanges across the region have been shifting users toward MiCA-compliant alternatives.
Tether CEO Paolo Ardoino has repeatedly criticized MiCA, arguing its reserve requirements create unnecessary risks for stablecoin issuers by requiring a portion of reserves to be held with European credit institutions.
In a May 2025 interview with Cointelegraph, Ardoino described the framework as “very dangerous when it comes to stablecoins,” saying Tether chose not to pursue authorization despite the likelihood that USDT would lose support on European exchanges.
The company has shown little sign of changing course. In a July 2025 post on X, Ardoino said Tether would reconsider seeking MiCA authorization only “when MiCA becomes safer for consumers and stablecoin issuers.”
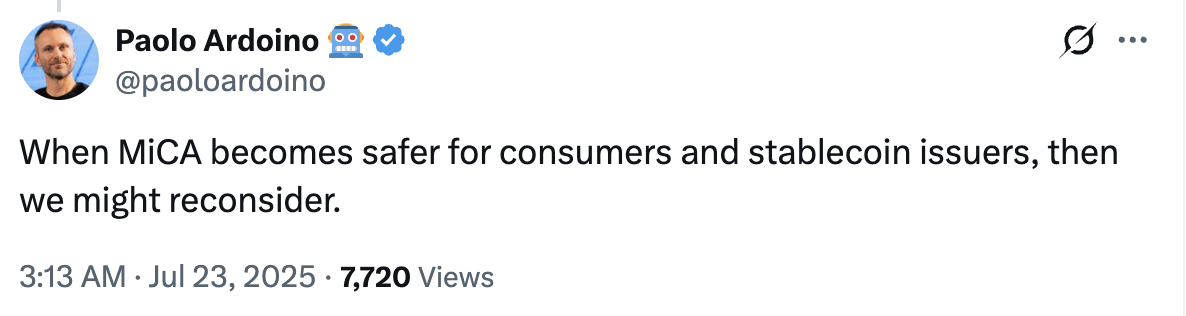
Source: Paolo Ardoino
Recently, digital banking platform Revolut said it will stop supporting USDT for customers in the European Economic Area and Switzerland, giving users until Aug. 31 to sell or withdraw their holdings before automatically converting any remaining balances into their base currency.
Magazine: The British Virgin Islands are a top crypto hub no one ever talks about: Here’s why


Donald Trump-founded Trump Media announced that Wall Street trading firms will be offered paid access to the president’s Truth Social posts before they’re shared with the public — a move that could be interpreted as selling insider trading information.
Specifically, firms will be able to pay for a Truth Social interface that grants “real-time access to posts from the highest-ranking Truth Social accounts” milliseconds before they’re published online.
Trump Media and Technology Group runs Truth Social, the social media app where President Trump’s account boasts 12.9 million followers.
Kathleen Clark, a conflict-of-interest expert at Washington University School of Law described the new services as “more brazen corruption,” and “an improper exploitation of government power to enrich himself.”
She added, “He’s selling expedited, privileged access to information about what he is doing as president.”
Read more: ANALYSIS: Mapping Donald Trump’s growing crypto empire
Trump Media is reportedly running at a loss, and hopes to boost its coffers by monetizing “proprietary assets” within the app.
Its new service will target multi-billion-dollar trading firms competing for increasingly early access to breaking news. Any amount of time they can claw back before news becomes public is key to making a profitable trade.
Truth Social claims that its data was already being copied by some firms, and that these third-party operations would be blocked by the company in favor of its own monetized access.
Trump administration a magnet for insider trading allegations
This paid-for access appears on its face to be a light form of insider trading from an administration that’s already been plagued with numerous allegations and investigations.
Indeed, reporting from CNN this week found Trump had used his Truth Social account to promote multiple big-name companies days after he had purchased hundreds of thousands of dollars’ worth of stock in said companies.
It claims that 20 different companies, including Nvidia, Tesla, and American Eagle, were promoted on his account days after he bought their stock.
Meanwhile, the US government’s long-time teleprompter was put on unpaid administrative leave after he allegedly made over $100,000 using Trump’s pre-written speeches to insider trade on prediction market Kalshi.
Gabriel Perez allegedly bet on dozens of prediction markets involving Trump speeches across a three-month period alone and was later flagged by the Commodity Futures Trading Commission.
The agency is reportedly seeking to settle with Perez, who has worked for Trump since 2016.
This is just one instance of the numerous signs of insider trading within Trump’s administration in relation to prediction market trades. Signs of insider trading also appeared in markets involving military actions against Venezuela’s Nicolás Maduro, and Iran.
Read more: Trump documents meltdown over Iran war on Truth Social
Insider trading and leaks are also allegedly taking place across futures oil markets, and also allegedly within ongoing US and Iran peace talks.
Drop Site reports that during these talks, Iranian officials warned Vice President JD Vance that Trump’s Special Envoy Steve Witkoff and his son-in-law, Jared Kushner, were exploiting insider negotiations to profit in financial markets, and risk undermining any deal.
Last month, Trump also pardoned Stephen Buyer, a republican who served almost two years in prison after he used insider information to trade stocks based on the around te merger of T-Mobile and Sprint.
Got a tip? Send us an email securely via Protos Leaks. For more informed news and investigations, follow us on X, Bluesky, and Google News, or subscribe to our YouTube channel.

Bitcoin’s path toward a potential macro bottom is once again being traced with onchain “supply in loss” timing and investor cost-basis models that suggest the market’s late-bull momentum may be fading.
In a new read of historical patterns, K33 Research highlighted that more than half of the BTC supply has been held at a loss for the first time in this bear market—an inflection point that, in past cycles, has tended to precede the final leg of drawdowns and the start of a sturdier post-bottom recovery window.
Key takeaways
- According to K33 Research, BTC supply in loss crossed 50% on June 5, marking a key bear-market threshold.
- K33 says the period from that 50% crossing to a macro bottom has ranged from 13 to 101 days in historical bear markets.
- As of July 17, CryptoQuant data shows supply in loss at 46%, implying the “countdown” is still in progress.
- CryptoQuant’s realized cap variance model (RCV) is reported to be in the bottom 6% of its historical range, with a Z-score at -2.35—consistent with late-stage bear conditions.
Why supply in loss is again driving “bottom” timing
In its H1 2026 Round-Up report, K33 Research pointed to a classic onchain metric: the share of Bitcoin held at a loss, based on investor cost-basis versus current market price.
K33 frames supply in loss as a practical yardstick for where Bitcoin often is in the lifecycle of a bear market. The firm noted that once this measure moves above 50%, the subsequent time to a macro bottom has historically been limited to a relatively defined “window”—with the shortest observed case lasting just 13 days in 2022.
In longer or more drawn-out drawdowns, the metric has taken considerably more time. K33 cited examples from prior cycles: in 2018, the decline required 23 days after the 50% supply-in-loss mark; in 2014, Bitcoin continued to drop for roughly 101 days after the same threshold was reached.
For the current cycle, K33 said the 50% crossing occurred on June 5. With about 42 days having elapsed since that point, the current “bottom window” is now described as the second-longest on record for Bitcoin among bear markets studied—an observation that matters because it suggests this drawdown phase is not yet compressed into the earliest historical end-game, even if it is moving into the later stages.
K33 also added that returns over the year after these threshold-driven periods “tend to be very solid,” reinforcing why traders and long-term investors continue to watch the supply-in-loss gauge rather than relying solely on price action.
What the latest onchain readings imply for timing
While K33 anchored the narrative to the 50% supply-in-loss break, CryptoQuant’s dashboard data provides the near-term checkpoint. In earlier commentary, Axel Adler Jr., an onchain analytics contributor on CryptoQuant, suggested supply in loss was roughly “two months away” from levels historically associated with bear-market bottoms.
As of July 17, CryptoQuant data puts supply in loss at 46%. Combined with the June 5 crossing reported by K33, that difference helps explain why analysts are still treating the move as a countdown rather than a completed cycle signal: the market is below the historical 50% threshold only after having crossed it, and the current reading indicates the “loss-heavy” ownership phase is easing but not yet fully resolved.
For investors, the key is not the exact day count but the relationship between supply-in-loss behavior and how markets tend to transition from capitulation-heavy distribution toward stabilization. If the metric continues to normalize in line with past bear-market arcs, it supports the notion that risk may be tilting toward the later stages of the drawdown rather than the beginning of a fresh leg lower.
Cost-basis models add a “late bear market” signal
Beyond supply in loss timing, CryptoQuant also pointed to an investor cost-basis indicator it described as showing rare readings. The model in focus is realized cap variance (RCV), which compares realized cap to market cap and then tracks that spread relative to its rolling historical distribution.
In a CryptoQuant QuickTake blog post published on Thursday, contributor Crazzyblockk explained that RCV is designed to isolate how stretched or compressed investor cost basis has become versus current valuation, using the variance itself rather than price alone.
“When that variance compresses into deeply negative z-score territory, the emotional premium built during rallies has largely been priced out. The metric doesn’t read narrative, it reads the distribution of capital.”
The same post said the RCV currently sits in the bottom six percent of its historical range. It also highlighted the standardized Z-score value at -2.35, describing this as an indication that Bitcoin may be in the later stages of a bear market.
CryptoQuant’s commentary went further by noting precedent: the post reported that previous stretches spent extended time below a -2.0 Z-score—citing late 2018, mid-2022, and early 2015—before being associated with forward twelve-month returns above 75%. The historical comparison matters because it positions the present reading not just as “bear market,” but specifically as a regime that has tended to precede substantial improvement after the bottom phase.
The most extreme example referenced was a Z-score of -4.68 in November 2018, which the post said landed almost exactly on Bitcoin’s cycle bottom near $3,792.
What to watch next as the “countdown” unfolds
For now, the most actionable takeaway is that two independent onchain lenses—K33’s supply-in-loss threshold timing and CryptoQuant’s realized cap variance regime—are pointing to the same broad phase: late-stage bear market conditions rather than an early, fresh destabilization. Readers should watch how quickly supply in loss continues to drift down from the 50% crossing and whether RCV remains pinned in deeply negative Z-score territory, since those are the signals most likely to confirm whether the cycle bottom window is narrowing or extending further.
Crypto World
Cardano hands core software over to outside developers to achieve full decentralization


Cardano developer Input Output is handing control of core blockchain infrastructure to outside teams, reducing the network’s dependence on the company that built it, Input Output announced Friday.
Input Output said the handover is the next phase of Cardano’s decentralization. It covers Cardano’s Haskell node, Plutus smart-contract platform, Daedalus wallet, Hydra scaling technology and developer relations.
Specialist companies include Se7en Labs, a development agency specializing in Solana blockchain infrastructure, and Teragone, a specialist software development and cryptographic research team that leads the development of Mithril, a stake-based signature protocol for the Cardano blockchain. Both will take responsibility for some of the components. The handover will begin in August and continue into 2027.
Cardano has already moved protocol decisions and governance to its community. Input Output said the next step is to spread responsibility for developing and maintaining the software.
“The last stage of the Voltaire era is full decentralization of node and reference blueprint development,” Input Output CEO and Cardano founder Charles Hoskinson said in the statement.

Bitcoin’s slide to around $57,700 at the end of June may have completed the worst phase of its 2026 bear market, according to a new market update published by BIT on July 17.
After correctly anticipating much of BTC’s decline in the last few months, the crypto investment firm now says traders should assess whether that low marked the end of the correction or was merely a pause before another leg down.
Market Has Largely Followed Earlier Roadmap
BIT’s latest report builds on research it published on June 12, when it argued that Bitcoin had entered the final stage of its bear market. At the time, the firm outlined an Elliott Wave A-B-C correction pattern running from October 2025 that showed an initial selloff into the $60,000 to $69,000 range and a rebound toward $80,000 to $90,000, followed by a final Wave C drop during the 2026 FIFA World Cup, which is due to end on July 19.
That forecast has mostly played out, with BTC first plunging from around $97,000 to $62,900 in February this year before it recovered to about $82,000 in May, an event that was described in the report as a “counter-trend rally within a bear market.” It then went lower and eventually hit $57,700 at the end of June after geopolitical tensions and changing expectations for US monetary policy weighed heavily on risk assets.
In the July 17 update, BIT acknowledged that it underestimated the impact of the conflict between the United States and Iran, which pushed inflation higher than expected, and the hawkish stance adopted by the new Federal Reserve chair, Kevin Warsh. Even so, the firm said that the broader price structure closely matched its original outlook.
The earlier report had also pointed to several technical signals supporting the possibility of a market bottom, including historically depressed sentiment and oversold stochastic readings. Furthermore, at the time, BTC had been trading well below its weekly moving average. The new update has now shifted attention to the 21-week moving average, which it described as an important gauge for determining whether the market has transitioned back into a longer-term uptrend.
Not Everyone Thinks the Same
However, not everyone reading the charts sees a bottom forming. Take, for instance, CryptoQuant contributor IT Tech, who wrote in a note aptly titled “You really think the bottom is already in?” that spot Bitcoin ETF flows, which were one of the biggest drivers behind the OG crypto’s rally in the last two years, have dropped notably in 2026.
In 2024, cumulative net inflows were more than 500,000 BTC, with 2025 recording similarly strong inflows of about 250,000 BTC. However, 2026 has seen the funds bleed out roughly 120,000 BTC, leading the analyst to ask:
“If ETF demand drove the rally up, how can you be bullish while that demand reversed completely?”
According to them, what the market is seeing is a headwind and not a tailwind.
Earlier this week, Bitcoin found itself above the $65,000 level after US CPI numbers came back much lower than the market had anticipated, but those gains were quickly taken away by sellers, and at the time of writing, the asset was trading near $63,000, down almost 3% in 24 hours and about 2% across one week. Furthermore, it’s over 50% below its all-time high.
The post Is the Worst Over for Bitcoin? New Analysis Examines Whether $57.7K Marked the Bottom appeared first on CryptoPotato.
Bitcoin price fell below $63,000 after fresh US attacks on Iran lifted oil and the dollar, while renewed election claims from President Donald Trump added pressure on risk assets.
Summary
- Bitcoin price fell below $63,000 as fresh US strikes on Iran pressured risk assets.
- Oil reached $80 while the US Dollar Index climbed to 100.79.
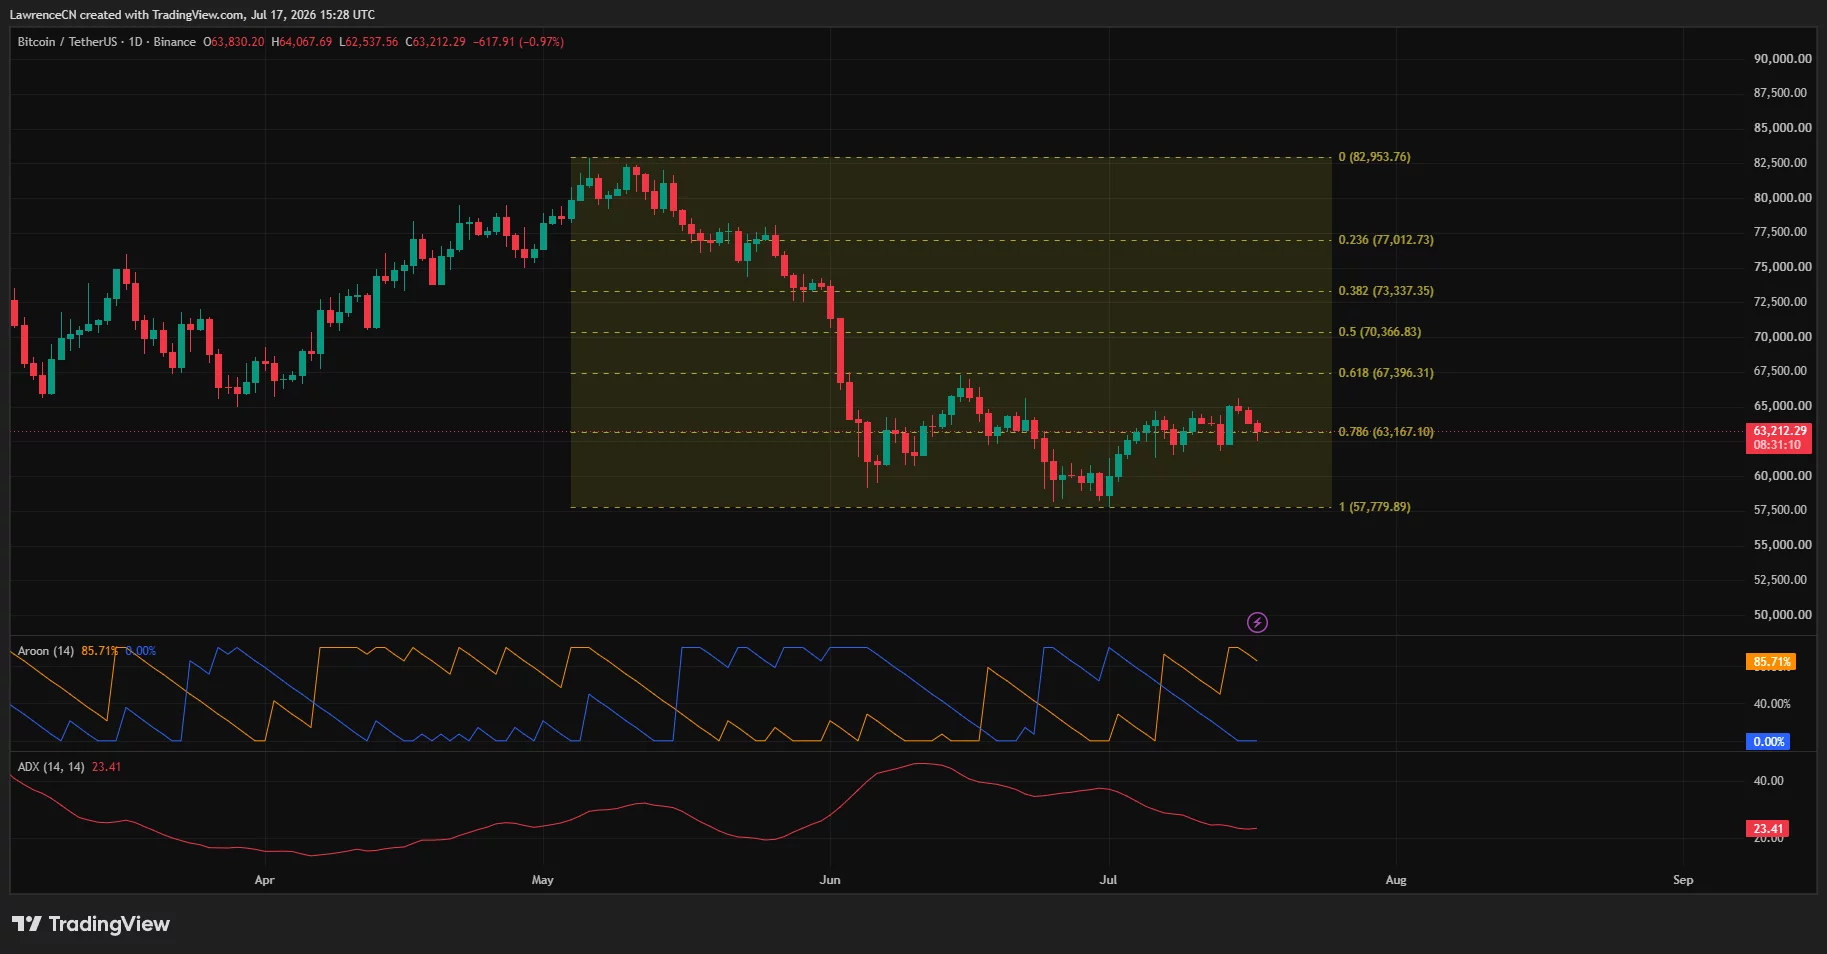
- BTC must defend $63,167 or risk falling toward the $57,779 support.
According to data from crypto.news, Bitcoin (BTC) dropped 3.5% to an intraday low of around $62,500 on July 17 before recovering slightly to around $63,150, leaving the asset down nearly 2.4% on the day. US stock futures also extended their losses as traders assessed another round of military action and its possible economic impact.
Iran strikes have renewed pressure on Bitcoin
US Central Command confirmed that American forces had attacked Iranian military positions for a sixth consecutive night. According to CENTCOM, the operation hit coastal surveillance systems, air-defense sites, logistics infrastructure and maritime assets.
Reports from the region also indicated that US forces struck transport links near Bandar Abbas, including the Bandar Khamir overpass, two other bridges in Hormozgan Province and a railway station connected to Shahid Rajaei port. Those reports had not been independently confirmed at the time of writing.
Iran responded with attacks across the Gulf, according to initial reports, including a strike targeting Qatar, where the US operates Al Udeid Air Base. Further attacks were reported in Bahrain, Jordan, Kuwait and Iraq as the conflict continued to spread through the region.
Speaking before the latest operation, White House press secretary Karoline Leavitt claimed Tehran was still seeking an agreement with Washington because of the damage caused by US forces.
“Iran very much continues to talk to the United States of America and express that they want to make a deal with us because they are suffering devastating blows on behalf of our United States military.”
Against that backdrop, the US Dollar Index rose to 100.79, while oil traded near $80 per barrel on July 17. A stronger dollar can weigh on dollar-priced assets, while higher energy costs may complicate the inflation outlook and weaken demand for riskier investments.
Bitcoin now faces a decisive $63,167 support test
Technical pressure has increased as Bitcoin trades near the 78.6% Fibonacci retracement at $63,167. The daily candle briefly broke that level below, though buyers prevented a close near the session low.
The daily chart shows that rebound attempts have repeatedly stalled between $65,000 and $66,000. If BTC confirms a breakdown below $63,167, the June range floor near $57,779 would become the next major support, while a recovery must first clear the 61.8% Fibonacci level at $67,396.
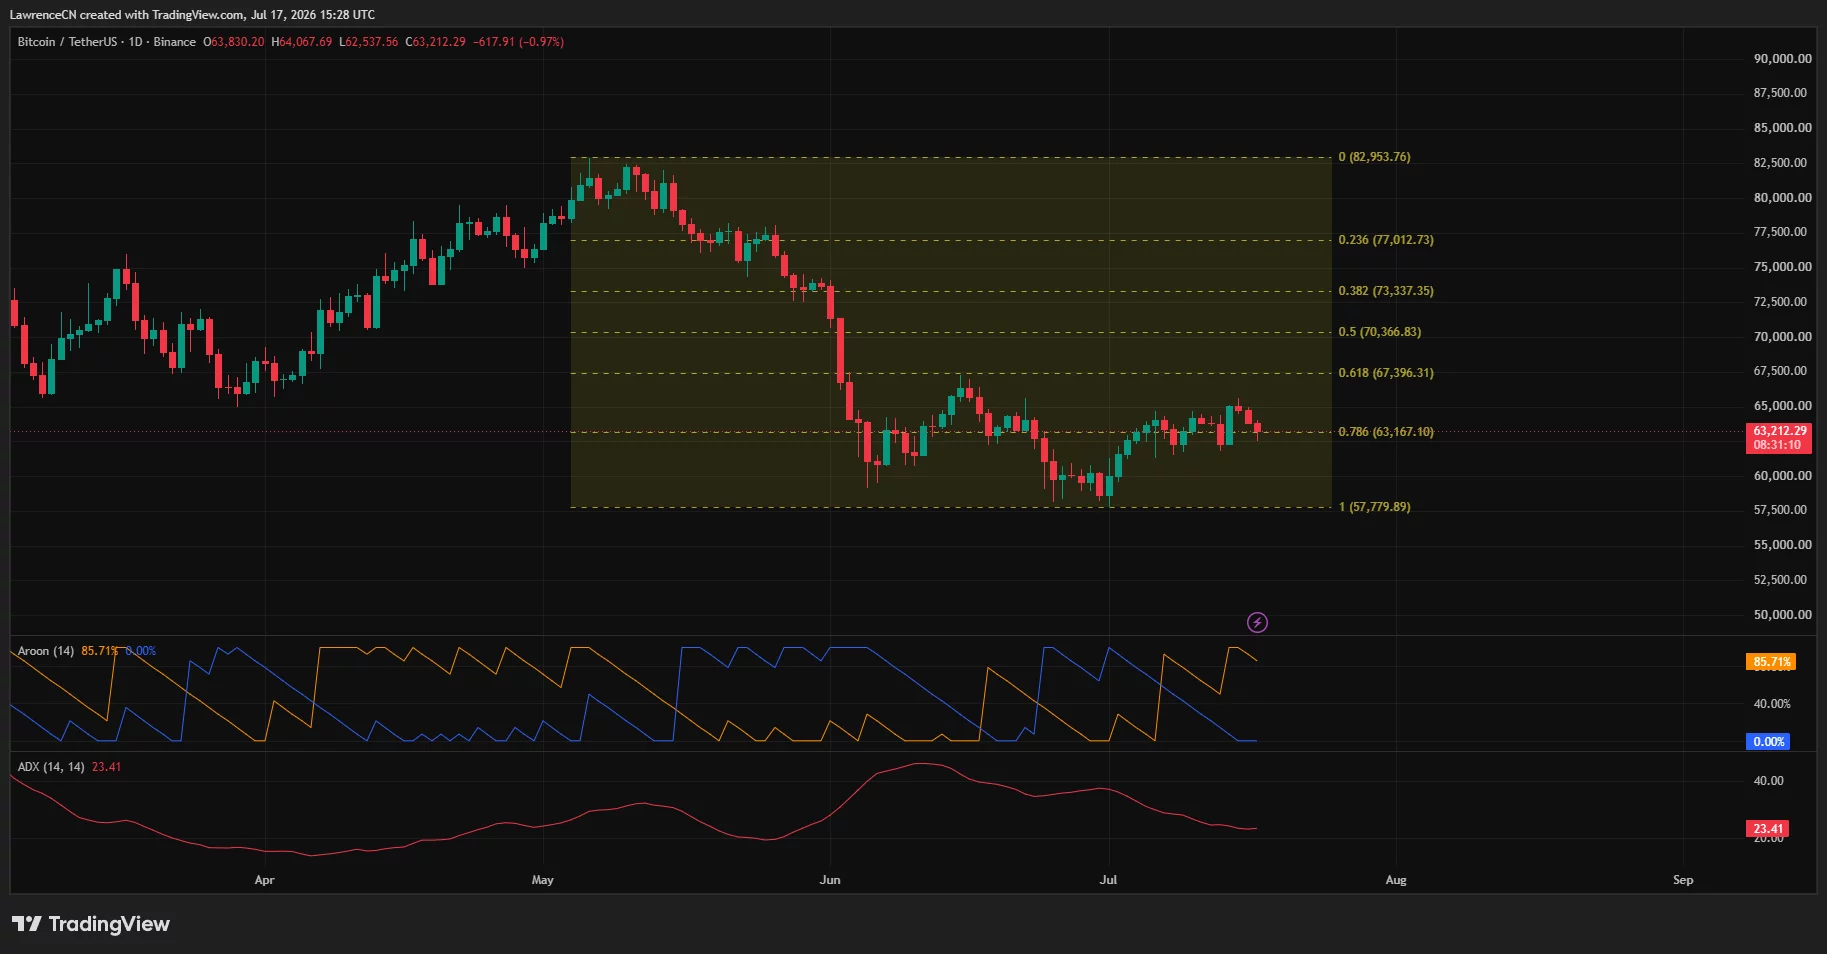
Momentum indicators continue to favor sellers. Aroon Down stood at 85.71%, compared with Aroon Up at 0%, while the Average Directional Index registered 23.41, pointing to a bearish trend with moderate strength.
Political uncertainty added another source of pressure after Trump used a White House address to accuse China of interfering in the 2020 presidential election. Trump claimed declassified intelligence showed that Chinese actors stole files containing data on 220 million US voters, though US intelligence assessments have not found evidence that foreign activity changed votes or other technical aspects of the election. The Guardian reported that China and US intelligence officials have rejected Trump’s core allegation.
During the address, Trump also urged Congress to pass the SAVE America Act, which includes voter identification and proof-of-citizenship requirements. Democratic lawmakers, including Chuck Schumer, Jim McGovern, Elizabeth Warren and Bernie Sanders, accused the president of reviving disputed election claims instead of addressing household costs, housing and healthcare.
Despite the sell-off, BlackRock CEO Larry Fink recently expressed a bullish 12-month view on crypto and described Bitcoin as stable around current levels.
The chart, however, places the immediate focus on whether buyers can defend $63,167 as geopolitical and political risks continue to test market sentiment.

More than $1 out of every $10 in the world’s tokenized US Treasuries is issued through entities incorporated in the British Virgin Islands, according to BVI Finance. In its June “Destination Digital” report, the organization estimates that BVI-linked firms accounted for roughly $1.5 billion of a $14.98 billion global tokenized Treasuries market as of June 1—making the small Caribbean territory the second-largest jurisdiction after the United States.
The BVI’s rise appears tied less to headline “tax haven” narratives and more to the legal and regulatory scaffolding that tokenization projects need to operate within institutional-grade workflows. At the same time, industry usage of the territory is nuanced: most companies do not physically relocate to the islands; they often use BVI entities as the legal layer around token issuers, treasury vehicles, holding companies, or special purpose vehicles (SPVs).
Key takeaways
- The BVI is behind about $1.5 billion of $14.98 billion in global tokenized US Treasuries (as of June 1), placing it just behind the US by issuer jurisdiction, per BVI Finance.
- BVI selection is driven primarily by regulatory clarity and legal certainty, not by taxes, according to advisers and executives interviewed in the underlying reporting.
- Regulatory capacity is a differentiator: the BVI’s VASP regime (introduced via the VASP Act in 2023) is overseen by the BVI Financial Services Commission with an application process aimed at faster timelines.
- The territory functions as a corporate home, not a global engineering hub: multiple firms incorporated in the BVI conduct operations elsewhere.
- BVI-linked stablecoin activity and tokenized securities volume are notable, including a high number of tokenized securities tracked in the RWA.xyz dataset, according to Bernstein Research.
Tokenized Treasuries and the “legal home” effect
BVI Finance’s “Destination Digital” report highlights how concentrated the issuance of tokenized US Treasuries has become by jurisdiction. As of June 1, BVI-linked entities represented approximately $1.5 billion out of $14.98 billion in the global market, based on data compiled for the report.
Beyond Treasuries, the same reporting frames the BVI as a broader digital asset jurisdiction. It cites a stablecoin market cap of about $1.2 billion held in BVI-linked addresses and an estimated 28,000 stablecoin asset holders. It also points to regulatory momentum: more than 25 virtual asset service providers (VASPs) have been approved under the BVI’s VASP regime.
In the tokenized securities category, Bernstein Research data referenced by the report suggests the BVI hosts 305 tokenized securities in the RWA.xyz dataset—the highest count of any single jurisdiction. Together, these figures support the view that the BVI has become one of the leading destinations for real-world asset tokenization activity.
Still, the article’s core caveat is important for readers: tokenization is designed to be borderless, and projects can choose where to incorporate without moving their operational footprint. In practice, many digital asset firms treat the BVI as the legal base while teams, infrastructure, and day-to-day operations remain distributed globally.
Regulation and legal certainty outweigh tax assumptions
For years, offshore jurisdictions in the Caribbean have often been described primarily through a tax lens. But advisers and industry executives interviewed in the underlying reporting say that assumption doesn’t match how many tokenization-focused firms decide today.
Andrew Jowett, a partner at Appleby (BVI) Ltd, said clients typically compare multiple jurisdictions—such as the Cayman Islands, the United Arab Emirates, Singapore, and Switzerland—when structuring digital asset businesses. In his account, the “overriding factor” is digital asset regulation rather than tax.
The BVI does have tax advantages: it imposes no corporate income tax or capital gains tax on BVI companies, according to BVI’s financial services commission guidance linked in the reporting (see What tax structure BVI imposes). However, the argument presented is that many competing crypto hubs now offer tax neutrality, making legal and regulatory readiness the differentiator.
Executives echoed that sentiment. Saeed Al-Marri, CEO of Ethra (incorporated in the BVI), described tax neutrality as “table stakes,” adding that institutional adoption depends on legal certainty and clarity. Similarly, Jack Yang, founder and CEO of LTP (which operates regulated entities across the BVI, Hong Kong, Australia, and the UAE), said taxation is “secondary” to whether structures can pass institutional review.
In Yang’s view, a “tax-neutral structure” that banks, custodians, auditors, investment committees, or regulators cannot accept has limited practical value—particularly as tokenization moves deeper into traditional finance processes.
Orest Gavryliak, chief legal officer at 1inch (also incorporated in the BVI), framed the shift as a changing role for jurisdiction itself: it is not becoming irrelevant, but protocols increasingly weigh predictable rules, institutional credibility, and long-term sustainability over the lowest possible tax burden.
What the BVI VASP framework is designed to deliver
One of the central regulatory developments mentioned in the reporting is the BVI’s VASP regime. The BVI introduced the Virtual Assets Service Providers Act (VASP Act) in 2023, overseen by the BVI Financial Services Commission (FSC). BVI Finance and FSC guidance cited in the underlying material describe a targeted review cadence: responses to VASP applications within six weeks, with an aim to complete the review process within six months.
Fast, predictable processing matters in tokenization because projects often need regulatory alignment quickly to meet timelines for custody arrangements, distribution partnerships, and institutional onboarding. The article also argues that “ease of launch” and flexible corporate structuring have been part of the BVI’s appeal beyond tax incentives.
Jowett described the broader corporate-vehicle angle: companies can be set up quickly, the legal framework is flexible, and ongoing reporting is generally lighter than in onshore jurisdictions. The reporting also notes the BVI’s historical preference for corporate confidentiality, adding that BVI companies remain subject to AML and KYC expectations while beneficial ownership information is held by registered agents rather than being publicly disclosed as a register—reducing public-facing disclosure requirements.
Importantly, the accounts provided in the underlying reporting suggest confidentiality and tax neutrality were not the deciding factors for the interviewed companies. Instead, they pointed to legal certainty, regulatory clarity, and the ability to structure corporate arrangements efficiently as tokenization expands.
No “physical HQ rush,” just corporate anchoring
A recurring theme in the reporting is that BVI incorporation does not necessarily mean a company’s people or infrastructure move to the islands. Yang, speaking about LTP, said the entity does not employ full-time staff “on the ground.” Instead, governance is handled by its board while staffing support is drawn from elsewhere in the group.
The same distinction is described through examples across the industry. The article notes that Kraken’s parent company, Payward, is incorporated in the BVI, while the exchange’s primary operations are based in the United States. It also says 1inch’s team and operations are spread across multiple jurisdictions.
The practical implication is that the BVI may be winning a different competition than the one often associated with global tech hubs. It is not primarily attracting large engineering teams or flashy headquarters. Rather, it is becoming a legal anchor for digital asset businesses—particularly tokenization activity—where the corporate structure is a critical input to institutional acceptance.
For readers watching the next wave of real-world asset tokenization, the question is less “which country hosts the most staff” and more “which jurisdictions offer the cleanest path through institutional compliance.” The BVI’s case suggests that if the legal wrapper around a tokenized product can satisfy regulators and counterparties, the incorporation location can become a quiet but decisive advantage.
As more tokenized Treasury issuance, stablecoin usage, and tokenized securities migrate toward regulated frameworks, investors and builders should watch how institutional counterparties (custodians, auditors, banks, and investment committees) respond to BVI structures—and whether similar regulatory programs in other jurisdictions keep tightening timelines and compliance standards.
Argentina’s Federal Judge Marcelo Martínez De Giorgi has frozen dozens of crypto wallets tied to the LIBRA investigation and ordered six international exchanges to hand over complete client files, including KYC records, IP logs, and linked bank accounts.
Prosecutor Eduardo Taiano requested the measure on July 14, nearly 1.5 years after the token’s collapse. He relied on a Federal Police cybercrime report tracing funds from the so-called Team Libra wallets to major trading platforms.
Exchanges Must Hand Over KYC Data in the LIBRA Investigation
The freeze covers accounts at Binance, Bybit, OKX, CoinEx, FixedFloat, and Bitfinex. Each platform must deliver account opening files, IP connection logs, transaction histories, linked bank accounts, and internal memos.
Based on reports, at least 25 accounts have been frozen, though the ruling itself refers to dozens of wallets.
The judge held that both the plausibility of the claim and the danger of delay were established. Therefore, the accounts will stay frozen to preserve assets for a potential confiscation before any proceeds can be cashed out.
Argentina’s Federal Police cybercrime unit will process the requests, with Interpol stepping in when needed. Its report reconstructed an unbroken chain of on-chain transactions from Team Libra wallets through Jup.ag, FixedFloat, and deBridge Finance.
The findings build on fresh LIBRA case evidence gathered earlier from seized phones. The resolution, as translated, describes a deliberate laundering pattern.
“A digital smurfing or structuring strategy was deployed, consisting of the daily distribution of fragmented amounts to multiple wallets linked to centralized exchange houses… with the purpose of liquidating the assets in fiat currency or making it difficult to trace them.”
Follow us on X to get the latest news as it happens
Smurfing Trail Meets Political Friction
On February 14, 2025, President Javier Milei promoted the Solana-based LIBRA token on his X(Twitter) account. The post has since been deleted.

According to the complaint, the price climbed from $0.01 to nearly $5, a roughly 500-fold move, before collapsing within hours.
A small cluster of wallets allegedly withdrew around $100 million in that window. Meanwhile, more than 40,000 buyers who entered after the presidential post saw their holdings collapse, with many suffering steep retail trader losses.
Prosecutors believe traders Mauricio Novelli and Manuel Terrones Godoy orchestrated the scheme alongside US businessman Hayden Davis, who created the token.
Earlier leaked files pointed to an alleged $5 million contract for the presidential promotion, a claim Milei denies.
However, the tracing push arrives as the case’s victim-driven side collapses. In early July, the same judge removed all five investor plaintiffs at Novelli’s defense request, leaving Taiano alone to advance the file.
Opposition lawmakers also linked the ruling to the Senate’s approval of the judge’s wife’s nomination to the federal bench, a nomination Milei submitted.
“With prosecutor Taiano stalling the investigation, if there are no victims to push it forward, the case will be abandoned,” Peronist Deputy Selva Almada wrote.
The exchange responses may now decide whether investigators can attach names to the frozen wallets.
LIBRA’s arc mirrors the TRUMP token, where meme coin retail losses reached $3.81 billion across nearly 1 million wallets. Whether Argentina can recover its $100 million is the question the KYC files may finally answer.
The post LIBRA Probe Corners Binance, Bybit, OKX: Whose Names are Behind the Frozen Wallets? appeared first on BeInCrypto.

West Indies cricket legend Sir Garfield Sobers dies

GOLD LIVE – XAUUSD Forex Detector Live Trading Session# 448A #crypto #forexlive #forexdetector

Danniella Westbrook, 52, says she ‘hates the way she looks’ as she prepares to undergo fifth facial reconstruction surgery which will involve ‘taking a rib out’


-

 Fashion7 days ago
Weekend Open Thread: Nutriplenish Leave-In Conditioner
-
 NewsBeat1 day ago
London Mayor Sadiq Khan handed a peerage by Keir Starmer alongside 15 other Labour figures… just days before the PM leaves No10
-

 Crypto World2 days ago
CFTC blocks Kalshi from unwinding Michigan trades after court order
-

 Politics2 days ago
Young campaigners urge incoming PM to act on outdoor junk food ads
-

 Business2 days ago
Nvidia Stock Slips After Big Tuesday Rally as Huang Confirms Vera Rubin Chip Is Now in Production Today
-
 Entertainment2 days ago
Disney’s Most Ambitious Failed Star Wars Attraction Is Coming to SDCC
-
 Tech4 days ago
Get Your ESP32 Sunny Side Up With This Solar Dev Board
-

 News Videos3 days ago
XRP BOMBSHELL… XRP OMBOARDED FOR TRANSACTIONS!!!
-

 Crypto World21 hours ago
Injective Submits SEC Transfer-Agent Registration to Onchain Ownership Records
-

 NewsBeat5 hours ago
Registration is now open for March for Men with Kev 2026
-

 Tech3 days ago
Dark Secrets Emerge When Jailbreaking LLMs
-

 Business2 days ago
Palantir Shares Rise After Expanded Nvidia Partnership and Fresh Analyst Upgrades Ahead of Earnings Day
-

 News Videos11 hours ago
Money | Class 12 Economics | CBSE Board Exam 2026-27
-
 Sports2 days ago
New Cornerback Enters Vikings Trade Rumor Mill
-

 Business16 hours ago
Banco Bilbao Vizcaya Argentaria, S.A. (BBVA) Discusses Global Macro Environment and Economic Outlook for Core Markets Transcript
-
 Tech4 days ago
Cloudflare Precursor Watches Your Mouse and Keyboard To Decide If You Are Human
-

 News Videos4 days ago
how to make coin bank box with cardboard #scienceproject #money #diy #shorts
-
 Entertainment2 days ago
Vicki Gunvalson Defends Discussing Heather Dubrow’s Money
-
Crypto World3 days ago
Ripple, Coinbase, Circle Join Linux x402 Foundation to Help Shape AI Payments
-
 Crypto World19 hours ago
Claude Fable 5 Slips to Second in AI Coding Leaderboard
You must be logged in to post a comment Login