

Crypto World
Bitcoin Slumps in February, Yet HODLers and Miners Signal Support


Bitcoin slides in February, but strong miner and long-term holder accumulation hints at possible price support.
The opening weeks of February have delivered a stark diagnosis for Bitcoin’s health, with nearly 43% of its circulating supply in a state of loss and quarterly price performance standing at just under -26%, according to analyst GugaOnChain.
According to them, there is little prospect for recovery before April.
On-Chain Metrics Show Widespread Capitulation
In their latest assessment of the Bitcoin market, CryptoQuant contributor GugaOnChain painted a grim picture for holders of the OG cryptocurrency. Per the analyst, 42.85% of Bitcoin’s circulating supply is now underwater, while the Net Unrealized Profit/Loss (NUPL) indicator has slumped to 21.30%, which is firmly in fear territory.
GugaOnChain’s analysis was backed by experts at XWIN Research, who noted that the recent reading of 8 on the Fear and Greed Index was one that has rarely been seen, only appearing in previous stress events, including the 2018 bear market bottom, the March 2020 COVID crash, and the FTX collapse in November 2022.
The analysts pointed out that from a behavioral finance perspective, this reflects loss aversion and herd behavior, with investors reducing risk exposure after significant losses.
Looking at the quarterly price performance, it stands at -25.8%, with GugaOnChain seeing little prospect for recovery before Q2 2026. Additionally, spot Bitcoin ETF flows tell a similar story of institutional exhaustion. Since the start of the month, the products have seen net outflows of $2.17 billion, with the exodus accelerating as prices tumbled toward $60,000 on February 6.
Price Action Reflects Volatility
Other recent research provides context for the conditions described above. For instance, analytics firm Santiment reported that funding rates across exchanges had turned deeply negative, meaning traders were heavily positioned for price drops.
You may also like:
BTC’s price movement is reflecting the tension, with data from CoinGecko showing the asset had fallen about 3% in the last seven days, 10% over two weeks, and 28% across the past month, while trading roughly 46% below its October 2025 all-time high when it went past $126,000.
The growth contraction extends beyond Bitcoin itself, with GugaOnChain’s analysis showing the broader crypto economy shrinking, as mid-cap and small-cap altcoins contracted by 18.3% while the growth rate of the top 20 assets folded by -12.48%.
However, even with prices collapsing, demand from accumulator addresses has stayed strong at 380,104 BTC over the last 30 days. Furthermore, miners appear to be holding their BTC rather than selling, with their operations supported in part by AI revenue streams.
Taken all together, the conditions described in GugaOnChain’s assessment frame the current phase as one defined by fear, defensive positioning, and selective accumulation with little broad market confidence. According to them, “the turn toward recovery now depends on investor resilience.”
SECRET PARTNERSHIP BONUS for CryptoPotato readers: Use this link to register and unlock $1,500 in exclusive BingX Exchange rewards (limited time offer).

Crypto World
Traders Pour Tens of Thousands Into DeepSnitch AI To Boost Their Gains After March 31, PEPETO Investors Fear a Slow Fade

KuCoin launched equity-linked perpetual contracts tied to Tesla and Strategy. The products will allow traders to speculate on price movements through USDt-settled derivatives 24/7.
In the trenches, though, traders are more interested in enriching than portfolios. In addition to the Pepeto price prediction, many are exploring DeepSnitch AI after learning that the launch has been set for March 31.
Since DeepSnitch AI has been projected to go 100x-300x by the community, its launch remains one of the most interesting dates in March 2026.

KuCoin goes for perps on public companies
KuCoin listed TSLAUSDT and MSTRUSDT perpetual contracts on March 13, giving its 40 million users exposure to two of crypto’s most Bitcoin-adjacent public companies.

The contracts track underlying equity price movements using a pricing framework designed to mitigate traditional market hours and crypto’s 24-hour trading.
Positions start from 1 USDt, dropping the entry threshold when compared to traditional equity derivatives markets.
The infrastructure around crypto continues to expand, and while this is a clear bullish signal, retail traders that aren’t into perps are more interested in snagging presale coins. Hence, the interest is high in DeepSnitch AI, Pepeto price prediction, with many also inquiring about Flashpump.
Best presales in 2026
1. DeepSnitch AI: A tool that will help you find breakout projects launching on March 31
The Pepeto price prediction is interesting, sure. But imagine if you could find other coins like Pepeto before most traders even register it on their radar?
Enter DeepSnitch AI, an analytics suite powered by five AI agents.
Hidden gem scanning is one of five core functions running through the central intelligence layer. The platform continuously scans on-chain and off-chain data, flagging breakout setups before they surface in crypto discussions.
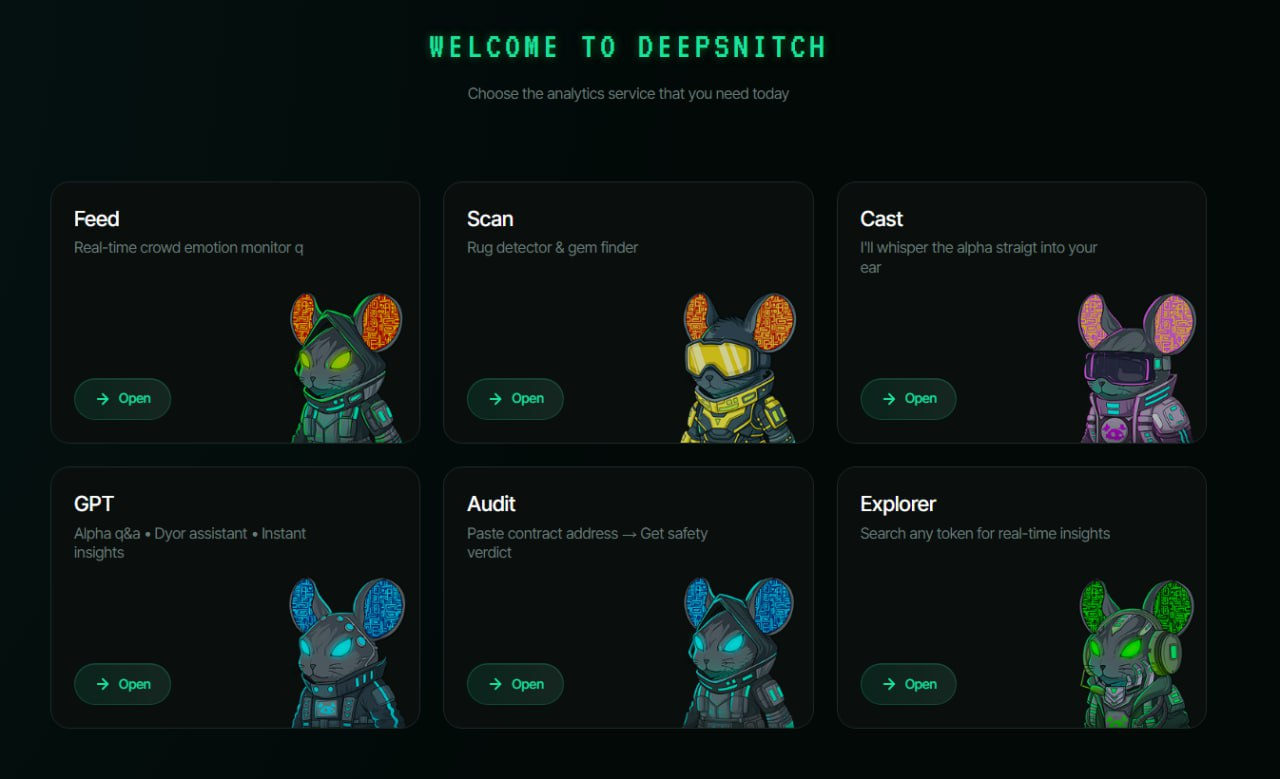
Combined with real-time sentiment tracking, instant contract audits, and rug detection, DeepSnitch AI gives traders a genuine information edge and a reason to return to the tool every day.
While the utility is the main draw here, DeepSnitch AI is also a fine investment opportunity. Over $2.1M raised at $0.04487 during a bear market, and the fact that the platform is ready to roll ahead of schedule confirms this sentiment.
DeepSnitch AI drops on March 31, and since the product has daily usability, the community’s 100x-300x projections are actually quite realistic.
2. Pepeto price prediction: Does Pepeto have solid fundamentals?
As a meme coin, Pepeto has nice vibes. A version of OG Pepe, the coin could attract plenty of meme traders who are looking for a quick flip.
However, the project attempts to break out of the mold by also promising to deliver a cross-chain bridge after launch. Will it do much for the Pepeto forecast?
While it’s impossible to tell, as the Pepeto coin prediction ultimately depends on the levels of hype, the community mentions that the Pepeto price target they expect to see is $0.00007128 – a solid upside from the current $0.000000186 price.
Sadly, the Pepeto price prediction and the initial pump are actually the biggest draws. The problem with most meme coins is that they run on attention cycles that compress faster than most holders expect. The cross-chain bridge is a nice idea, but most large traders will likely make the quick flip and exit before the chart tanks.
3. Flashpump price prediction: User-created meme tokens?
Although the meme coin space is cooling, some projects actually present interesting ideas aimed at meme traders.
Flashpump, for instance, combines AI agents with user-created meme tokens in a platform that gives all of the supply for the community.
Priced at $0.003 in presale, the AI-powered meme creation mechanic could help the project run. The community expects 10x-20x post-launch. While the meme angle may turn off some, the structure is a lot better than what’s seen with other meme projects.
Final words: All bases covered
When scouting out presales, it’s easy to get attached to possible returns (explains why the Pepeto price prediction is a popular topic). Still, that’s only a part of the equation of what marks a successful project.
DeepSnitch AI takes on a different approach as it covers all bases: It provides tools that traders actually need, has the community backing, the momentum, and last but not least, a clear launch date set for March 31.
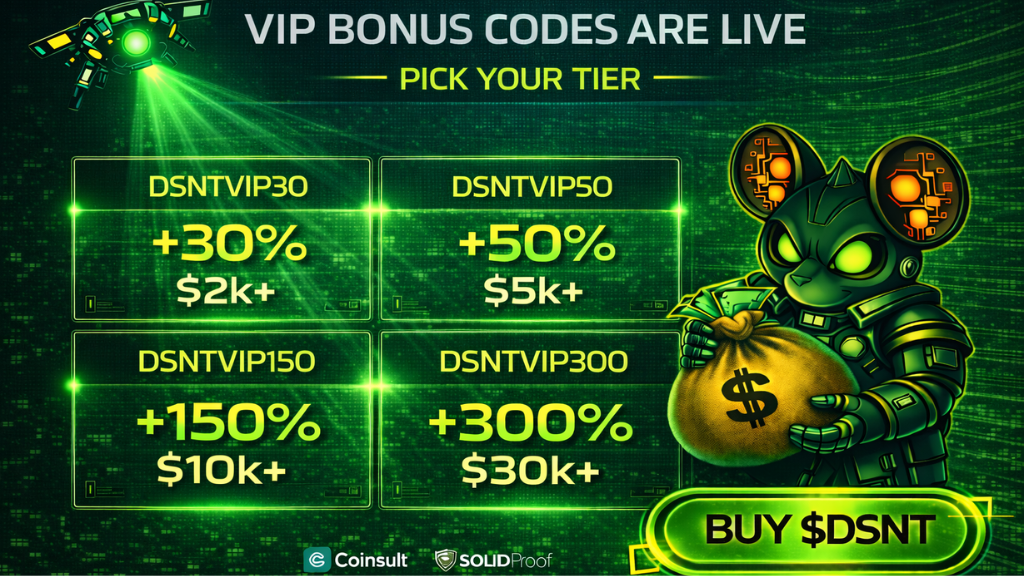
Traders who move now and use the bonus codes will be in the best position when the Uniswap listing kicks in. DSNTVIP30 adds 30%, DSNTVIP50 adds 50%, DSNTVIP150 adds 150%, and DSNTVIP300 unlocks 300% extra tokens on $30K and above.
Considering that the community is eyeing 100x-300x gains, the returns on DSNT could be life-changing.
Join the DeepSnitch AI presale while the codes are still active and follow the community on X or Telegram.
FAQs:
1. What is the Pepeto price prediction, and does PEPETO have solid fundamentals?
Community targets $0.00007128 from $0.000000186, a potentially strong flip if hype holds through launch. Fundamentals are thin, though. A promised cross-chain bridge doesn’t change the meme coin attention cycle reality for most large holders.
2. How does DeepSnitch AI help traders find new coins?
The hidden gem scanner runs continuously on-chain and off-chain scans, flagging breakout setups before mainstream discussion picks them up. Combined with real-time sentiment tracking, it gives traders a genuine information edge that compounds daily.
3. Is Flashpump a better long-term bet than the Pepeto price prediction suggests for meme coins?
Flashpump’s zero team allocation and AI-powered meme creation mechanic make it structurally cleaner than most meme presales at $0.003.
Disclaimer: This is a Press Release provided by a third party who is responsible for the content. Please conduct your own research before taking any action based on the content.

Crypto World
Nasdaq and owner of NYSE turn to crypto exchanges to bring the $126T equity market onchain
Wall Street’s biggest exchanges are embracing digital assets by aiming to put the $126 trillion equity market on blockchains — but they are not going at it alone; rather, they are relying on crypto exchanges to get there.
Over the past week, two of the world’s most powerful exchange operators — Nasdaq and Intercontinental Exchange (ICE), the parent company of the New York Stock Exchange — teamed up with digital asset exchanges to merge equities with blockchains through tokenization.
Nasdaq is developing a framework that would allow publicly listed companies to issue blockchain-based versions of their shares while preserving traditional ownership rights and governance. To distribute those tokenized stocks globally, the exchange is working with Payward, the parent company of crypto exchange Kraken. The offering could go live as soon as the first half of 2027.
Meanwhile, just days earlier, ICE revealed a strategic investment in crypto exchange OKX at a $25 billion valuation. That deal includes plans to launch new tokenized stocks and crypto futures, allowing the exchange operator to tap into OKX’s 120 million user base.
The “everything” exchange
The flurry of deals points to a bigger transformation in how markets might function in the future.
For decades, stocks, bonds and funds traded on separate systems with limited trading hours. Blockchain technology promises a unified, always-on marketplace — one that in the industry believe could eventually host the settlement of all financial assets in the forms of tokens.
Antoine Scalia, founder and CEO of crypto accounting and compliance platform Cryptio, said the developments point to a broader shift toward what he calls the “everything exchange” – a marketplace where all asset classes trade on the same infrastructure.
“For a very long time, it was just crypto people pushing the narrative that traditional finance and crypto would merge,” Scalia said. “Now we see the major exchanges moving.”
“That’s a realization that eventually all assets will settle on blockchain rails,” he said.
This shift is being accelerated by a January SEC Staff Statement on Tokenized Securities, which finally clarified that tokenized equities carry the same legal weight as their “paper” counterparts. That gives Wall Street incumbents the legal cover to enter the market for tokenized equity trading.
‘Frenemy’
However, the key question, Scalia added, is which platforms will dominate that future market: traditional exchanges like Nasdaq or crypto-native venues such as Coinbase (COIN) and Kraken.
But that doesn’t mean the two sides are purely rivals. In many cases, they need each other.
Traditional exchanges are looking for access to crypto-native traders, while crypto platforms want the distribution and credibility that established financial infrastructure provides, Scalia said.
“Distribution works both ways,” he said. “Traditional exchanges want exposure to the crypto trading population, and there’s huge demand from crypto users to trade other types of assets. At the same time, crypto-native firms benefit from the reach of these traditional players to bring more people into crypto markets.”
The result is an unusual, “frenemy”-like relationship between potential competitors. “It’s a very interesting dynamic with frictions and complementarity,” Scalia said. “And it will be interesting to see how it plays out.”
Why tokenized stocks matter
Tokenized equities – currently $1 billion – are only a fraction of the global equity market, but the potential is massive as all kinds of assets are increasingly move towards non-stop, around-the-clock trading.
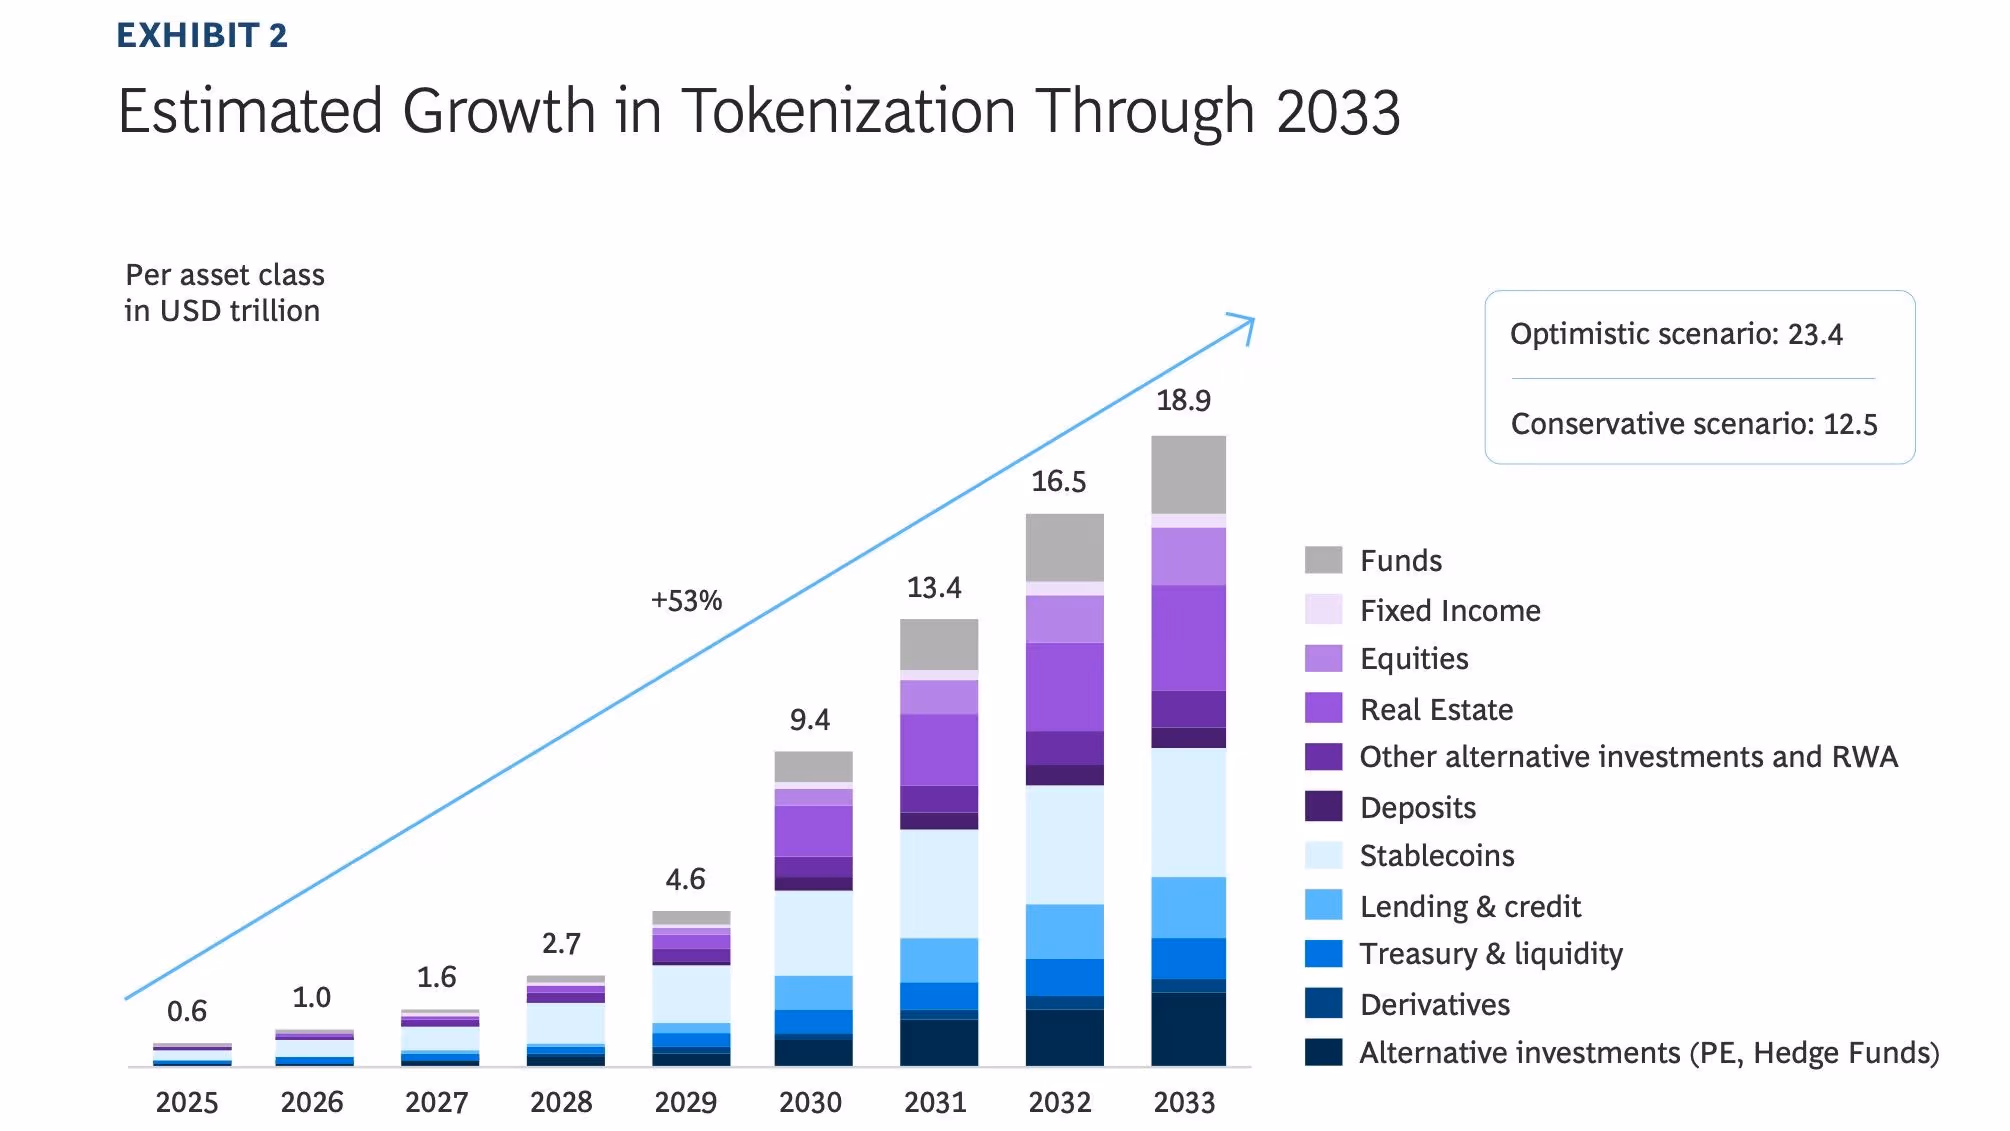
A joint report by Boston Consulting Group and Ripple forecasted that tokenized assets could grow 53% a year, reaching $18.9 trillion across all asset classes by 2033 as their base case.

The market for tokenized stocks showcased even faster growth. The market value has tripled since mid-2025, RWA.xyz data shows, as Kraken, Ondo Finance, Robinhood and a slew of other exchanges and issuers rolled out token versions of equities.
The biggest advantage of putting traditional equities on blockchains is continuous price discovery, said Yuki Yuminaga, founder of tokenization startup Tenbin Labs. Unlike traditional stock markets today, which operate on fixed trading hours, blockchain-based assets never sleep and can trade around the clock. This will likely unlock more capital, improve liquidity and reduce market volatility.
Tokenizing stocks can also unlock more efficient lending and borrowing through decentralized finance (DeFi), Yuminaga added. Tokenized shares could be used as collateral in lending markets, increasing capital efficiency and enabling new financing opportunities, he said.
Giants like Nasdaq and NYSE entering the tokenized stocks game could also solve one of the biggest current pain points: liquidity.
“Tokenized equities have struggled with liquidity because traditional markets and onchain markets are separate,” Yuminaga said. “If Nasdaq connects those two pools of liquidity, that could change the equation.”


The author’s rather controversial recent history with crypto continues, this time, he said he keeps buying.
Robert Kiyosaki, the renowned investor, financial guru, and author, has called for yet another financial crash in his latest post on X, indicating that private credit funds are panicked, with investors pulling out funds.
He outlined his strategy during such a time of distress, and doubled down on the assets he wants to continue buying.
Crash Intensifies
After rightfully predicting the major 2008 banking crisis, the author of a few New York best-selling books has been frequently forecasting even more painful crashes. In his latest warning on the matter, he noted that the “crash accelerates,” which is evident from several factors:
“Private credit funds are panicked as investors withdraw their money. Major big-name banks and brand-name financial institutions are in trouble. Jim Rickards formally declares the US in the New Depression.”
These developments could only worsen if the situation in the Middle East continues for weeks or even months. As such, he asked his over a million followers on X, “What are you going to do?”
His strategy is quite promising, as he plans on “getting richer” and refuses to be the “victim who gets poorer.” Additionally, he laid out the financial assets he plans to continue accumulating to help him achieve his goal – oil, silver, gold, Bitcoin, and Ethereum.
He added that smart money is getting richer and stupid money is running like the “proverbial chicken with its head chopped off.” Kiyosaki concluded that this is not the time to be a “headless chicken.”
Recent Bitcoin History
After bashing the crypto industry for a few years, Kiyosaki changed his tune during the COVID-19 crash and has become a vocal proponent, especially for BTC and ETH as of more recently. However, his latest remarks on the matter have stirred some controversy, especially the lack of consistency in his claims about whether he stopped buying bitcoin.
You may also like:
In one post, he noted that he hasn’t bought any BTC at prices over $6,000. In many others, though, he indicated on social media that he was purchasing more bitcoins when the asset traded well within five or even six-digit territory.
Nevertheless, he has asserted on a couple of occasions that he believes bitcoin is a better investment tool than gold.
Binance Free $600 (CryptoPotato Exclusive): Use this link to register a new account and receive $600 exclusive welcome offer on Binance (full details).
LIMITED OFFER for CryptoPotato readers at Bybit: Use this link to register and open a $500 FREE position on any coin!
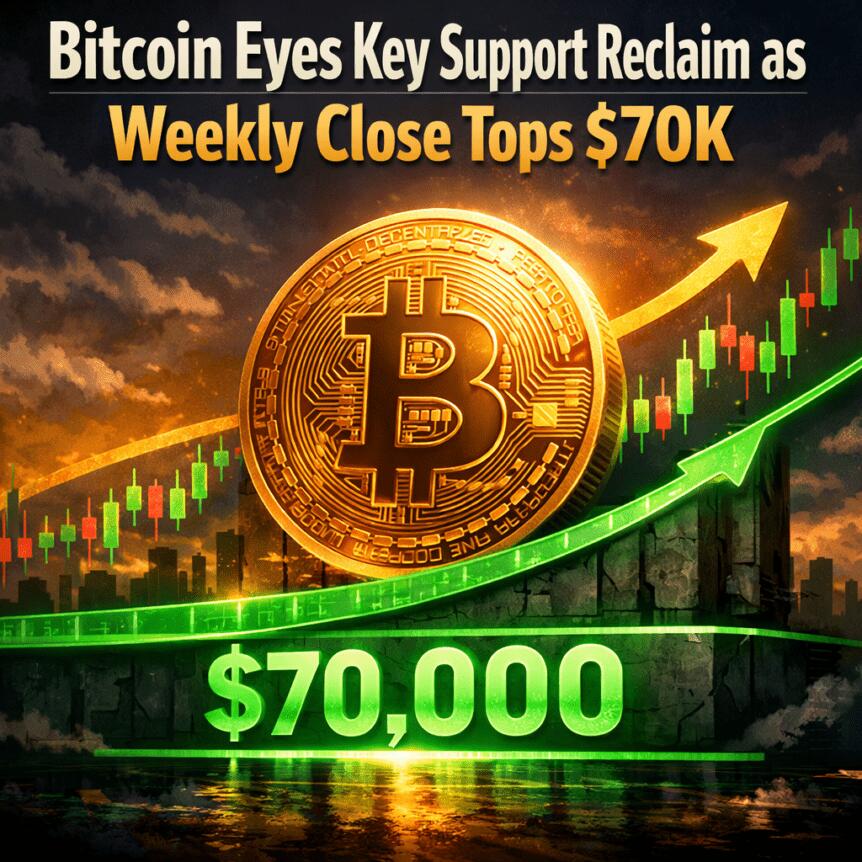
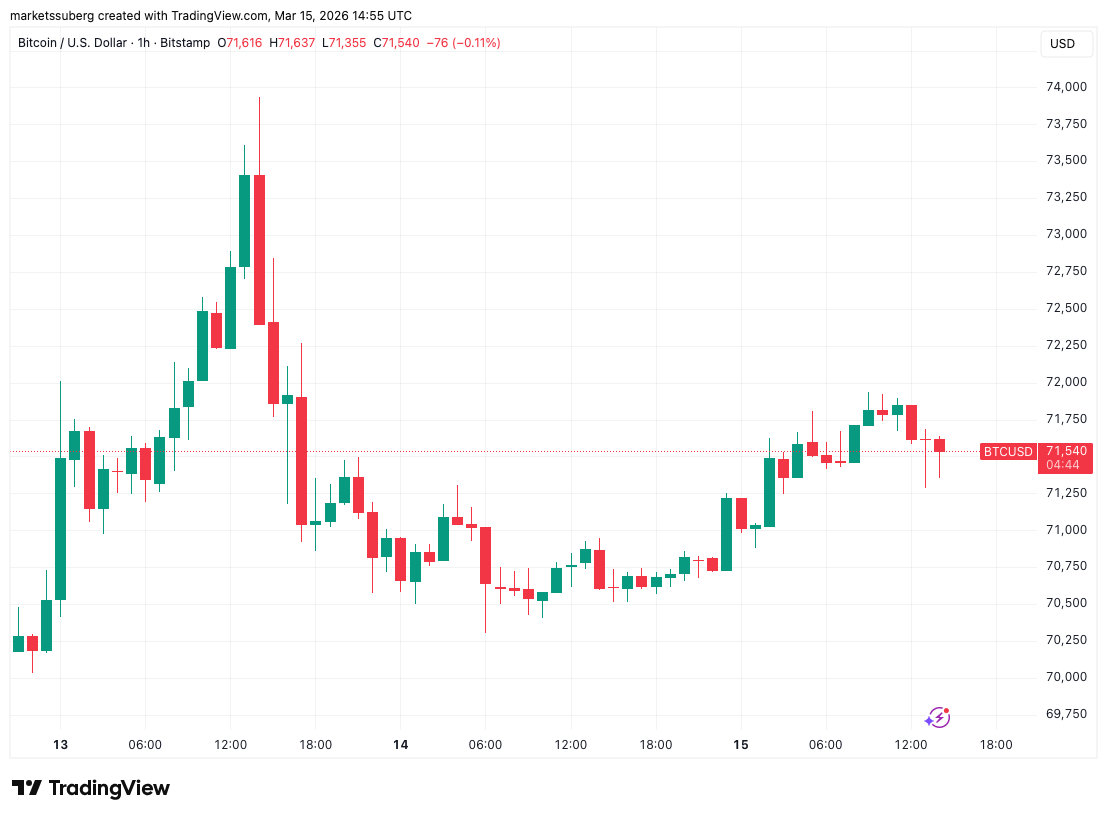
Bitcoin edged toward a pivotal weekly finish, with traders watching a potential close above the $70,000 mark that would also reclaim a critical long-term indicator. The setup sits at a crossroads as macro risk remains in play and buyers test a sequence of technical levels that have defined the market for months. A close above $70,000 would not only validate a momentum shift on the weekly chart but would also put the price back above a notable trendline that has guided price action for much of this cycle. The broader backdrop remains mixed, with oil hovering near the century mark and geopolitical tensions contributing to risk-off sentiment during parts of the session.
Bitcoin (BTC) inched higher on Sunday as bulls sought to seal a weekly close above $70,000. The Sunday move followed a week of choppy action and strategic positioning by market participants who are evaluating whether this level can establish a renewed leg higher. The weekly picture matters because it encompasses a longer time horizon, and a break above the level could signal renewed confidence among buyers who have watched multiple attempts to push past the zone fail to sustain momentum. On the charts, Bitcoin was flirting with a reset of momentum after testing highs near the $72,000 area intraday before retreating, a pattern that traders described as a necessary consolidation before another move higher.
Data viewed by traders show that BTC remained on track for a seventh consecutive green daily candle, setting up the potential for the best daily finish in over a week if bidding holds into the close. The price managed to stay above two critical guardrails on the weekly timeframe: the 200-week exponential moving average (EMA) and a level associated with the 2021 all-time high around $68,300, followed by the $69,400 mark. These zones have historically served as magnets for price, attracting buyers when the market swings back toward them after excursions toward local highs. A sustained hold above these levels would be interpreted by many analysts as a sign that the long-term support structure remains intact even in the face of short-term volatility.
Analysts highlighted that recent price corrections have reflected routine risk-off behavior rather than a shift in the longer-term narrative. In a recent analysis, Michaël van de Poppe noted that the market could see a minor pullback as CME gap closure activity picks up around the weekend, but he projected a continued grind toward the next major resistances in the $75,000–$80,000 area if the momentum persists. The reflection aligns with a price action pattern in which buyers defend key levels and push the market higher on renewed demand, even as profit-taking emerges at local highs.
“Markets are turning back upwards again, probably we’ll see a slight pullback later today for CME gap closing appetite, but other than that, I would assume we’ll continue to grind upwards to the resistances at $75-80K.”
In a separate acknowledgment of the intraday dynamics, van de Poppe had previously forecast that the price would revisit Friday’s CME close around $71,325, underscoring the notion that short-term moves may oscillate within a defined corridor before the next directional breakout. As of the current update, BTC had logged a weekly gain of more than 8%, with March performance hovering near a 6.7% increase, underscoring the persistence of buyers seeking to reassert control after a period of volatility. A chart overview from CoinGlass capturing weekly returns corroborates the broader narrative of a risk-on tilt within a cautious macro environment. CoinGlass data show the week-to-date strength in the asset, even as macro risk factors remain in flux.
Macro turmoil spoils Bitcoin “relief rally”
Beyond the price action, macro and geopolitical factors continued to shape trader sentiment. While some participants hoped for a relief rally in calmer macro conditions, the backdrop remained precarious. Oil markets provided a parallel narrative, with WTI crude oil flirting with the $100-per-barrel mark as traders weighed supply shocks and demand dynamics. The persistent tension between risk-on and risk-off impulses has left Bitcoin oscillating between cautious optimism and a more defensive posture as investors digest global developments and central bank trajectories.
Market watchers such as Kyle Doops emphasized that, on a mid-term horizon, Bitcoin appears to be trading within a defined band. He highlighted a mid-term trading range defined by a longer-term market mean near $78,400 and a realized price baseline around $54,400, suggesting that price action tends to revert toward these anchors after excursions toward the upper and lower boundaries. In his assessment, whenever Bitcoin edges above $70,000, sellers re-emerge to take profits rather than trigger panic selling, reinforcing the view that the market has become comfortable with orderly, measured gains rather than sharp, outsized moves. These observations align with the broader theme of a market that has found a measure of discipline even as headlines around energy markets and global tensions continue to dominate the narrative.
Why it matters
The ongoing test of the $70,000 threshold matters for several reasons. First, a weekly close above that level would bolster the case for a renewed longer-term uptrend by reclaiming a major psychological and technical barrier that has capped upside in recent months. It would also validate the relevance of the 200-week EMA as a benchmark for long-term support, potentially reducing the probability of a rapid retrace as market participants reassess risk posture. For traders, a sustained close above the level could translate into a more constructive setup for those eyeing a move toward the upper end of the historically significant resistance corridor in the low-to-mid $80,000s, while still considering the structural dynamics shaped by macro headwinds.
Second, the price action underscores the interplay between technical patterns and macro realities. Even as Bitcoin demonstrates resilience, macro catalysts—most notably commodity markets and geopolitical risk—continue to influence risk appetite. In this context, a constructive weekly close could act as a spark for renewed liquidity and ETF considerations, though investors must remain mindful of potential overhangs from policy signals and energy prices. The evolving macro environment suggests that the market could enter a phase where patience and disciplined risk management become as important as any immediate price target.
Finally, the narrative around price discovery remains tethered to disciplined risk-control behavior among market participants. The repeated observation of profit-taking at local highs indicates a maturation in market behavior, where investors are more deliberate about entries and exits rather than chasing sensational moves. In a landscape where macro risk remains persistent, the ability to navigate the timing of entries and exits will likely be as important as predicting the next directional move.
What to watch next
- Watch for a weekly close above $70,000 and whether the price can sustain a hold above the 200-week EMA on a weekly basis.
- Monitor CME-related dynamics near the closing price around $71,325 and any subsequent gap-closing activity.
- Observe price action toward the $75,000–$80,000 resistance zone if momentum persists beyond the weekly close.
- Keep an eye on macro catalysts, particularly oil prices hovering near $100 and any geopolitical developments that could affect risk sentiment.
Sources & verification
- TradingView price data for BTCUSD, including the weekly candle count and interactions with the 200-week EMA.
- Analyses and social posts from Michaël van de Poppe discussing CME gaps and potential resistance targets around $75,000–$80,000.
- Kyle Doops’s commentary on the mid-term trading range anchored by a long-term mean near $78,400 and a realized price around $54,400.
- CoinGlass weekly return data illustrating the ~8% weekly gain and March gains of ~6.7% for Bitcoin.
- The referenced chart perspectives and historical levels, including the 200-week EMA around $68,300 and the $69,400 level tied to the 2021 all-time high.
Bitcoin price action and near-term outlook
As the week unfolds, the market’s trajectory hinges on whether Bitcoin can cement a weekly close above the $70,000 threshold and maintain a foothold above the 200-week EMA. The combination of technical support at long-standing levels and the persistence of bullish momentum on the daily chart creates a scenario in which a breakout could invite further upside toward the next major resistance bands. Yet the price action has repeatedly shown that the move higher can be met with measured profit-taking, particularly around round-number levels and at pivotal intraday highs near the $72,000 territory. The balance between demand and supply will likely define the near-term trajectory as traders weigh macro risk against the potential for a sustained look at higher targets.
In sum, Bitcoin is navigating a window of opportunity that could shape the narrative for the coming weeks. A successful close above the critical levels would reinforce the case for a renewed bullish phase, while a failure to sustain gains could bring the market back into a rangebound mode that tests patience and risk management alike. The next few sessions will be telling as the market absorbs macro cues, on-chain signals, and traders’ evolving appetite for risk.
Bitcoin edged toward an important weekly close above $70,000 that would include a reclaim of an important 200-week trend line.
Bitcoin (BTC) inched higher on Sunday as bulls sought to seal a weekly close above $70,000.
Key points:
-
Bitcoin eyes its highest daily close in over a week with a fresh weekend push above $70,000.
-
Price offers a reclaim of a key support trend line on weekly time frames.
-
Sell-side pressure at local highs is “steady profit-taking,” analysis says.
BTC price attempts long-term support rescue
Data from TradingView showed out-of-hours price action topping out just below the $72,000 mark before cooling.

Now in line for its seventh consecutive green daily candle, BTC/USD eyed its highest daily close since March 4.
Along with $70,000, price also stayed above key long-term levels: the 200-week exponential moving average (EMA) and the old 2021 all-time high at $68,300 and $69,400, respectively.

“The recent correction on Friday on Bitcoin was essentially just risk-off appetite to not be having positions going into the weekend. Nothing else,” crypto trader Michaël van de Poppe wrote in his latest X analysis.
“Markets are turning back upwards again, probably we’ll see a slight pullback later today for CME gap closing appetite, but other than that, I would assume we’ll continue to grind upwards to the resistances at $75-80K.”

Van de Poppe correctly forecasted that the price would revisit Friday’s closing price of CME Group’s Bitcoin futures market at $71,325.
At the time of writing, BTC/USD was still up by more than 8% on the week, with March gains at 6.7%.

Macro turmoil spoils Bitcoin “relief rally”
Geopolitical risk, meanwhile, remained at the forefront of trader discussions.
Related: Bitcoin ‘passing geopolitical stress test’ as BTC price spikes above $72K
WTI crude oil ended the week attempting to repass $100 per barrel, with the global oil supply shock still playing out.

“If macro was calm, this sort of structure could easily turn into a relief rally. But with the current backdrop… downside risk still hasn’t really gone away,” crypto analysis host Kyle Doops commented on X last week.
Doops identified a mid-term trading range for Bitcoin that was bordered by two key boundaries: the true market mean at $78,400, and the aggregate realized price of the current supply at $54,400.
“Every time price pokes above $70K, sellers show up. Not panic selling… just steady profit-taking,” he summarized about lower time frames.

This article does not contain investment advice or recommendations. Every investment and trading move involves risk, and readers should conduct their own research when making a decision. While we strive to provide accurate and timely information, Cointelegraph does not guarantee the accuracy, completeness, or reliability of any information in this article. This article may contain forward-looking statements that are subject to risks and uncertainties. Cointelegraph will not be liable for any loss or damage arising from your reliance on this information.

TLDR
- Chief Financial Officer and COO Akash Palkhiwala divested $330,815 in QCOM shares on March 12, 2026, with sale prices spanning $131.03 to $134.70
- Shares have plummeted 23.6% year-to-date, currently sitting at $129.82, dangerously close to the 1-year bottom of $120.80
- Company insiders have collectively offloaded 45,501 shares valued at $7.78 million within the past 90 days
- Capitolis Liquid Global Markets slashed its QCOM stake by 54.4%, dumping 322,000 shares during Q3
- Wall Street consensus points to “Hold” with a $168.00 price objective, while Bank of America maintains “Underperform” at $145
Qualcomm’s Chief Financial Officer and Chief Operating Officer Akash Palkhiwala executed a stock sale totaling $330,815 on March 12, 2026. The divestiture occurred through a predetermined Rule 10b5-1 trading arrangement established on December 8, 2025.
The executive unloaded 2,530 shares with transaction prices between $131.03 and $134.70 per share. After completing these sales, Palkhiwala maintains direct ownership of 33,099 company shares.
With shares currently priced at $129.82, Palkhiwala’s exit came at a premium to today’s valuation. The semiconductor giant has experienced a brutal 23.6% decline year-to-date and trades precariously near its annual nadir of $120.80.
This transaction represents just one piece of a larger insider selling trend. Throughout the previous 90-day period, company insiders have collectively disposed of 45,501 QCOM shares totaling roughly $7.78 million in aggregate value.
Executive Vice President Ann Chaplin liquidated 7,180 shares last December at an average price of $178.03, trimming her holdings by 23%. EVP Heather Ace followed suit in February, selling 3,200 shares at $137.00 apiece, representing a 16% reduction in her ownership stake.
Company insiders collectively control a mere 0.05% of outstanding shares. Institutional investment firms command 74.35% of the equity.
Institutional Activity
Among institutional players, Capitolis Liquid Global Markets LLC dramatically reduced its QCOM exposure by 54.4% during Q3, disposing of 322,000 shares. The firm’s remaining 270,400-share position carried an approximate value of $44.98 million according to regulatory filings.
Several smaller funds made modest upward adjustments. Waypoint Wealth Counsel, Greykasell Wealth Strategies, Baron Wealth Management, Certified Advisory Corp, and Elser Financial Planning each accumulated between 61 and 63 additional shares throughout the identical quarter.
Qualcomm’s 50-day moving average stands at $149.54, while the 200-day moving average registers at $162.36. Current trading prices remain substantially beneath both technical benchmarks.
The chipmaker commands a market capitalization of $138.52 billion, trades at a price-to-earnings multiple of 26.82, and exhibits a beta coefficient of 1.25. The company’s debt-to-equity ratio measures 0.64.
Analyst Ratings
Wall Street sentiment remains divided. Bank of America launched coverage on March 10 with an “Underperform” designation and $145 price objective, pointing to decelerating earnings expansion compared to industry rivals and the expected departure of Apple as a customer.
Royal Bank of Canada reduced its price target from $180 down to $150 while maintaining a “Sector Perform” stance. Evercore lowered its projection from $157 to $134. Piper Sandler retained its “Overweight” recommendation with a $200 target. Wells Fargo elevated QCOM to “Equal Weight” from “Underweight,” simultaneously boosting its target to $150.
The aggregate rating from 24 Wall Street analysts stands at “Hold,” accompanied by a mean price target of $168.00.
Qualcomm unveiled Q1 2026 financial results on February 4, delivering earnings per share of $3.50 against analyst expectations of $3.38. Revenue reached $12.25 billion, surpassing the $12.16 billion consensus estimate and representing a 4.7% year-over-year increase.
Management provided Q2 2026 EPS guidance ranging from $2.45 to $2.65. The analyst community projects full-year EPS of $9.39.
Qualcomm announced a quarterly dividend distribution of $0.89 per share, scheduled for payment on March 26, 2026. The annualized dividend yield currently sits at 2.7%, with a payout ratio of 73.55%.

Key takeaways
-
The 2026 Iran conflict created a major geopolitical shock that triggered volatility across global markets. It pushed investors to reassess traditional safe-haven assets such as gold and emerging alternatives like Bitcoin.
-
Gold initially benefited from safe-haven demand but later declined as the US dollar strengthened and bond yields rose. This showed that macroeconomic forces can override crisis-driven buying.
-
Bitcoin experienced volatility but recovered quickly, reflecting its growing role as an alternative asset. However, its price movements remained closely tied to market sentiment and liquidity conditions.
-
The strength of the US dollar played a key role in shaping both gold and Bitcoin’s performance, as rising demand for dollar liquidity influenced global asset flows.
Throughout history, geopolitical conflicts and periods of political instability have consistently triggered shifts in financial markets. When geopolitical tensions escalate, investors often seek to safeguard their capital by reallocating into perceived safe-haven assets that are expected to hold or increase in value during uncertain periods.
Gold has long been the benchmark safe-haven asset, prized for its scarcity, universal acceptance and track record as a store of value. In recent years, however, the rise of Bitcoin (BTC) has prompted widespread debate. Could this decentralized digital currency eventually assume a comparable role as a modern, borderless alternative?
This article explains how Bitcoin and gold responded differently to the geopolitical shock of the Iran war. It analyzes their price movements, market behavior and safe-haven roles, and examines what this divergence reveals about investor sentiment, liquidity dynamics and the evolving debate between traditional and digital stores of value.
2026 Iran conflict: A major geopolitical shock that rattled global markets
The 2026 Iran conflict offered a high-profile, real-time case study to examine whether Bitcoin behaved like a safe-haven asset. The conflict sent shockwaves through financial markets worldwide. Escalating military actions and threats to close the Strait of Hormuz sparked fears of major disruptions to energy supplies. About 20% of the world’s oil is estimated to pass through this crucial waterway, making it highly important for global energy markets.

As tensions grew, oil prices rose sharply, and financial markets turned highly volatile. Stock indexes around the world declined as investors reevaluated risks related to inflation, supply chains and future economic growth.
In times of such uncertainty, investors typically turn to assets seen as reliable stores of value. On this occasion, however, the response across different asset classes was more complex than usual.
Gold’s mixed performance as a safe-haven asset
At first, gold reacted as expected during a geopolitical crisis. Demand increased as investors sought safety amid the uncertainty.
As the conflict worsened, gold prices climbed higher while traders shifted funds into traditional safe-haven assets.
However, the upward movement in gold did not last long. Gold prices later dropped significantly when the US dollar strengthened and US Treasury yields rose. These factors often make the precious metal less attractive since it pays no interest or dividends.
At one point, gold fell more than 1% even as tensions continued to escalate. This highlighted how broader economic pressures, such as changes in interest rates or currency strength, can sometimes override safe-haven buying in the short term.
Such swings demonstrated that even a long-established crisis hedge like gold can experience temporary ups and downs when investors focus on liquidity needs or react to shifts in macroeconomic conditions.

Why investors sometimes sell gold during crises
One notable aspect of the recent Iran conflict shock was that investors temporarily sold off gold along with other assets. During periods of of extreme market uncertainty and panic, investors tend to prioritize raising cash urgently rather than holding commodities or securities.
During the early phase of the conflict, the surge in demand for US dollars and overall liquidity temporarily surpassed the appeal of gold as a safe haven. Moreover, soaring oil prices fueled inflation concerns, which drove bond yields higher and added further downward pressure on gold prices.
This pattern highlights a key insight. Gold has historically been viewed as a long-term hedge against geopolitical instability and economic turmoil. However, in the initial stages of a crisis, investors frequently favor immediate cash and liquidity to manage risks, margin calls or portfolio adjustments.
Did you know? The US holds the largest gold reserves in the world, about 8,133 metric tons. This accounts for roughly 78% of its official foreign reserves, highlighting how deeply gold remains embedded in the global monetary system.
Bitcoin’s reaction to the crisis: Volatile yet resilient
Bitcoin responded differently from gold during the conflict. In the opening phase of the geopolitical escalation, cryptocurrencies experienced sharp volatility as traders broadly reduced risk exposure and de-risked their portfolios.
That said, Bitcoin recovered after the initial volatility. Feb. 28, 2026, when the war began, Bitcoin reached a low of $63,106. By March 5, 2026, it had rebounded to $73,156 and then followed a steady trajectory to $71,226 by March 10, 2026.
Bitcoin’s price path signals renewed investor interest in alternative hedges against economic and geopolitical instability. Historically, Bitcoin’s price action has remained closely linked to overall market sentiment and prevailing liquidity conditions rather than being driven solely by geopolitical risks.
Did you know? Central banks around the world collectively hold around 36,000 metric tons of gold in their reserves, making it one of the most important reserve assets after the US dollar.
The role of US dollar strength
A key factor affecting both assets was the performance of the US dollar during the conflict. As investors scrambled for liquidity and perceived stability, the dollar strengthened significantly. Since gold is priced in dollars on global markets, a rising dollar generally exerts downward pressure on gold prices by making it more expensive for holders of other currencies.
Bitcoin is also sensitive to dollar dynamics. When capital flows toward traditional safe havens such as cash and reserve currencies during periods of uncertainty, demand for cryptocurrencies can soften temporarily, contributing to price weakness.
These interconnected factors, including dollar strength, liquidity preferences and risk-off sentiment, help explain the performance of gold and Bitcoin in this scenario. They also clarify why neither gold nor Bitcoin delivered a clean, sustained safe-haven rally during the initial phase of the conflict, despite their differing long-term characteristics.
Oil and inflation fears drove much of the market response
Energy markets were a dominant force shaping investor behavior during the conflict. The escalation drove oil prices higher, fueled by concerns over potential disruptions to shipping through the Strait of Hormuz. Any significant interruption in this critical chokepoint can elevate global energy and transportation costs, feeding into broader inflation pressures worldwide.
While inflation expectations tend to support gold over the longer term as a classic inflation hedge, they can produce the opposite effect in the short term. Rising inflation fears often prompt central banks or markets to anticipate tighter monetary policy, pushing interest rates and bond yields higher. Higher yields make interest-bearing assets more competitive relative to non-yielding commodities such as gold, creating downward pressure on gold prices in the near term.
Bitcoin’s link to inflation expectations is far less consistent. Bitcoin is generally viewed as a high-beta asset rather than a mature inflation hedge. As a result, its response to inflation signals tends to be more erratic and influenced by prevailing risk sentiment.
Did you know? Gold’s role as a safe-haven asset became especially visible during financial crises such as the Great Depression, when governments restricted private gold ownership to control capital flows and stabilize monetary systems.
What the divergence reveals about safe-haven status
The Iran conflict highlighted a fundamental difference between established and emerging safe-haven assets.
Gold is deeply embedded in the global financial and monetary architecture. Its centuries-long history, widespread accumulation by central banks and enduring role as a reserve asset provide strong credibility and trust during periods of geopolitical or economic stress.
Bitcoin, on the other hand, exists within a comparatively young and evolving digital financial ecosystem. Its price movements are shaped not only by geopolitical events but also by factors such as network adoption, regulatory developments, technological milestones and overall investor risk appetite across traditional and crypto markets.
This structural difference helps explain why Bitcoin and gold show distinct responses during the early stages of a crisis.
A real-world test of the “digital gold” narrative
For years, Bitcoin advocates have positioned it as “digital gold,” referring to a modern, decentralized alternative to the traditional safe-haven asset. The Iran conflict offered a real-world test of this claim.
While Bitcoin showed resilience during the war, its behavior diverged from that of a classic safe-haven instrument. Gold’s price action, however, remained anchored in familiar macroeconomic drivers such as dollar strength, inflation expectations and bond yield movements. Bitcoin’s volatility and recovery were shaped more by shifting investor sentiment, risk appetite and prevailing liquidity dynamics across broader markets.
This episode indicates that Bitcoin, while demonstrating growing credibility as a store of value under pressure, has not yet fully matured into a consistent safe-haven asset. Instead, it continues to evolve as a hybrid asset within the global financial system.
Cointelegraph maintains full editorial independence. The selection, commissioning and publication of Features and Magazine content are not influenced by advertisers, partners or commercial relationships.
Crypto World
Remittix Has Real Utility As Dogecoin & Pepe Traders Snap Up $RTX Tokens As Presale Set To End

Capital rotation is becoming increasingly visible across the meme coin sector as traders reassess where the next major opportunities may emerge. Dogecoin remains far below its 2021 peak, still trading near the $0.09 level after losing more than 75% of its all-time high value. Pepe is facing similar pressure, with recent market activity highlighting that PEPE continues to trade deep below its previous highs as sentiment across meme tokens cools.
As volatility continues to shake confidence in purely momentum-driven assets, many investors are beginning to look toward projects built around real-world utility. One project drawing increasing attention is Remittix, whose RTX token is currently in the final stage of its presale. With a live PayFi platform targeting the $50 billion global remittance fee market and only $6 million remaining in the current allocation, the shift in investor focus is becoming more noticeable. Here’s how Dogecoin, Pepe, and Remittix currently compare as the market narrative begins to evolve.

Dogecoin: Bearish Structure Despite Whale Accumulation
The Dogecoin price opened 2026 around $0.118 and has since fallen to about $0.095 in an extended downtrend that began after DOGE failed to get back above $0.25 in early 2025. Technical indicators are still bearish. 19 of 28 signals are flashing red and the Fear and Greed Index for Dogecoin price movement is at 18.
There are counterpoints. Whales purchased 1.7 billion DOGE worth $285 million in early March, and analyst Javon Marks has identified a bullish reversal on the monthly chart with targets as high as $1.25. The beta launch of X Money on Elon Musk’s platform also briefly lifted the Dogecoin price. But sustained momentum has not followed.
Dogecoin price predictions range from $0.10 to $0.19 and these are conservative scenarios offering limited upside for traders accustomed to parabolic rallies. That tepid outlook is one reason former DOGE holders now buy RTX tokens instead.
Pepe News: Liquidity Drains as the Meme Fades
The news about Pepe just now proves what many dreaded. PEPE is trading at approximately $0.0000033 which is lower as compared to its highest point of $0.0000280. The market cap has been shrinking to $1.4 billion and 22 out of 30 technical indicators are bearish. Liquidity has been meager with reserved spirit extending to Q4 2025.
Optimistic Pepe news entails long term projections. Changelly is projecting a recovery to $0.0000098 by December 2026 should the conditions improve. CoinPedia expects to get between $0.0000037 and $0.0000073 this year.
But without utility or a revenue model, PEPE remains dependent on social media cycles. That fragility is why Pepe news headlines mention capital rotation into utility tokens and why traders are instead buying RTX tokens as a hedge against meme fatigue.
Remittix: The Utility Play Drawing Meme Coin Profits
While meme-coin speculation continues to dominate social feeds, a growing number of traders are quietly reallocating profits into projects with clearer utility. That shift has become particularly visible among Dogecoin and Pepe holders, many of whom are now accumulating Remittix as the project’s presale moves toward its closing phase.
The interest is not purely speculative. Remittix is positioning itself within the rapidly emerging PayFi sector, focusing on infrastructure that allows cryptocurrencies to interact more seamlessly with traditional financial systems. Instead of relying on hype cycles, the platform is designed to enable direct crypto-to-fiat settlement, a function that addresses one of the most persistent frictions in digital asset adoption.
Five Core Remittix features explain why:
- Crypto-to-Fiat Bridge Across 30+ Currencies. Users send payments in over 100 cryptocurrencies and recipients receive local bank deposits with same-day processing.
- CertiK Grade A Security. Remittix ranks number one among pre-launch tokens on CertiK Skynet with full team verification.
- Zero Foreign-Exchange Fees. A flat-rate model eliminates the hidden charges that traditional remittance providers depend on.
- Staking Yields Up to 18% APY. No buy or sell tax on RTX, zero vesting for presale buyers, and tiered staking from 4% to 18%.
- Confirmed Exchange Listings. BitMart and LBank are locked in, with a third major listing expected at the $30 million milestone.
For traders watching the Dogecoin price stagnate and reading Pepe news about contracting liquidity, the chance to buy RTX tokens represents a fundamentally different proposition.
Remittix Opportunity: Where DOGE and PEPE Stand Today
Analysts have expressed optimism that Dogecoin price may recover if whale accumulation translates into buying pressure, and positive Pepe news could surface if meme sentiment cycles back. But neither asset offers the structural utility that investors increasingly demand.
Investors currently buying RTX tokens are betting on a different thesis: that a working payments platform with audited security and confirmed listings will outperform speculation over the medium term. With the presale in its final stage, a limited-time 15% affiliate bonus paid in USDT and claimable every 24 hours, gives participants an additional reason to act before the window closes.
Discover the future of PayFi with Remittix by checking out their project here:
Website: https://remittix.io/
Socials: https://linktr.ee/remittix
Disclaimer: This is a Press Release provided by a third party who is responsible for the content. Please conduct your own research before taking any action based on the content.

Bitcoin could eventually reach $1 million per coin if it captures a larger share of the global store-of-value market currently dominated by gold and government bonds, according to Bitwise Asset Management CIO Matt Hougan.
In a report earlier this week, Hougan said bitcoin’s long-term upside depends less on short-term market cycles and more on how much of the world’s wealth preservation market the cryptocurrency absorbs over time.
“One million sounds crazy,” said Hougan. “It implies bitcoin will rise 14x from today’s price.”
He pointed to several factors supporting that forecast, among them the rapid growth of the global store-of-value market, including gold, government bonds and other defensive assets, which has expanded from roughly $2.5 trillion in 2004 to nearly $40 trillion today. Bitcoin currently represents only about 4% of that market by value.
If the largest cryptocurrency were to capture roughly half of that market under current conditions, its price could approach that $1 million mark within roughly a decade, Hougan said. If the broader store-of-value market continues expanding, bitcoin would require a smaller share to reach that level.
The $1 million price fixation
The $1 million forecast has become a recurring theme across the crypto industry. President Donald Trump’s son Eric recently doubled down on his $1 million BTC call. In August, Coinbase CEO Brian Armstrong said bitcoin could reach that price by 2030.
Jack Dorsey, who ran X (formerly Twitter) until 2021 and co-founded payments firm Block (formerly Square), said bitcoin could reach $1 million in five years. Arthur Hayes, former BitMEX CEO, believes it could come as soon as 2028. Cathie Wood’s Ark Invest projected that bitcoin could reach $3.8 million by the end of the decade. Bernstein in 2024 forecast $1 million by 2033.
So why has the $1 million target become such a widely cited benchmark for bitcoin? CoinDesk asked several market analysts.
“It’s a clean headline and shorthand for the idea that Bitcoin could rival gold as a store of value. The exact number matters less than the share of global wealth Bitcoin captures,” said Mati Greenspan, market analyst and Quantum Economics founder.
For Jason Fernandes, also a market analyst and an AdLunam co-founder, the milestone is more psychological than a precise valuation target, reflecting the belief that bitcoin could ultimately win the store-of-value debate.
However, he also believes part of the narrative is driven by marketing dynamics. “Some of the narrative is promotional because round numbers travel well and align with holder incentives,” Fernandes said, though he added that the underlying thesis is not purely hype.
“I think many investors make a ‘static denominator’ mistake, valuing bitcoin against today’s store-of-value market instead of a much larger future one,” he said.
For Fernandes, the real question is not whether $1 million bitcoin is theoretically possible, but whether institutional adoption compounds long enough to justify that price.
Analysts agree on direction, but not the timeline
Some of the analysts who shared their comments with CoinDesk said Hougan’s projection is plausible over the long term, though most frame it as a decade-scale adoption story rather than a near-term forecast.
“Geopolitical tension strengthens the Bitcoin thesis,” said Greenspan. “In uncertain times, investors look for neutral stores of value, and Bitcoin increasingly sits in that bucket alongside gold.”
Greenspan said the milestone is possible but would likely take a decade or more, requiring continued institutional adoption and broader regulatory clarity.
Fernandes said Hougan’s argument is essentially a market-share thesis. Bitcoin does not need to replace gold outright, he said; it only needs to capture a portion of a growing global store-of-value market.
“A $1 million bitcoin assumes long-term adoption and market-share gains within the global store-of-value market,” Fernandes said. “It’s a thesis about bitcoin’s end state if it matures into a major global monetary asset.”
Institutional adoption remains the key driver
Hougan has argued that bitcoin’s fixed supply of 21 million coins and its decentralized network give it characteristics similar to those of traditional stores of value, such as gold.
Fernandes said the long-term $1 million thesis depends largely on continued institutional adoption and growth in the global store-of-value market.
“BTC doesn’t need to replace gold or fiat; it only needs to capture about 17% of a projected $121 trillion store-of-value market over the next decade to justify a $1 million price,” Fernandes said.
Greenspan said geopolitical uncertainty could further strengthen bitcoin’s appeal as a neutral asset.
“In uncertain times, investors look for neutral stores of value, and bitcoin increasingly sits in that bucket alongside gold,” he said, though he added that reaching such a valuation would likely take years of sustained adoption.
Nima Beni, founder of Bitlease, said the timeline could accelerate if confidence in traditional financial assets weakens.
“Bitcoin reaches $1 million when confidence in traditional ‘safe’ assets breaks,” he said, pointing to potential sovereign debt crises or disruptions in the gold market as possible catalysts.
Despite the bullish projections, analysts said bitcoin’s path toward such valuations would depend more on long-term adoption and macroeconomic conditions than on short-term market cycles.

New forensic findings from the phone of crypto lobbyist Mauricio Novelli have revealed a draft document suggesting a possible $5 million agreement connected to Argentine President Javier Milei’s promotion of the Libra token, according to local media reports.
The document, recovered from Novelli’s iPhone during a judicial investigation into the Libra crypto scandal, outlines a three-part payment structure totaling $5 million. Screenshots of the note surfaced after expert materials held by prosecutor Eduardo Taiano since November were made public, Argentine outlet El Destape reported.
The draft note was reportedly written in English on Feb. 11, 2025, just three days before Milei posted about the Libra token on X. “Hello friends, this is the final agreement discussed with H,” the text begins, which is believed to refer to crypto entrepreneur Hayden Davis.
The document then details the payment structure. “$1.5M of liquid tokens or cash as an advance. $1.5M in liquid tokens or cash = Milei announces on Twitter that his advisor is Hayden Davis/Kelsier/the Davis family. $2M in tokens or cash = contract signed in person with Milei for blockchain/AI consulting for the Argentine government and/or Javier Milei and review with Javier and Karina,” the text reads.

Notably, the draft note does not specify who would receive the funds.
Related: Argentina turns up the heat in Libra scandal with sweeping asset freeze
Another note outlines crisis message after scandal
Investigators also recovered a separate note drafted on Feb. 16, 2025, two days after the Libra controversy erupted online. The message appears to outline a public statement intended to calm the situation.
“This is what I want for the tweet. This is the only thing that saves him, me, and us,” the note’s translation from Spanish reads. The draft message then states support for the Libra project while denying any financial involvement and attributing accusations of wrongdoing to political opponents.
Authorities believe the message may have been prepared for Milei to post on social media or reference in an interview, according to local media reports.
Novelli was in Dallas during the token’s launch. Call records show he communicated with Milei and his sister Karina shortly before and after the president’s social media post about the token. As the controversy spread online, Novelli also held multiple calls with presidential adviser Santiago Caputo while the government managed the crisis.
Related: Argentine exchange Ripio bets on peso stablecoins amid cautious 2026 outlook
Libra hit $4 billion after Milei post before crashing
In February last year, Milei posted on X about the Libra (LIBRA) memecoin, which briefly reached a $4 billion market capitalization before plunging 94% within hours.
The crash wiped out hundreds of millions in investor funds and prompted opposition lawmakers to call for Milei’s impeachment. Milei later said he had merely “spread the word” about the token rather than promoted it.
Magazine: 2026 is the year of pragmatic privacy in crypto — Canton, Zcash and more

Premiership Women’s Rugby: Gloucester-Hartpury top table after 22-17 win at Saracens
Europe’s top 10 funding rounds this week (9 -15 March)

Niki wants to be rich – Kids story about how to help mom and earn money


-
 Tech4 days ago
A 1,300-Pound NASA Spacecraft To Re-Enter Earth’s Atmosphere
-
 Crypto World1 day ago
HYPE Token Enters Net Deflation as HyperCore Buybacks Outpace Staking Rewards
-

 News Videos6 days ago
10th Algebra | Financial Planning | Question Bank Solution | Board Exam 2026
-

 Business5 days ago
ExxonMobil seeks to move corporate registration from New Jersey to Texas
-

 Crypto World6 days ago
Paradigm, a16z, Winklevoss Capital, Balaji Srinivasan among investors in ZODL
-

 Fashion2 days ago
Weekend Open Thread: Addict Lip Glow
-

 Tech5 days ago
ChatGPT will now generate interactive visuals to help you with math and science concepts
-
Sports1 day ago
Why Duke and Michigan Are Dead Even Entering Selection Sunday
-

 NewsBeat4 days ago
Residents reaction as Shildon murder probe enters second day
-

 Business7 days ago
Search for Nancy Guthrie Enters 37th Day as FBI Probes Wi-Fi Jammer Theory
-

 Business4 days ago
Search Enters Sixth Week With New Leads in Tucson Abduction Case
-
 NewsBeat6 days ago
Pagazzi Lighting enters administration as 70 jobs lost and 11 stores close across Scotland
-

 Tech6 days ago
Despite challenges, Ireland sixth in EU for board gender diversity
-

 Business1 day ago
US Airports Launch Donation Drives for Unpaid TSA Workers as Partial Government Shutdown Enters Fifth Week
-

 NewsBeat4 days ago
I Entered The Manosphere. Nothing Could Prepare Me For What I Found.
-
Crypto World22 hours ago
Coinbase and Bybit in Investment Talks: Could Bybit Finally Enter the US Crypto Market?
-

 Business6 days ago
Search Enters 39th Day with FBI Tip Line Developments and No Major Breakthroughs
-

 Sports6 days ago
Skateboarding World Championships: Britain’s Sky Brown wins park gold
-

 Business1 day ago
Country star Brantley Gilbert enters growing non-alcoholic beer market
-

 Crypto World5 days ago
Will Chainlink price reclaim $10 amid volatility squeeze?

