
Crypto World
Securitize falls 16% after earnings miss, tokenization revenue drops



Securitize shares fell 16% from Wednesday’s close after the tokenization platform’s $14.4 million second-quarter revenue missed Wall Street estimates.


RedotPay’s ambition to list in the United States appears to be running into a slowdown, according to a report from Bloomberg. The stablecoin payments company is said to have delayed plans for a US initial public offering (IPO) as it navigates regulatory steps and ongoing legal disputes tied to Binance.
While Bloomberg reported the postponement, a RedotPay representative told Cointelegraph that the company is not discussing IPO timing. Instead, the spokesperson pointed to RedotPay’s recent progress in the US, stating the firm obtained a money transmitter license this week and is preparing to launch its product in the country.
Key takeaways
-
Bloomberg reports RedotPay has delayed its planned US IPO while it seeks regulatory approvals and deals with legal pressure involving Binance.
-
RedotPay did not comment on IPO timing to Cointelegraph, but said it recently secured a US money transmitter license.
-
Legal claims at the center of the delay include a lawsuit reportedly seeking nearly $473 million filed by Binance affiliates.
-
RedotPay’s IPO plans were previously flagged earlier this year, including reports of discussions with major investment banks.
IPO plans pushed back amid US expansion
According to Bloomberg, RedotPay has put its US IPO timeline on hold as it works through regulatory requirements. The report cites people familiar with the matter and frames the delay as part of broader preparations to expand into the US market.
RedotPay’s position, as conveyed to Cointelegraph, shifts the emphasis toward product rollout rather than capital markets timing. The company representative said RedotPay obtained a money transmitter license in the United States this week and is preparing to launch its stablecoin payments offering there.
For investors and market watchers, the sequencing matters. Stablecoin-focused payment businesses typically depend on licenses and regulator-by-regulator permissions to operate at scale, which can complicate an IPO process when litigation and approvals are both active.
From early-year IPO chatter to banking discussions
RedotPay’s US public-market ambitions first surfaced in February, when reports suggested the company was considering a listing in New York. At the time, RedotPay was described as working toward a potential IPO that could draw significant capital, with prior reporting indicating involvement from major firms including JPMorgan Chase, Goldman Sachs, and Jefferies Financial Group.
Those earlier reports also pointed to a target valuation above $4 billion and discussions that could have raised more than $1 billion, alongside other organizational changes. In March, Cointelegraph reported that RedotPay was seeking to raise up to $150 million amid internal restructuring and preparations for a potential IPO.
While IPO timing can change quickly in fast-moving sectors, the more recent US licensing step suggests the company is concentrating on operational readiness. That could be consistent with a broader trend in crypto-adjacent businesses: demonstrating licensed activity and compliance footing before pursuing the added scrutiny that comes with public listing.
Binance litigation adds legal and operational uncertainty
A major factor in the IPO delay narrative is the legal dispute involving Binance affiliates. Earlier in August, Binance affiliates reportedly sued RedotPay’s founders in Hong Kong seeking nearly $473 million in damages. The allegations claim the founders used confidential information obtained through their prior involvement with Binance to build a competing payments business and to redirect Binance users toward RedotPay.
RedotPay has denied the accusations. In correspondence with Cointelegraph, the company said it would “vigorously defend all claims.” That stance is important for assessing how persistent the dispute may be: even if the company believes it will win, the existence of a large claim can affect how comfortable underwriters and regulators feel about moving forward with an IPO during the dispute’s active stage.
The conflict has also extended beyond Hong Kong. Cointelegraph previously reported that the disagreement spilled into Singapore, where Binance and RedotPay differ on the status of a related case. RedotPay told Cointelegraph this week that it expected Binance to discontinue that matter, while Binance rejected RedotPay’s characterization and said its claims remain active.
Taken together, the litigation timeline and regional spread underline why RedotPay might prefer to focus on licensing milestones and product execution while legal outcomes remain uncertain.
What to watch next
As RedotPay pushes toward a US launch after receiving a money transmitter license, the next developments that may shape both operations and any future IPO timetable are regulatory milestones tied to its expansion and the trajectory of the Binance affiliate lawsuits. For now, the company’s public-market plans appear to be on pause, with attention shifting to compliance and execution in the US.

Solana is moving toward a significant shift in how it prices and allocates blockspace. A new Solana Improvement Document, SIMD-0553, would replace the network’s current approach—where transaction fees are not tightly linked to how many computing resources a transaction consumes—with a model that charges according to requested resources and burns the resulting fees in SOL.
The proposal entered Solana’s onchain governance process in early August and passed the initial support stage on August 4. It is now in the support-and-discussion phase, which typically runs for seven epochs (about two weeks). If it clears the process, it could reshape incentives for both developers and high-frequency users by making inefficient transaction behavior more expensive.
Key takeaways
- SIMD-0553 would tie fees more closely to requested compute, so transactions that use far more resources would pay more than lightweight ones.
- Instead of sending the resource fee to validators, the proposal directs it to a SOL burn, removing tokens from circulation.
- Core Solana devs and application teams would have stronger financial incentives to optimize performance and reduce resource waste.
- Some high-volume trading and bot activity is expected to face substantially higher costs under the terminal fee model.
- Higher burn projections could, in theory, move SOL toward deflation—but only if network activity grows enough to outweigh daily issuance.
Charging for compute, not just sending transactions
At the center of SIMD-0553 is a critique of Solana’s current fee structure: according to Cavey, a researcher at Solana infrastructure firm Temporal and author of the proposal, the cost users pay does not reflect the underlying compute differences between transactions. In his explanation, submitting a transaction that does minimal work can cost the same as one that consumes a large amount of CPU cycles.
Under the proposed model, resource fees would be set according to the resources a transaction requests rather than a flat baseline. Cavey argues this would give developers a clear reason to optimize, because wasteful behavior would no longer be subsidized by the network’s simpler fee mechanics.
“By installing this resource pricing right now, suddenly app developers have to optimize,” Cavey said, in the context of how poorly specified incentives can persist when inefficient and efficient transactions cost the same.
For end users, the change is intended to be beneficial indirectly: applications that reduce their compute consumption could pass on lower costs, improving user experience and potentially expanding what apps can afford to run.
Impact on arbitrage and high-frequency trading
A major focus of the proposal is computationally wasteful arbitrage. Cavey points to a pattern where searchers submit large volumes of transactions that largely fail—effectively consuming resources while capturing only limited successful outcomes—yet pay relatively low fees under current pricing.
He cites activity from the prior 30 days involving the traders with the highest failure rates: five accounts allegedly submitted 11.5 million transactions, consuming 929 million compute units across 2,477 trades that generated $16,091 in profit, while paying just 78 SOL in fees.
SIMD-0553 is designed to alter that equation. By increasing the cost of failed or inefficient attempts in proportion to requested resources, it would push arbitrage strategies toward more accurate and responsive behavior rather than brute-force submission.
Temporal’s modeling, as described alongside the proposal, suggests certain areas of onchain activity could become cheaper: stablecoin and token transfers could drop by about 20%, vote transactions by around 12.3%, and oracle updates by roughly 16.9% under the proposed fee model.
However, the same analysis implies a clear trade-off: some swaps—especially when routed through specific venues and prioritized differently—could become more expensive. Temporal estimates include a high-priority swap routed through DFlow costing 9.72% more, a mid-priority OKX swap costing 301% more, and a pump.fun swap with zero priority costing 3150% more. Cavey’s broader framing is that the base could remain low in absolute dollar terms for the most compute-intensive transactions, but the relative change for certain active strategies would be dramatic.
That is also why the proposal rejects a uniform increase to Solana’s existing 5,000-lamport fee, according to the article’s description: the uniform approach, Cavey argues, would likely penalize high-volume senders such as market makers while still failing to accurately price resource consumption.
Burn mechanics and the deflation debate
Beyond cost calculation, SIMD-0553 aims to change what happens to the fees. Rather than routing the resource fee to validators, the proposal would burn those fees—meaning SOL would be removed from circulation.
The article notes that the current daily burn is around 648 SOL, and that the terminal fee rate in SIMD-0553 could raise burn to roughly 7,500 to 9,000 SOL per day if resource demand stays roughly the same. That would represent an estimated 12 to 14 times increase in burn compared with current levels.
Cavey argues the effect could eventually make SOL deflationary, though he frames it as conditional on network success and continued growth in activity. As the article points out, Solana currently issues about 60,000 SOL per day, so even a 9,000 SOL daily burn would not, by itself, make the token deflationary. A separate improvement document, SIMD-0550, is described as targeting faster curbing of inflation already scheduled.
Importantly, the proposal’s burn incentive is also intended to reduce motivations to generate unnecessary resource-heavy transactions, aligning economic behavior with the network’s performance goals.
Still, not all contributors agree on the balance between validator revenue and token burn. One contributor, bji, reportedly argues against “more burn” as a goal and questions whether validator income should be reduced arbitrarily, reflecting a wider tension in fee-market design: funding network operations while maintaining supply dynamics.
Concerns about fairness, usability, and system complexity
Some of the debate around SIMD-0553 centers on a technical fairness question: should fees be based on how many resources a transaction requests or on how much it actually uses?
Contributor mschneider raises that it might feel more natural to charge based on units used. Cavey’s response, as presented in the article, is that charging based on requested resources provides upfront cost visibility for users and lets validators verify they can afford the fee before execution. At the same time, the model creates incentives for developers to estimate their resource needs accurately, reducing the risk of overpaying for unused compute.
The proposal would also introduce new operational and user-facing considerations. Some contributors worry that a new fee model could make Solana harder to use. Cavey argues that most users won’t need to calculate fees directly because exchanges and applications typically handle fee calculation and routing. He also suggests automated traders are sophisticated enough to adapt to fee-structure changes.
On validator economics, the article describes an estimated initial reduction to base-fee revenue of around 4%. Cavey says parameters could be adjusted to offset that impact if needed, but the disagreement remains unresolved for participants who prioritize validator income over additional burn.
As Solana moves deeper into the governance timeline, the key question for token holders and ecosystem participants is how those trade-offs resolve: whether the community converges on parameters that achieve stronger resource alignment without introducing unacceptable complexity or unintended pressure on critical market infrastructure.


Strategy has pushed back against MSCI’s proposed methodology for identifying “non-operating companies,” which could result in the largest bitcoin treasury company being removed from the index provider’s global equity indexes.
Strategy said on X, “Digital assets are assets. Index providers should measure markets, not decide which assets companies are allowed to own,” Strategy said. “MSCI’s proposal puts it out of step with regulators, markets, and its own customers. Bitcoin doesn’t need MSCI. Neither does Strategy.”
The latest consultation replaces an earlier proposal focused specifically on companies with significant digital asset holdings. Applying the new financial-ratio screen using May 2026 data would have resulted in the removal of Strategy, Metaplanet and uranium holder Yellow Cake from the MSCI ACWI IMI.
The response follows Strategy’s formal objection in December 2025 to MSCI’s previous proposal, which would have excluded companies whose digital assets represented at least 50% of total assets.
Strategy argued at the time that it is an operating company, not an investment fund or passive bitcoin vehicle, pointing to its software business, active treasury operations and bitcoin-backed credit instruments. It described the 50% threshold as arbitrary and urged MSCI to maintain neutral index standards.
MSTR is lower by 4.3% on Friday as bitcoin dips to $62,600.
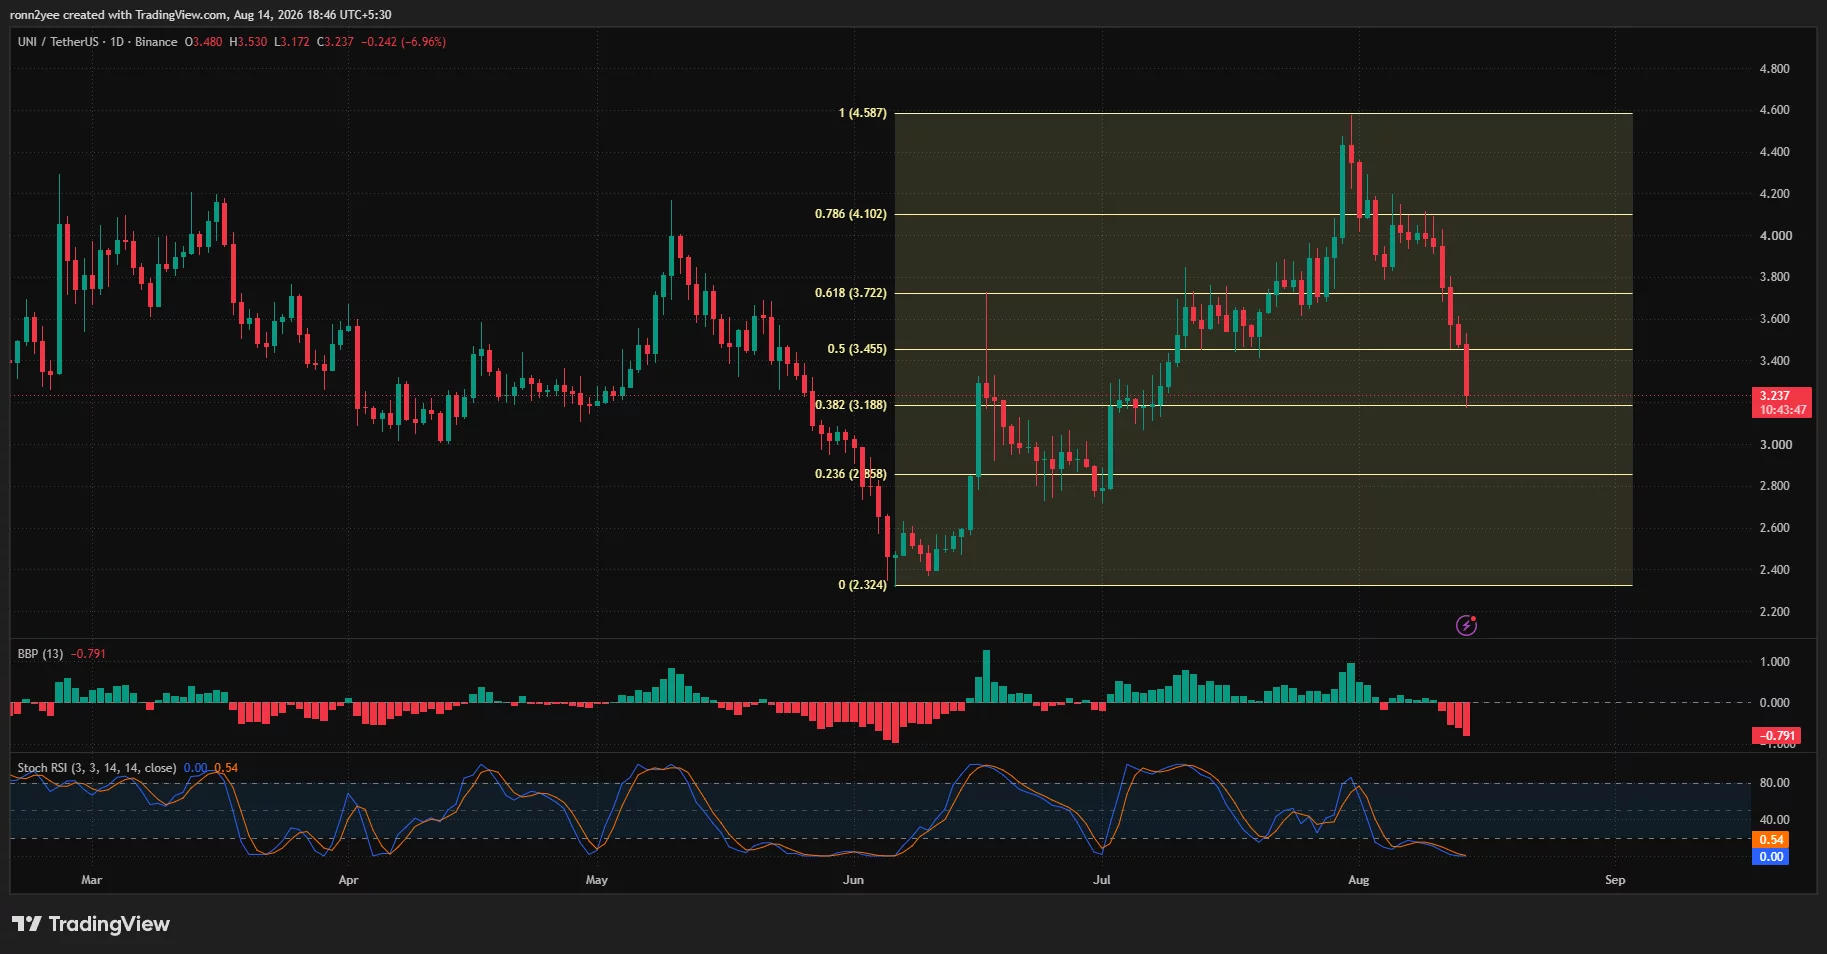
Uniswap price has fallen nearly 20% over the past seven days to $3.23 as a head-and-shoulders breakdown, weak capital flows, and cascading long liquidations intensified selling pressure.
Summary
- Uniswap price has dropped nearly 20% in seven days and traded around $3.23 on Aug. 14.
- The daily price has returned to the 38.2% Fibonacci retracement at $3.19.
- 4-hour Aroon and Chaikin Money Flow readings show sellers remain firmly in control.
- Liquidation clusters between $3.45 and $3.65 could limit any short-term recovery.
Uniswap price extends its breakdown toward $3.20
According to data from crypto.news, Uniswap (UNI) price fell as low as $3.17 on Aug. 14 before recovering slightly to $3.23. The token was down almost 7% on the daily candle and nearly 20% over seven days, extending a decline that began after its early-August peak near $4.59.
The daily chart shows UNI giving back most of the rally that started from the June 11 low of $2.32. Sellers pushed the token below the 78.6%, 61.8%, and 50% Fibonacci retracement levels at $4.10, $3.72, and $3.46, respectively.
UNI is now testing the 38.2% retracement at $3.19. The level carries added importance because it sits near the lower end of the token’s March-to-May trading range, where buyers previously stepped in around $3.10–$3.20.
A daily close below $3.19 would weaken that support and expose the 23.6% Fibonacci level at $2.86. Continued selling could then send the token toward the psychological $3.00 mark or the June swing low at $2.32.
The latest daily candle also shows little evidence that buyers are absorbing the decline. UNI opened near $3.48, briefly reached $3.53, and then fell to $3.17, leaving the token close to its session low.
Bear-bull power stood at -0.791, its weakest reading on the displayed daily chart. A deeply negative reading indicates that sellers are forcing the price farther below its short-term average rather than merely responding to a temporary pullback.
Daily Stochastic RSI readings of 0.00 and 0.54 place UNI deep in oversold territory. Such a reading can precede a relief rebound, but oversold conditions alone do not confirm that the decline has ended while price continues to record lower highs and lower lows.
Head-and-shoulders pattern confirms a bearish reversal
Crypto analyst Crypto With Gopal identified a head-and-shoulders pattern on UNI’s 4-hour chart in an Aug. 12 post on X. According to the analyst, the right shoulder failed around $4.20 before the token broke below the pattern’s neckline near $3.90.
The formation began with a left shoulder below $4.00, followed by a head near $4.60 and a lower right shoulder around $4.20. Price subsequently lost the rising neckline that had supported the July advance.
Crypto With Gopal placed the pattern’s downside target near $3.00. UNI has since fallen from approximately $3.53 at the time of the post to around $3.23, bringing the projected level within 7% of the current price.
The 4-hour chart supports the bearish pattern. UNI formed a sequence of lower highs after the Aug. 1 peak, initially losing $4.00 before falling through $3.80, $3.60, and $3.45. A brief attempt to stabilize around $3.50 failed on Aug. 14 and was followed by another sharp leg lower.
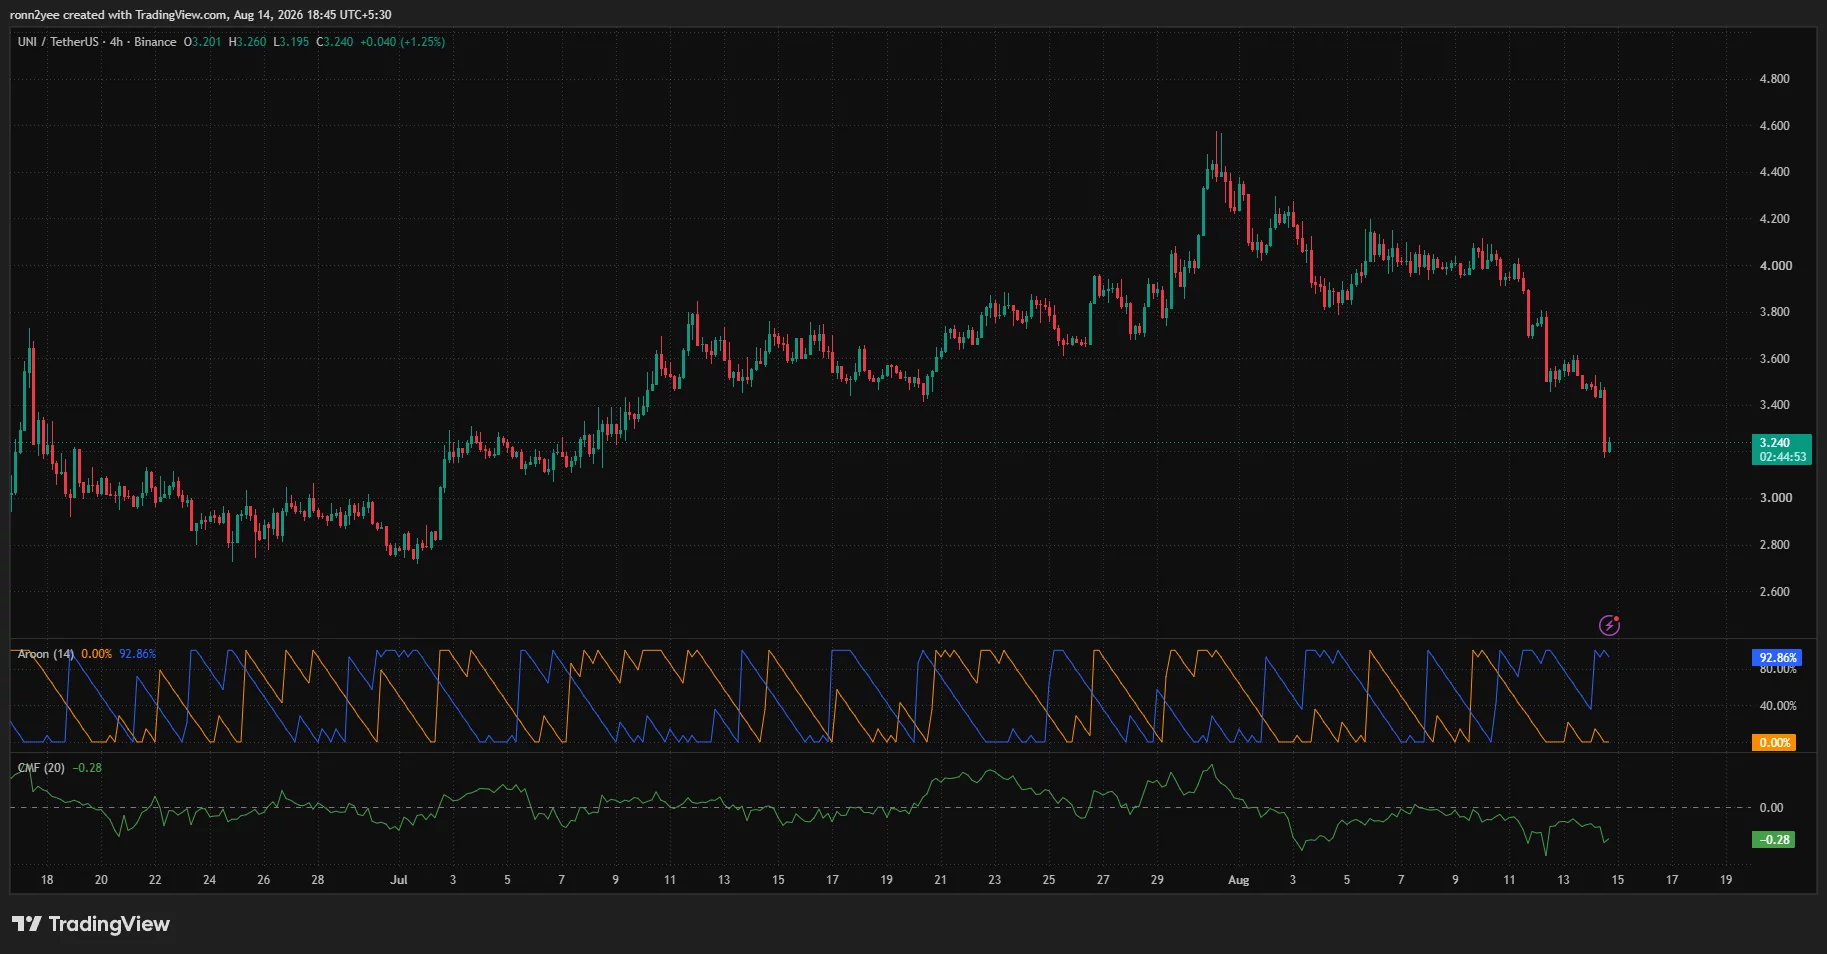
Aroon Down stood at 92.86% on the 4-hour timeframe, while Aroon Up registered 0%. The separation indicates that recent lows are forming much more frequently than recent highs, keeping the short-term trend pointed downward.
Chaikin Money Flow was also negative at -0.28. The reading shows that trading volume has been concentrated during periods when UNI closed near the lower end of its candles, a sign that capital continues to leave the market.
UNI liquidations could amplify volatility
CoinGlass’ three-day liquidation heatmap shows that UNI’s decline accelerated as the price moved through several areas containing leveraged positions. The token fell from above $3.80 on Aug. 11 to nearly $3.20 by Aug. 14, with sharp drops appearing around $3.60, $3.45, and $3.35.
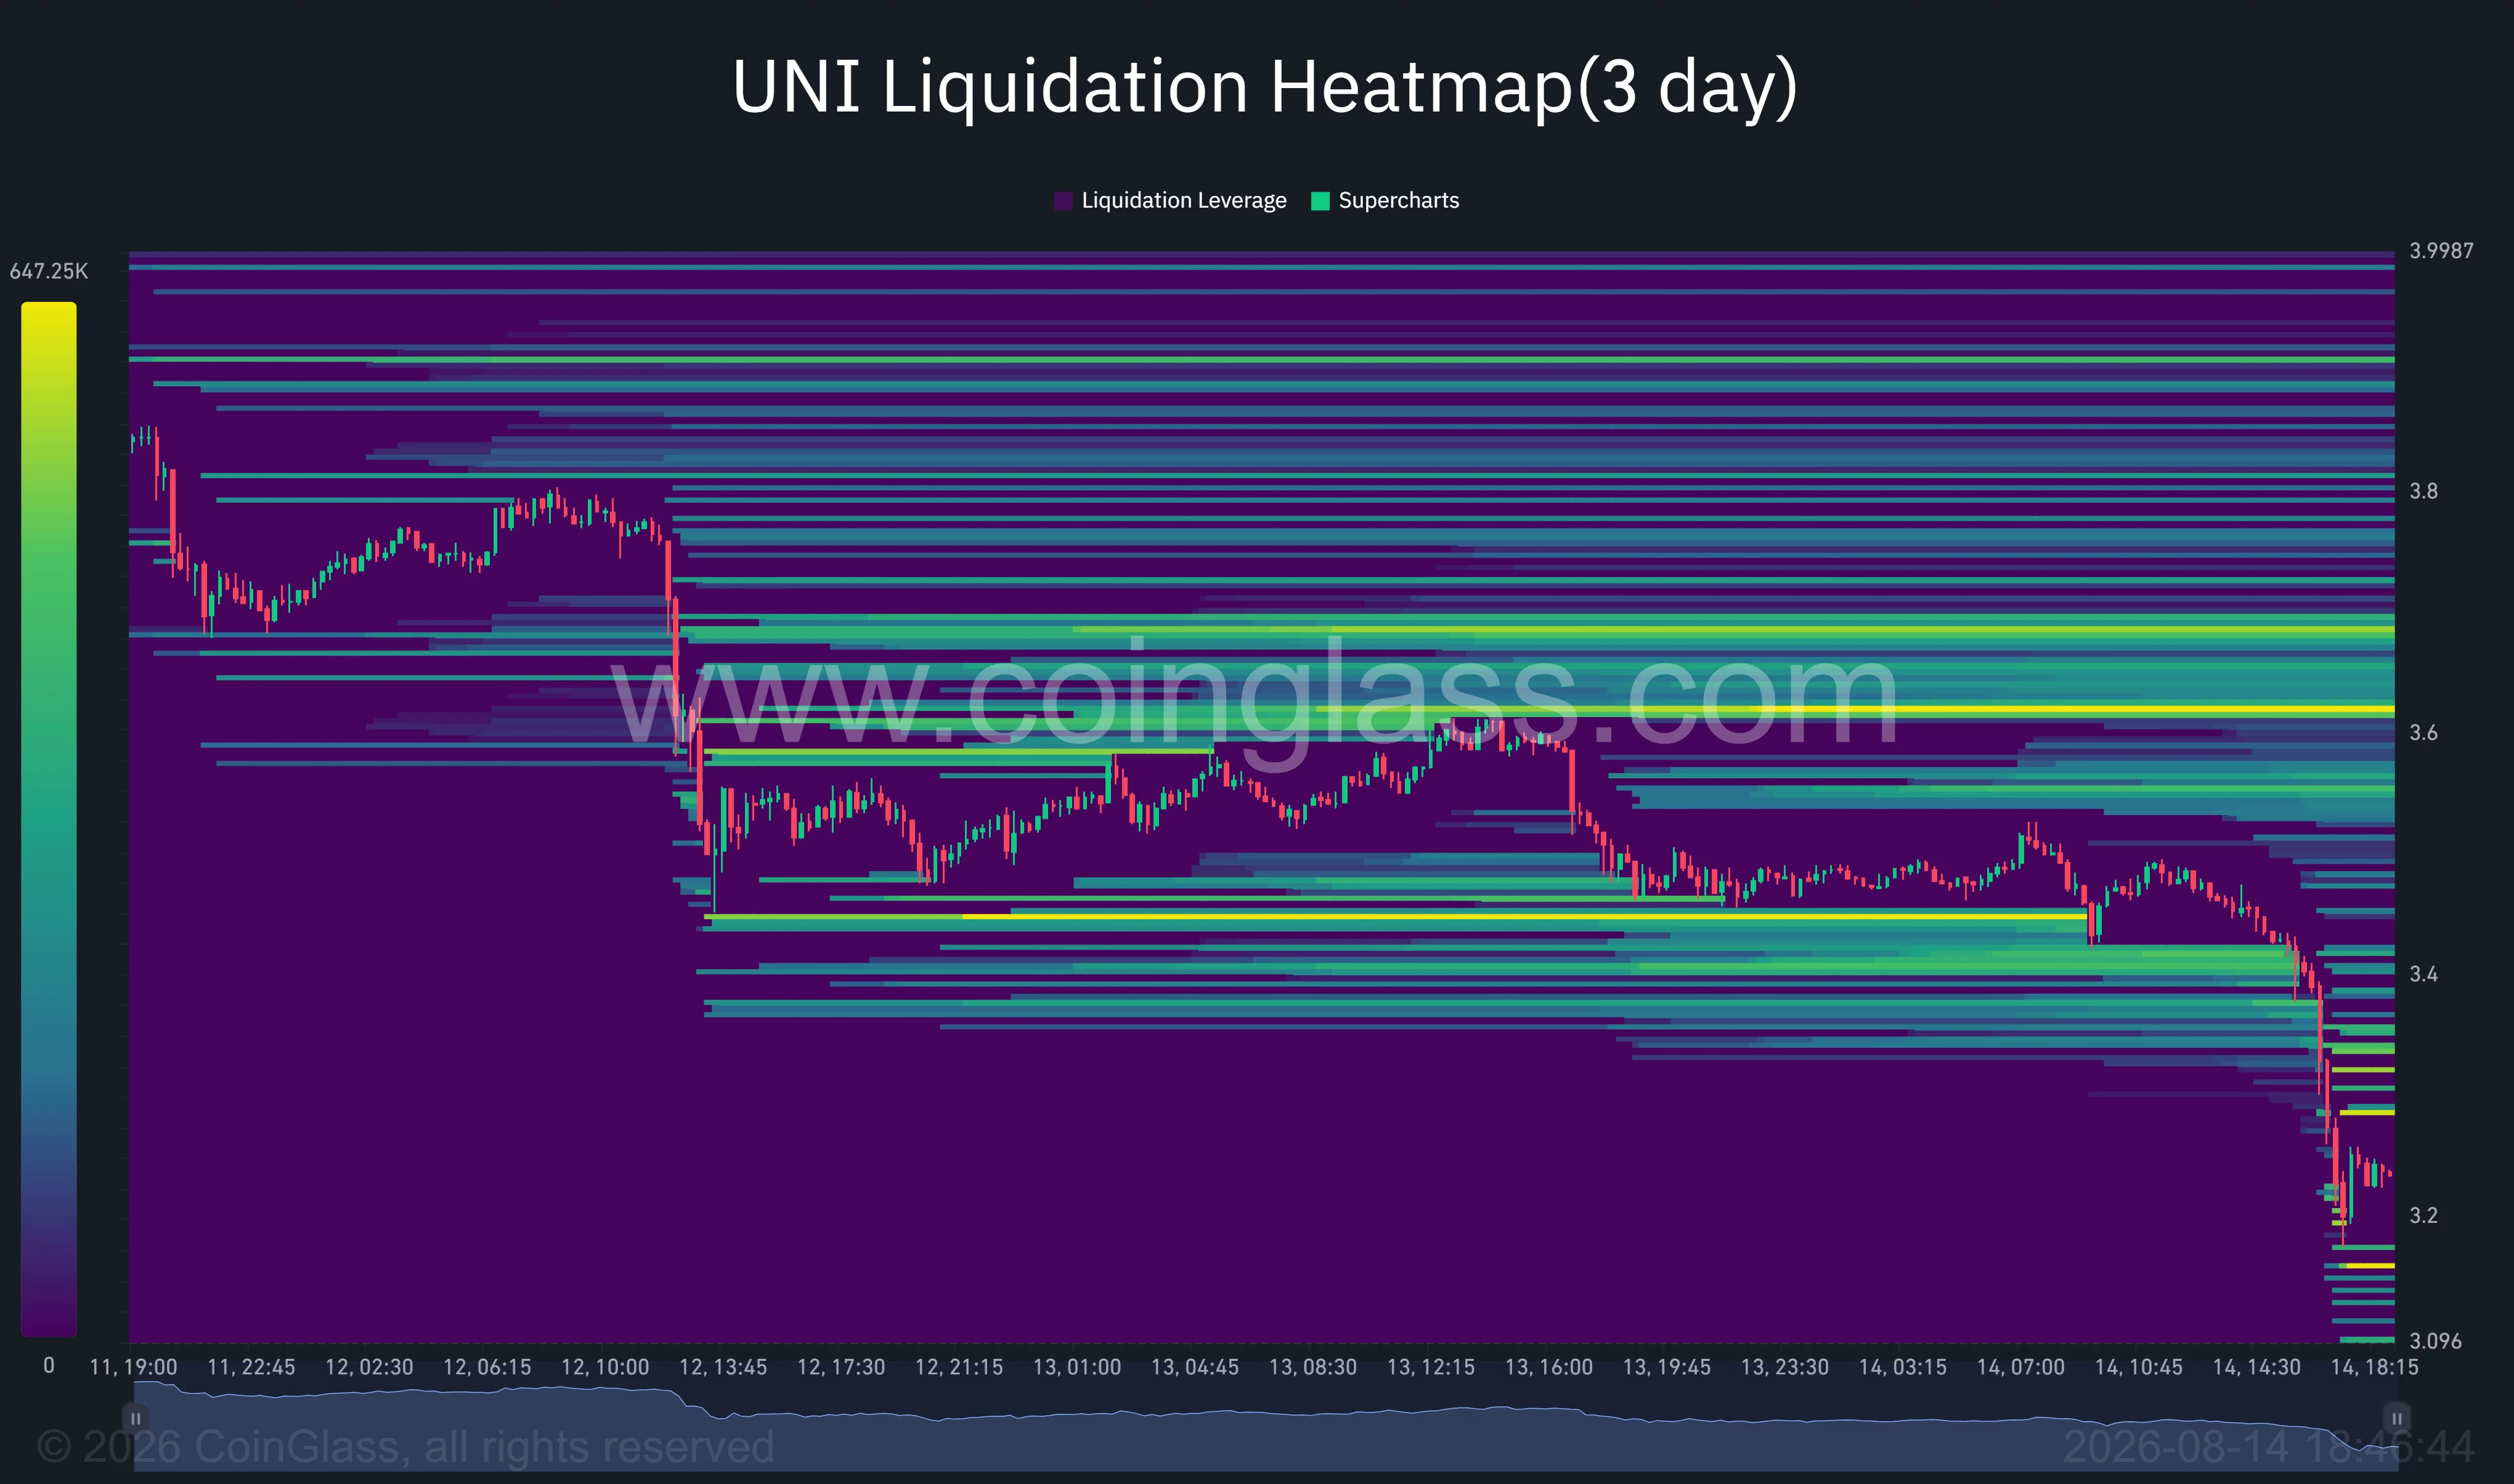
The heatmap suggests that liquidity previously concentrated near $3.45 was cleared during the latest sell-off. UNI briefly moved below $3.20 before stabilizing around $3.23, where nearby liquidation bands appear smaller than the clusters left above the market.
Larger concentrations remain between approximately $3.45 and $3.55, followed by brighter bands around $3.60–$3.65. Because price can move toward areas containing heavily leveraged positions, a recovery into these zones could trigger short liquidations and produce a faster rebound.
However, the same clusters may also act as resistance. Traders who bought before the breakdown could use a return toward $3.45 or $3.60 to reduce exposure, adding spot supply as leveraged shorts face pressure.
Another large liquidity band sits near $3.68, while additional concentrations extend toward $3.80. UNI would need to reclaim the $3.45 Fibonacci midpoint and then hold above $3.72 to begin repairing the damage visible on the daily chart.
Below the current price, liquidation liquidity is thinner, although smaller bands appear between $3.10 and $3.20. A clean breakthrough through that area could allow the price to travel more quickly toward the $3.00 target identified in the head-and-shoulders setup.
Key UNI price levels traders are watching
The immediate support range lies between the daily low of $3.17 and the 38.2% Fibonacci level at $3.19. Holding this area could allow UNI to attempt an oversold bounce toward $3.40–$3.45, where the first notable liquidation cluster and former support are located.
A move above $3.45 would put $3.60–$3.65 in focus. Reclaiming that range would clear a dense group of liquidation levels, although the 61.8% retracement at $3.72 would remain the stronger technical barrier.
For the bullish case to gain credibility, UNI would need to close above $3.72 and recover the broken neckline near $3.90. The $4.10 Fibonacci level and the failed right shoulder around $4.20 would then become the next resistance points.
The bearish case remains active while UNI trades below $3.45. A daily close under $3.17 would open the path toward $3.00 and $2.86, while a loss of $2.86 would expose the June recovery base between $2.32 and $2.40.
For U.S. investors, UNI remains available through crypto trading platforms rather than U.S.-listed spot exchange-traded funds, leaving the token more dependent on direct spot demand and offshore derivatives liquidity. The chart therefore offers no ETF flow buffer comparable to Bitcoin or Ethereum when leveraged selling accelerates.
Disclosure: This content is provided by a third party. Neither crypto.news nor the author of this article endorses any product mentioned on this page. Users should conduct their own research before taking any action related to the company.

Ripple’s cross-border token once again dipped to the $1 psychological level, infusing a fresh dose of panic across its community.
Despite its major price downfall, whales continue to accumulate tokens, positioning themselves for the next potential uptrend.
More Purchases
Earlier this week, XRP dipped below $1 for the first time since 2024. The bulls recovered some of the losses shortly after and pushed it above that zone. The past 24 hours delivered another red wave, with the asset again fighting to hold that critical level and is actually down nearly 70% over the last year.
The move south seems to be of no concern to large investors, who even see the current conditions as the perfect moment to snap up more tokens. Analyst Ali Martinez revealed that whales acquired 72 million XRP (worth roughly $72 million as of press time) within the past day alone.
“I wonder what they know that we don’t… Are they preparing for a bull rally,” he asked.
It is a common theory that whales’ behavior differs significantly from that of retail investors. Big participants rarely jump on the bandwagon without doing proper research, and some speculate they might have inside information that the rest of the market lacks. As such, they can influence smaller players to follow suit, while the potential wave of fresh capital might benefit the asset’s price.
The whales’ accumulation over the past 24 hours isn’t an isolated case. Just a few days ago, Martinez disclosed that they have scooped up more than 380 million XRP in one week.
Another positive factor is the overall increase in the number of addresses holding at least 1 million coins, which, according to Santiment, has risen by 32 over the last three months.
The Bearish Perspective
In addition to outlining the whales’ activity, Martinez has recently issued a major price warning. In early August, he claimed that “everything comes down to $1.06 for XRP,” suggesting that holding the line could trigger a rally to as high as $1.64, whereas plunging under might result in a violent crash to $0.62. As mentioned above, the token’s valuation has plummeted below the depicted level, and we have yet to see whether a more substantial collapse will follow.
Meanwhile, CryptoQuant recently outlined that XRP’s selling pressure has intensified to its highest level since May on Binance after the Taker Buy/Sell ratio fell to 0.86.
“A reading below 1 indicates that the volume of sell orders executed by traders exceeds the volume of buy orders, reflecting clear selling pressure from traders executing trades directly,” the entity explained.
The post 72,000,000 XRP in 24 Hours: Do Ripple Whales Know Something We Don’t? appeared first on CryptoPotato.
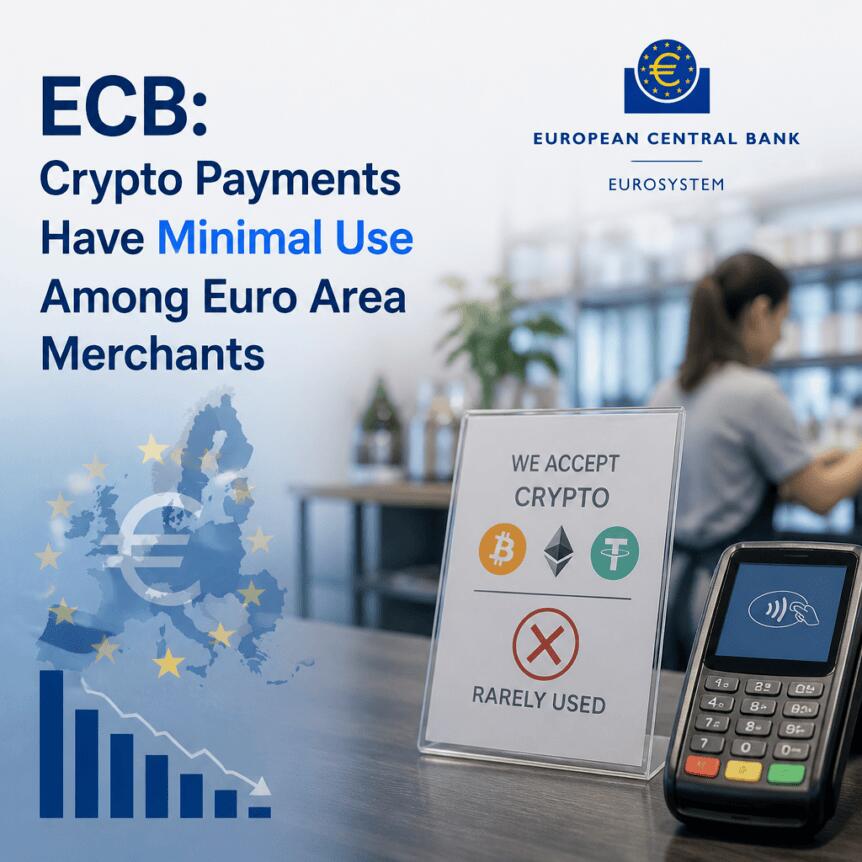
Crypto remains a niche option for payments across the euro area, according to a new survey by the European Central Bank (ECB) that tracks what businesses actually accept at the point of sale. Despite years of mainstream experimentation and the growth of digital payments more broadly, the ECB found that only a tiny share of merchants take crypto assets, including stablecoins.
In the ECB’s survey on companies’ cash use, just 0.2% of online merchants accepting goods and services online said they take crypto assets. Cash continues to dominate among businesses with physical sales locations, with 92% of companies accepting it, and mobile payment options continuing to expand quickly.
Key takeaways
- Crypto acceptance is extremely limited: the ECB reports 0.2% of euro area businesses accepting crypto for online purchases.
- Cash still leads at physical locations, accepted by 92% of businesses with point-of-sale outlets.
- Mobile payments are the main growth area for in-person transactions, rising to 68% acceptance in 2026 from 36% in 2024.
- Crypto and stablecoins show little traction at physical points of sale, staying below 1% in both 2024 and 2026.
- Merchants prioritize customer demand and security when choosing payment methods, with consumer preference cited as the top factor.
A euro area snapshot: cash holding firm while mobile rises
The ECB based the findings on interviews with 8,205 businesses across all 21 euro area countries. The sample includes retailers, restaurants and cafés, hotels, and arts, entertainment, and recreation venues. According to the ECB, Ipsos carried out telephone interviews from Feb. 23 to April 10.
While crypto remains close to the margins, other payment methods have moved meaningfully. At physical locations, mobile payments recorded the largest shift. The ECB’s figures show acceptance climbed to 68% in 2026 from 36% in 2024.
That rise is consistent with how customers increasingly transact in-store: the ECB notes that widely used mobile options include instant payments and digital wallets such as Apple Pay and Google Pay.
Where crypto sits: stablecoin and crypto acceptance stays under 1%
At physical points of sale, cash edged slightly higher—92% acceptance in 2026 compared with 90% in 2024. Physical card acceptance also increased modestly, moving to 88% from 87%.
By contrast, the ECB reported that crypto assets and stablecoins showed virtually no momentum. They remained below 1% acceptance at physical locations in both 2024 and 2026, suggesting that whatever progress the wider digital assets industry has seen has not translated into broad merchant adoption in euro area commerce.
The ECB also tracked other instruments. Acceptance of bank checks fell to 27% from 36%, underscoring that payments evolve unevenly across channels even as cash continues to retain the largest share of acceptance.
Why businesses choose payment methods—and why they don’t
The ECB survey highlights what drives merchants when deciding which payment options to support. Consumer preference was the most-cited factor, named by 26% of respondents. Security followed at 22%, while ease of handling came in at 15%.
The reasons for rejecting cash offer additional context for how businesses think about payment risk and practicality. Among companies that do not accept cash, weak customer demand was the most common explanation (36%), while the next-largest share pointed to difficulties related to depositing or withdrawing cash (35%). Security concerns were also mentioned by 29% of respondents.
While these responses relate specifically to cash, they help explain the broader merchant calculus: adoption tends to follow customer behavior and operational simplicity, with security and reliability shaping the risk assessment.
Country differences and the definition problem around “accepting crypto”
Merchant attitudes toward cash also vary widely across countries, and the same type of uneven adoption could be a challenge for crypto. The ECB reports that 51% of cash-accepting small and medium-sized enterprises in Cyprus said they may stop accepting cash, compared with 23% in Greece and 18% in Bulgaria.
For crypto, the ECB survey asked businesses whether they accept crypto assets or stablecoins. To anchor responses, it cited examples including Bitcoin, Ether, and Tether’s USDt (USDT).
However, there is a practical measurement issue. The ECB acknowledged indirectly that crypto payments can be structured so merchants receive settlement in traditional currency even when customers pay with crypto through certain services. The ECB’s survey, as described in the article coverage, does not clarify whether businesses should treat these arrangements as “accepting crypto.”
When Cointelegraph asked whether such conversions could affect reporting consistency and whether regulatory uncertainty could influence how firms answer, the ECB said it “prefer[s] not to speculate.” In response to a question about whether euro area merchants are permitted to accept crypto under European Union rules, the ECB stated it does not set payment regulation and pointed to the European Commission and national lawmakers.
That distinction matters for readers interpreting the data: low acceptance rates could reflect both limited demand and constraints tied to how payments are operationalized and classified—especially in a regulatory environment where businesses may still be cautious about compliance or reporting.
Digital euro work continues, but merchant reality stays unchanged
The ECB’s crypto findings arrive as the institution continues its work on a digital euro—a central bank digital currency intended to complement cash while preserving the euro’s role in payments. Earlier coverage from Cointelegraph noted the ECB is advancing accessibility for payment providers as part of that broader CBDC effort.
Yet the merchant data in this survey points to a more immediate reality: even as mobile payments accelerate and digital channels expand, crypto and stablecoins have not crossed the threshold into mainstream acceptance for most euro area businesses—at least as measured by the ECB’s survey.
For investors, traders, and builders, the key question now is whether euro area crypto adoption can move from isolated use cases to meaningful merchant integration. The ECB survey provides a useful baseline; the next watch should be whether mobile payment growth continues to crowd out alternatives like crypto, and whether future regulatory clarity—or new payment rails using tokenized settlement—changes how businesses decide what to accept.
Crypto World
BTCC Exchange Announces Platinum Sponsorship of TOKEN2049 Singapore and Launches “0-Barrier Trading” Flagship Theme


BTCC, the world’s longest-serving cryptocurrency exchange, announces its participation in TOKEN2049 Singapore 2026 as a Platinum Sponsor. Taking place October 7-8 at Marina Bay Sands, the world’s largest crypto event is expected to convene over 25,000 global industry leaders, investors, and enthusiasts.
As BTCC celebrates its 15th anniversary this year, the exchange’s high-profile presence at TOKEN2049 signals the next chapter in its brand evolution: 0-barrier trading.
Theme of the Next Chapter: 0-Barrier Trading
BTCC’s TOKEN2049 showcase centers on its commitment to making futures trading accessible, reliable, and cost-efficient. Driven by the core pillars of 0 Fees, 0 Friction, and 0 Panic, BTCC removes all barriers to trading, allowing cost-conscious traders to navigate global markets with confidence.
On-site, BTCC’s booth at TOKEN2049 will bring its yearlong 0-Fee Festival campaign to life through a large-scale receipt-style installation designed for social sharing. Alongside the merch counter, the booth features a rotating, backlit cylinder that highlights the exchange’s core zero-barrier commitments.
Attendees can stop by to participate in interactive activities, engage with the team, and collect official BTCC swag bags.
The BTCC Traders Club
A key highlight of BTCC’s presence at TOKEN2049 is the BTCC Traders Club. Styled around BTCC’s partnership with the Argentine Football Association (AFA), the exclusive private lounge features dark wood decor in a cozy, luxurious atmosphere where BTCC’s most meaningful TOKEN2049 conversations will take place. During the event, the lounge will receive VIP traders, key opinion leaders, community partners, and invited guests to connect and collaborate.
Global Giveaways & Live Coverage
For the global community participating virtually, BTCC will host live streams on X featuring prominent industry KOLs directly from the Marina Bay Sands exhibition floor.
Online participants can join special campaigns throughout the event, with rewards including USDT prize pool giveaways and exclusive limited-edition merchandise.
To stay updated on BTCC’s announcements and activities at TOKEN2049 Singapore, visit BTCC’s official X.
#BTCC15 #BTCCTOKEN2049
About BTCC
Founded in 2011, BTCC is a leading global cryptocurrency exchange serving over 12 million users across 100+ countries. As the official regional sponsor of the Argentine Football Association (AFA), BTCC offers secure and accessible cryptocurrency trading services, focused on delivering a user-friendly experience while adhering to applicable regulatory standards.
The post BTCC Exchange Announces Platinum Sponsorship of TOKEN2049 Singapore and Launches “0-Barrier Trading” Flagship Theme appeared first on BeInCrypto.
On 13 August, the UK Office for National Statistics (ONS) reported that GDP growth slowed to 0.4% quarter-on-quarter in the second quarter, down from 0.6% in the first quarter. The figure was in line with expectations, and the market reaction was relatively muted.
The interest-rate backdrop has also remained broadly unchanged for several weeks. On 30 July, the Bank of England kept its policy rate at 3.75%, while the ECB left its rate at 2.25% on 23 July. With both decisions largely priced into the market, the absence of fresh guidance from either central bank means that short-term EUR/GBP price action may be driven more by technical factors than by the latest macroeconomic data.
Technical Analysis of EUR/GBP
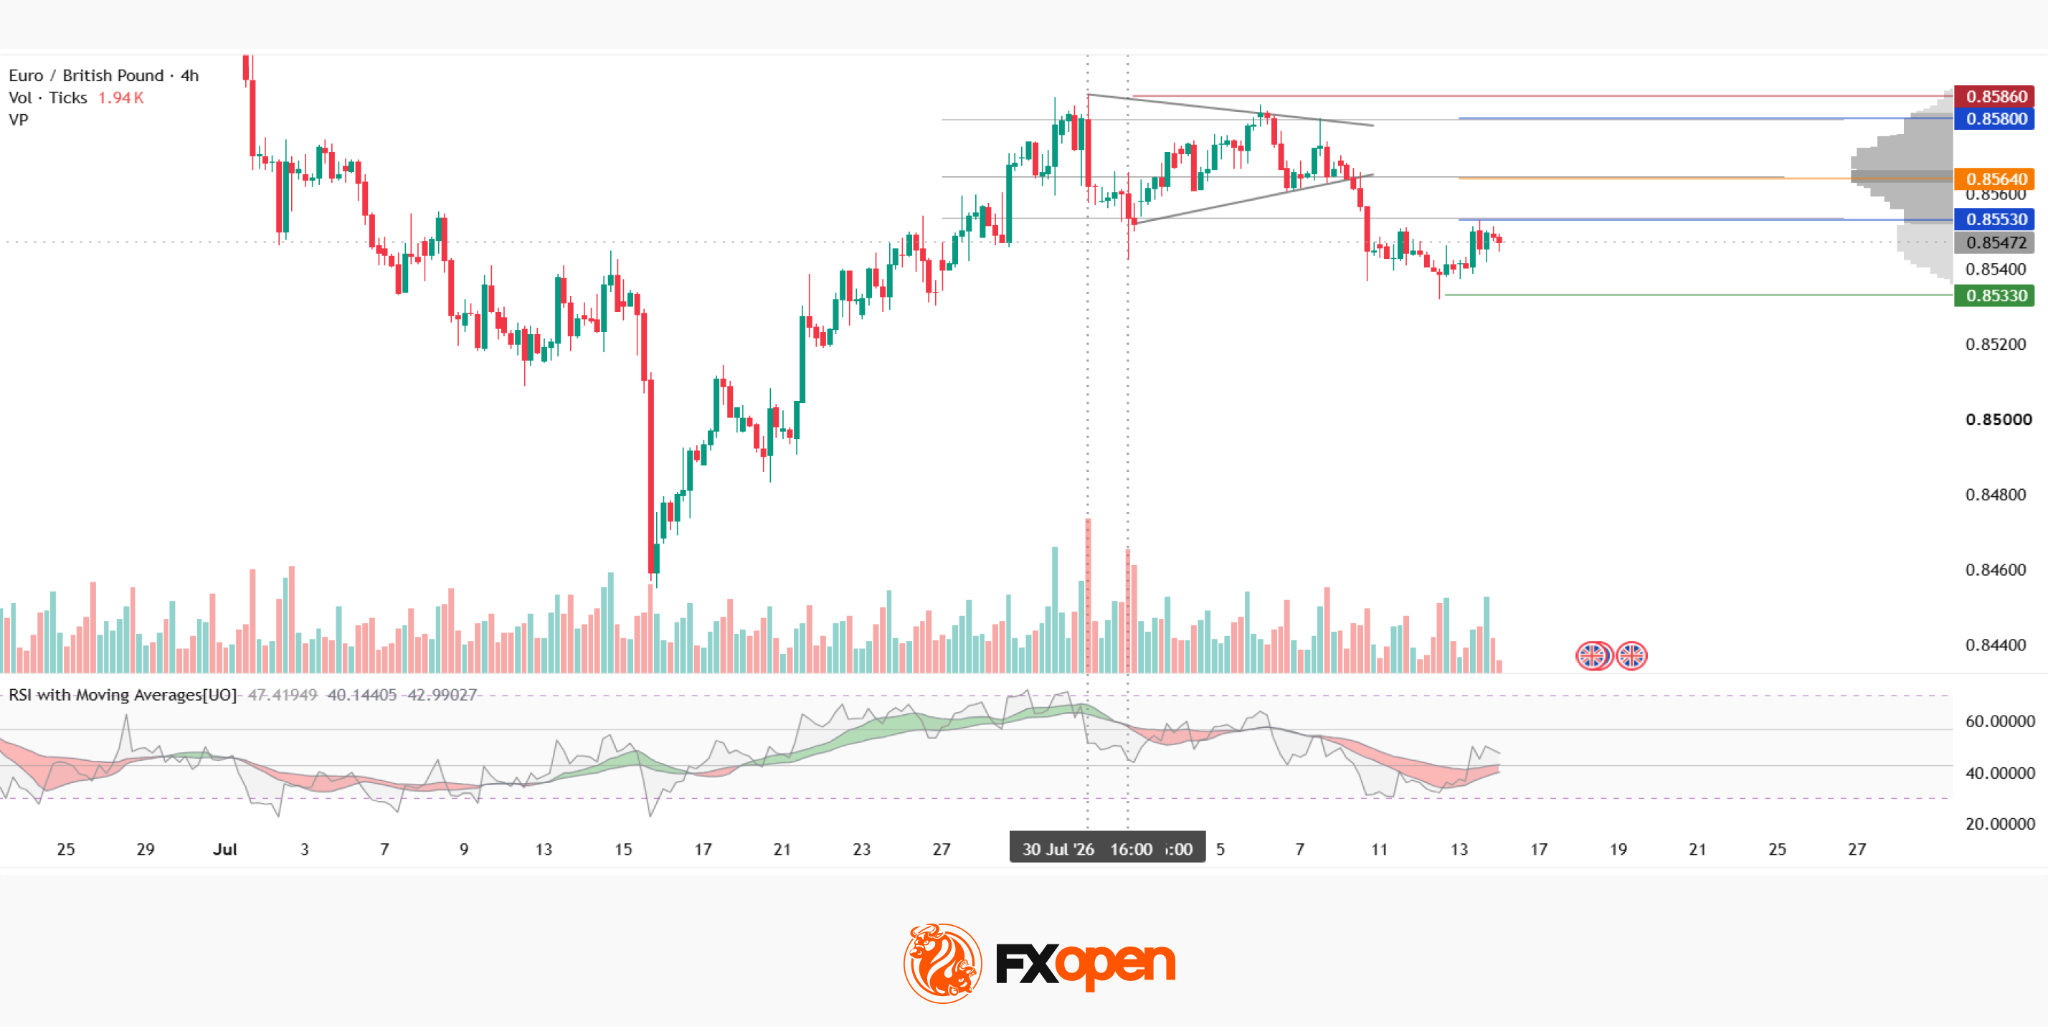
The second half of July saw a strong upward move in EUR/GBP, with the pair climbing from below 0.8460 to a peak near the current resistance level at 0.8586.
The rally was followed by a consolidation phase. Since the beginning of August, price action has gradually narrowed into a pattern resembling a symmetrical triangle, with the trading range becoming progressively tighter.
On Monday, 10 August, the pair broke below the lower boundary of the formation. EUR/GBP is currently trading beneath both the triangle’s lower trendline and the lower boundary of the current market profile at 0.8553, while testing the latter from below. If this retest is successful and the downside move gains momentum, the green support level around 0.8533 could become increasingly important.
A false breakout, however, would shift attention back towards the upside. In that scenario, the pair would face several technical barriers: the Point of Control (POC) at 0.8564, the upper boundary of the profile at 0.8580, and the key resistance level at 0.8586.
The RSI + MAs indicator currently shows readings of 48, 40 and 43. The bearish signal has failed to develop further, while the RSI has moved back into the neutral zone, suggesting that momentum remains inconclusive.
Key Takeaways
The attempted downside breakout has pushed EUR/GBP outside the profile in which the recent consolidation developed. The next directional move may depend on whether the pound receives additional support from the Bank of England as the central bank determines its subsequent policy course.
For now, the technical setup remains vulnerable to a false breakout, with the 0.8553 retest likely to be particularly important in determining whether sellers can maintain control or the pair returns to the consolidation range.
Trade over 50 forex markets 24 hours a day with FXOpen. Take advantage of low commissions, deep liquidity, and spreads from 0.0 pips (additional fees may apply). Open your FXOpen account now or learn more about trading forex with FXOpen.
This article represents the opinion of the Companies operating under the FXOpen brand only. It is not to be construed as an offer, solicitation, or recommendation with respect to products and services provided by the Companies operating under the FXOpen brand, nor is it to be considered financial advice.

Key takeaways
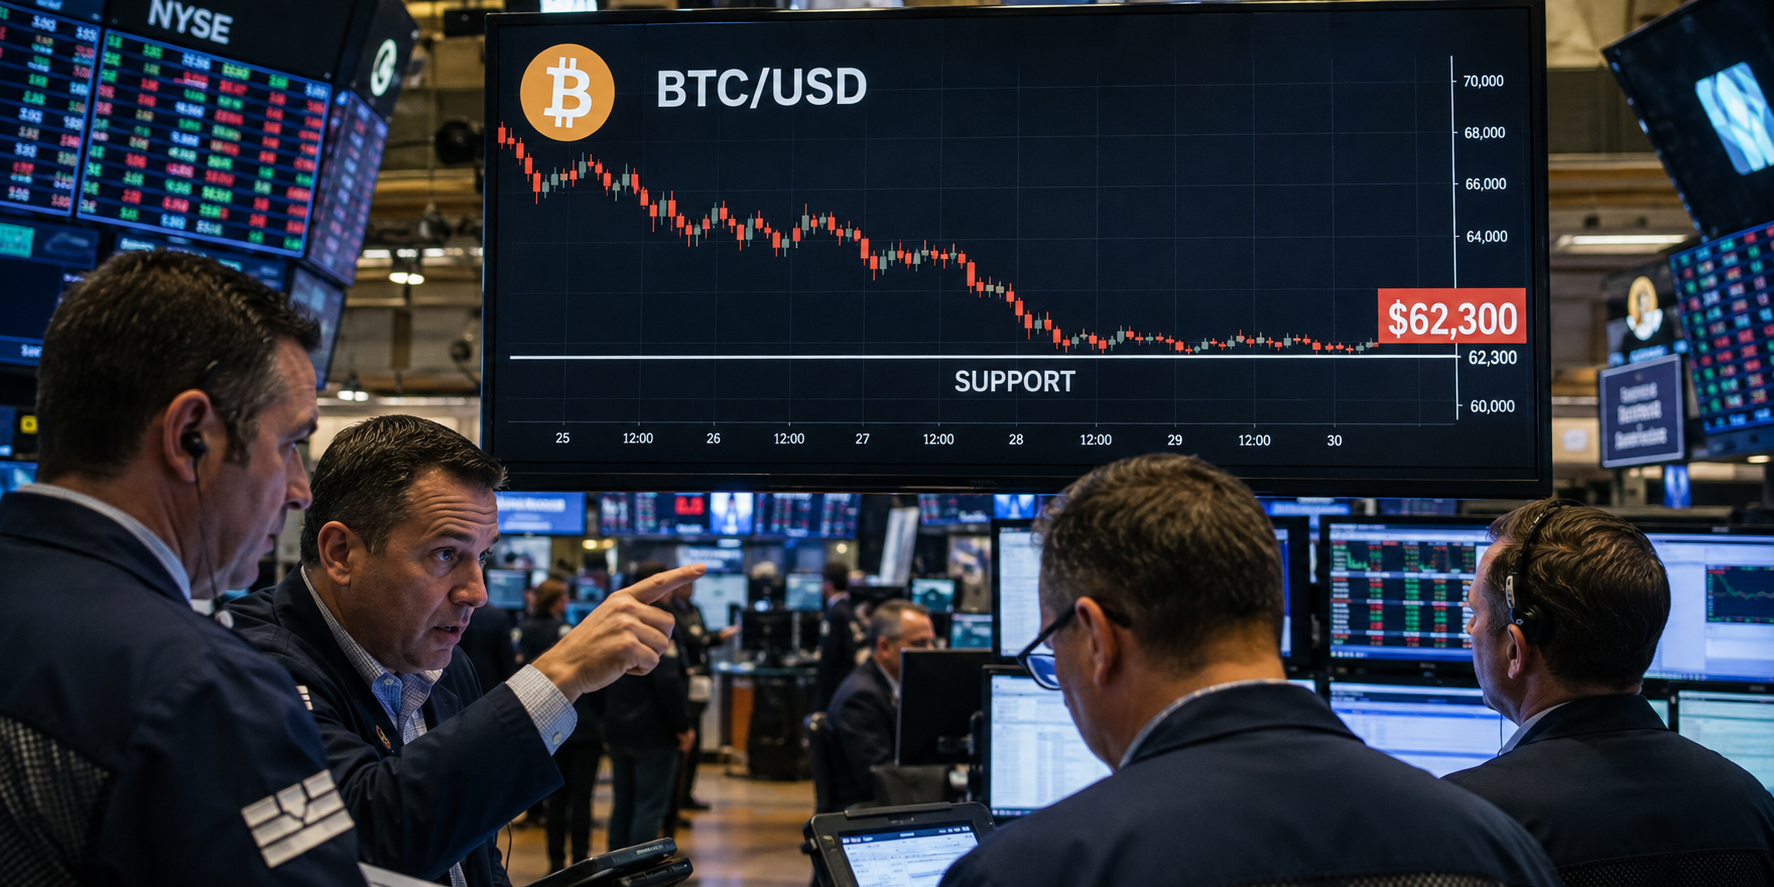
- Bitcoin trades near $63,567 on Friday after rebounding from support around $62,300.
- BTC remains below its 50-day, 100-day and 200-day EMAs, preserving the broader bearish bias.
- The RSI at 46 and a negative MACD signal weak momentum despite the recent stabilization.
Bitcoin (BTC) shows signs of stabilization on Friday after recovering from a correction earlier in the week.
BTC trades around $63,567 after buyers defended the $62,300 support level on Thursday. Holding this area could provide the foundation for a short-term rebound, but the price remains below all its major Exponential Moving Averages (EMAs).
Weak momentum indicators and several resistance barriers above the current price suggest that any recovery may remain limited unless Bitcoin reclaims the $64,488–$66,604 region.
Bitcoin rebounds from $62,300 support
Bitcoin found support around $62,300 on Thursday before recovering to approximately $63,567 on Friday.
The rebound indicates that buyers remain active near the lower boundary of the current range. However, BTC continues to trade below the 50-day, 100-day, and 200-day EMAs, which are positioned between $64,488 and $72,035.
When the price trades below these major moving averages, they can act as dynamic resistance during recovery attempts. This structure suggests the broader trend remains bearish despite Bitcoin’s ability to defend short-term support.
A stronger reversal would require BTC to reclaim the 50-day EMA before challenging the higher resistance levels created by the longer-term averages.
Bitcoin’s Relative Strength Index stands near 46, below the neutral level of 50.
The reading indicates that sellers maintain a slight advantage, although the indicator remains well above oversold territory. A move above 50 would suggest improving momentum and could reinforce the likelihood of a broader recovery.
The Moving Average Convergence Divergence remains below its zero line, supporting the bearish outlook.
Together, the indicators show that downside pressure has eased but has not disappeared. Bitcoin needs stronger buying volume and a decisive move above nearby resistance to confirm a momentum shift.
BTC faces resistance at $64,488
The 50-day EMA at approximately $64,488 represents Bitcoin’s first significant resistance level.
A daily close above this moving average could strengthen the rebound and allow BTC to challenge the 38.2% Fibonacci retracement level near $65,547.
Beyond that, the horizontal resistance at $66,500 and the 100-day EMA at $66,604 form a dense supply zone. Sellers may defend this region aggressively, particularly after Bitcoin’s recent correction.
If buyers overcome the $66,500–$66,604 range, the 50% Fibonacci retracement near $67,940 would become the next upside target.
A sustained move above $67,940 would substantially improve the short-term technical outlook, although the 200-day EMA near $72,035 would remain a major long-term barrier.
On the downside, initial support sits at the 23.6% Fibonacci retracement level around $62,586.
The horizontal floor at $62,300 provides the next and more critical support. This level triggered Thursday’s recovery and remains essential to Bitcoin’s short-term outlook.

A daily close below $62,300 would invalidate the immediate rebound scenario and signal that selling pressure is strengthening.
Such a breakdown could expose Bitcoin’s broader support near $57,800, which marks the current cycle low. Buyers would likely attempt to defend this area because a sustained move below it could extend the wider bearish trend.
For now, holding above $62,300 keeps the possibility of a recovery toward $64,488 and $65,547 intact. However, Bitcoin must reclaim the major moving averages to demonstrate that bulls are taking control.
[PRESS RELEASE – Amsterdam, Netherlands, August 14th, 2026]
USDT remains the dominant stablecoin by business transaction volume on NOWPayments, but new platform data shows USDC gaining momentum fast. In H1 2026, USDC transaction count increased by 209.02% year-over-year, and transaction volume rose by 101.63%, while USDT transaction activity declined over the same period.
The result is an increasingly differentiated stablecoin landscape: USDT continues to offer the scale and liquidity businesses rely on globally, while USDC is emerging as a growing alternative, particularly for companies navigating regulated European infrastructure.
Stablecoins are no longer used only to accept crypto payments. Businesses are increasingly relying on USDT and USDC to move money throughout their daily operations, from affiliate commissions and supplier settlements to marketplace payouts, payroll, treasury transfers, and customer withdrawals. As more companies build these workflows around digital assets, stablecoins are becoming an important part of business infrastructure rather than simply another payment option.
Drawing on USDT and USDC transaction activity across the NOWPayments platform between 2025 and 2026, this report examines how business stablecoin usage is evolving and the blockchain networks supporting that activity.
*Unless otherwise stated, all figures refer to USDT and USDC transaction activity processed through the NOWPayments platform.
Stablecoins Are Becoming Business Infrastructure
For many businesses, accepting a crypto payment is only the first step. Once funds are received, they still need to move through the business. Suppliers need to be paid, affiliates receive commissions, marketplace sellers withdraw earnings, employees collect salaries, and finance teams transfer working capital between accounts.
Instead of converting every incoming payment into fiat, many businesses now keep part of their operating funds in stablecoins and use them directly for day-to-day settlements.
Common operational use cases include:
- Affiliate and referral commissions
- Supplier and contractor payments
- Marketplace seller withdrawals
- Payroll for distributed teams
- Creator and influencer payouts
- Treasury transfers
For many businesses, stablecoins now support both incoming payments and outgoing transfers within the same operational workflow.
Business Stablecoin Adoption: USDT and USDC
The data reveals a clear divergence between scale and momentum. USDT remains the dominant stablecoin by transaction volume, while USDC is growing significantly faster from a smaller base.
USDT Still Leads Business Stablecoin Volume
USDT continues to account for the largest share of business stablecoin transaction activity, particularly by transaction volume.
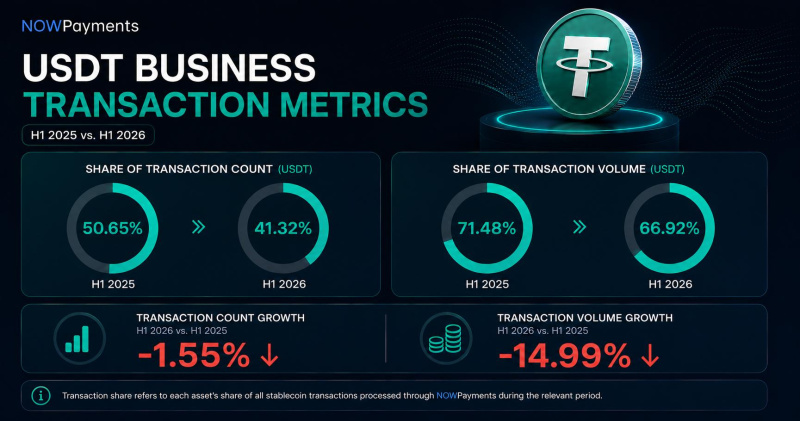
USDT’s lead remains substantial, even as its transaction activity declined year over year. In H1 2026, USDT transaction count declined 1.55% compared with H1 2025, while transaction volume fell 14.99%. Even so, USDT accounted for 66.92% of stablecoin transaction volume on NOWPayments in H1 2026. Its substantially higher share of transaction volume than transaction count (41.32%) suggests that USDT continues to play a particularly important role in higher-value business transfers.
USDC Gains Momentum Fast
USDC is becoming an increasingly important part of business stablecoin adoption.
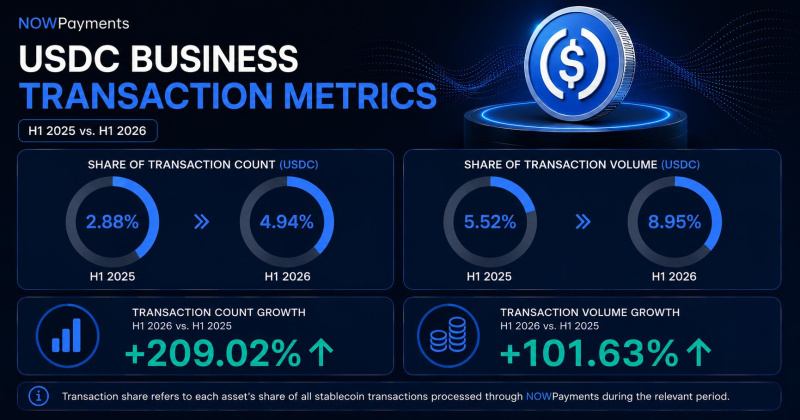
USDC remains much smaller than USDT by overall transaction share, but it is showing substantially stronger growth. In H1 2026, USDC transaction count increased 209.02% year over year, while transaction volume rose 101.63% year over year.
Its share of stablecoin transaction count also increased from 2.88% in 2025 to 4.94% in 2026, while its share of transaction volume rose from 5.52% to 8.95%. While NOWPayments data does not explain individual business decisions, the increase in both USDC transaction activity and transaction share indicates that USDC is gaining ground alongside USDT on the platform.
Network Choice Adds Another Layer to Stablecoin Strategy
Stablecoin choice is only part of the infrastructure decision. Businesses also select networks based on transaction costs, settlement speed, recipient compatibility, and ecosystem support.
Businesses using NOWPayments can process stablecoin transactions across multiple blockchain networks, including:
USDT
- TRON
- Ethereum
- BNB Smart Chain
- Polygon
USDC
- Ethereum
- Base
- Polygon
- Arbitrum
Two Stablecoins, Two Business Advantages
The divergence between USDT and USDC is not only about transaction growth. The two assets increasingly offer businesses different advantages: USDT combines global scale and liquidity, while USDC has a clearer position within Europe’s MiCA-regulated environment.
USDT and USDC Under MiCA
For global operations, USDT’s liquidity and broad ecosystem support remain significant advantages. For businesses focused on Europe, USDC’s regulatory positioning can make it easier to integrate with regulated crypto infrastructure. For companies operating across both environments, supporting both assets can provide greater flexibility.
Businesses looking for a detailed legal analysis can explore NOWPayments’ analysis of USDC under MiCA and comparison of USDT and USDC under MiCA, which examine the regulatory framework and its practical implications for payment and payout infrastructure.
MiCA does not prohibit businesses or individuals from holding or transferring USDT. However, regulated exchanges, custodians, payment providers, and other crypto asset service providers may apply restrictions based on their own compliance obligations.
What the Findings Mean
NOWPayments data points to a stablecoin market defined by two different strengths. USDT remains the scale leader, accounting for 66.92% of stablecoin transaction volume in H1 2026. USDC remains much smaller, but its 209.02% growth in transaction count and 101.63% growth in transaction volume show significantly stronger momentum.
For businesses, the emerging picture is less about choosing a winner and more about choosing the right infrastructure for the market: USDT for global liquidity and established transaction scale and USDC for growing adoption and a clearer regulatory position in Europe.
“For many businesses, the question is no longer necessarily USDT or USDC. Supporting both can provide more flexibility across markets, partners, and operational requirements,” said Kate Lifshits, CBDO of NOWPayments.
About NOWPayments
NOWPayments is a crypto business ecosystem designed to help companies accept payments, automate mass payouts, manage stablecoin treasury, and scale global digital asset operations through a single infrastructure. Supporting 350+ cryptocurrencies, 30+ stablecoins, flexible settlement options, and enterprise-grade APIs, the platform helps businesses build scalable global payment operations. With 99% of payments completed in under one minute, near-instant email payouts, enterprise automation, and 24/7 operational support, NOWPayments provides the infrastructure businesses need to monetize, move, and manage digital assets at scale.
The post USDT Still Leads Stablecoin Volume as USDC Gains Momentum, NOWPayments Data Shows appeared first on CryptoPotato.

Royal Watchers Speculate Carole Middleton Wants Credit For ‘The Middleton Model’ Parenting

RedotPay US IPO Faces Further Delays as Legal, Regulatory Issues Mount

Copa América returns to Its Four-Year Cycle in 2028


-

 Fashion7 days ago
Weekend Open Thread: Mattifying Sunscreen
-

 News Videos6 days ago
Can Astrology Help Find Gold and Silver Trends? A Financial Astrology Guide
-

 Tech7 days ago
Rinn Pharma & Biopharma to join NordicPharmaTrain network
-

 Business5 days ago
Datadog: Best Of Breed For Multiple Reasons
-

 Business5 days ago
How to Start a Cleaning Business: A Step-by-Step Guide
-

 Business6 days ago
BDC Weekly Review: Private BDC Q2 Numbers Are Strong
-
 NewsBeat3 days ago
Communication cards help banking customers access services or report scams
-
 Business4 days ago
Oil Price Today (August 11): Crude oil rises to $88 after Trump’s compensation demand dents Hormuz opening. Here’s why
-

 Fashion7 days ago
Weekly News Update, 8.6.26 – Corporette.com
-

 Fashion5 days ago
Amazon Sundays: Closet Care Before Fall
-

 Business6 days ago
SharkNinja Keeps Eating
-
 Entertainment6 days ago
10 R-Rated Drama Movies That Can Be Called Masterpieces
-

 Politics6 days ago
Be quiet, Miriam! – spiked
-

 Business6 days ago
Mutual Fund Manager Scoops Up Beaten-Down Stocks
-

 Politics5 days ago
Ben-Gvir’s crocodile project halted but abuses at Ketziot Prison continue
-

 Business5 days ago
5 Things You Must Know About Jorge Messi, the Father and Longtime Agent Who Shaped Lionel Messi’s Career
-

 Entertainment7 days ago
Warren Hudson’s Dad Releases Audio Of Threats
-

 Politics7 days ago
Welsh independence campaign group YesCymru sets 2032 referendum target
-

 Politics5 days ago
The Church of England’s ruinous reparations racket
-
 Crypto World4 days ago
Why Did Nvidia Stock Fall on Monday Despite a $500 Billion Wall Street AI Deal?
You must be logged in to post a comment Login