
CryptoCurrency
The US Dollar Index (DXY) Rebounds from a Two-Month Low

A week ago, we:
→ updated a system of two trend channels;
→ identified signs of selling pressure dominance;
→ outlined a scenario in which price could slide towards the lower boundary of the blue channel, potentially acting as key support.
As the arrow on the chart shows, this scenario largely played out:
→ The US dollar index fell to a two-month low yesterday. The decline was driven by economic news, including weak US housing data. Both housing starts and building permits came in below expectations, reinforcing the view that the US economy is losing momentum.
→ Today, the DXY is rebounding sharply amid sterling weakness, after UK consumer price index (CPI) data revealed a sharp slowdown in inflation to 3.2%, versus a 3.5% forecast.
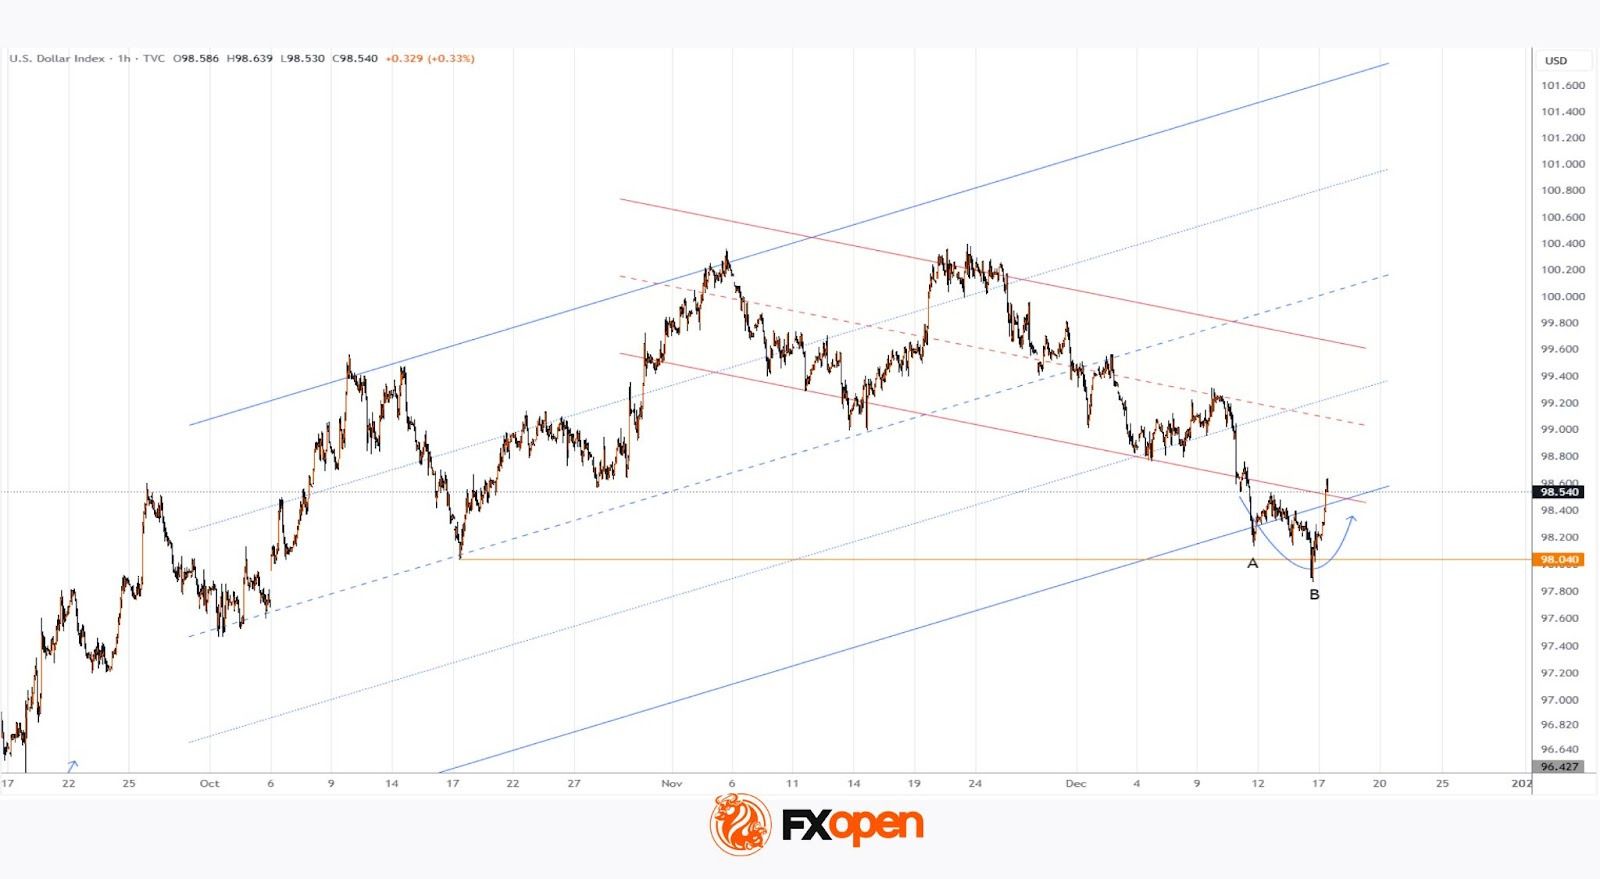
From a technical perspective, the price action points to a fairly aggressive bullish reversal from the lower boundary of the ascending channel. In particular:
→ the brief dip below the key October low appears to be a bear trap, showing characteristics of a Liquidity Grab in Smart Money Concept terminology;
→ several indicators (including the RSI) are likely to display signs of bullish divergence between lows A and B.
Taking all of the above into account, there are grounds to suggest that the US dollar may regain attractiveness towards year-end. It cannot be ruled out that the DXY will recover towards the median of the red channel and potentially move on to test its upper boundary.
Trade global index CFDs with zero commission and tight spreads. Open your FXOpen account now or learn more about trading index CFDs with FXOpen.
This article represents the opinion of the Companies operating under the FXOpen brand only. It is not to be construed as an offer, solicitation, or recommendation with respect to products and services provided by the Companies operating under the FXOpen brand, nor is it to be considered financial advice.


