
Business
Alpinum Investment Management Q1 2026 Investment Letter

Lemon_tm/iStock via Getty Images

Summary Points
- A higher nominal world has emerged , driven by persistent fiscal deficits, rising protectionism and competitive currency devaluations leading to a higher equilibrium for inflation & interest rates.
- In the fourth quarter, global activity remained resilient , holding up despite renewed tariff pressures and persistent geopolitical tensions.
- The US economy saw moderate growth , easing inflation pressures, rising policy and trade uncertainty.
- European conditions improved modestly , though recovery remained uneven amid trade distortions, tighter fiscal policy and industrial softness.
- China and Asia faced late-cycle slowing growth and disinflation , with China still tracking 5%.
- Despite persistent uncertainty, 2025 proved constructive for multi-asset investors , with global equities posting strong double-digit gains, duration supported by peaking policy rates, and a weaker dollar boosting gold and non-US risk assets.
- Conclusion: With a severe recession unlikely , the positive bias on risky assets persists, despite increased volatility and potential conflicts under the Trump administration in the coming months. We emphasise capital preservation with opportunistic positioning, viewing rising volatility and dispersion across markets and sectors as catalysts for active management to capture alpha . Credit investments, particularly loans and non-cyclical short-term high-yield bonds offering 7–9% yields, remain preferred. We maintain a constructive stance on equities, where the current market environment favours an absolute return strategy over a traditional relative value approach.
Contents
2026: Will earnings back high valuations?
Global activity in Q4 2025 remained resilient despite tariff frictions and geopolitical flashpoints. In the US, softer but still positive growth , cooling inflation and Fed rate cuts, alongside the end of quantitative tightening, underpinned easier financial conditions even as data uncertainty from the record shutdown clouded the outlook. In Europe, modestly improving PMIs and German fiscal plans contrasted with weak earnings momentum , keeping the ECB on hold while peripheral spreads flickered wider. China continued to wrestle with weak domestic demand, property stress and consumer-price deflation , prompting targeted PBoC liquidity support but no wholesale stimulus, even as AI-linked equities and a partial tariff truce with Washington stabilised sentiment.
Chart 1: Total returns on global assets by calendar year
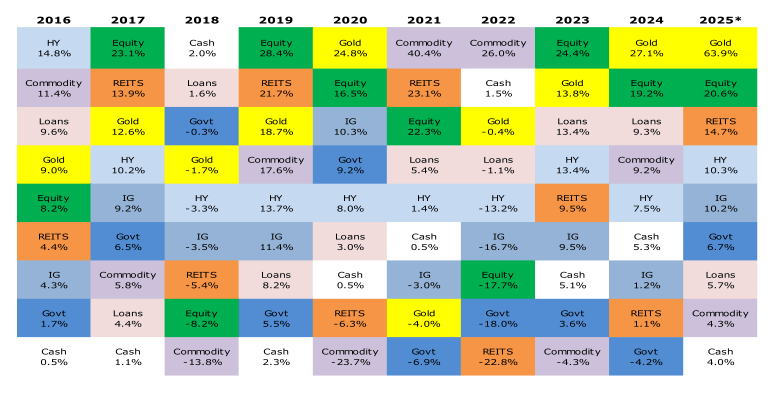
Source: Alpinum Investment Management | * Data as of December 16, 2025
Against this backdrop of policy noise, AI exuberance, rich valuations and fears of recession, 2025 nonetheless proved a constructive year for multi-asset investors : global equities delivered solid double-digit gains, duration benefitted from a synchronised peak in policy rates, and a weaker dollar supported gold and non-US risk assets. Looking into 2026 , concerns are greater – from potential inflation re-acceleration to a tiring consumer – yet the key question is whether earnings can ultimately justify elevated equity valuations , a theme we will revisit in this Quarterly Investment Letter.
United States
In Q4 2025, the US economy was characterised by slowing but still positive activity, disinflationary trends and intensifying policy and trade uncertainty . A record-long federal government shutdown delayed official data and weighed on confidence, while private indicators pointed to a softening labour market: payroll gains decelerated, unemployment rose to 4.4% and job cuts surged, even as jobless claims remained contained. Growth became increasingly two-speed , with higher-income households sustaining consumption, while weaker retail sales and plunging sentiment signalled fatigue further down the income distribution. Inflation data surprised benignly . September CPI and PPI prints undershot expectations, core goods and services disinflated and producer pipeline pressures eased, reinforcing the view that tariff-related cost shocks were compressing margins rather than reigniting a broad inflation upswing. The administration oscillated between aggressive tariff announcements and tactical truces , using tariff relief on selected goods to offset domestic inflation and to advance geopolitical objectives. Financial markets navigated this ‘bad news is good news’ equilibrium.
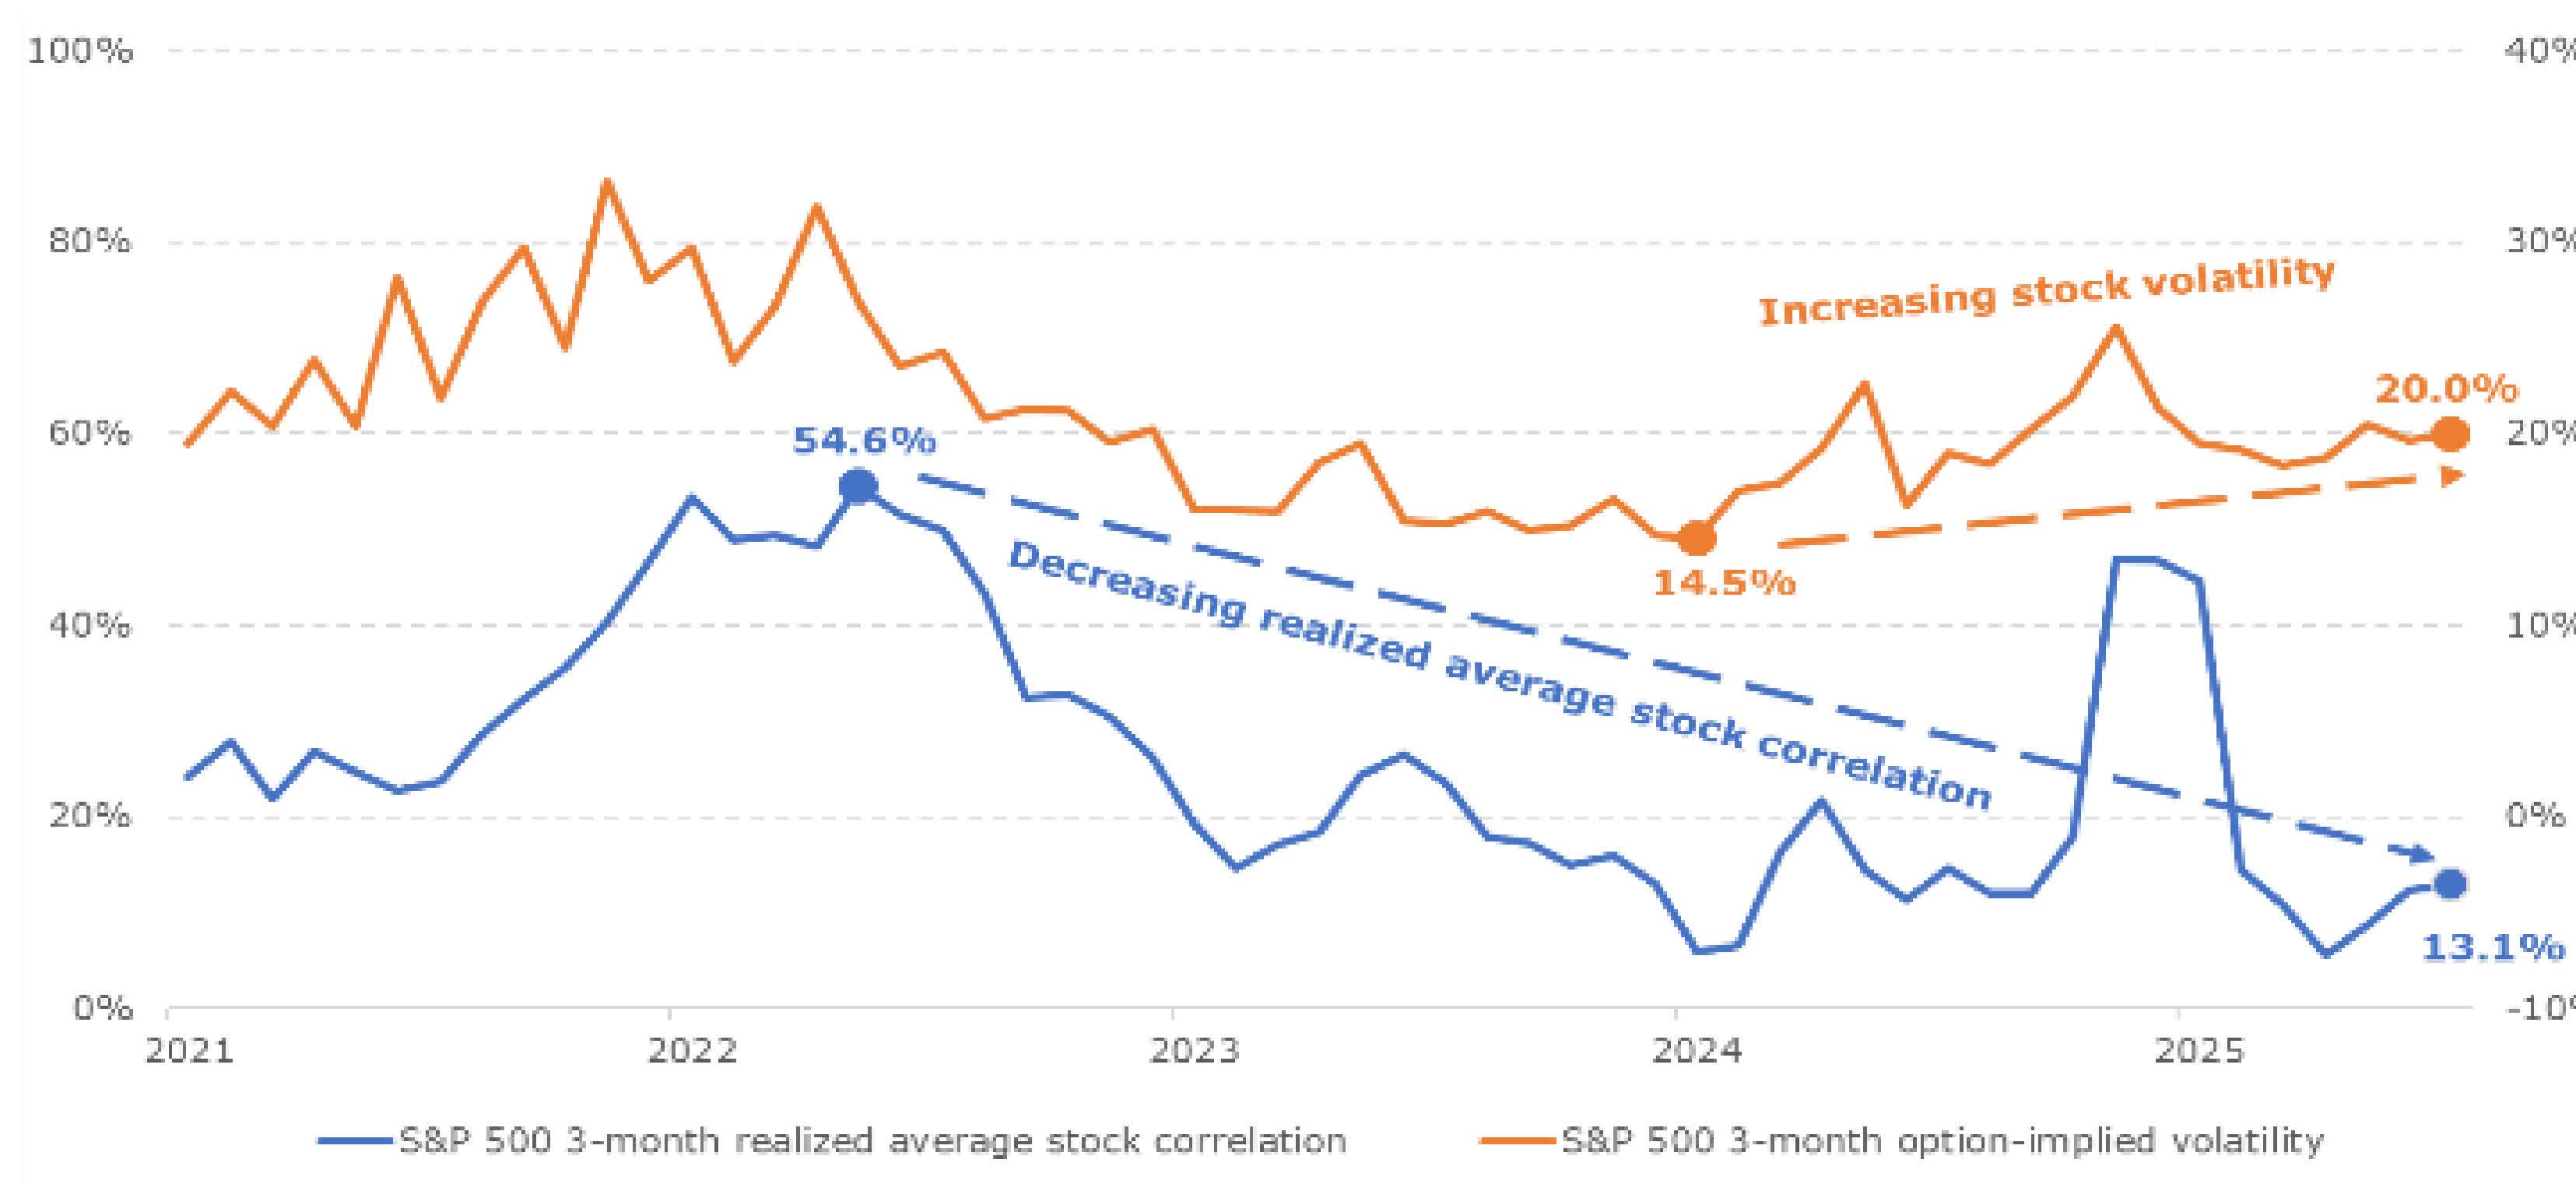
Chart 2: Equity market volatility in 2025
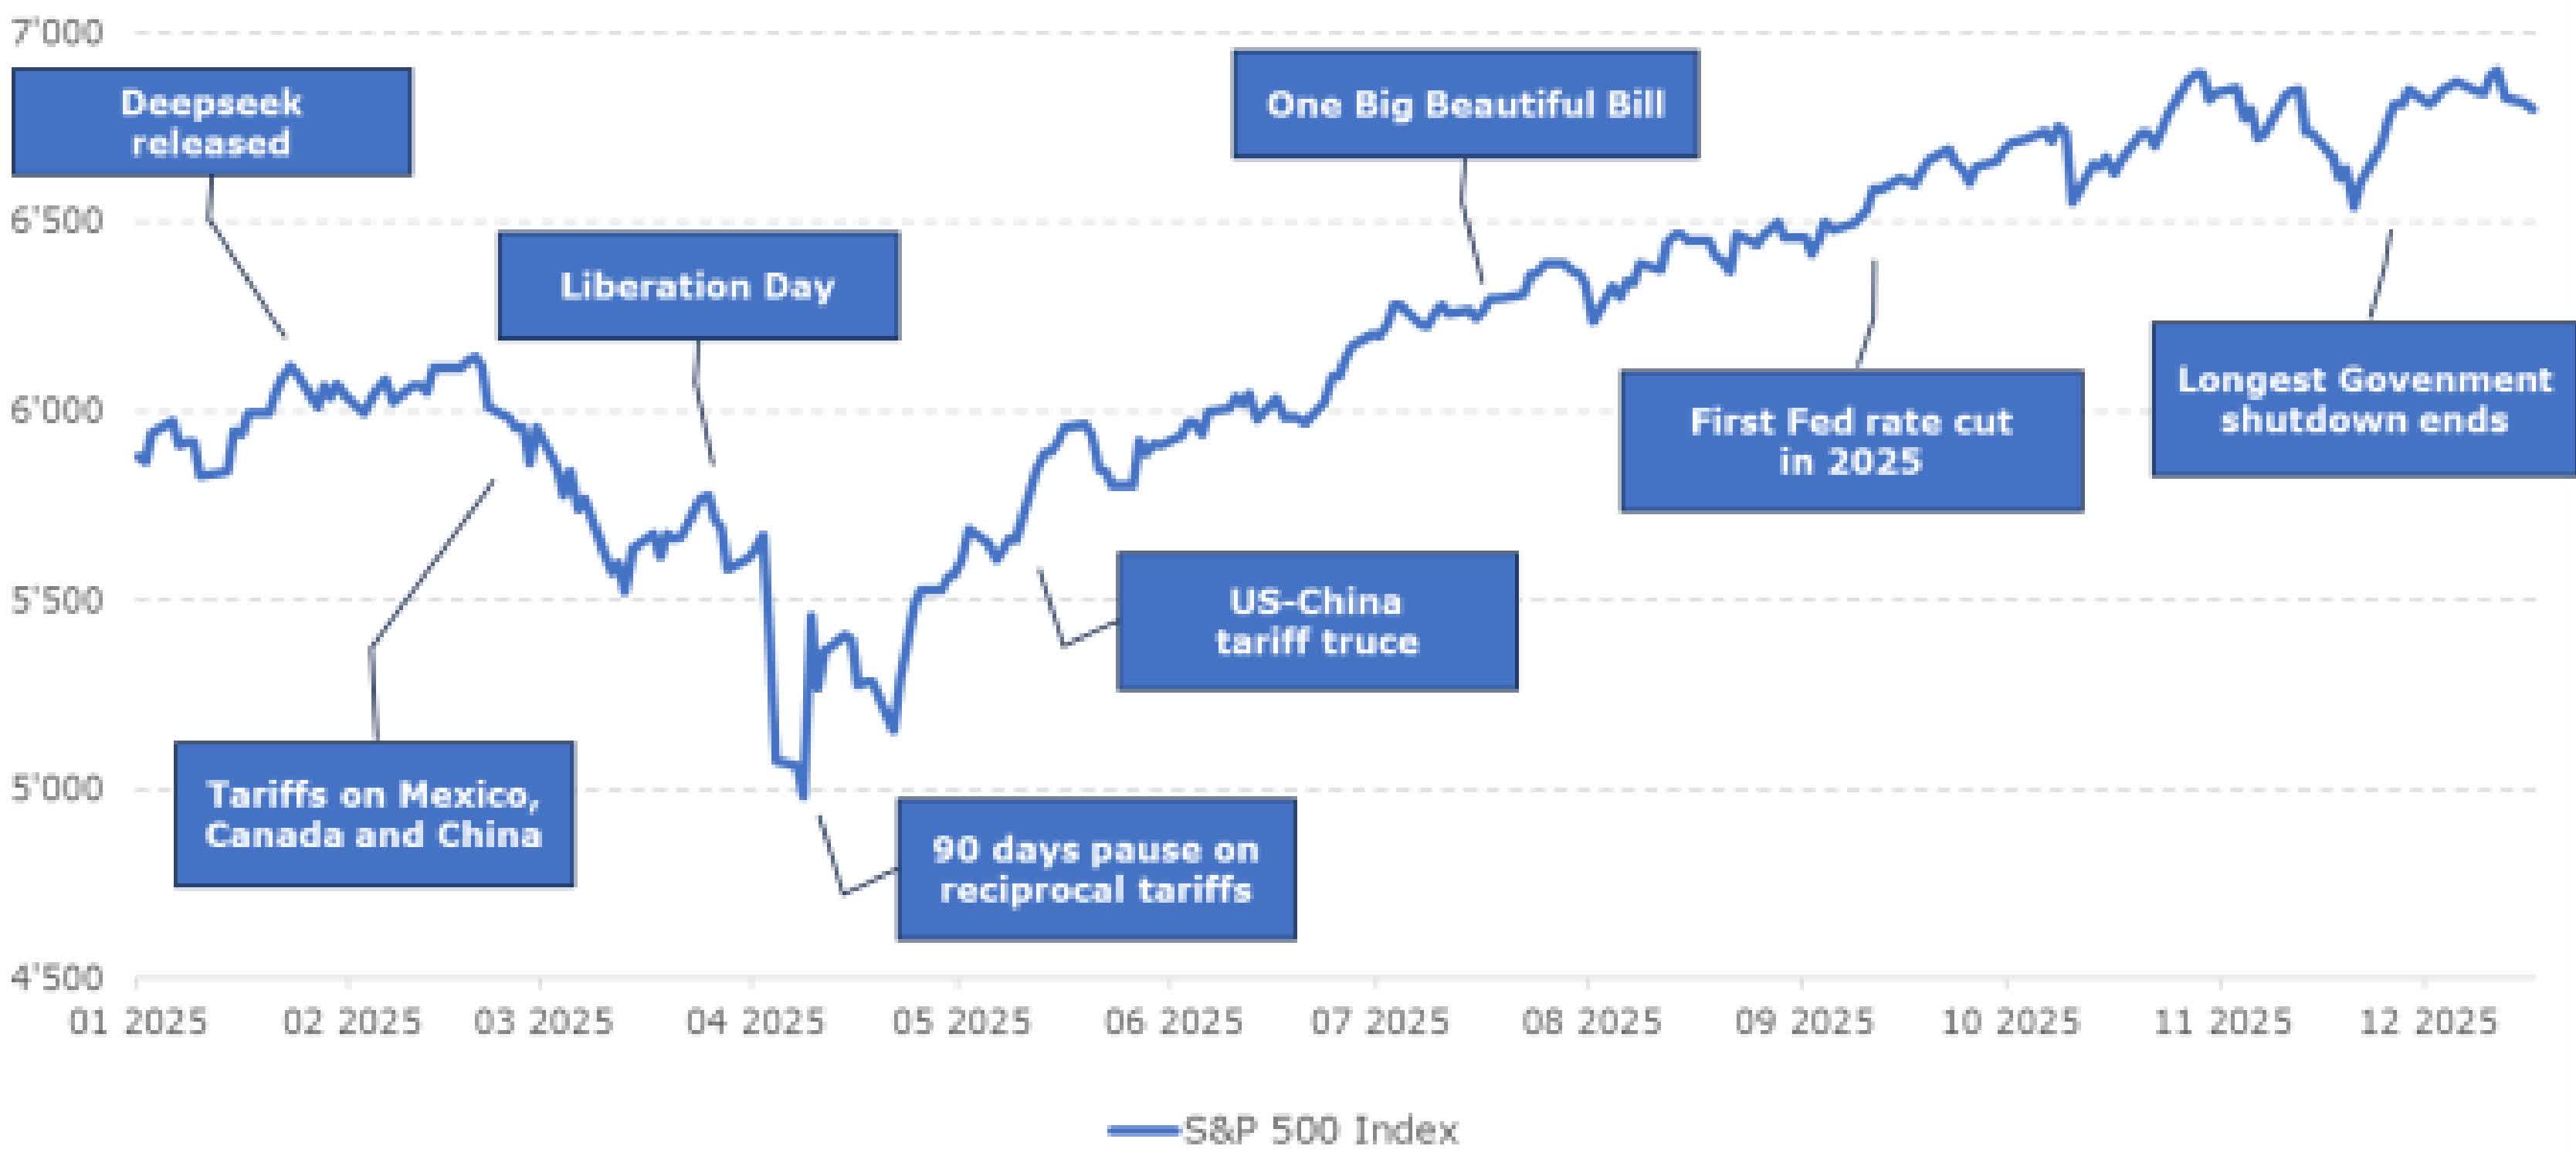
Source: Alpinum Investment Management
US equities extended year-to-date gains to high-teens percentages , although November saw rotation into defensive sectors as valuations and tech concentration drew greater scrutiny. The Federal Reserve cut rates by 25 bps in October and December to 3.50%–3.75% and formally concluded quantitative tightening. US Treasuries outperformed credit as disinflation, uncertainty around the shutdown’s growth impact and rising expectations of additional 2026 easing drove a bull-steepening of the curve. Credit spreads traded sideways to become modestly wider , reflecting healthy, but no longer accelerating, earnings and growing investor focus on late-cycle risks and liquidity premia repricing.
Europe
Economic conditions in Europe improved modestly, though the recovery remained uneven and heavily influenced by external trade distortions, tightening fiscal stances and lingering industrial fragilities . Eurozone activity indicators positively surprised early in the quarter, with the HCOB Composite PMI rising to a 17-month high of 52.5 in October as services strengthened meaningfully and manufacturing finally stabilised around the 50 threshold. However, momentum softened again into November, with the HCOB Manufacturing PMI easing to 49.6 returning to mild contraction, pressured by intensifying Chinese competition and the cumulative effect of US tariffs on high-value European exports. Inflation continued its glide towards its target . Eurozone headline CPI held steady, coming in at 2.1% in October and 2.2% in November, while core remained stickier, particularly in services, complicating the ECB’s ability to guide markets towards a clearer easing trajectory. Nonetheless, resilient labour markets, improving new-order growth and expectations of German and Italian fiscal support helped maintain a cautiously constructive backdrop.
Chart 3: Outperformance of value vs growth in Europe
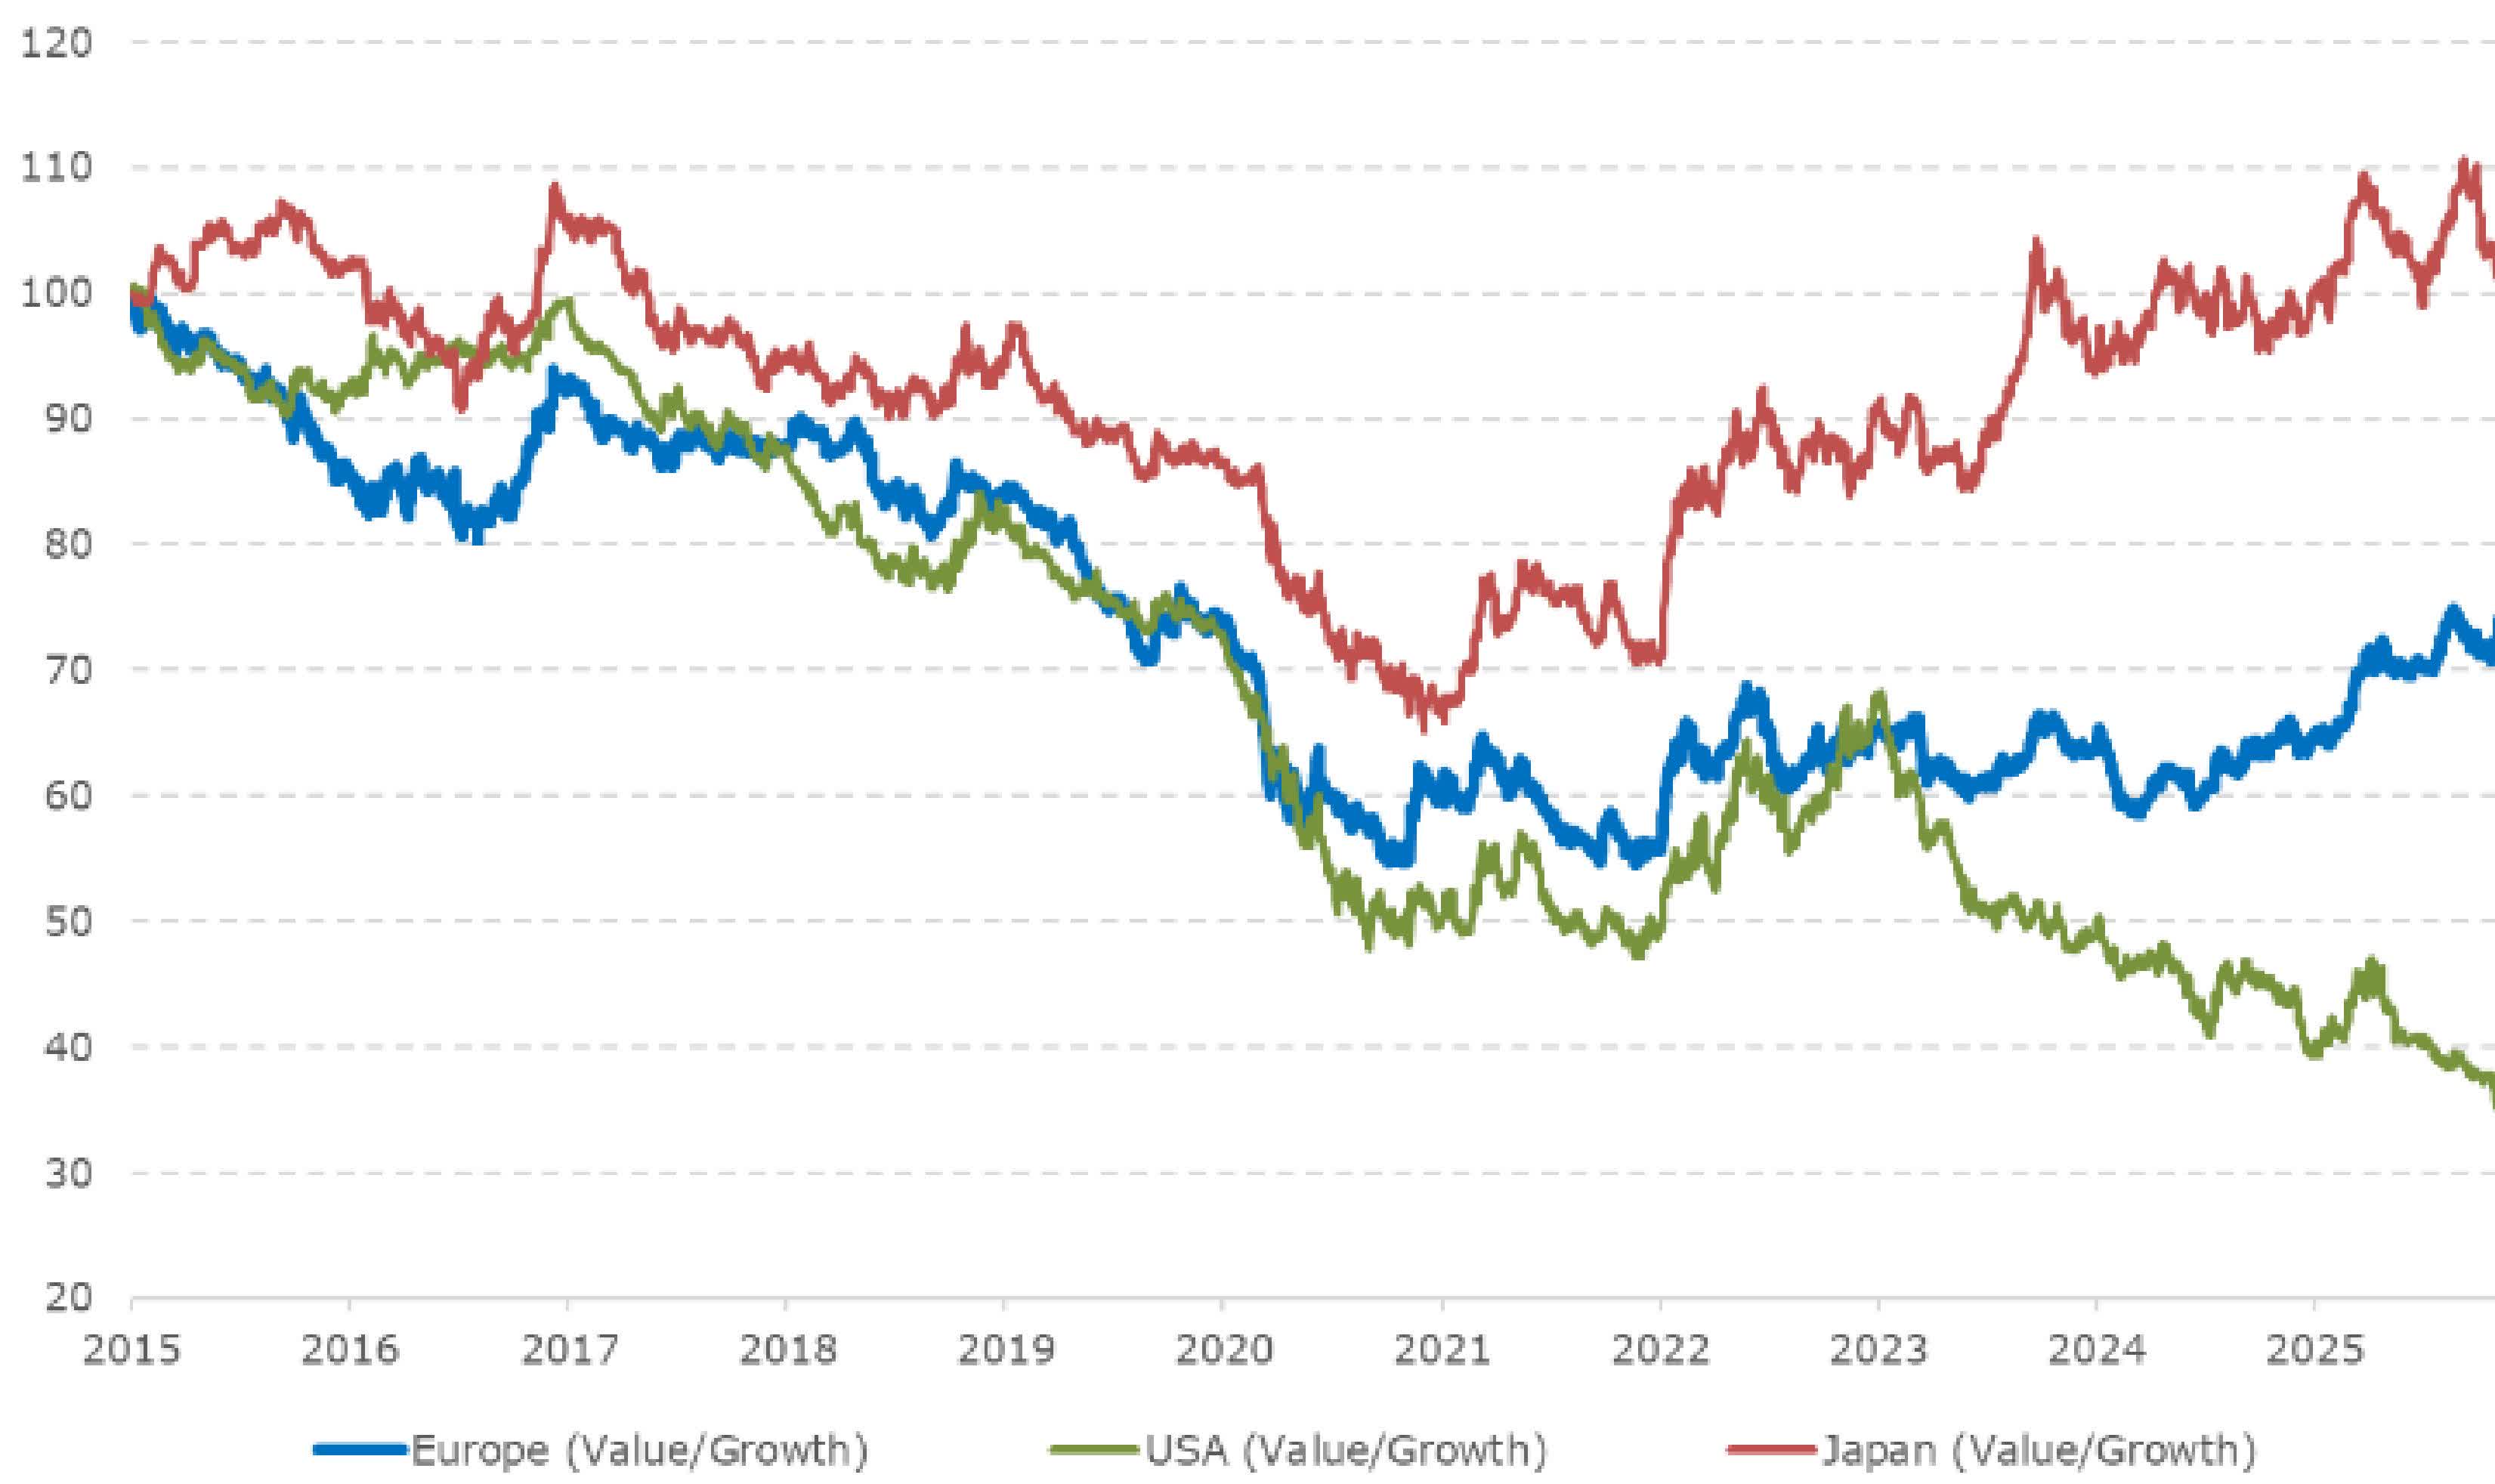
Source: Alpinum Investment Management
Bond markets reflected the region’s mixed macro signals . Bund yields edged higher as rate-cut expectations receded, while peripheral spreads tightened on improving sentiment and contained political risk. Equities advanced through October , led by earnings resilience and easing trade tensions, but stalled in November as defensive sectors outperformed and valuation concerns resurfaced. Across Europe, the quarter ultimately reaffirmed a fragile but stabilising growth trajectory yet still constrained by tight financial conditions, external trade headwinds, and persistent structural disparities among member states.
China and emerging markets (EM)
In Q4 2025, China and broader Asia navigated a late-cycle environment characterised by slowing but still positive growth, disinflation and increasingly policy-dependent risk sentiment . China’s economy remained broadly on track for 5% full-year growth after Q3 GDP expanded 4.8% year on year, even as sequential momentum cooled amid weaker domestic demand and persistent housing stress. Official and private PMIs oscillated around the 50 threshold , with manufacturing stuck in mild contraction and non-manufacturing slipping below 50 in November, underscoring services and construction activity despite resilient exports and supply-chain re-routing. Against this backdrop, the PBoC maintained an accommodative stance , keeping policy rates and the loan prime rate unchanged while relying on targeted liquidity injections, window guidance and incremental housing support to stabilise the property sector. Deflationary pressures gradually moderated as headline CPI returned to positive territory and producer price deflation narrowed, yet the inflation profile stayed benign relative to developed markets, reinforcing a bias towards further easing if growth disappoints.
Chart 4: Historical correlation between EM and the US dollar
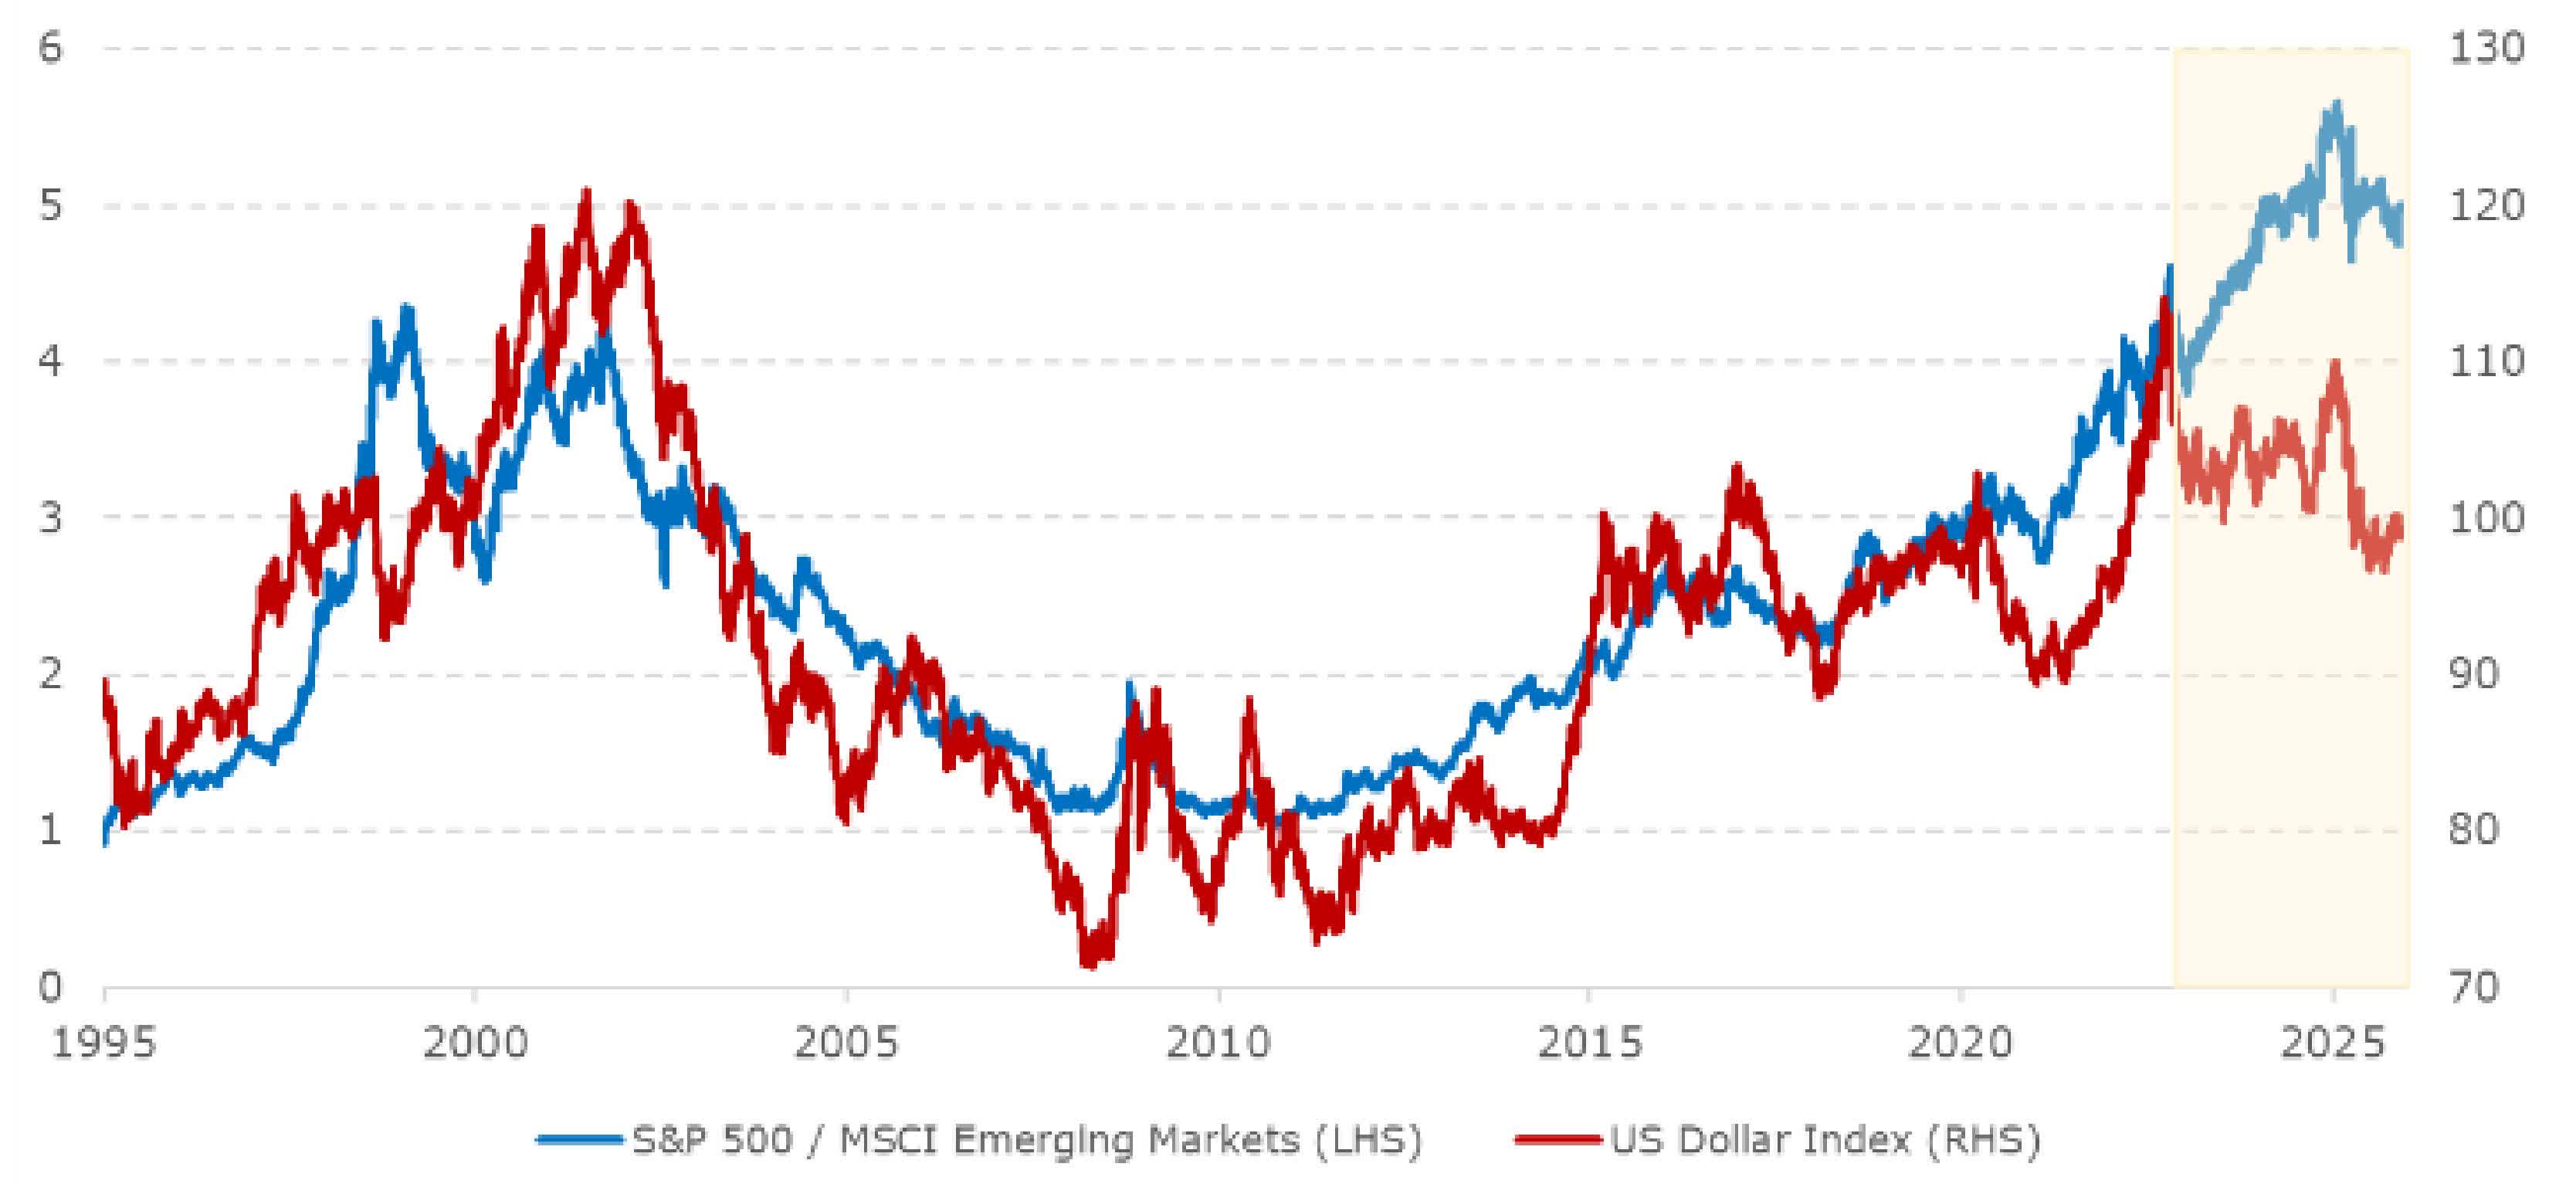
Source: Alpinum Investment Management
Across regional markets, Asia ex-Japan equities modestly outperformed global peers over the quarter, supported by strong AI-related demand in Taiwan and Korea, solid earnings and renewed foreign inflows whenever US-China trade rhetoric de-escalated. Mainland Chinese equities lagged behind broader Asia as lingering concerns over property, local government debt and regulatory unpredictability kept risk premia elevated despite attractive valuations. Asian local-currency government bonds benefitted from subdued inflation and a Fed easing bias, with onshore Chinese government bonds in particular supported by entrenched disinflation and a relatively firm renminbi, cementing their role as a regional duration and diversification anchor within multi-asset portfolios.
Investment conclusions
The global economy continues to ‘muddle through’ with growth proving resilient despite trade frictions and policy uncertainty. The base case remains unchanged and the probability of a deep US recession is low. Looking ahead to 2026, a moderate re-acceleration in global activity could revive cyclical inflation, capping valuation upside and placing greater emphasis on corporate earnings , for which expectations remain constructive. A structurally higher-nominal environment , marked by persistent fiscal deficits, protectionism and currency realignment, will amplify dispersion and sharpen the divide between winners and losers. In this setting, disciplined security selection and agile portfolio management become essential. We prioritise capital preservation while using volatility and dispersion as fertile ground for Liquid Alternatives to generate alpha .
Chart 5: Appealing environment for Liquid Alternatives
Source: Alpinum Investment Management
Bonds: Near-term defaults may tick higher, but a major default wave is not in the cards. Credit spreads, though tight, have modest room to widen , potentially creating better entry levels. The outlook beyond 2025 is constructive, and we maintain a preference for short-duration high yield and senior secured loans , offering attractive carry with limited duration risk.
Equities: Equity markets face headwinds from US policy uncertainty, elevated valuations, and margin pressures, though resilient consumption underpins earnings. Into 2026, improving fundamentals support valuations and justify selective rotation towards non-US markets, incl. EMs .
Our tactical approach emphasises balance , with a slight preference for value and cyclicals amid resilient growth. Duration is neutral , maintaining a slightly underweight positioning in IG bonds and USTs, while favouring short-term HY, loans and selective below-IG bonds and hybrids.
Market Consensus Forecasts
Performance table
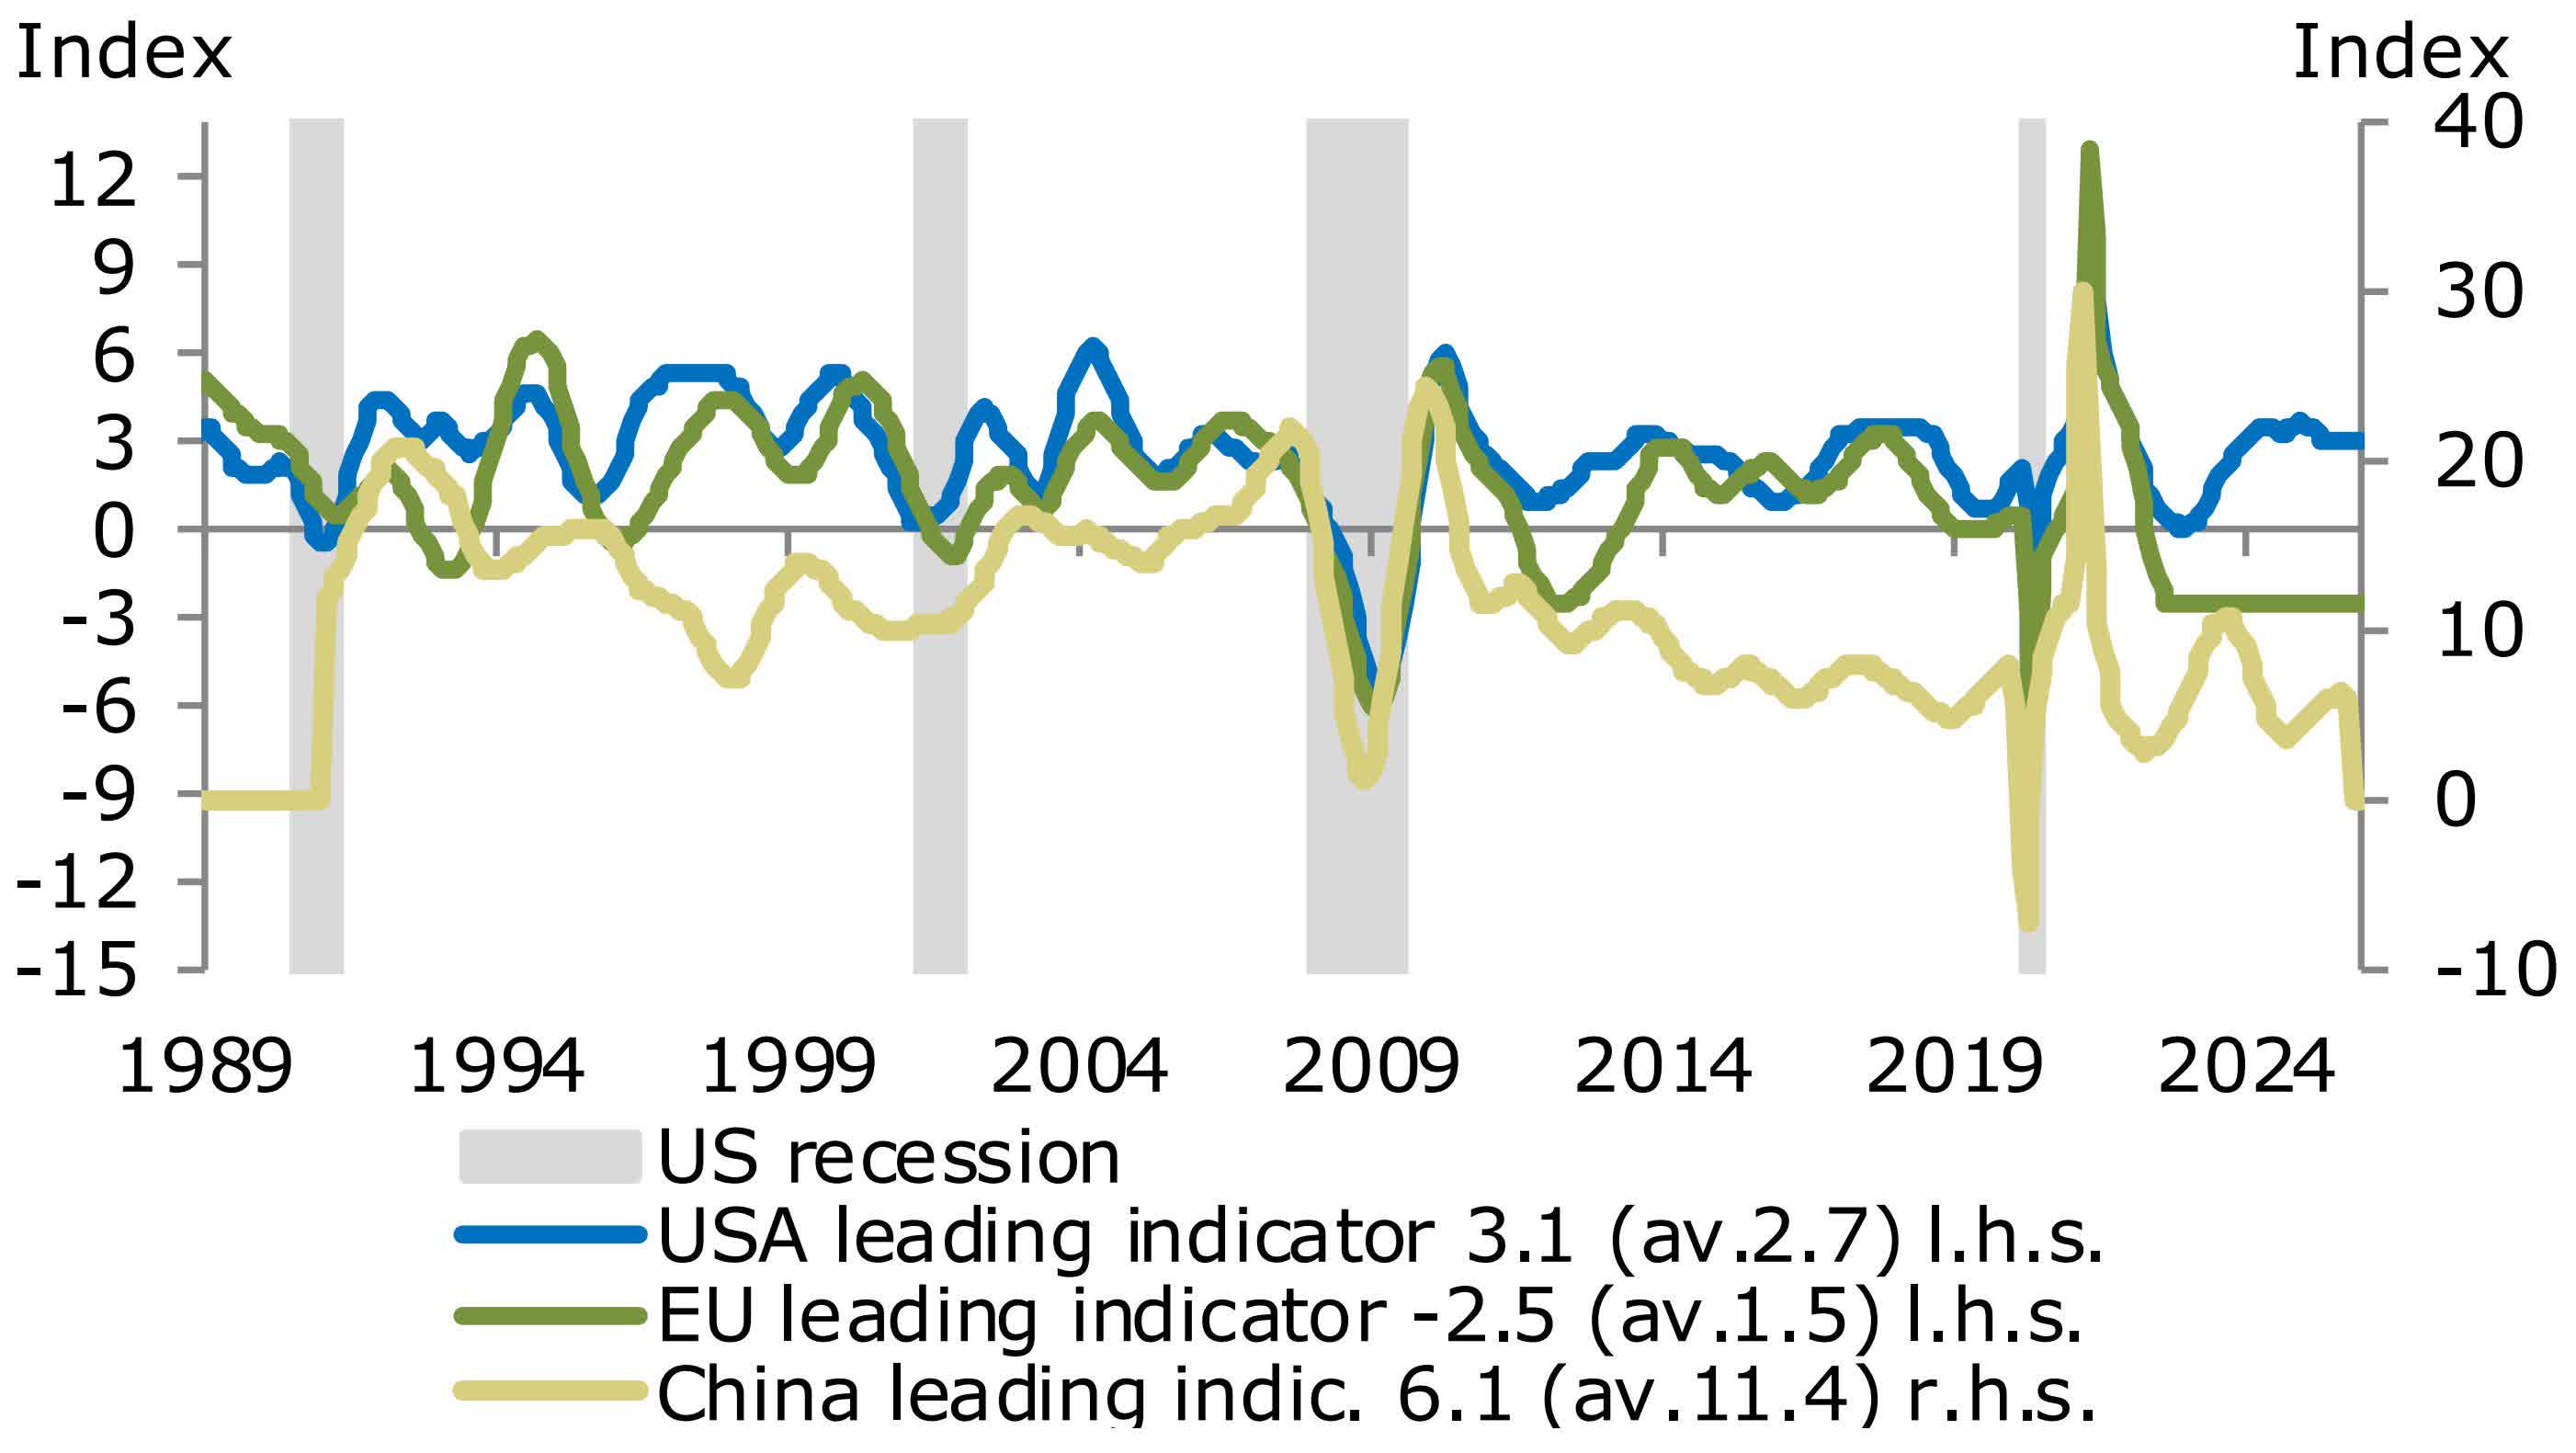
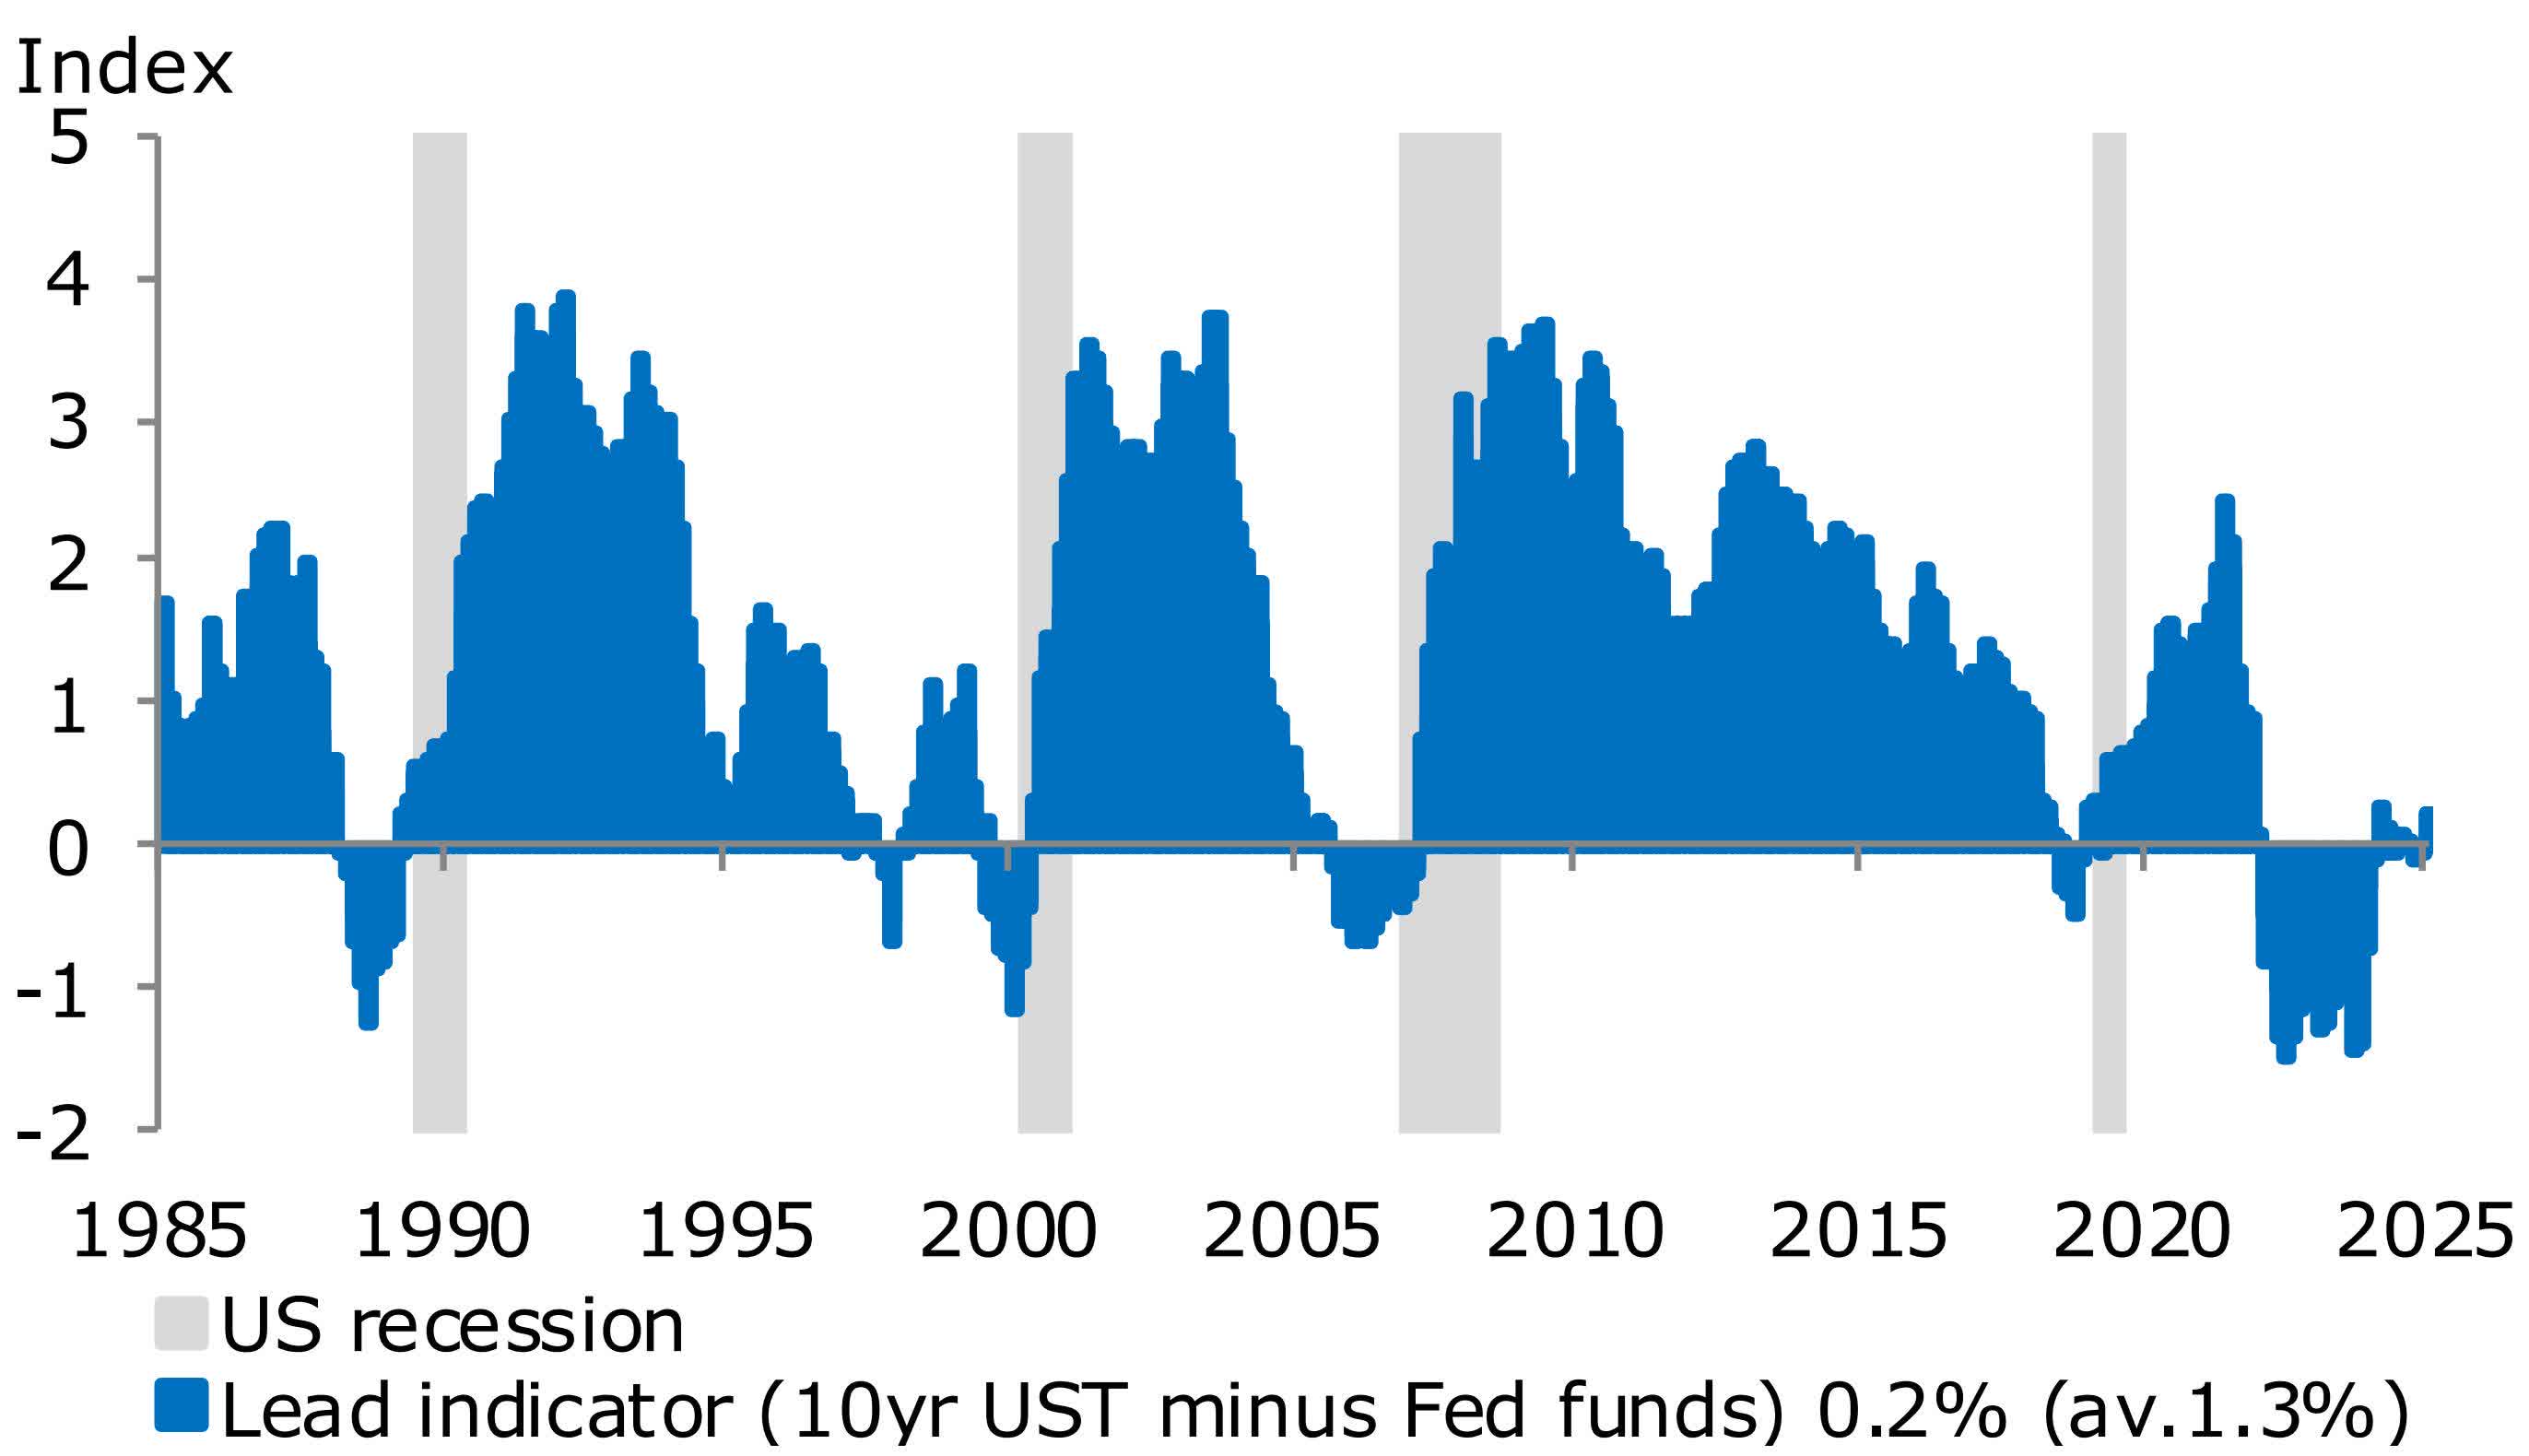
Key Economic Charts
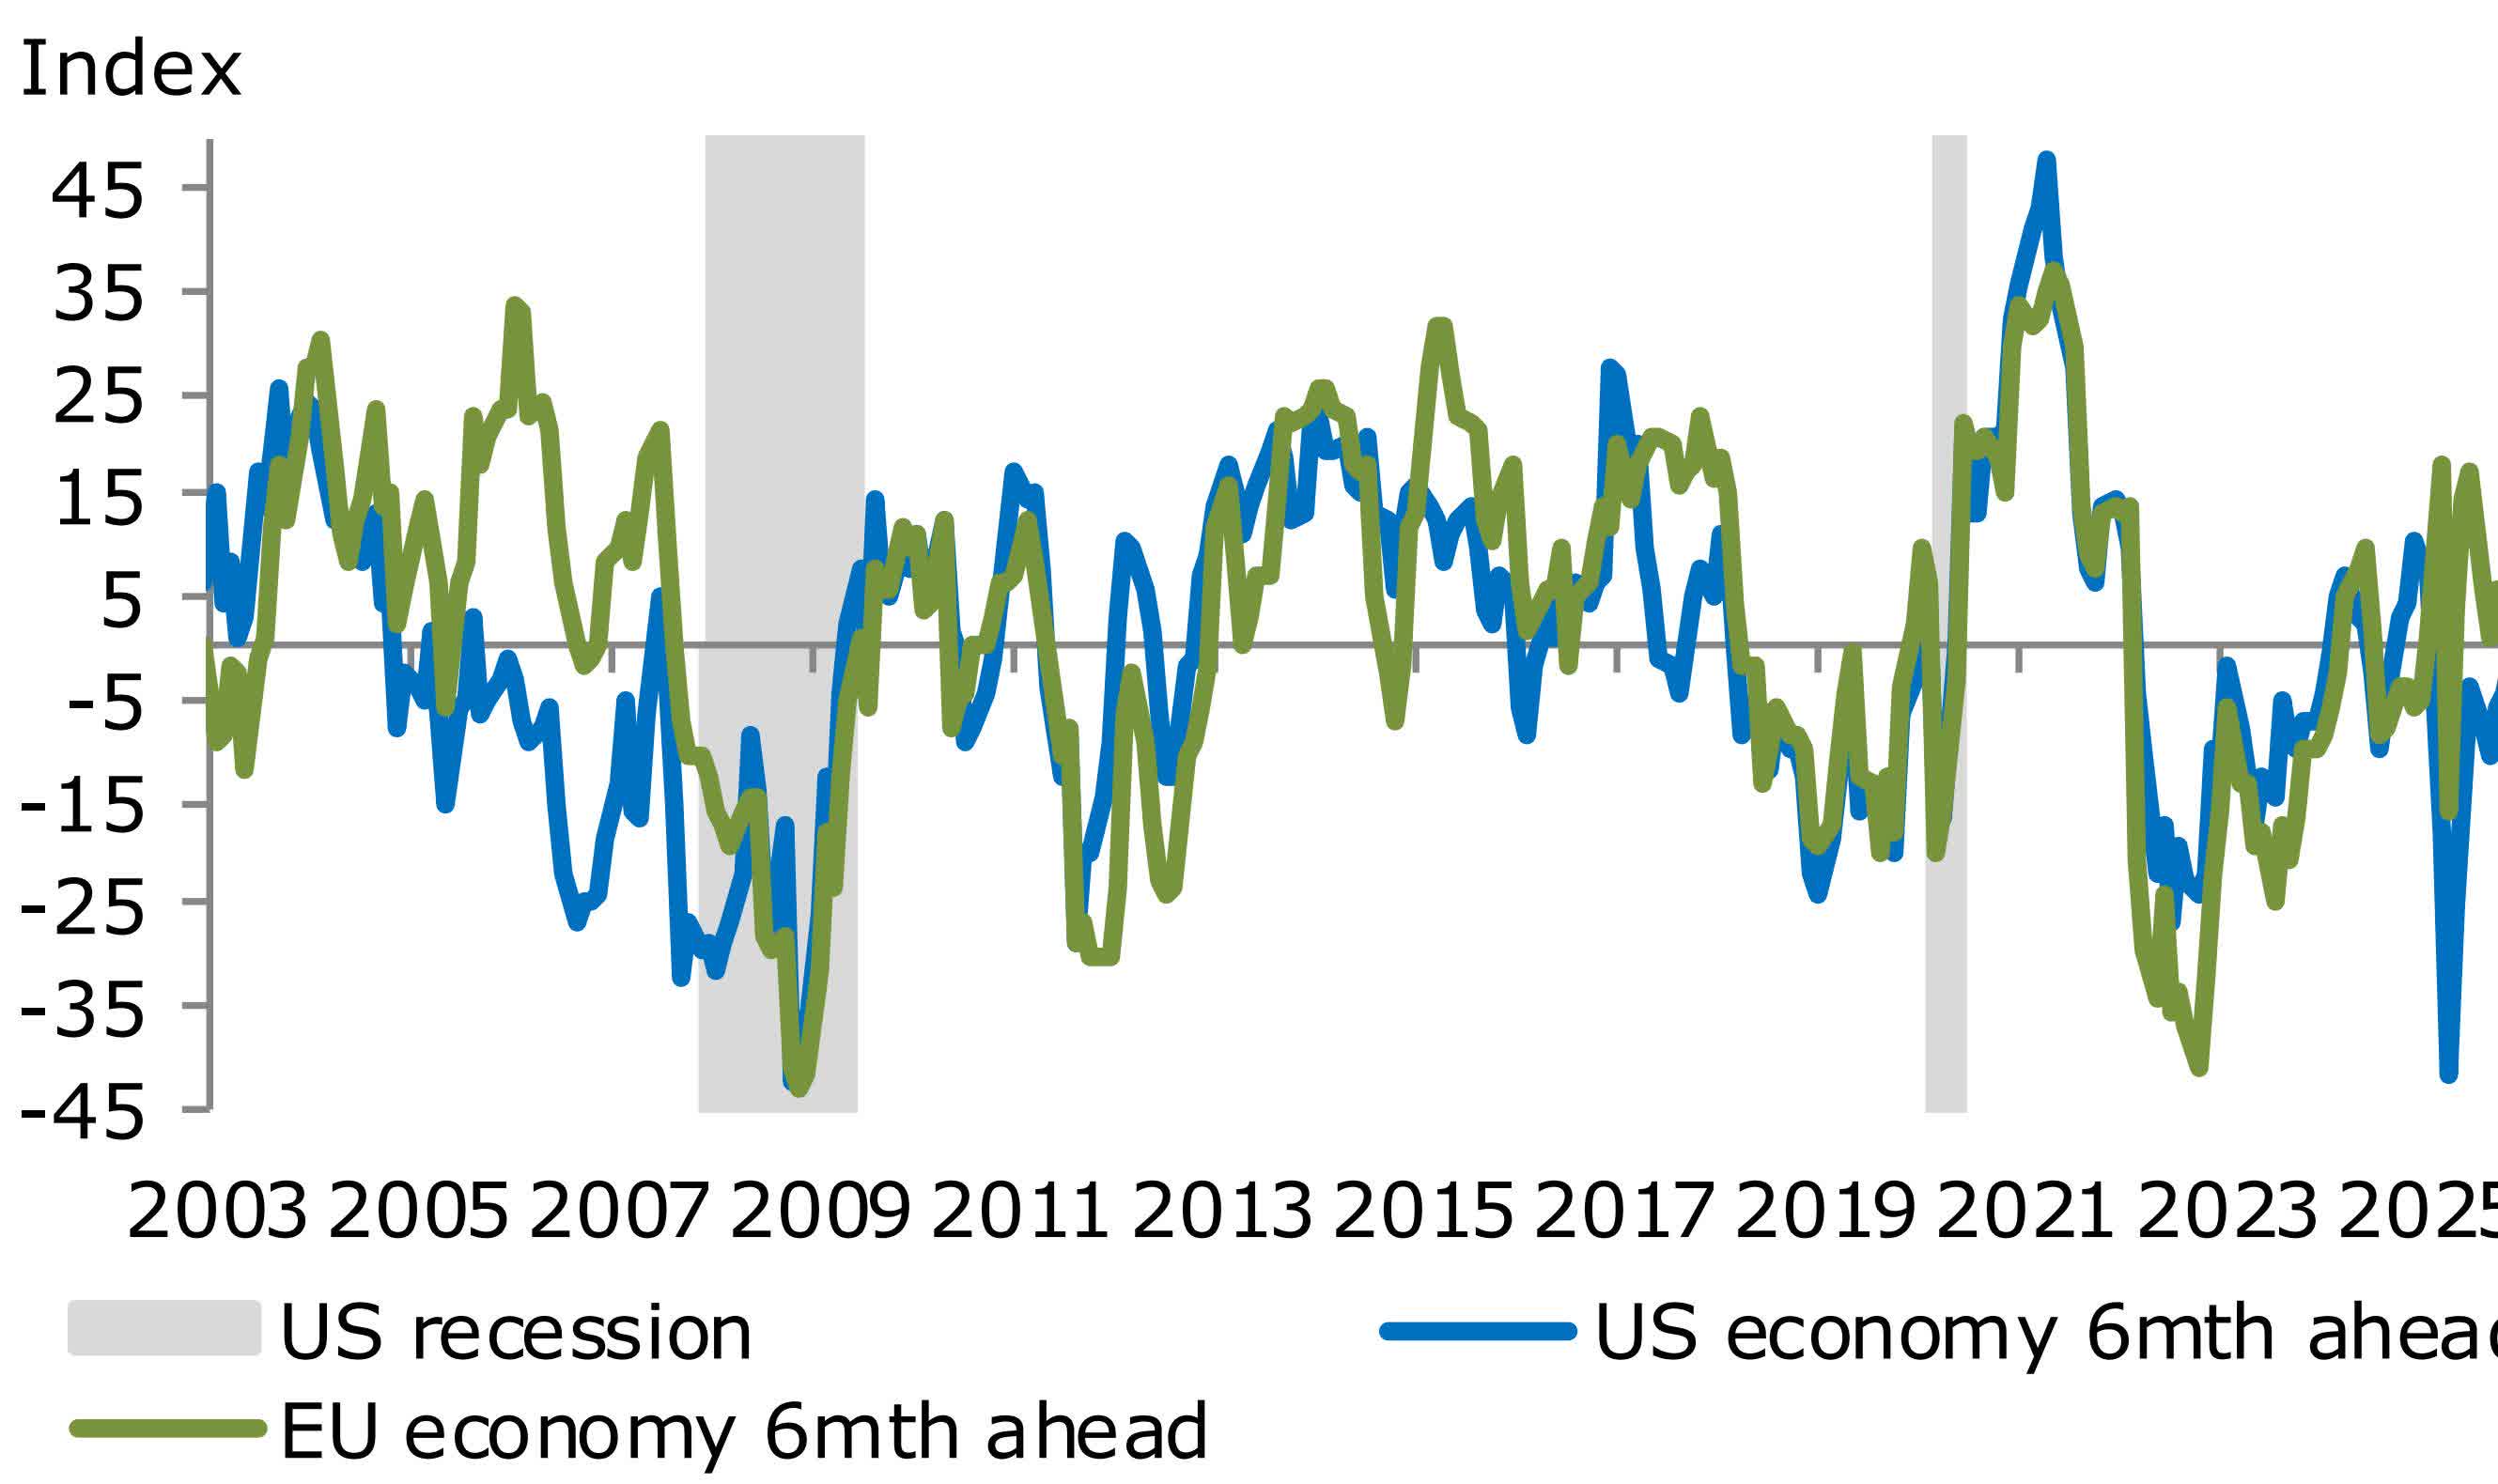
Leading indicators and manufacturing
Recession indicator
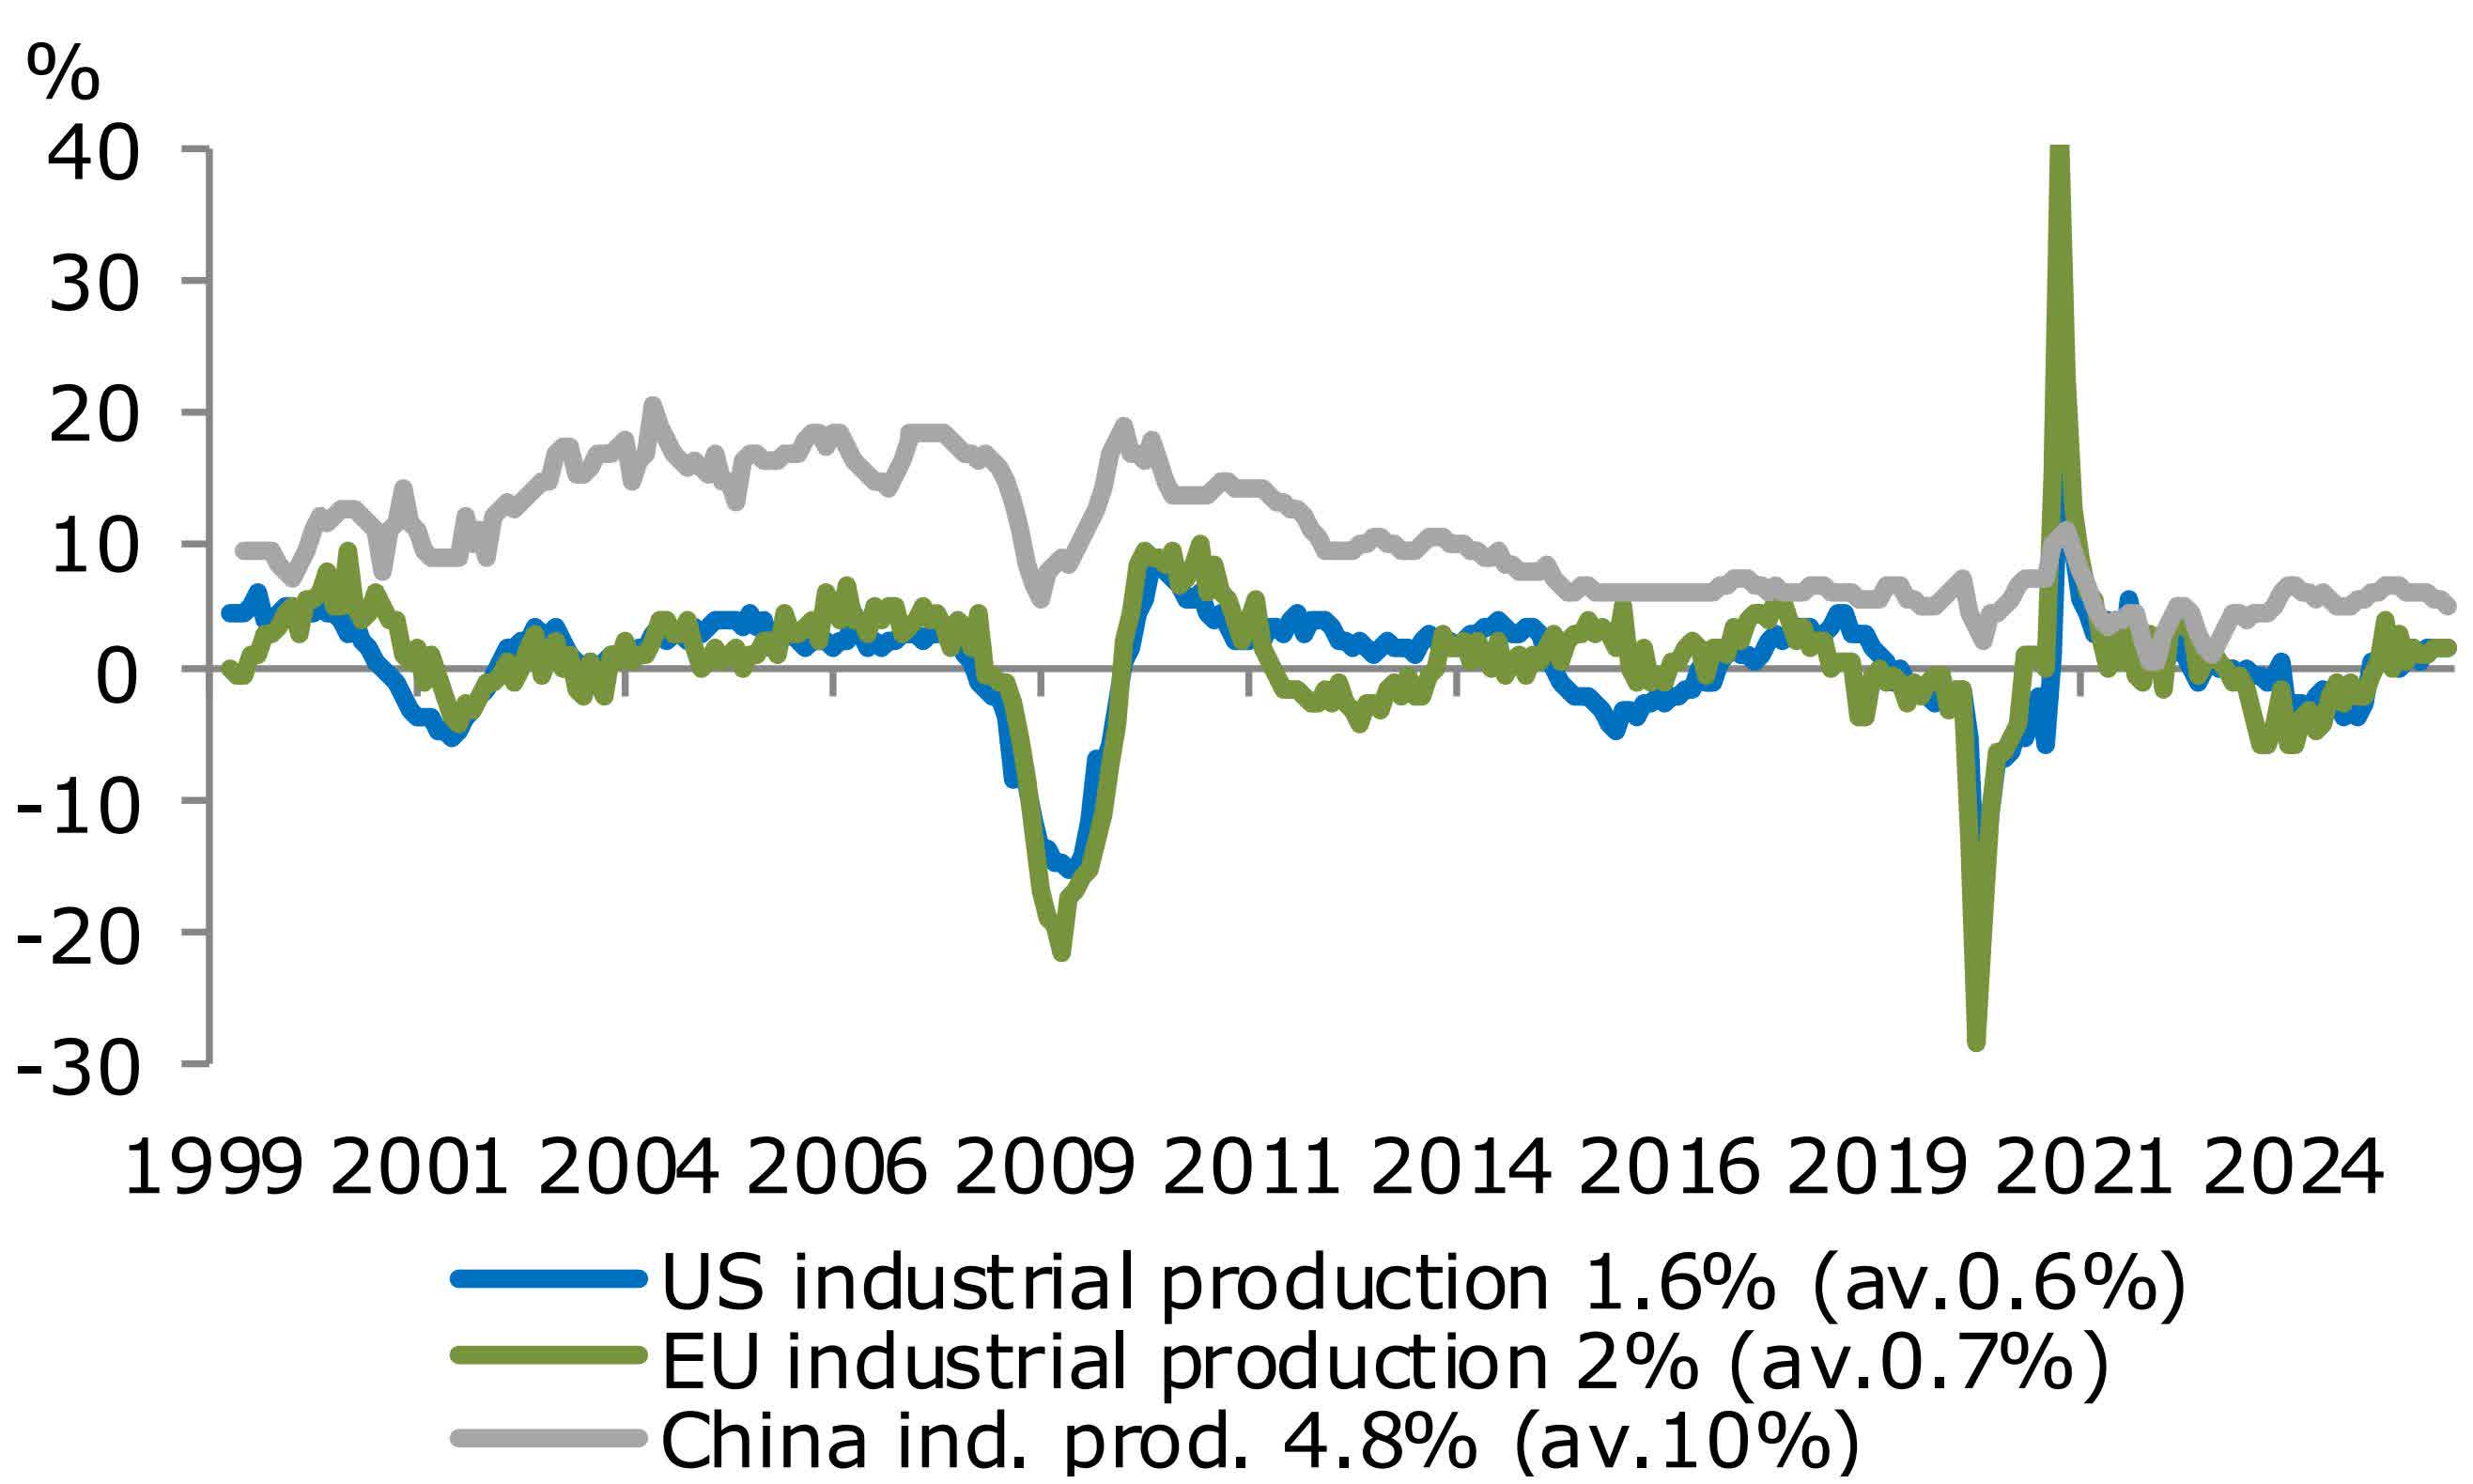
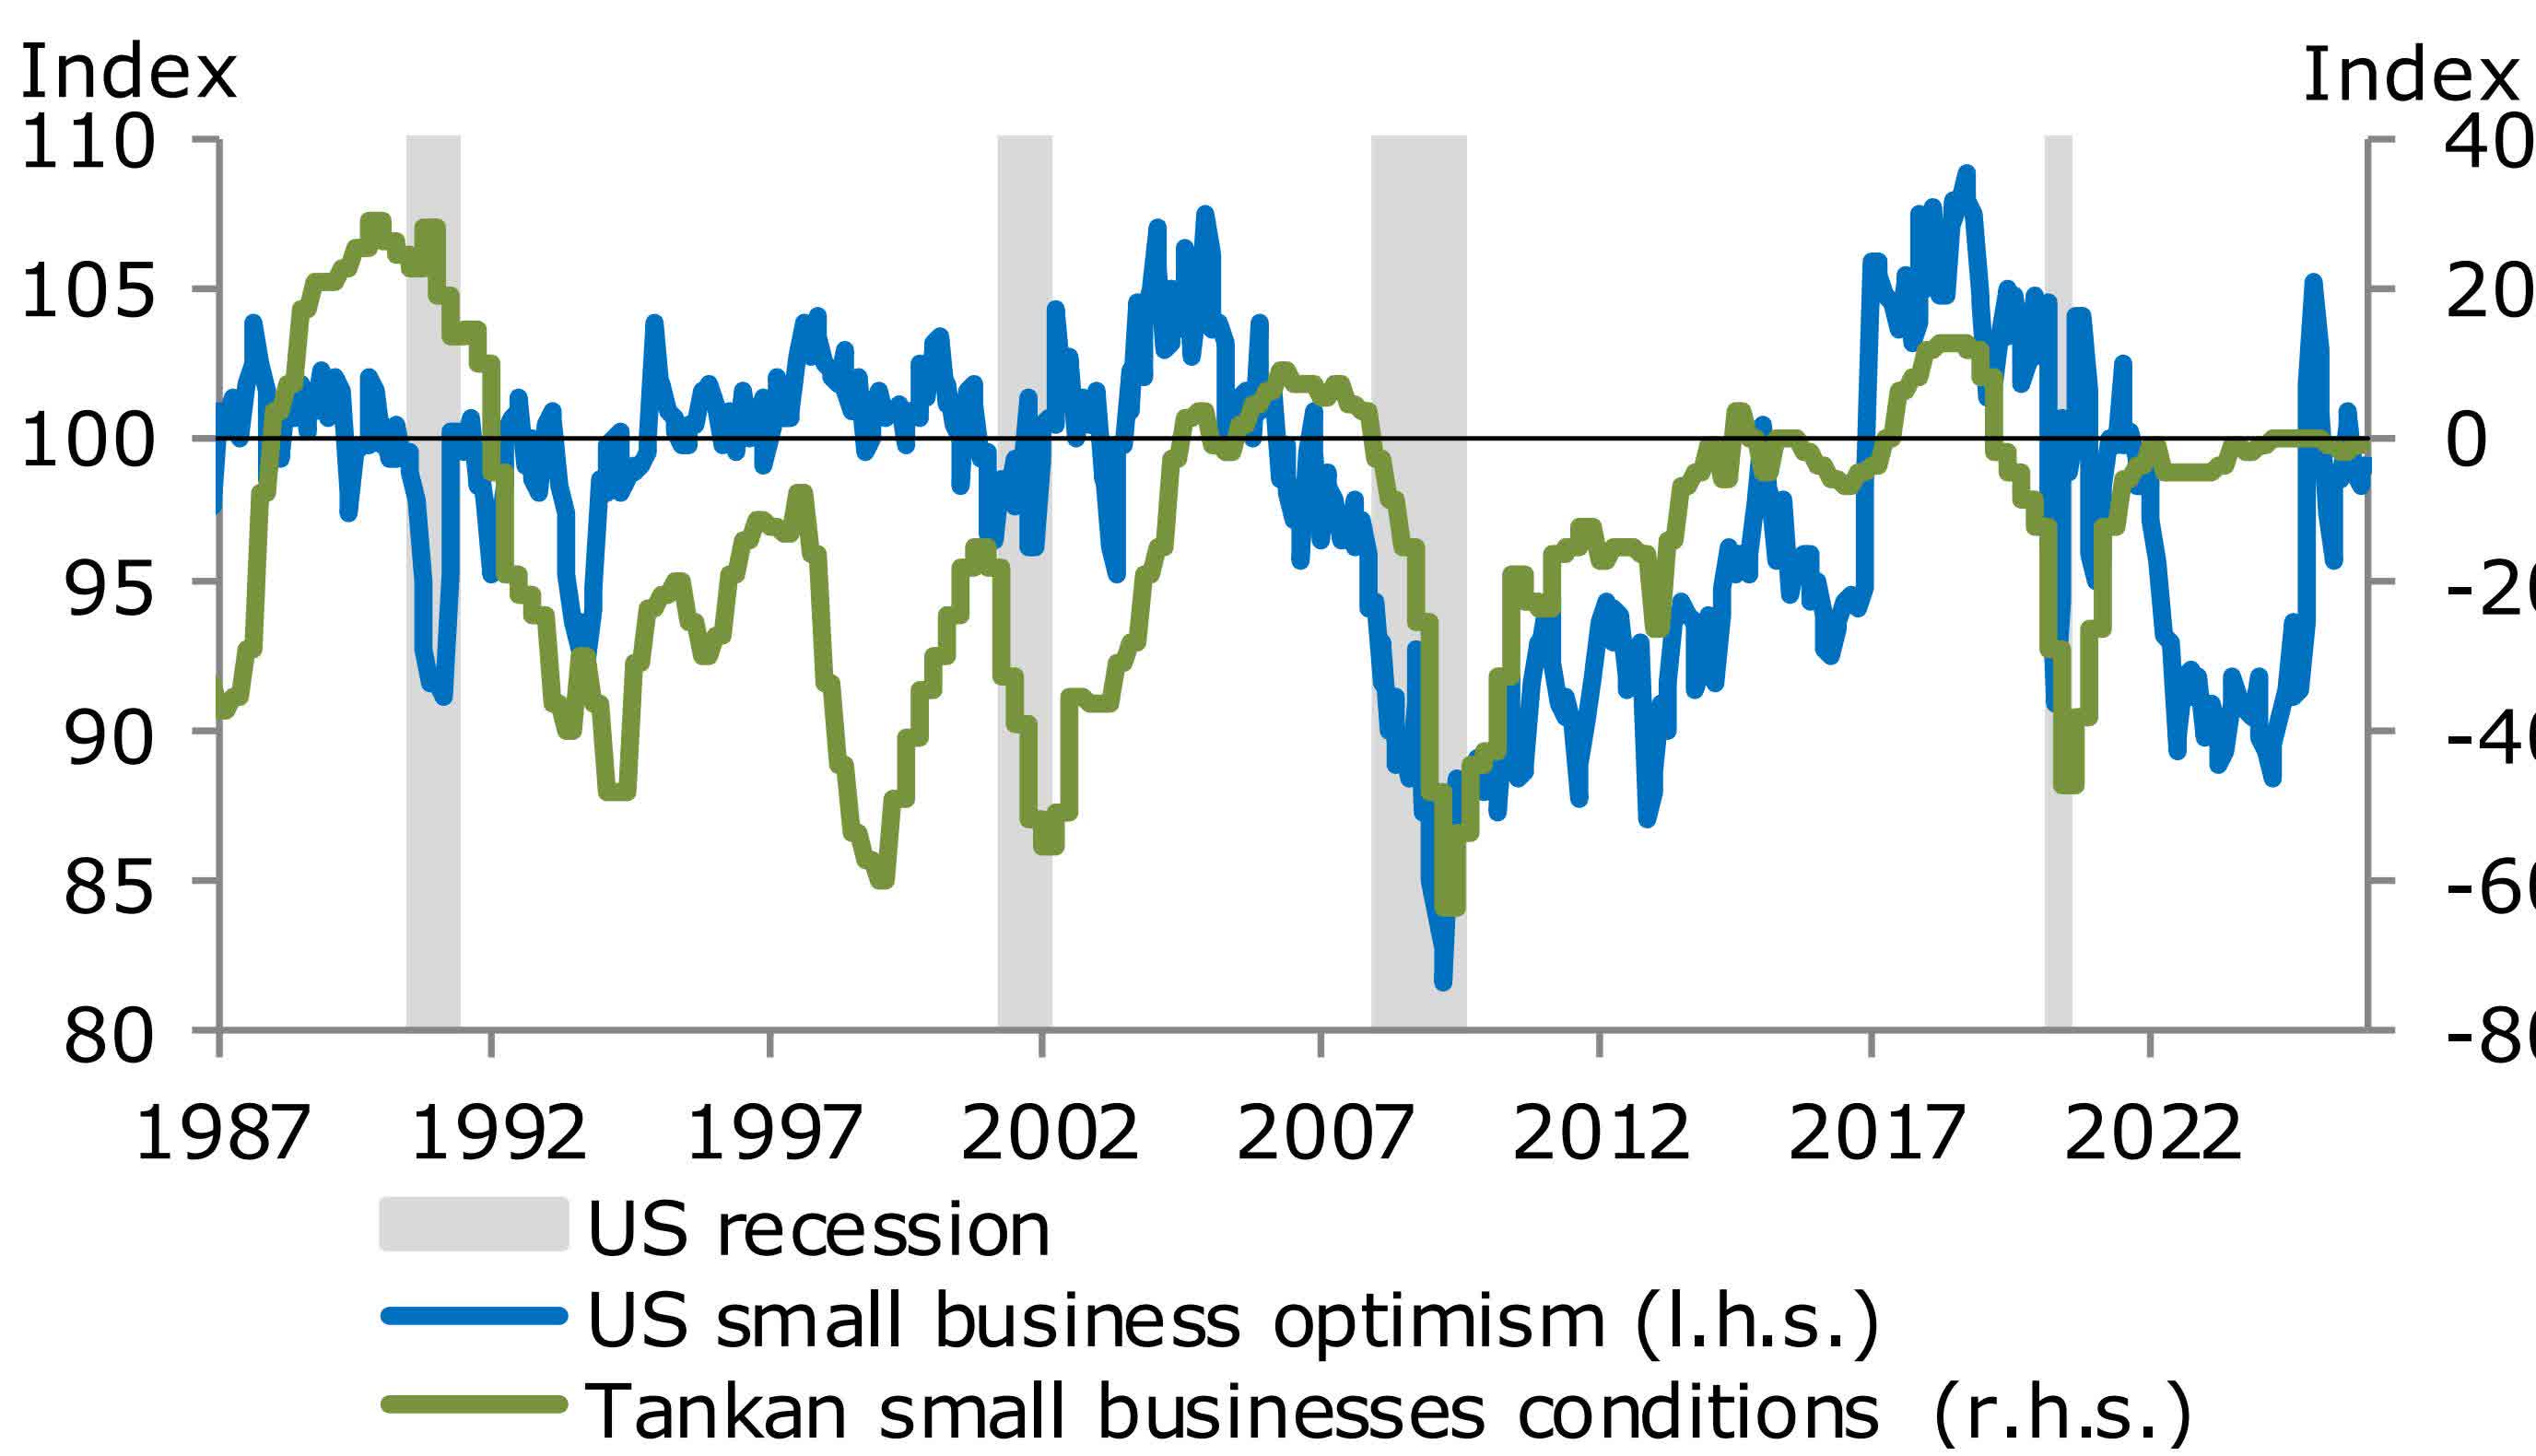
Industrial production and small businesses
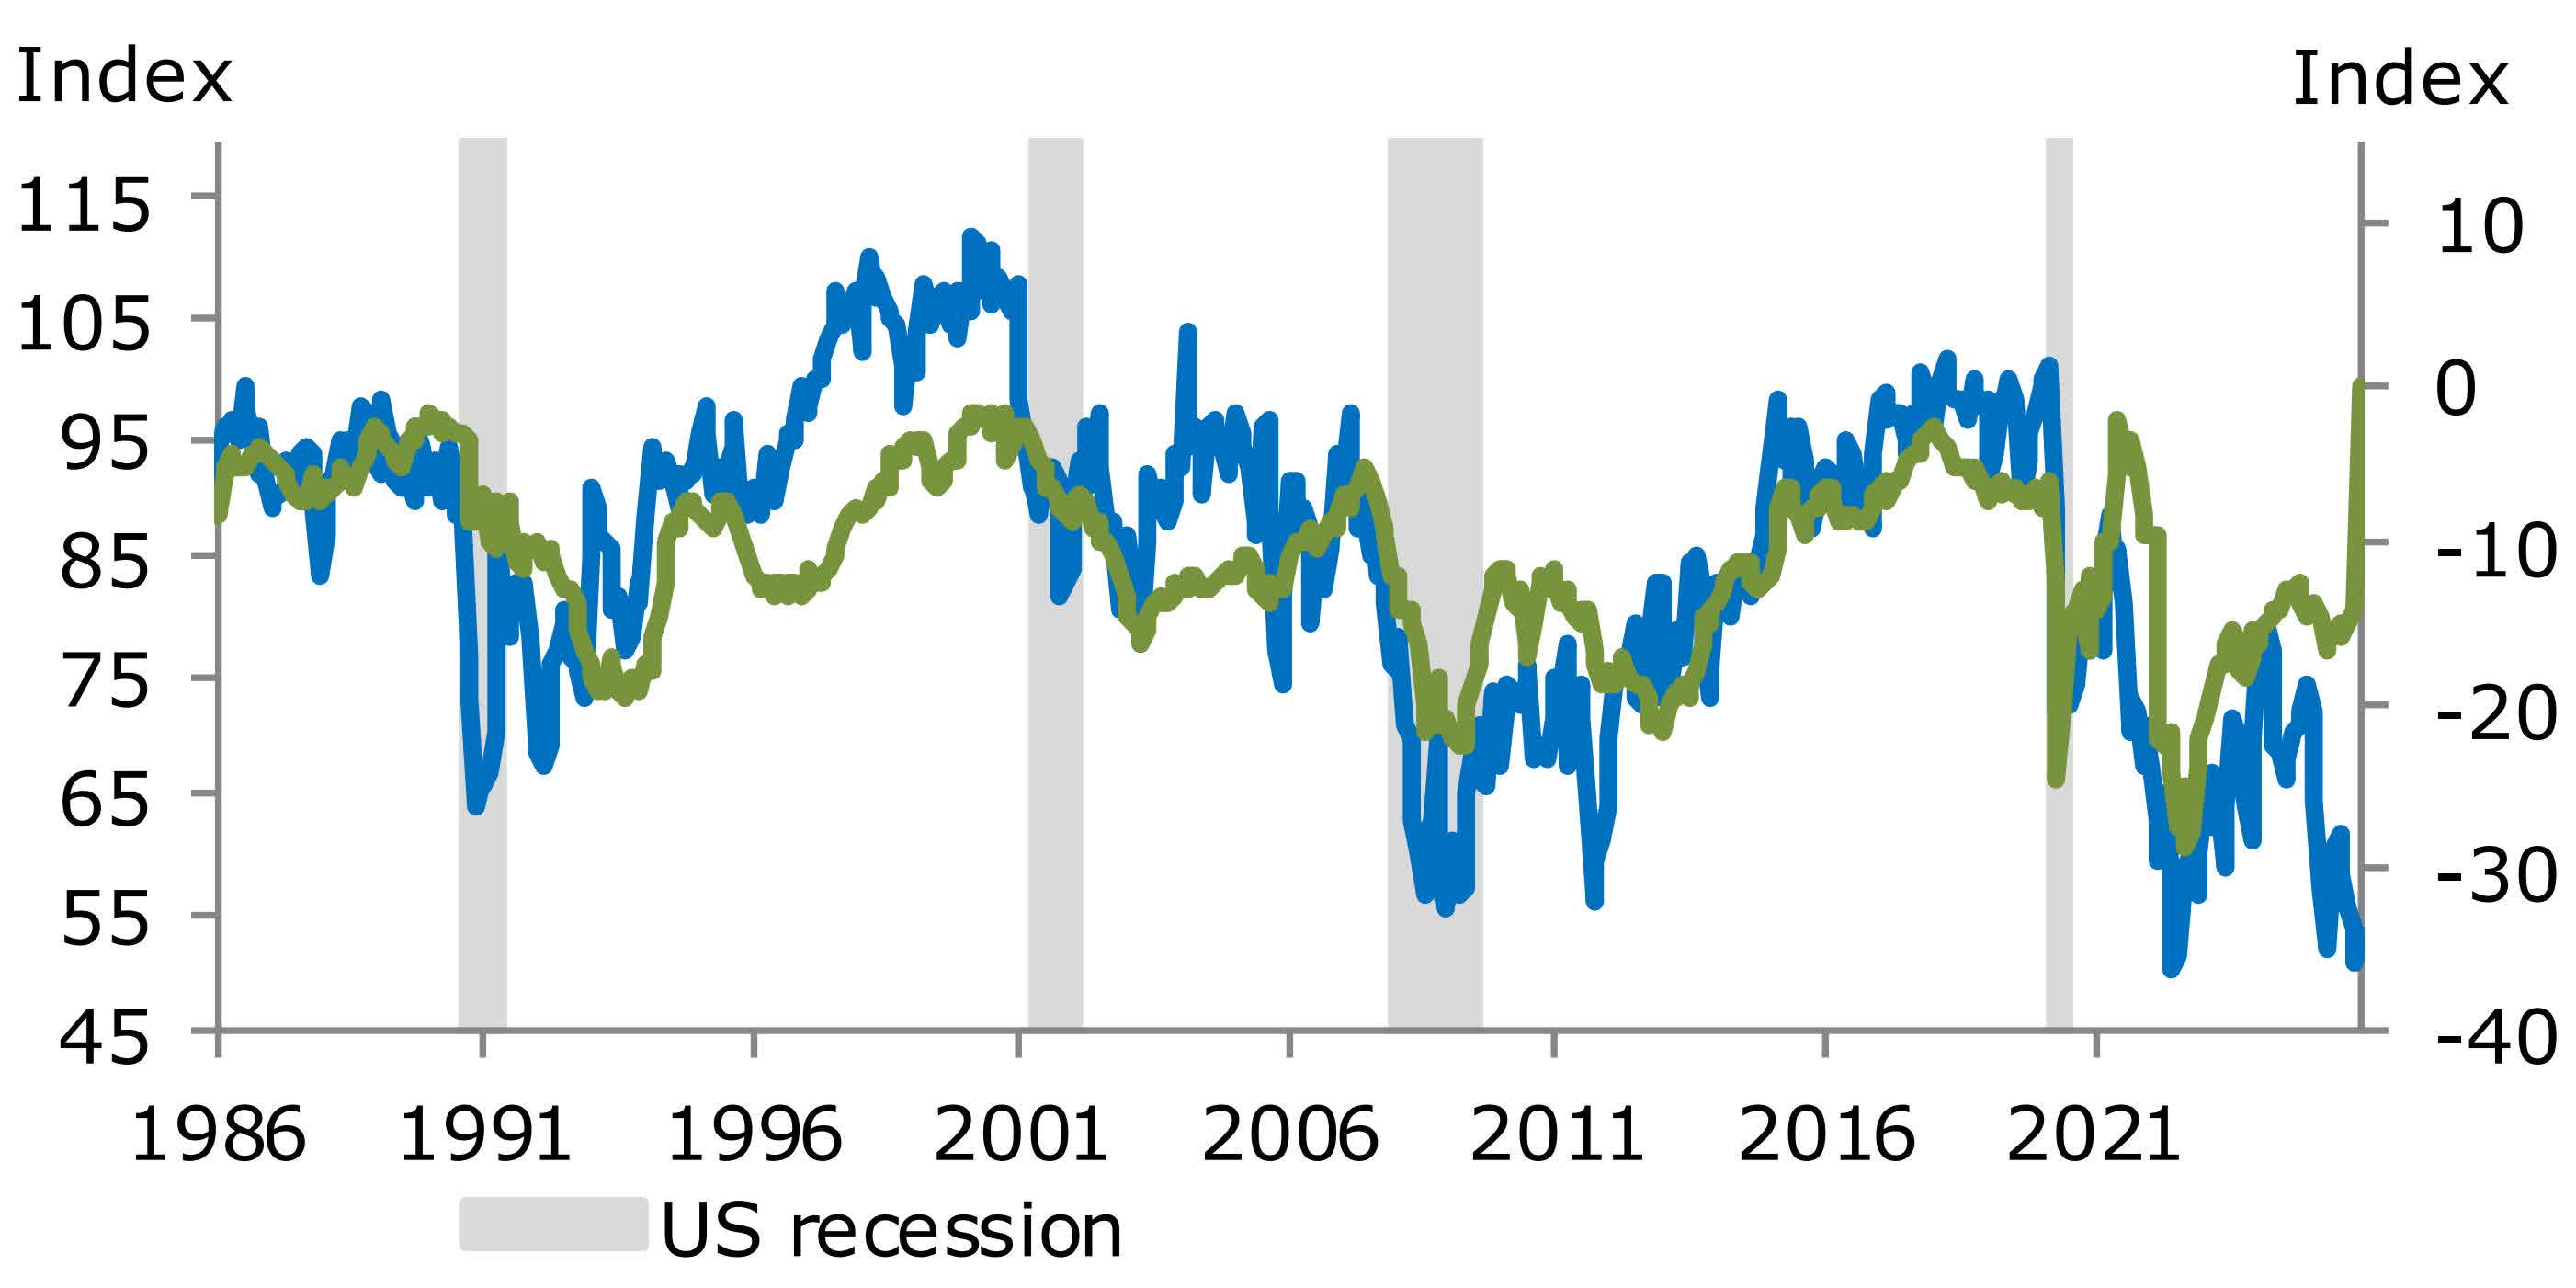
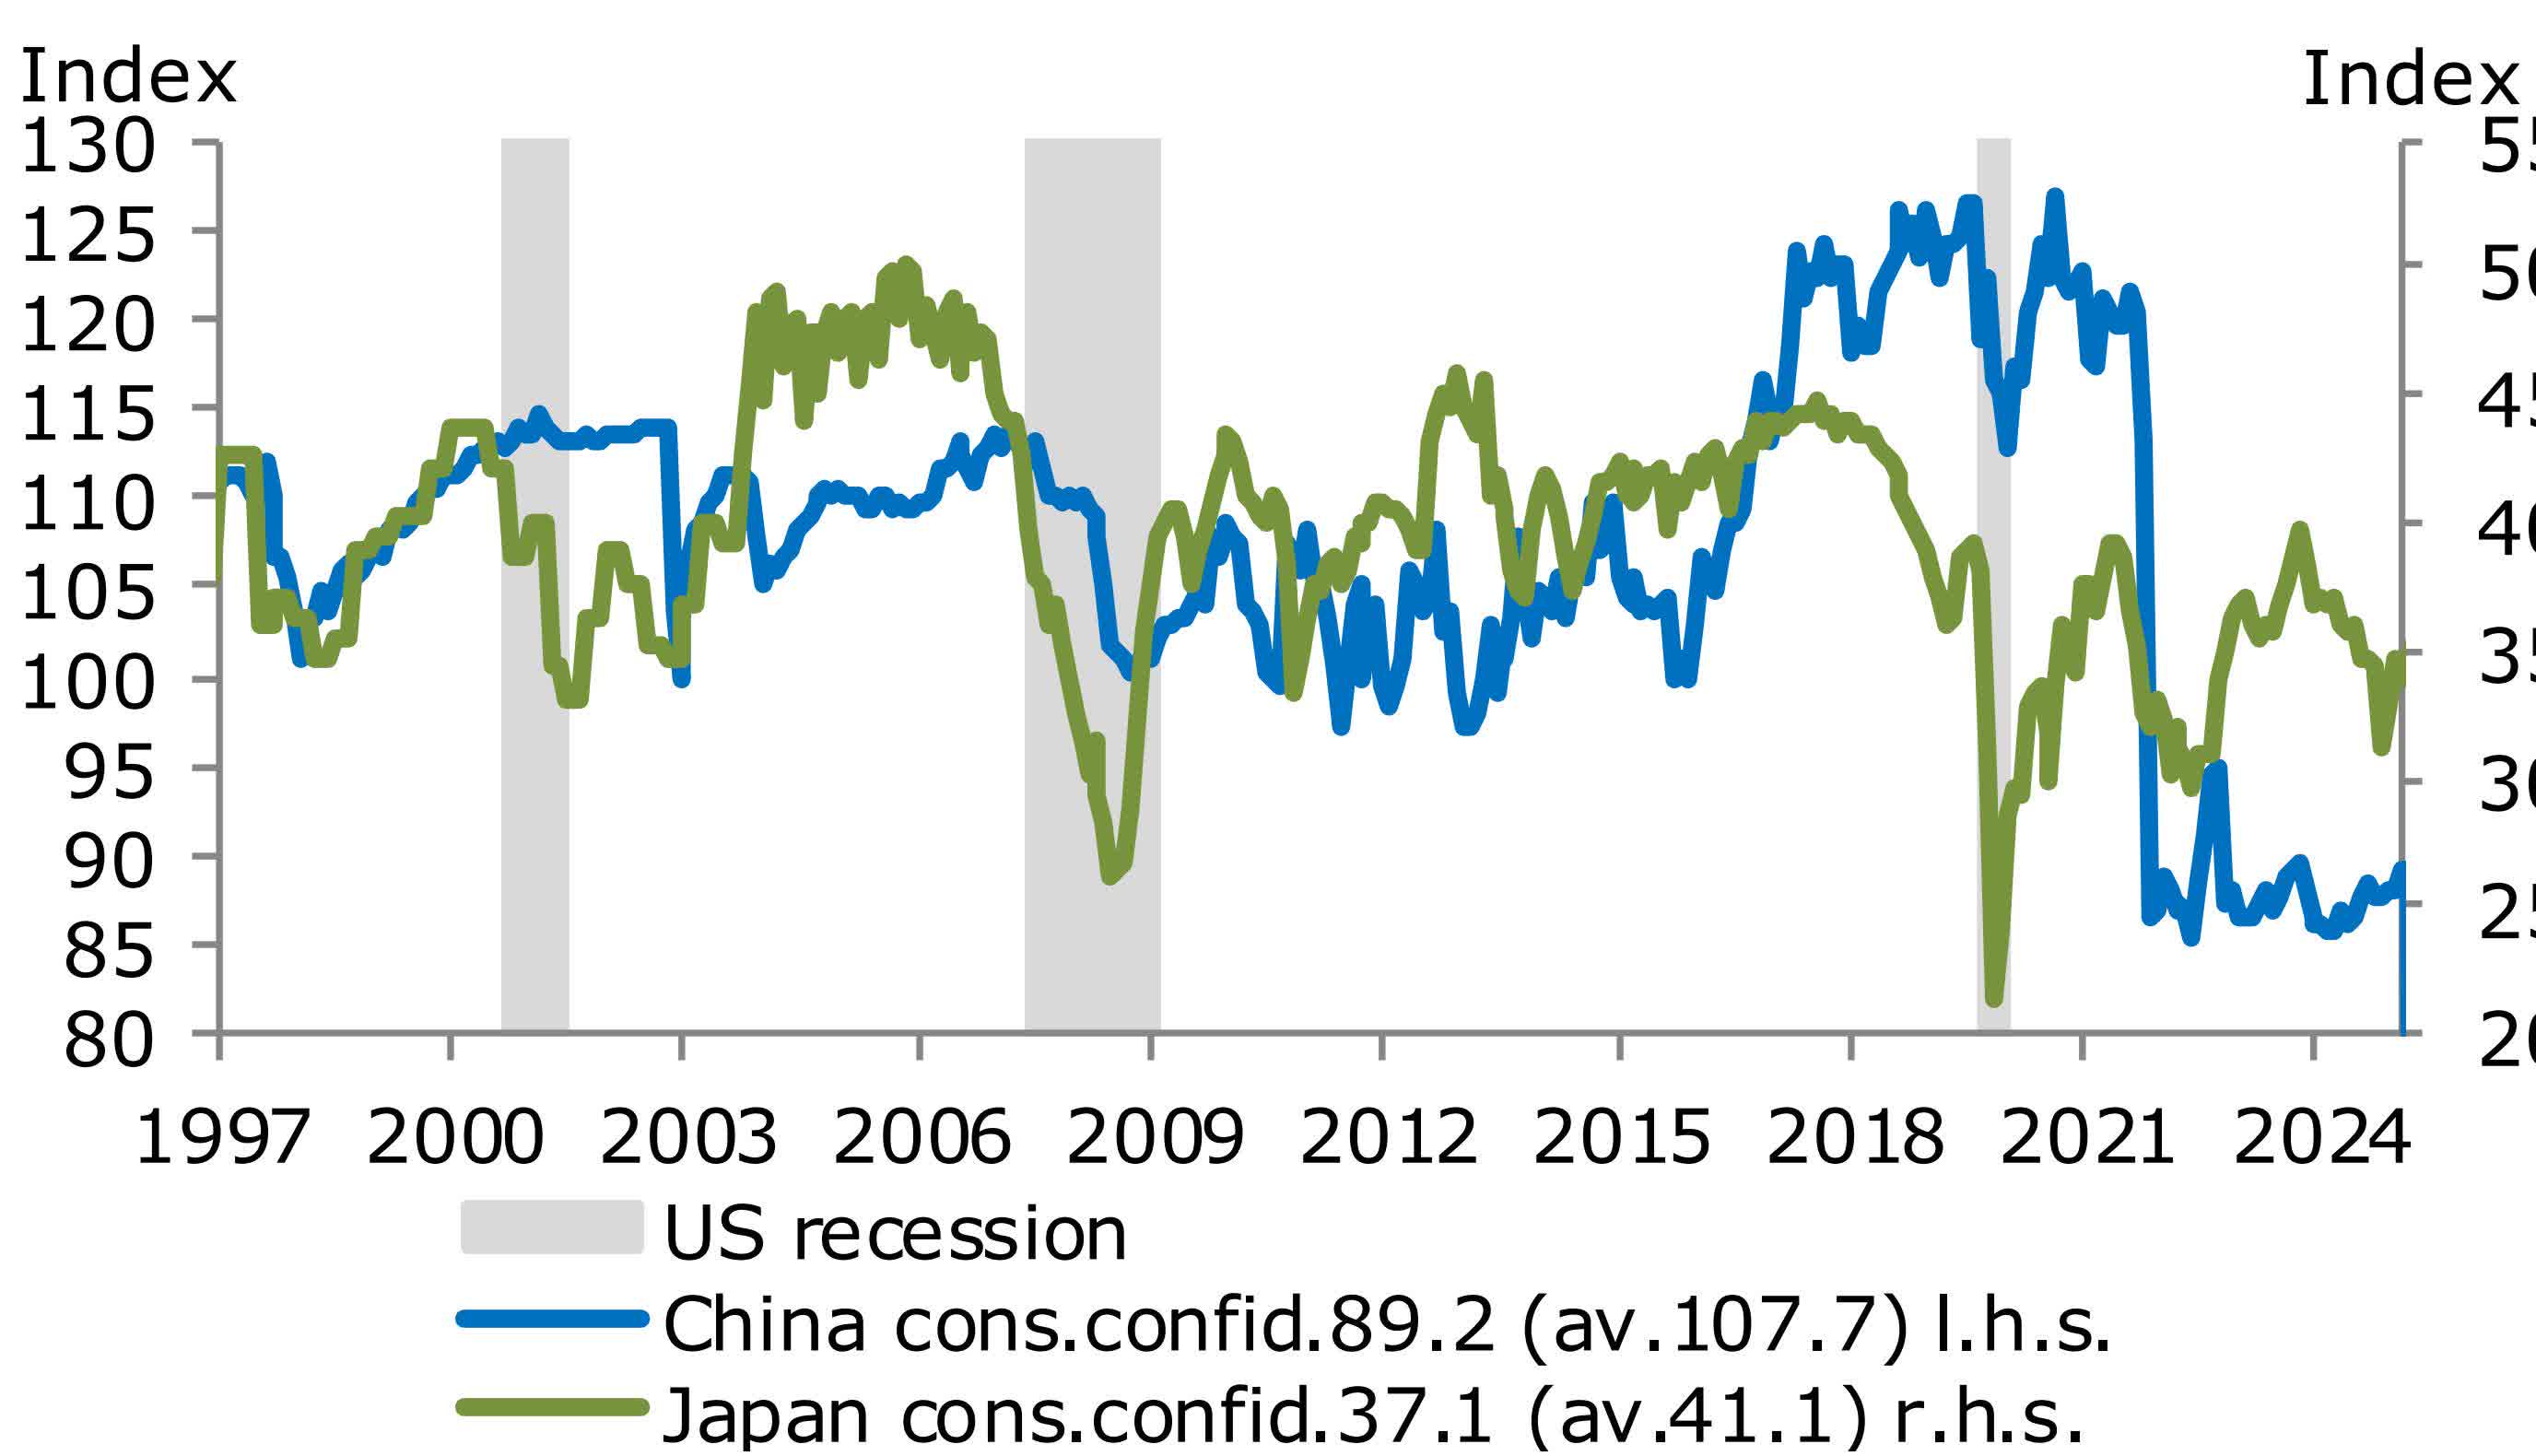
Consumer confidence
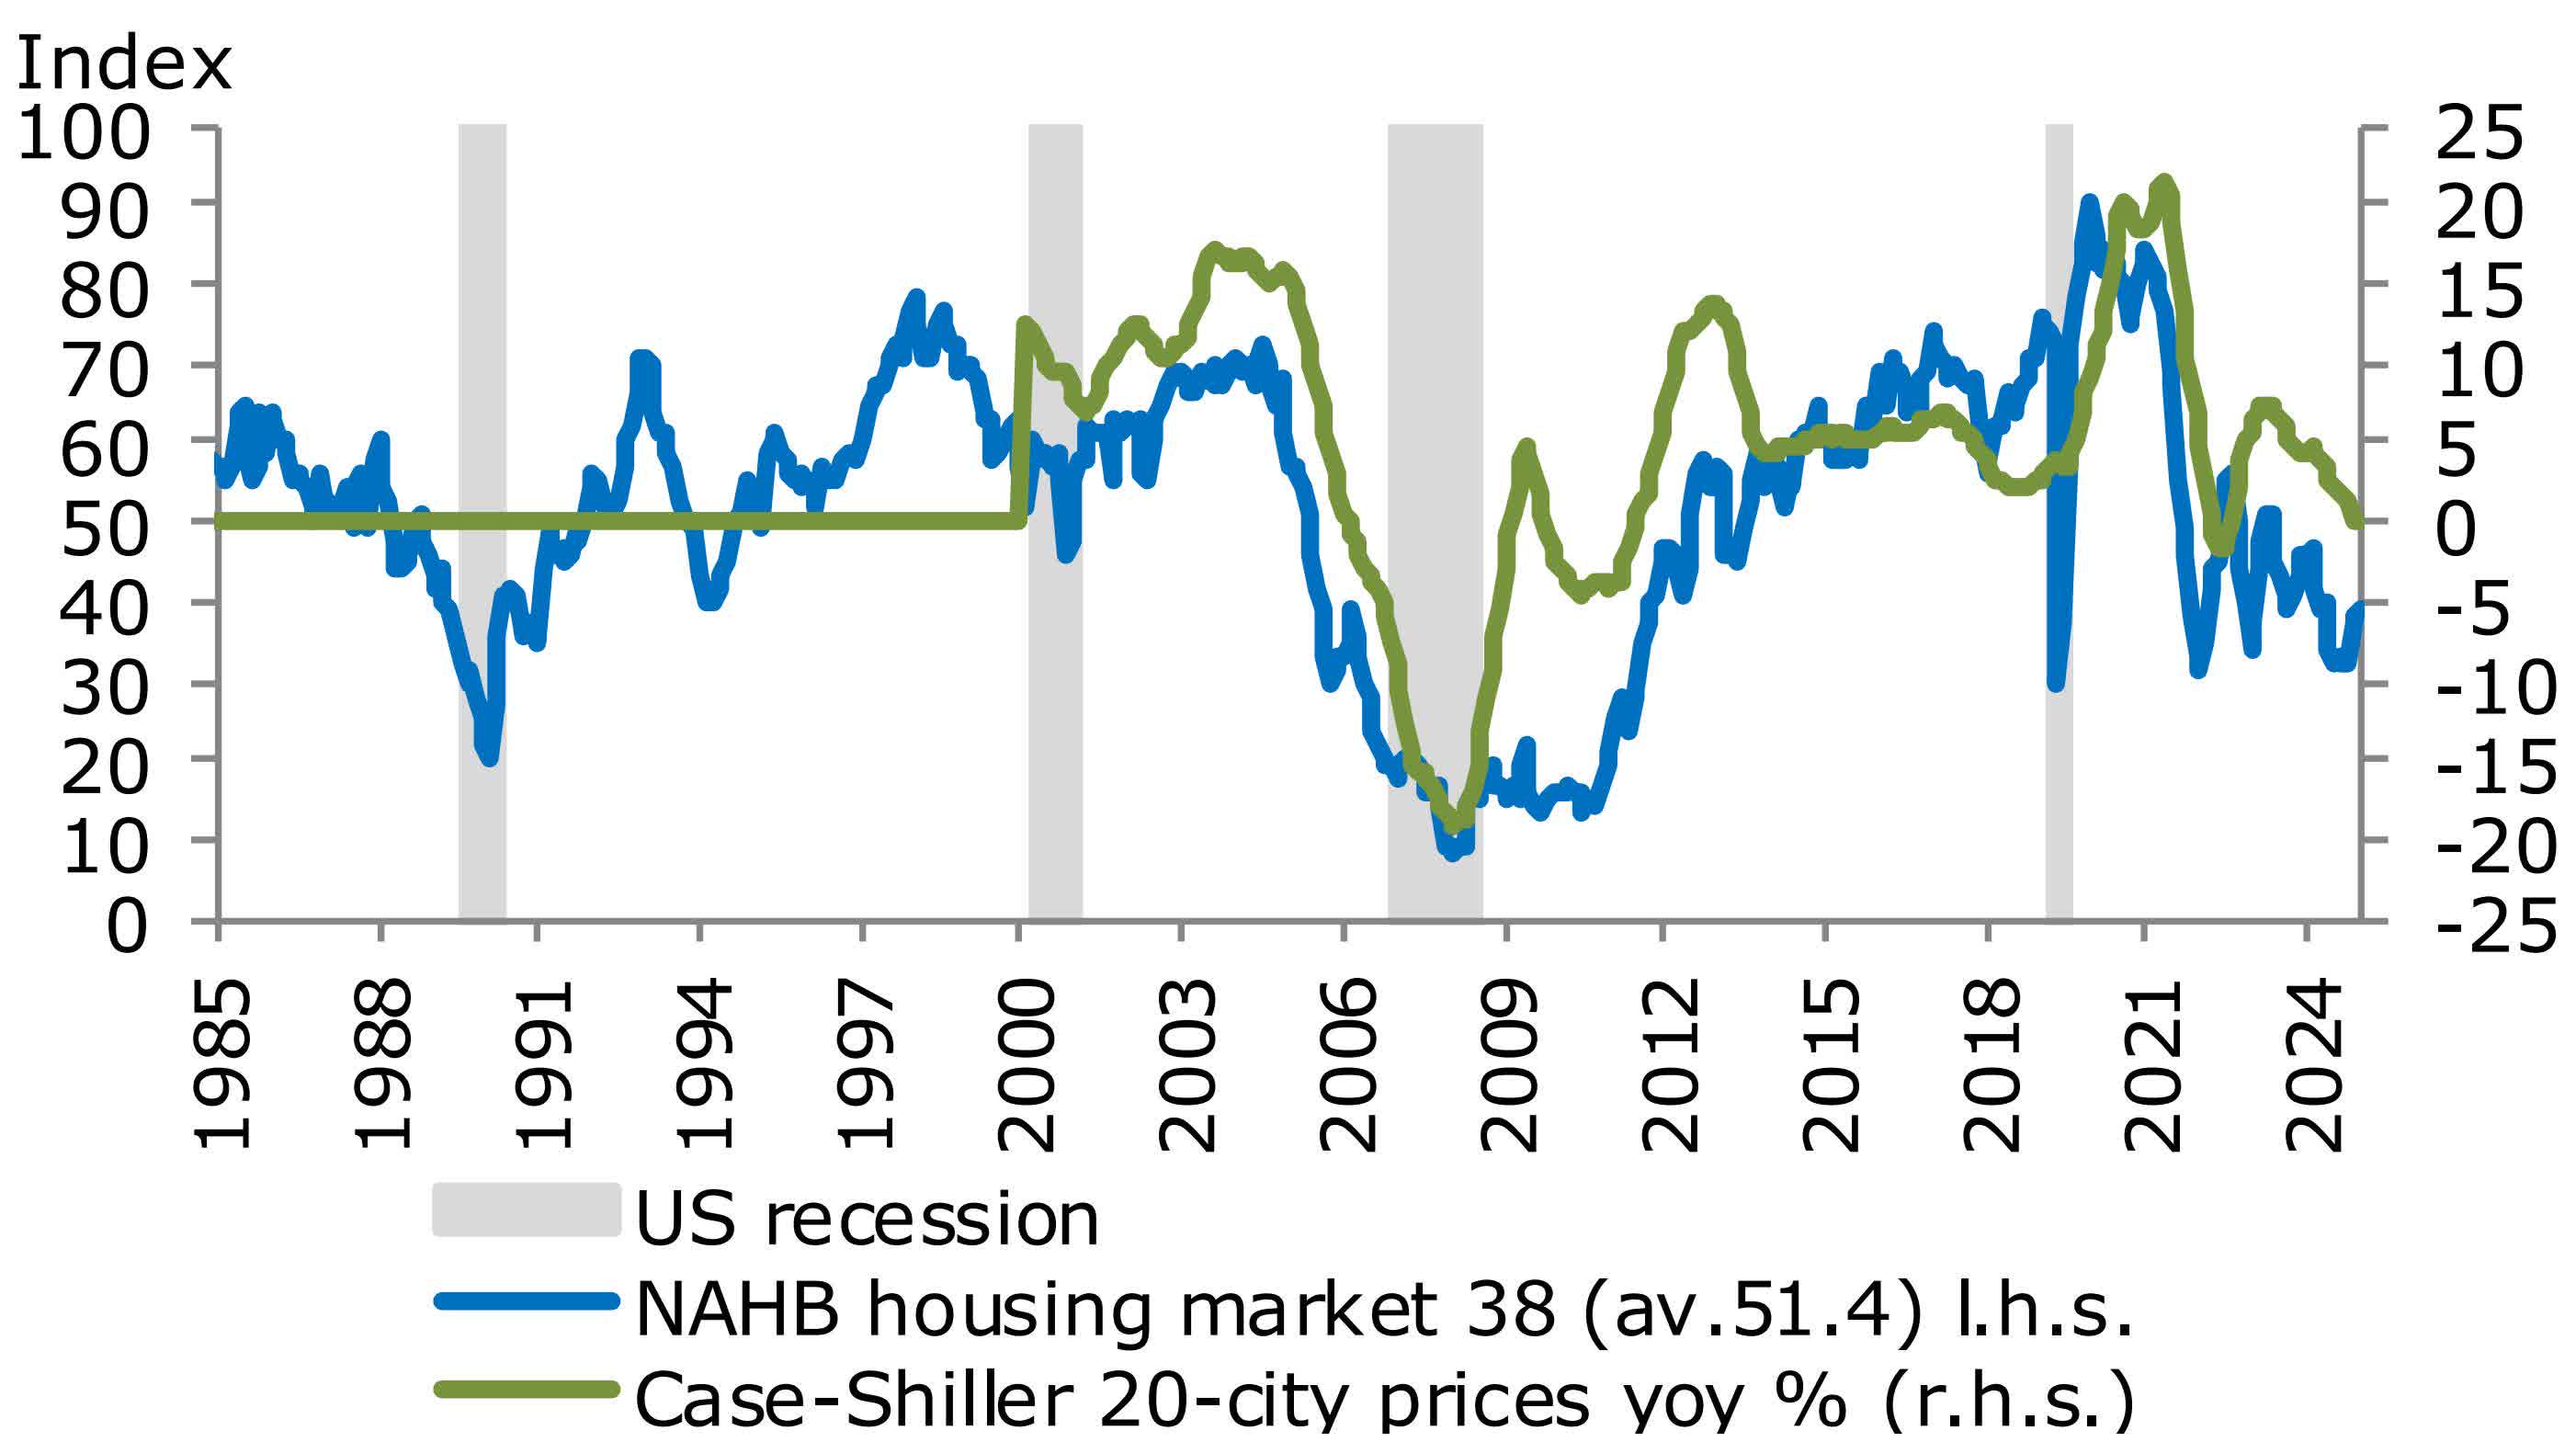
Housing market
Scenario Overview 6 Months
Base case 75%
- US: Low real GDP growth of ~2% with solid 4-5% nominal growth. Need to look through imposed tariffs. Uncertainty holds back some short-term private investments, reduces consumer confidence and puts inflation pressure up. Uncertainty from erratic government policy and confrontation remain key concerns, but deregulation & lower taxes are positive for corporates and keep profit margins high. High house prices and ~4% YoY-wage growth keeps private consumption up. Government spending (on energy/defence), new foreign investment plans support growth.
- Eurozone: Stagnation turns into mild growth ~1% and will accelerate throughout 2026. Impulse programs (defence, infrastructure, AI) provide some sort of growth acceleration amid former austerity programmes. Inflation worries (>2%) remain modest.
- China: GDP grows just above 4% thanks to government support incl. various credit impulse measures.
- Oil: Military conflicts drive prices, but US increases output, which keeps prices mostly in check.
Investment conclusions
- Equities: Positive tilt, but geopolitics pressure highly valued US equities. ‘RoW-equities’ (Europe, Asia) experience positive net fund flows. Profit margin pressure in some sectors (inflation, wage growth, tariffs). US equities lack a large upside potential with an S&P forward P/E multiple of ~23. We recommend a balanced approach for equity style.
- Interest rates: Neutral outlook on rate exposure, but a second wave of inflation is a risk. US duration exposure serves as a valuable diversifier and tail hedge in case of an evolving (severe) recession.
- Credit: Credit spreads are tight to fairly priced and remain selectively attractive, corporate default rates are moderate with ~3%. We prefer loans, short-term HY/IG, senior exposure in structured credit and selective Emerging Debt local exposure.
- Commodities/FX: Despite a recent weakening, the USD is still highly valued. Geopolitics supports gold. New (US) supply pressures gas/oil, but structural higher inflation supports the commodities bloc.
Bull case 15%
- US: GDP growth rate of >2% (>5% nominal). Fed succeeds and inflation trends at <3%. Consumer spending remains robust, supported by continued wage increases of 4% (+1% real growth). Energy prices remain in-check; tax cuts start to boost capex. Economy transitions into a new era/cycle.
- Europe: Positive feedback loop from fiscal measures on corporate investments and consumer sentiment leads GDP growth from ~0% to >1% in 2026. ‘Standing together’ spirit holds.
- China/EM: Chinese government stimulus gets more momentum, stabilising private consumption. Easing monetary policy provides support for manufacturing & property sector. No major escalation with the West.
Investment conclusions
- Equities: Corporates adapt to challenging growth prospects to maintain earnings strength. Firms favour capital over expensive labour to increase (KEEP) profitability. If a de-escalation in the Russia-Ukraine /US conflict is reached, markets will experience a rally. However, inflation pressure and high rates keep valuations in check. Further upside potential.
- Interest rates: Rates move up with a bear flattening curve move; inflation pressure persists.
- Credit: Corporate default rates are slightly below long-term averages. Credit in general (incl. EMD) and short-term HY bonds/loans benefit.
- Commodities/FX: Bid for cyclical commodities/metals. EUR and selective Em Fx rates rally.
Bear case 10%
- US: Mild recession caused by distorting US policies and imposed tariffs (higher inflation, less consumer spending, investments held back), but still with positive nominal GDP growth. Unemployment rate below 5% combined with sticky inflation kicks off a slight wage-price spiral. Fed in fear to tighten (a bit) again.
- Europe: Continued stagnation due to war/geopolitics/tariffs. Peripherals & France suffer from yield increases, but German impulse programs are a strong positive counterweight.
- China/EM: Chinese regulators fail to ease credit and regulatory measures enough, leading to <4% GDP growth and disappointing exports. Emerging markets (ex-commodity exporters) suffer as global trade is held back. Em Fx weakness.
Investment conclusions
- Equities: Equities fall double digits. Highly priced US equities and cyclicals will lead the correction, followed by Europe.
- Interest rates: Long-term rates drop the most (yield curve inverses anew), but limited potential apart from US rates. Support for high-quality assets (treasuries, A/AA bonds, agency bonds). Cash is king!
- Credit: Corporate default rates climb and approach the higher end of long-term average levels. Severe default cycle is avoided, but credit markets suffer. Favour short dated high-quality bonds and cash.
- Commodities/FX: Negative for cyclical commodity prices. USD, CHF and JPY act as a safe haven again.
Tail risks
- Liquidity shock due to external event/bank failure.
- Italian/French sovereign debt crisis, EUR break up.
- Military conflict in the South China Sea.
- Pandemic crisis re-emerges/new virus variants.
- Nuclear escalation resulting in World War III.
- Emerging market meltdown similar to 1998.
Asset Class Assessment

Editor’s Note: The summary bullets for this article were chosen by Seeking Alpha editors.


