
Crypto World
8 in a Row: Ripple (XRP) ETFs Record Another Green Week but Warning Signs Return

For the eighth consecutive week, the spot XRP ETFs ended in the green, attracting almost $19 million. Although this sounds impressive, the actual number was significantly lower than last week’s figure.
Moreover, Friday ended as a no-inflow day for the first time in about three weeks, reigniting an old dilemma about actual demand.
XRP ETFs Still in the Green
The last full week of August was the best for the XRP ETFs in 2026. They gained over $110 million, making it the most impressive one since early December 2025. The first slowdown during the previous business week was felt on August 31, when investors poured in a more modest $5.64 million.
The double-digit net inflows returned on September 1 with $14.38 million, but the trend changed on Wednesday when withdrawals were dominant with $7.20 million taken out. This was the first red day for the Ripple ETFs since August 5.
$6.14 million entered the funds on Thursday, but Friday was a no-show day with SoSoValue data showing flows of $0.00. The good news is that the cumulative total net inflows hit another all-time high of $1.68 billion.
The worrying part of the weekly performance is actually twofold. First, it was Wednesday’s net outflows, which broke a near-one-month streak. Second, it was Friday’s no-reportable flows, which raised concerns that had been forgotten in the past few weeks.
Before the market-wide revival experienced after August 19, the spot XRP ETFs had seven such days out of 11 trading days in August. Nevertheless, the broader weekly performance was still bullish with almost $19 million in net inflows. The streak of consecutive green weeks is up to eight.

XRP Defends $1.40
Despite the massive inflows of over $110 million during the previous business week, the underlying asset had failed to capitalize and had fallen below the key support at $1.40 last weekend. It dipped further to $1.33 during the new week, but finally found support and surged to $1.45 on Friday.
It was stopped there and pushed south to $1.41 as of press time, which means that it remains above the key support at $1.40. Analysts remain highly bullish on its recent performance, claiming that its bull phase has finally begun. Moreover, Ali Martinez and EGRAG CRYPTO outlined some mind-blowing price targets for the culmination of the bull market, of up to $60.
We break them down in more detail in this article, and review the actual obstacles XRP would have to face on its way to these levels.
The post 8 in a Row: Ripple (XRP) ETFs Record Another Green Week but Warning Signs Return appeared first on CryptoPotato.

Ripple’s XRP remains in a corrective phase after its sharp August breakout, with buyers struggling to regain control of the key overhead supply zone. The current structure suggests that the market may need more consolidation before another sustained directional move develops.
XRP Price Analysis: The Daily Chart
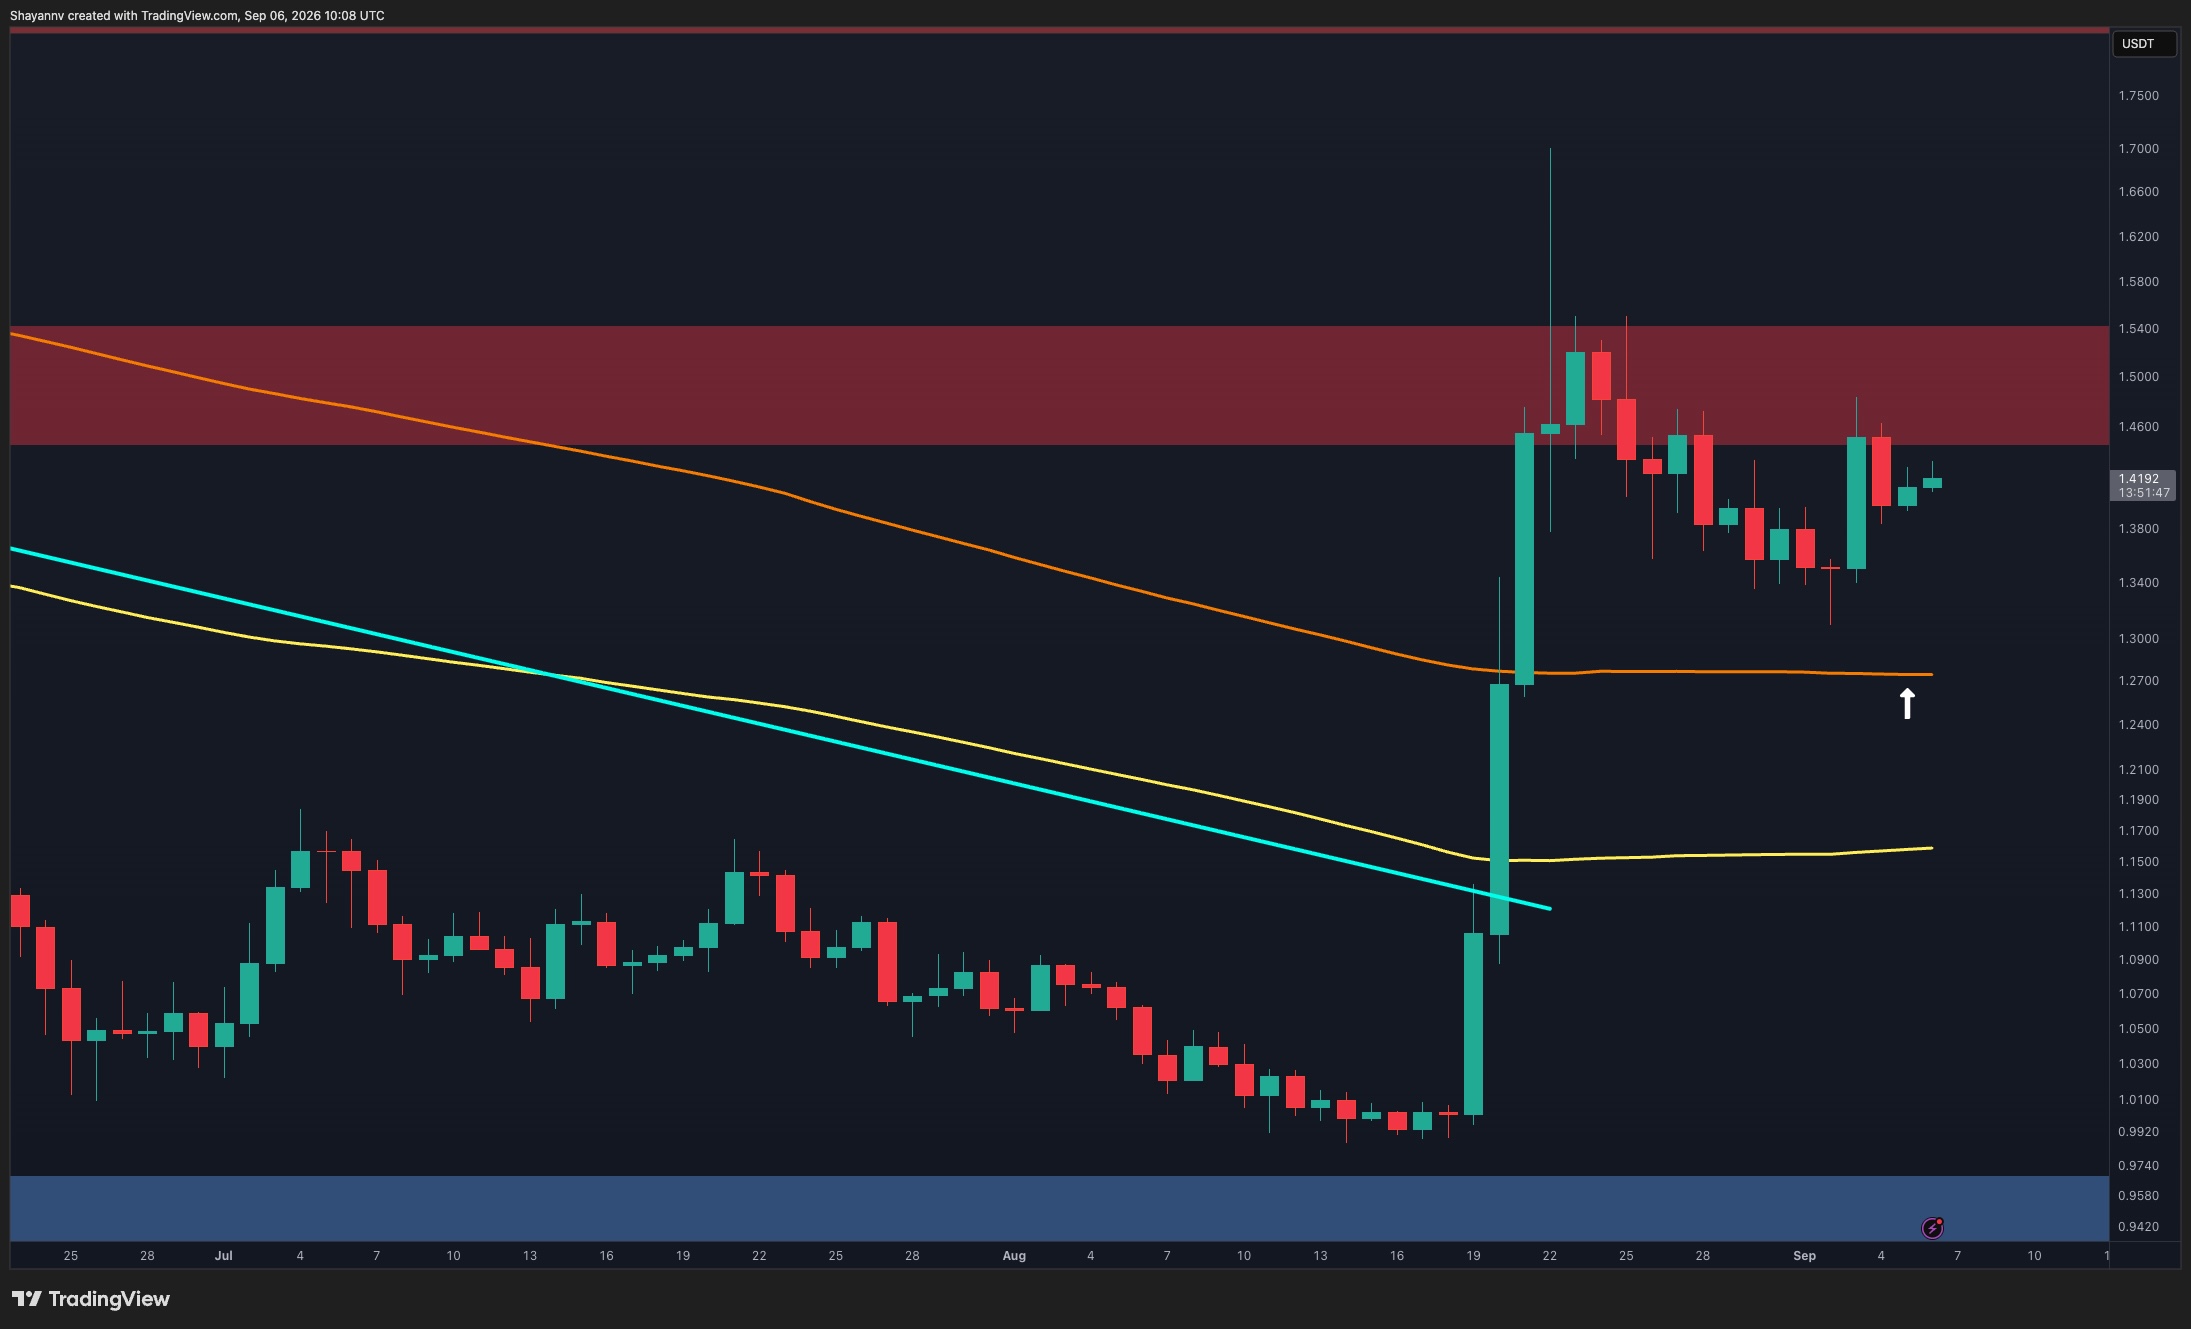
On the daily timeframe, XRP’s explosive rally from the $0.94-$0.97 support zone broke the previous descending structure and pushed the price as high as roughly $1.70. However, the breakout was followed by an equally notable rejection, and the asset has since been unable to establish itself above the $1.45-$1.54 resistance zone.
The price is currently trading around $1.42, just below this major supply area. More importantly, XRP continues to hold above the long-term moving average near $1.27, which has flattened after previously trending lower. This level represents an important structural support for the ongoing recovery.
As long as the $1.27 area holds, the recent weakness can still be viewed as consolidation following an impulsive rally. A daily close above the $1.45-$1.54 resistance zone would strengthen the bullish case and could eventually bring the $1.70 high back into focus. Conversely, losing the $1.27 support would substantially weaken the structure and increase the probability of a deeper retracement toward the lower moving average around $1.15.
XRP/USDT 4-Hour Chart
The 4-hour chart highlights a descending channel that has contained XRP since the initial surge. The asset has repeatedly failed to break through the channel’s upper boundary, which is now converging with the crucial $1.45-$1.54 resistance zone.
The latest rebound from around $1.34 has brought XRP back toward $1.42, placing it directly beneath this descending resistance. This makes the current area particularly important. A breakout above the trendline followed by a successful reclaim of $1.45 could signal that the corrective structure is ending, with the $1.50-$1.54 zone becoming the next hurdle.
However, another rejection would preserve the descending structure and could send the token back toward $1.34-$1.38. Below there, the channel’s lower boundary is approaching the $1.27-$1.30 region, which overlaps with a clearly defined support zone.
Therefore, XRP remains caught between improving support underneath and persistent resistance overhead. Until the descending channel is broken, the short-term outlook appears more consistent with continued consolidation and potentially another corrective move rather than an immediate bullish continuation.

The post Ripple Price Analysis: Where Is XRP Heading Next Week After Defending Its 200-Day EMA? appeared first on CryptoPotato.
Ethereum is attempting to stabilize after its explosive August breakout, but the follow-through has remained limited. ETH is holding around $2.5K, yet repeated swings within the same range suggest the market is still digesting the rally rather than establishing a fresh directional trend.
Ethereum Price Analysis: The Daily Chart
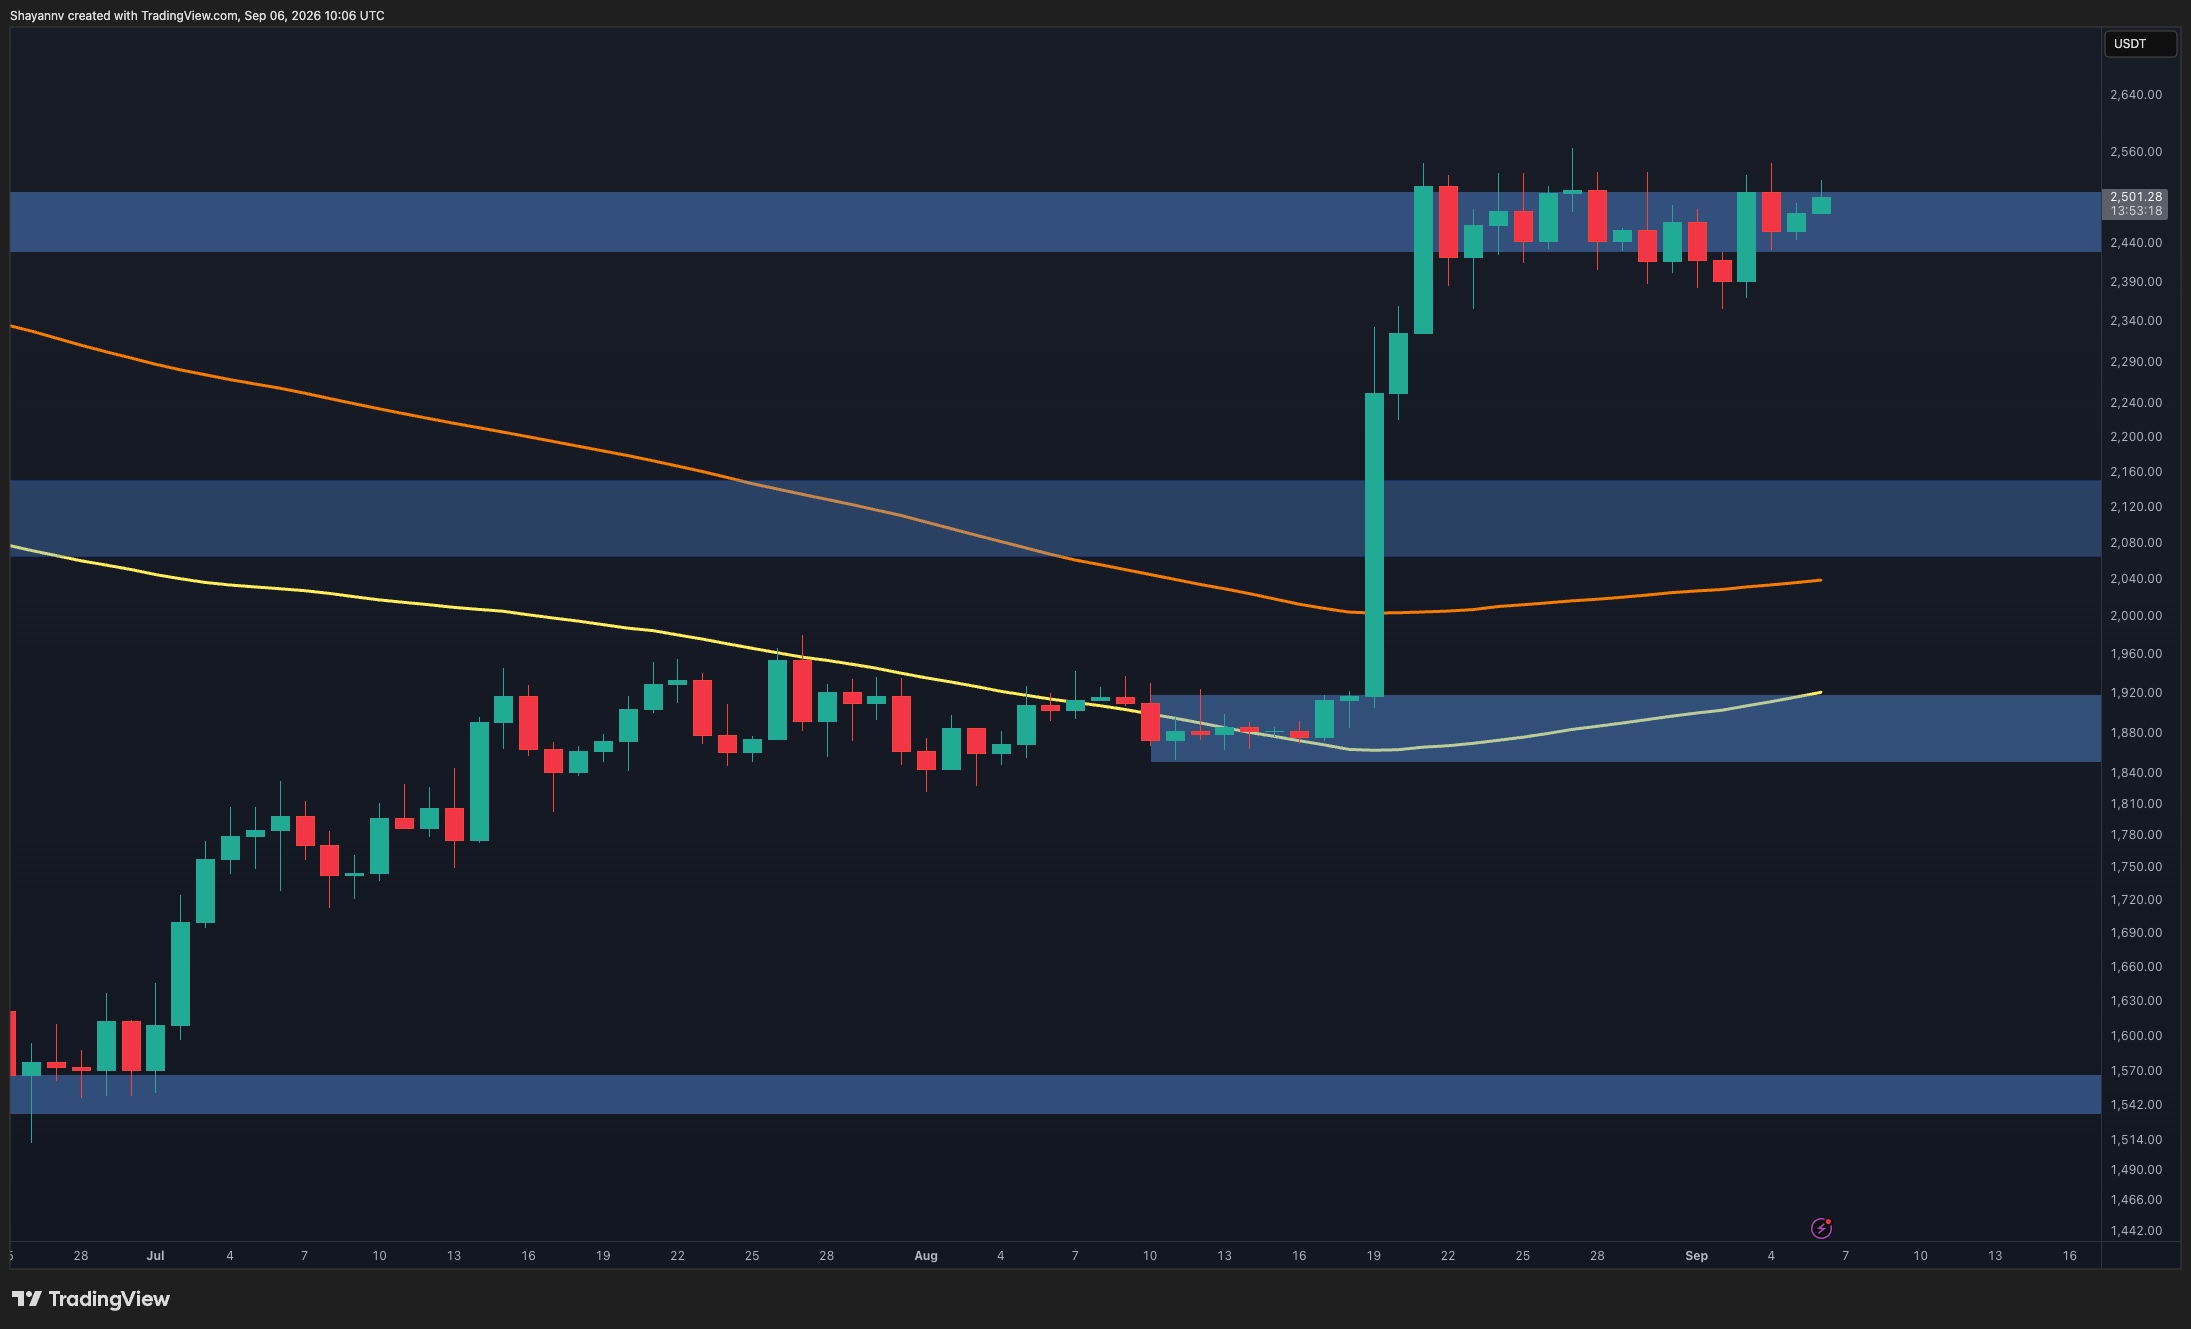
ETH’s broader structure remains constructive after the powerful breakout from the $1.85K-$1.92K base. Yet, momentum has stalled inside the $2.44K-$2.52K resistance area. Several daily candles have tested this region without producing a sustained breakout, while repeated upper and lower wicks indicate considerable indecision. ETH is currently trading near $2.5K, close to the upper portion of this range.
A clean daily breakout above roughly $2.52K-$2.56K would be required to confirm that buyers have regained control and potentially initiate another impulsive leg higher. Until then, continued consolidation remains the more likely scenario.
On the downside, losing the $2.39K-$2.44K area would weaken the current setup and increase the probability of a deeper correction. In that case, the $2.08K-$2.15K former resistance zone would become the major medium-term support to watch.

ETH/USDT 4-Hour Chart
The 4-hour timeframe shows ETH trapped in a broad consolidation between approximately $2.35K and $2.56K following the vertical advance from below $2K.
The important development is that buyers have repeatedly stepped in near the lower portion of this range. The latest recovery from around $2.38K has carried ETH back toward $2.5K, placing the price once again near the upper resistance region. Yet multiple previous attempts around $2.5K-$2.55K have failed to generate continuation.
Therefore, another rejection could keep the market oscillating inside the existing range. A breakdown below the $2.35K-$2.39K floor would be more consequential and could expose the first major pullback zone around $2.22K-$2.27K.
Conversely, sustained acceptance above $2.52K-$2.56K would invalidate the near-term consolidation scenario and indicate that buyers are ready to resume the broader bullish move.
Sentiment Analysis
Ethereum’s Spot Average Order Size provides an important clue regarding the lack of follow-through. The latest observations around $2.4K-$2.5K are predominantly gray, classified as normal-sized orders, while the green whale-order activity visible during earlier portions of the recovery has largely disappeared.
This suggests that ETH’s recent push toward $2.5K has not been accompanied by notable large-player participation. There is also no visible concentration of retail orders in the latest data, pointing to an absence of aggressive positioning from either side.
The lack of dominant whale activity fits well with the price action. With neither substantial large-scale demand nor supply appearing in the metric, ETH may remain prone to low-conviction, choppy movements inside its current range. A renewed appearance of significant whale orders could therefore be an important signal that the consolidation is approaching a more decisive resolution.

The post Ethereum Price Analysis: ETH Consolidates at $2.5K as Whale Participation Stalls appeared first on CryptoPotato.
Berlin’s state government refused a 30 Bitcoin ransom, and the hackers behind the attack published 5.7 terabytes of stolen data on the dark web.
The Rhysida ransomware group had opened the auction at 30 BTC. Berlin let the deadline pass instead of paying.
Why the Bitcoin Ransom Demand Failed
Rhysida, a ransomware crew active since 2023, offered the files to the highest bidder. Bidding started at 30 BTC.
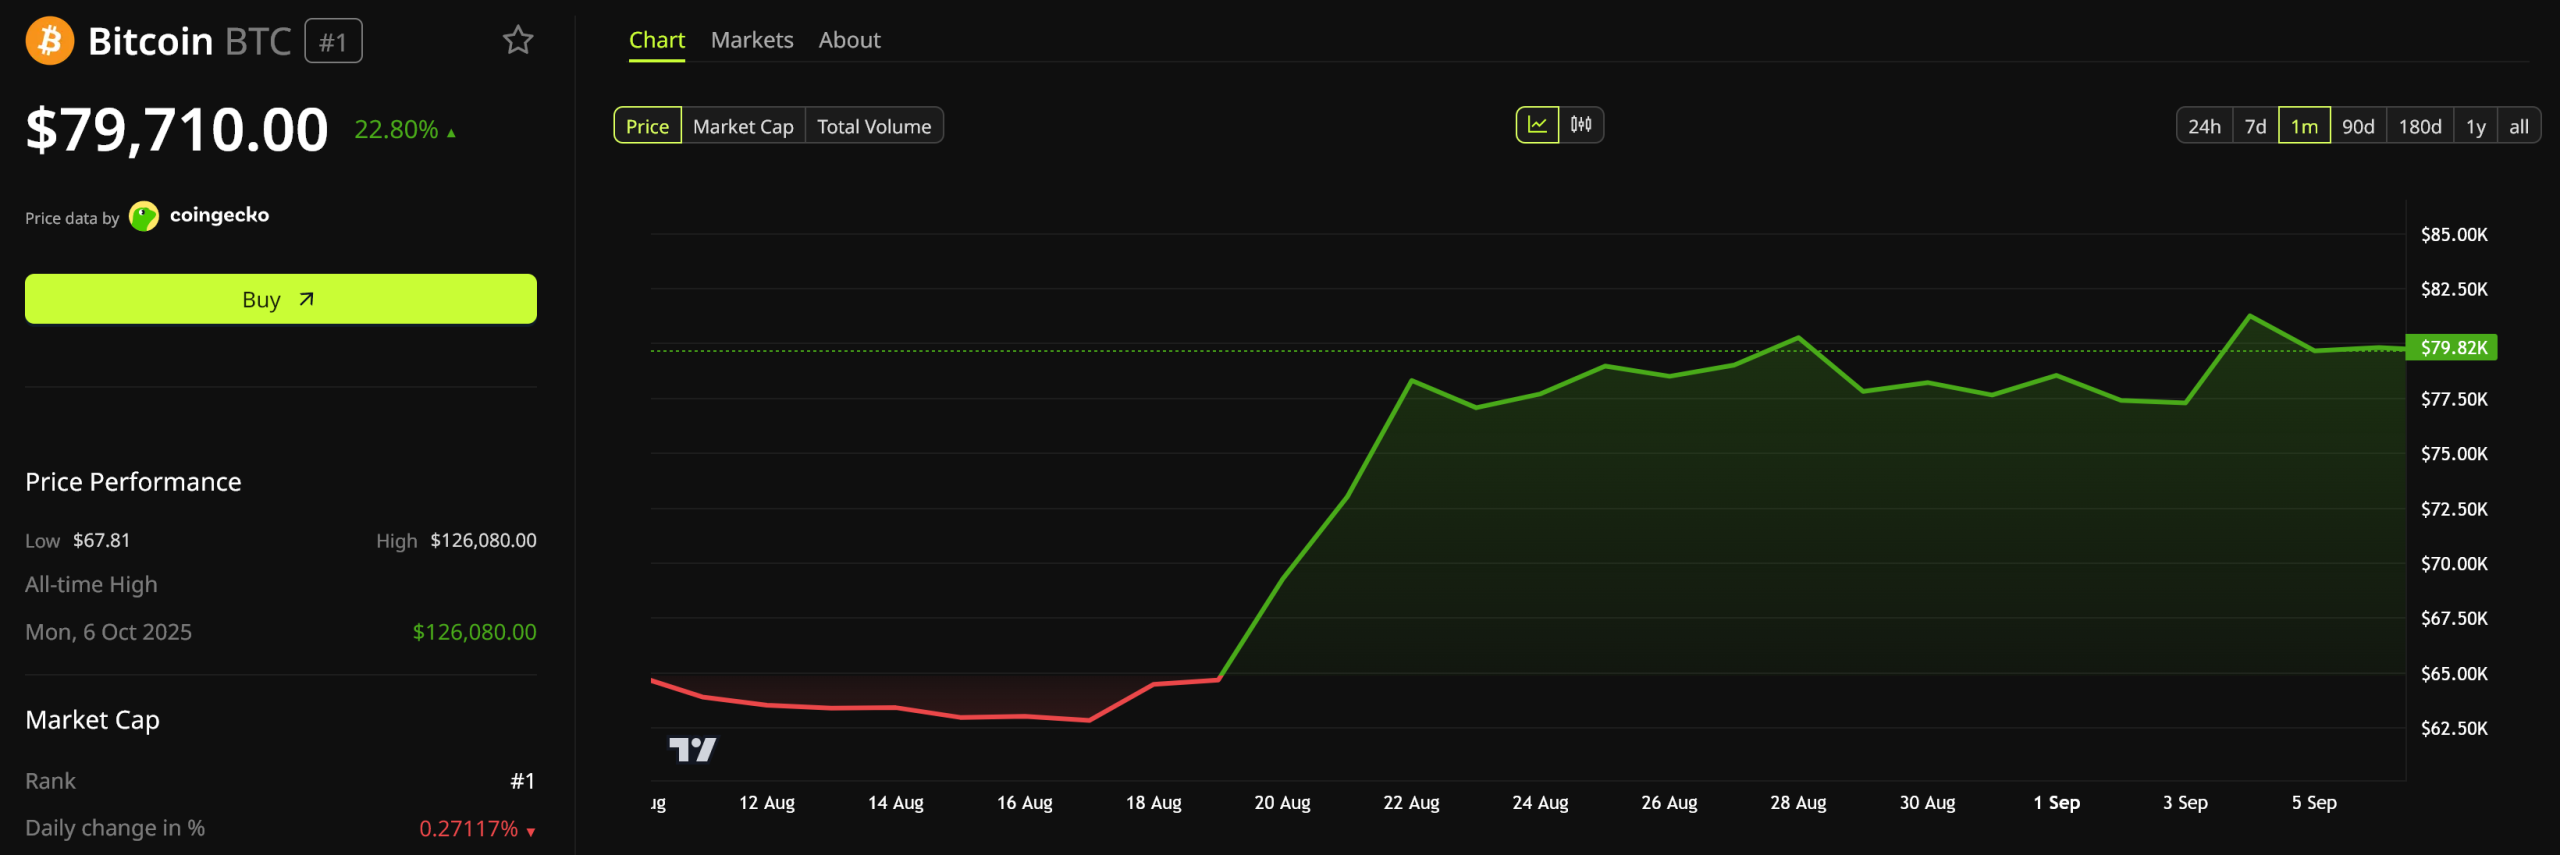
Bitcoin (BTC) trades near $79,902 per coin. Therefore, 30 coins come to roughly $2.4 million. Berlin’s Senate Chancellery put the demand at about two million euros.
BTC has added 0.46% today and 24.4% over the past month. That climb raised the dollar value of the demand while the ultimatum ran.

Florian Hauer, the city’s chief digital officer, ruled out any payment.
“The State of Berlin will not give in to blackmail. The safety of the State of Berlin’s staff and the people of Berlin is our top priority.”
The Bitcoin ransom deadline ran out on Friday, September 4. Rhysida published the full dataset that afternoon.
Berlin’s refusal tracks a broader shift. On-chain ransomware payments fell about 8% in 2025, even as claimed attacks rose 50%.
Subscribe to our YouTube channel to watch leaders and journalists provide expert insights
Berlin Counts the Cost of a Dark Web Auction
The attack surfaced on August 14. Berlin then cut two Senate departments from the state network. One covers urban development and housing; the other covers mobility, transport, and the environment.
Housing benefit payments and family support stalled until both departments returned on August 23. Officials have warned that residents’ personal data could be in the leak.
A central crisis unit now reviews the material Rhysida released once the Bitcoin ransom went unpaid. Forensic specialists comb through the files around the clock.
The State Criminal Police Office and Germany’s federal cybersecurity agency lead the investigation. Officials told residents to report fraud or identity theft to police.
Berliners elect a new state parliament on September 20, two weeks after the Bitcoin ransom expired.
Rhysida collected nothing. Berlin has not put a figure on the damage, and the review of the published files continues.
The post Hackers Demand $2 Million in Bitcoin from Germany. Berlin Refuses to Pay appeared first on BeInCrypto.
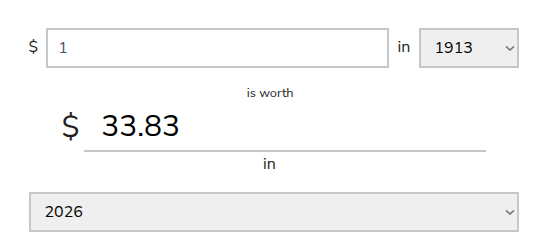
Since the Federal Reserve was created in 1913, the US dollar has lost about 97% of its purchasing power, according to the Bureau of Labor Statistics CPI-U.
A 1913 dollar buys roughly 3 cents’ worth of today’s goods, meaning $1 back then is worth about $33 to $34 in 2026.
What 113 Years of Inflation Actually Looks Like
That figure is not a slogan. It reflects the official price index compounded over 113 years, through two world wars, the Great Inflation of the 1970s, and the 2021-23 spike. The 1971 end of gold convertibility accelerated the dollar’s stretch, and cash left idle was quietly taxed by inflation the entire time.
“Check out the biggest, kosher ponzy scam in recent history. The US dollar has lost 97% of its purchasing power since the Federal Reserve was created in 1913. A $3 item in 1913 would cost $100 today,” one user said on X.
Follow us on X to get the latest news as it happens.

Bitcoin was designed in response to that system: a 21 million-coin cap paired with a declining issuance schedule. It did not exist in 1913, so the comparison is not one-for-one. As a store of value, though, its record since 2009 has been extreme in both directions.
Early buyers saw their purchasing power explode. Later buyers, by contrast, endured drawdowns of 50% to 80% within single cycles.
As of early September 2026, Bitcoin trades near $79,852, well below its October 2025 peak of $126,080. Since its inception, the token’s price has soared more than 59,000%, and over full market cycles, it has beaten cash and often beaten gold.

Inside any single cycle, though, it can erase years of gains within months — the trade-off inherent to a scarce, non-yielding, narrative-driven asset.
How Institutional Access Changed the Story
Utility has reshaped Bitcoin’s role since then. Spot Bitcoin ETFs, approved in the United States in 2024, turned a bearer asset into a ticker that pensions, RIAs, and balance-sheet allocators can hold without managing private keys.
Those products have accumulated $55.62 billion in cumulative net inflows as of September 4, according to SoSoValue data, with total net assets across the category reaching $101.25 billion, equal to roughly 6.33% of Bitcoin’s entire market cap.
Adoption remains incomplete in several respects. Volatility stays high, regulation varies widely across jurisdictions, and energy and custody risks are real and unresolved. The US dollar still clears most global trade, prices most debts, and pays most wages worldwide. Bitcoin has not replaced that role as a unit of account.
What Bitcoin has done is offer savers an exit from a currency that official statistics say lost 97% of its purchasing power since 1913. Whether that exit functions as a genuine reserve asset, pure speculation, or some combination of both depends heavily on the investor’s time horizon.
Cash loses value slowly and predictably. Bitcoin can lose value fast, sometimes dramatically so, but over the long run, it has, so far, compounded gains faster than either cash or gold.
Subscribe to our YouTube channel to watch leaders and journalists provide expert insights.
The post The US Dollar Has Lost 97% of Its Value Since 1913: Is Bitcoin the Way Out? appeared first on BeInCrypto.


Investigators have identified 62 victims and say more than 46 Ukrainians took part in the alleged operation.
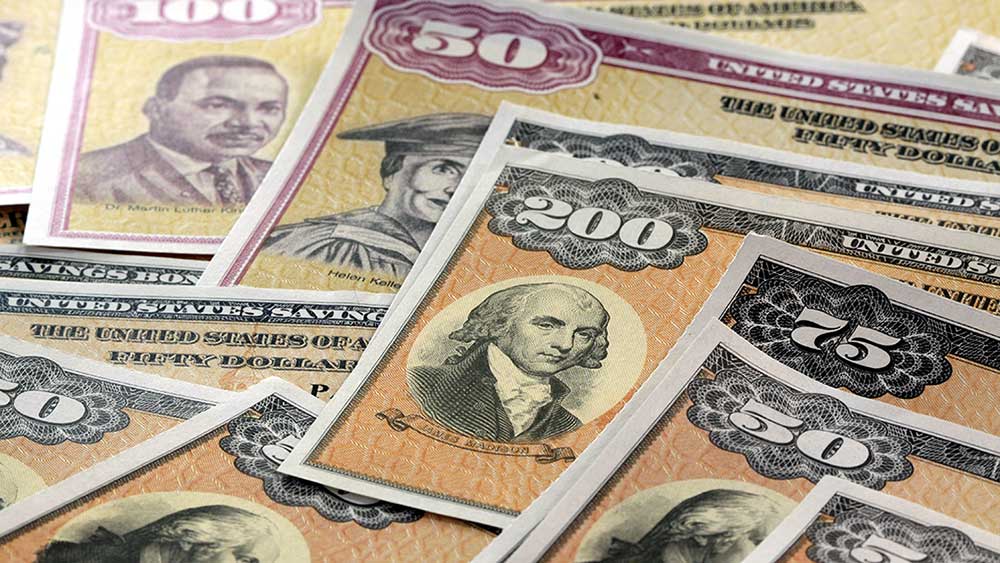
Despite weeks of largely sideways trade, the stock market sent some positive signals heading into the Labor Day shortened trading week. A strong session Thursday and confirmation of technical support by the Nasdaq and S&P 500 indexes led IBD to notch its Stock Market Exposure guide back to 60% to 80%, up from 40% to 60%. Bond markets will be…
Copyright ©2026 Investor’s Business Daily, LLC. All rights reserved. 87990cbe856818d5eddac44c7b1cdeb8

Bitcoin rewards mined in March 2010—now moving after more than 16 years from long-dormant wallets—have triggered fresh debate over whether the earliest coins could be tied to Satoshi Nakamoto. On Saturday, multiple addresses that together held about 600 BTC (worth roughly $48 million) transferred funds after an inactivity stretch spanning well over a decade and a half, according to onchain data reviewed by Cointelegraph.
The latest movement is getting attention because it falls within the period when Nakamoto was still active in Bitcoin’s early development. But blockchain sleuthing by Whale Alert points to a different conclusion: the company says it found no link between these specific mining blocks and Nakamoto.
Key takeaways
- About 600 BTC moved from dormant Bitcoin addresses after more than 16 years, with Cointelegraph tracing the activity to onchain monitoring reports.
- Whale Alert attributes the funds to block rewards from March 2010, when the per-block subsidy was 50 BTC.
- Whale Alert says its research cannot connect any of the 12 relevant mining blocks to Satoshi Nakamoto.
- The same incident builds on Whale Alert’s earlier work that covered seven of the rewards, now expanded to all 12.
- Lookonchain previously identified seven miner wallets tied to the March 2010 mining period, reinforcing the timeline.
Whale Alert expands its mapping of the March 2010 rewards
Whale Alert’s follow-up research, as reported to Cointelegraph, identifies all 12 reward events behind the dormant funds. The transfers originate from Bitcoin blocks mined in March 2010, when each mined block paid a 50 BTC subsidy. Over time, that subsidy has been reduced through Bitcoin’s scheduled halving process.
Most recently, the subsidy fell in April 2024, when Bitcoin’s block reward decreased from 6.25 BTC to the current 3.125 BTC per block, following Bitcoin’s 2024 halving. While that historical note doesn’t change the origin story of the dormant coins, it helps contextualize why coins mined in early 2010 were so much larger per block than today’s issuance.
Whale Alert previously analyzed only seven of the rewards and said in an X post that those blocks were not mined by Nakamoto. This latest work extends the company’s tracing to the full set of 12 reward blocks connected to Saturday’s wallet activity.
Where the “Satoshi” speculation comes from—and why Whale Alert disputes it
Speculation intensified because the moved coins are “Satoshi-era” rewards—mined while Nakamoto was still participating in Bitcoin communications and development. Nakamoto’s involvement didn’t end abruptly; the individual continued to be present in the project through 2010 and then gradually withdrew. Cointelegraph previously reported that the last known communication dates to April 2011.
However, Whale Alert argues that timing alone is not enough to claim a link to Nakamoto. A Whale Alert spokesperson told Cointelegraph that none of the blocks tied to the 12 rewards can be connected to Satoshi based on its research. In other words, although the coins are old enough to keep the mythic connection alive, Whale Alert’s mapping does not support the origin claim.
For traders and long-term holders, the practical takeaway is that “old coins” and “Satoshi-era” are not the same as “Satoshi coins.” The distinction matters because narratives about Nakamoto-linked holdings often feed into heightened speculation, even when the underlying evidence is absent or inconclusive.
Inactivity broke: test-transaction pattern and wallet behavior
Whale Alert also provided interpretive context for how the transfers unfolded. The company noted that one of the 12 reward payments moved several blocks before most of the others. Whale Alert suggested this sequencing resembles a test transaction—followed by later transfers from the remaining related addresses—rather than a single coordinated sweep.
That behavioral detail matters because it influences how observers read the motive behind dormant-wallet activity. A test transaction implies the sender may have been verifying rules or pathways before moving larger amounts, whereas a single immediate consolidation typically points to a different kind of operational intent. Without access to private keys or additional offchain context, onchain pattern analysis is the closest available lens.
Cointelegraph also notes that Lookonchain previously identified seven miner wallets that moved 350 BTC after about 16.5 years of inactivity, attributing those wallets to March 2010 mining. Taken together, the overlap in timing supports that the dormant activity is tied to the early mining subsidy period, even if the participants remain anonymous.
What to watch next as “early coins” come back online
These movements are a reminder that Bitcoin’s early distribution still occasionally reappears on public ledgers—sometimes after extraordinary inactivity. Even when those events are not linked to Nakamoto, they can still matter: large-value transfers from long-dormant addresses can shift sentiment around supply dynamics and may drive short-term speculation about whether more old holdings will move.
For now, the key uncertainty is whether additional related wallets—connected to other early mining outputs—will remain silent or follow this pattern. Investors and traders should watch for follow-on transactions from adjacent early-era addresses and for further onchain attribution work that either corroborates or refines the “which blocks were mined by whom” questions.

Lee opens the picture with a funeral, or, rather, a small family piling into their car to get to the funeral venue. Wife and mother Mi-ok (Jeon Do-yeon) wonders if she’s wearing the right dress, and the shoes she has chosen, a pair she hasn’t worn in a long time, are already pinching her feet. Her husband, Ho-seok (Sul Kyung-gu), says little—so little that it’s clear he’s filled with dread over whatever awaits him at this upcoming, obviously unhappy social event. Their extremely quiet young son (Jung Seop) sits in the back seat, amusing himself by dangling an empty chip bag out the window like a windsock. “It’s flying,” he says, just before letting it go—he’s not the only one feeling the oppressiveness of that car ride.
It’s never expressly spelled out who this funeral is for, but we can intuit that it’s one of Ho-seok’s former work colleagues. It turns out that Ho-seok is one of many workers who not so long ago lost his job at a large corporation, SP, and he hasn’t yet recovered, either financially or emotionally. Mi-ok is doing the best she can—she holds down a menial factory job—but her husband’s depression and excessive drinking is getting to her. By chance, in the funeral home parking lot, she meets a handsome stranger, Sang-woo (Zo In-sung), who moves his very expensive car when Mi-ok believes her wedding ring, having slipped off her finger, has rolled beneath it. It turns out that Sang-woo’s wife, Ye-ji (Cho Yeo-Jong), is making a documentary about, as she puts it, “the personal lives of laborers.” Ye-ji is thrilled to have found Mi-ok and Ho-seok as subjects—she’s particularly interested in the melancholic Ho-seok, who, she believes, could be the dramatic key her project. But she and Mi-ok also genuinely like each other and strike up a friendship. Possible Love traces the tangled dynamics between these four characters, while also flirting with uncomfortable questions about the moral quandaries that can arise in any filmmaker-subject relationship.
The spot exchange-traded funds tracking the largest cryptocurrency attracted almost $1 billion in the past week, despite the $236 million in net outflows registered on September 1.
The Ethereum ETFs were also well in the green. They have marked more inflows than outflows for eight out of the past nine weeks.
BTC ETFs See Another $1B in Inflows
The previous business week ended with a $201.81 million net outflow from the spot BTC ETFs, but the overall performance was quite impressive. The inflows in the other four days offset all the losses on Friday, and the week ended with a net gain of $924.48 million. Thus, the funds built on the previous week’s major inflows of $1.92 billion.
August finished with net inflows of $216.70 million, followed by $236.46 million in net outflows on September 1. Investors shifted their stance in the following three days by attracting $101.15 million on Wednesday and $174.60 million on Friday. Thursday was particularly spectacular, as the funds gained $730.87 million, the highest amount since January.
Thus, the total number for the week was $986.85 million, bringing the cumulative net inflows to $55.62 billion. Recall that this number had plummeted to $51.79 billion in mid-August.
BlackRock’s IBIT remains the undisputed leader in the ETF space, with cumulative net assets exceeding $62.6 billion. Fidelity’s FBTC follows suit with $14.07 million, and Grayscale’s larger fund, GBTC, is next with $10.36 billion.

ETH ETFs in Green, Too
Given their size, the spot Ethereum ETFs have performed even better over the past several weeks. As mentioned above, they have had only one red week since early July, and even that was quite modest, with just $2.26 million in net inflows back in mid-August.
The financial vehicles gained $824.42 million during the week that ended on August 28, and another $218.41 million in the first week of September. Thursday was once again the most notable day in terms of net inflows, with $141.39 million entering the funds. Another $87.68 million went in on Monday, $10.95 million on Tuesday, and $26.46 million on Friday. The only red day was Wednesday with $48.08 million.
The cumulative total net inflows have skyrocketed from $10.89 billion in early July to $13.19 billion on September 4.

The post Bitcoin ETFs Rake In Nearly $1 Billion as Ethereum Funds Keep the Streak Alive appeared first on CryptoPotato.


Better Mortgage can reuse the pledged bitcoin, and borrowers cannot recover their crypto until the main conventional mortgage is fully repaid or refinanced.

Brooklyn Beckham and wife Nicola Peltz beam as they make low-key departure from Venice Film Festival after loved-up red carpet appearance

Tyra Biosciences: ‘Hold’ IR-NMIBC Data Sept. 9 With Caution Ahead For 2027 Readouts (TYRA)

Jennifer Garner’s Two-Piece Office Set Style Is on Amazon





-

 Fashion2 days ago
Weekend Open Thread: Beyond Yoga
-
 Crypto World2 days ago
Bitcoin price stalls near $82K as key resistance holds
-

 Politics2 days ago
Best Gaming Laptops, CPUs, TVs, And Keyboards To Upgrade Your Set Up For GTA VI
-

 Tech2 days ago
The Birds Outside, Drawn For You Automatically
-

 Crypto World2 days ago
IMF Says El Salvador’s Post-Review Bitcoin Purchases Used No Public Funds
-
 Crypto World2 days ago
U.S. added stronger than expected 162,000 jobs in August as labor market bounced back
-

 Sports2 days ago
Alexandre Pato consortium’s Northampton Town investment approved
-

 Sports2 days ago
Commanders’ Chig Okonkwo is a top breakout fantasy football candidate
-

 Sports2 days ago
Golden Eaglets Drawn in Group B for 2026 WAFU B U17 Championship
-
 Crypto World2 days ago
XRP price breaks falling channel as bulls target $1.53
-
 Politics2 days ago
A new European chapter for Gibraltar
-

 Politics2 days ago
The House | Bin the lectures, bring gossip and be ready to banter: how the new PM should prepare for his Trump encounter
-

 Politics2 days ago
How To Avoid Winter Colds: 4 Everyday Habits That Spread Germs, Says Pharmacist
-

 Crypto World2 days ago
From warning to listing: UK’s largest retail investment platform opens access to crypto ETNs
-

 Crypto World2 days ago
FinCEN flags $12.7B tied to Southeast Asia crypto investment scams
-

 Tech2 days ago
A Worthy Android Ereader, With Some Tradeoffs
-

 Tech2 days ago
How To Edit Claude’s Memory
-

 Crypto World2 days ago
Trezor Data Breach Impacts 67,000 More US Customers
-

 Politics2 days ago
33 Cosy Autumn Home Decor Ideas: Blankets, Pumpkin Decorations, And Candles
-

 Tech2 days ago
beyerdynamic AVENTHO Y Debuts at IFA 2026 and Makes Wireless Headphones Less Disposable
You must be logged in to post a comment Login