
Crypto World
Ethereum commits to letting users pay gas fees without having to hold ETH



The Frame Transactions feature was locked into the Hegotá upgrade last month, and Ethereum co-founder Vitalik Buterin says the work has moved quickly since.

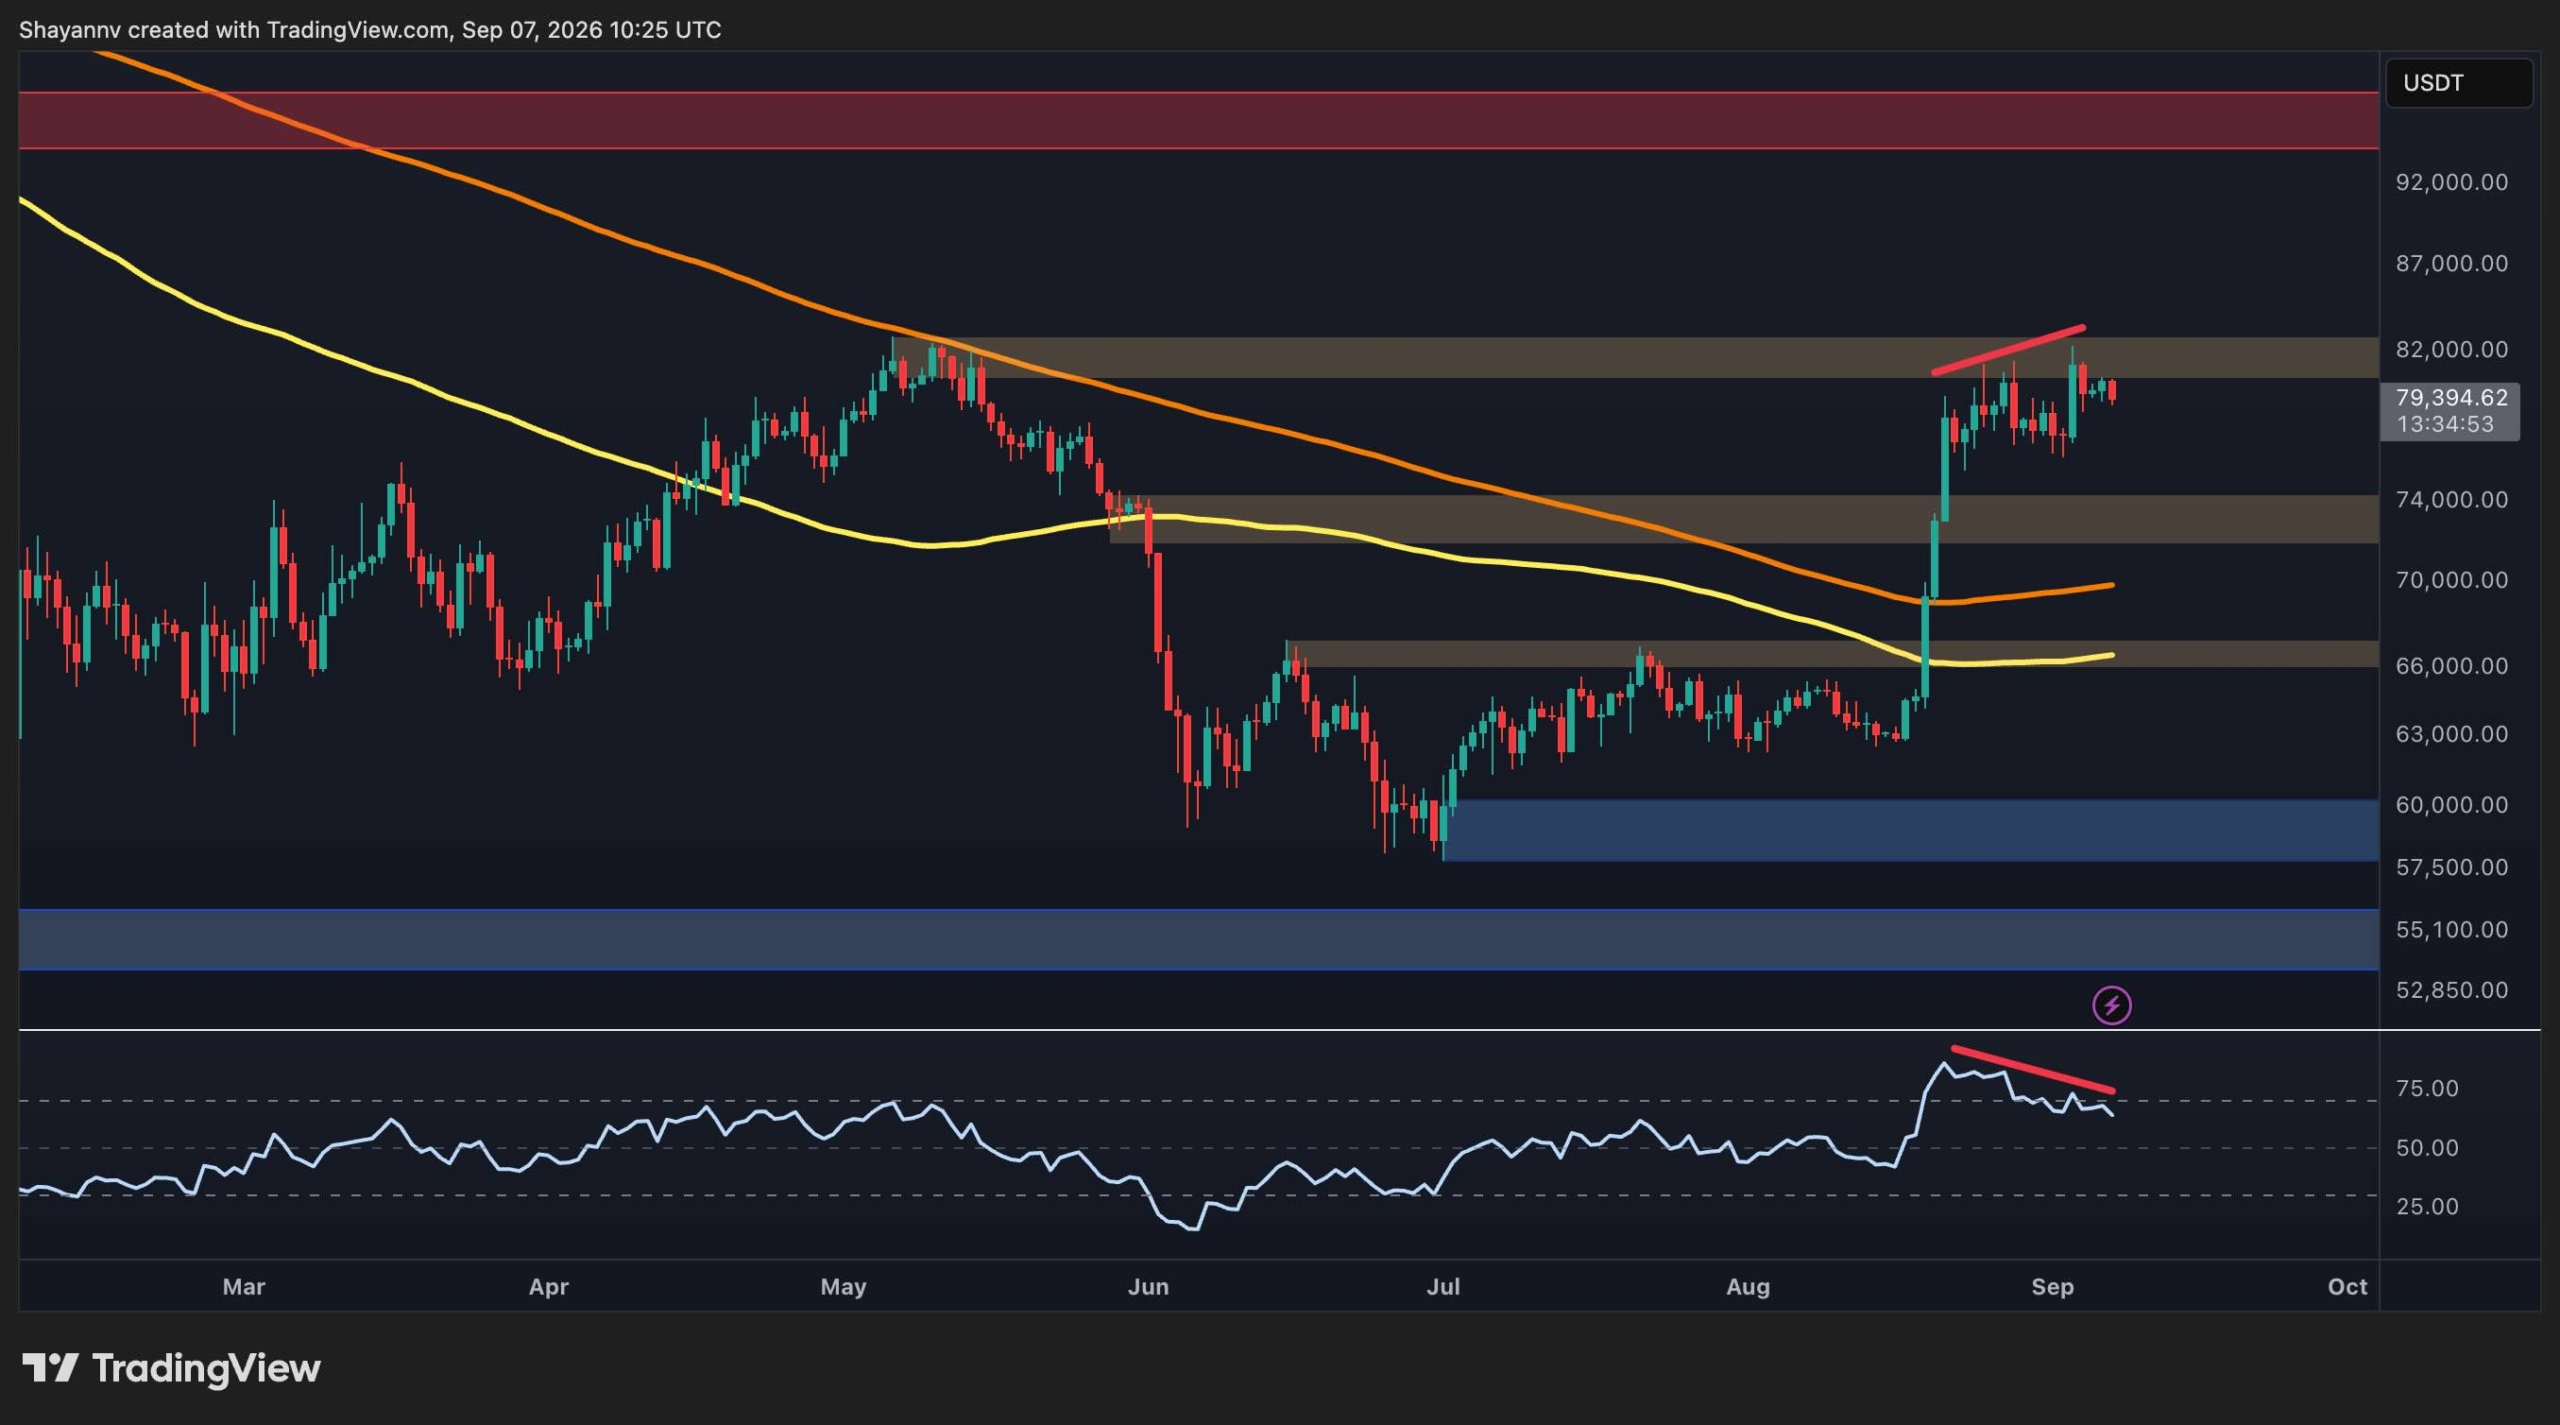
Bitcoin is consolidating around $80K after a sharp recovery from the $60K area. While the broader structure has shifted constructively, BTC is now facing a significant resistance zone near $80K-$82K, while momentum indicators suggest that the latest advance is losing strength.
Bitcoin Price Analysis: The Daily Chart
The daily chart shows a clear structural improvement following the strong breakout from the $66K consolidation area. BTC has reclaimed both major moving averages shown on the chart, with the 200-day moving average now around $70K and the 100-day average near $66K. As long as the asset remains above these levels, the broader recovery structure remains intact.
The immediate obstacle, however, is the $80K-$82K resistance zone, which has repeatedly capped the recent leg up. BTC briefly pushed into this area but failed to establish a sustained breakout and has since moved sideways around $79K-$80K. A decisive daily close above $82K would likely strengthen the bullish case and expose the next major resistance area around $95K.
Conversely, rejection from the current zone could trigger a deeper retracement toward the $72K-$74K area, which represents the first major daily support zone. Below that, the $66K region becomes particularly important as the last line of defense before the base of BTC’s recent rally.
The RSI has also cooled considerably from its recent overbought reading above 80. More importantly, the indicator is making lower highs while BTC is testing or approaching previous highs, creating a bearish momentum divergence. This does not necessarily signal an imminent reversal, but it suggests that upside momentum is becoming less convincing and that a breakout may require renewed buying pressure following a short-term consolidation or correction.
BTC/USDT 4-Hour Chart
The 4-hour structure presents a more clearly defined ascending channel. Following the sharp breakout from the $72K-$74K region, BTC has been oscillating between the rising channel boundaries, with the lower trendline currently situated around $77K and the upper boundary at $82K.
The price is currently around $79.4K, leaving BTC roughly in the middle-to-upper portion of this range. The $80K level is therefore an important near-term threshold, while the $82K level remains the primary resistance area.
A clean break above $82K, preferably accompanied by sustained 4-hour closes above the channel’s upper boundary, would invalidate the immediate range-bound setup and could open the door toward higher levels. On the other hand, a rejection followed by a loss of the lower trendline at $77K would increase the probability of a move back toward the $72K-$74K support zone.
The latest price action also indicates that the strong impulsive move higher has transitioned into consolidation. This can be constructive if BTC continues to hold the upper part of the range, but a breakdown through the lower channel boundary would suggest that the market needs a deeper correction before another attempt at the highs.

On-Chain Analysis
The Spot Average Order Size chart shows relatively little whale activity around Bitcoin’s current $77K-$80K trading range. In contrast, there was significantly more whale activity around the $60K-$65K lows, where larger orders were heavily concentrated. This positioning may have reflected accumulation near the market bottom, as Bitcoin subsequently rallied sharply from that area toward $80K.
The relatively limited whale activity at current levels could suggest that large participants are not aggressively adding exposure around the recent highs. This does not necessarily imply distribution, but it indicates that the current rally has not been accompanied by the same degree of whale activity seen near the lows.
From a broader perspective, the concentration of larger orders around the $60K-$65K area is notable because it preceded Bitcoin’s substantial recovery. If that activity represented accumulation, the subsequent rally could indicate that some of those positions are now in profit. Meanwhile, the lack of significant whale activity around $77K-$80K leaves the market more dependent on whether buyers can generate enough momentum to break the $80K-$82K resistance zone.

The post Bitcoin Price Analysis: BTC Bulls Need to Break This Key Level to Regain Momentum appeared first on CryptoPotato.
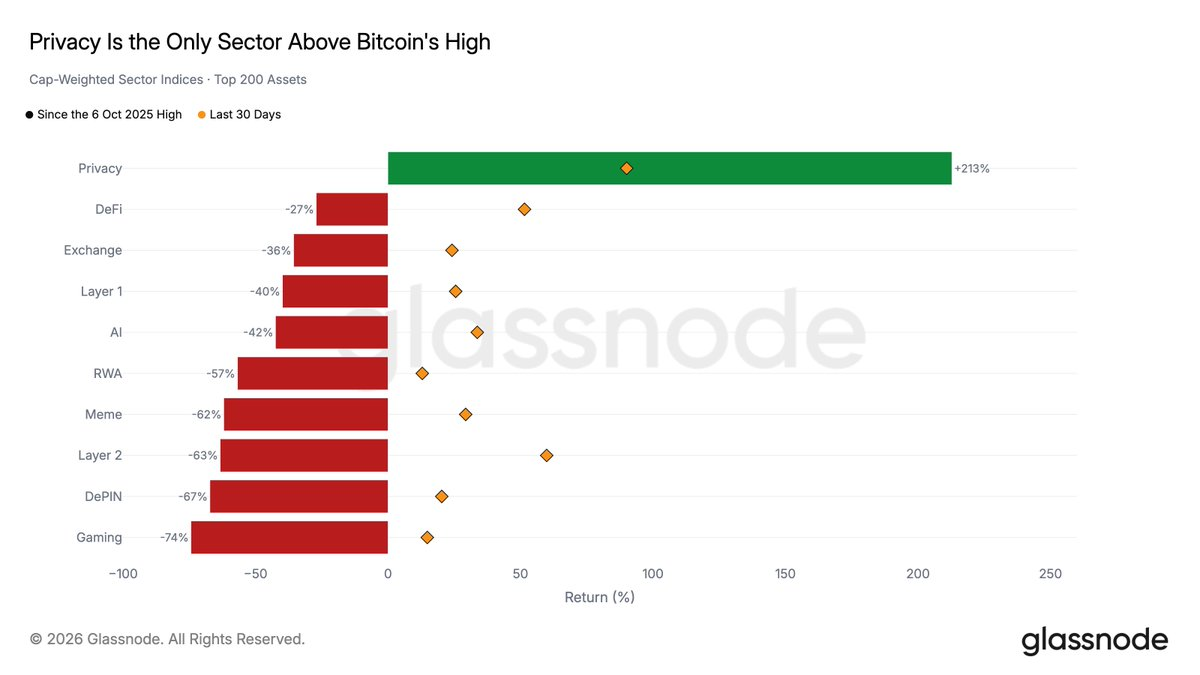
Privacy coins are up 213% since Bitcoin (BTC) peaked last October. Every other crypto sector is down, according to on-chain analytics firm Glassnode.
The median coin in the top 200 is 58% cheaper than it was that day. Bitcoin itself still trades 36% below its own record.
Privacy Coins Are the Only Sector Above the High
Glassnode tracks 10 sectors, scoring each against its price on October 6, 2025, the day Bitcoin topped out at $126,199 on Binance.
Privacy is the only green bar on the chart. DeFi is the best of the losers, down 27%. Gaming is the worst, down 74%.

Last month was kind to almost everything, with all 10 sectors rising.
Still, privacy coins led that leg too with a 90% gain. Therefore, the ranking did not change, with only 9% of the top 200 sitting above their October price, even after that broad bounce.
So the altcoin season never arrived in the shape holders wanted. Money picked one theme and stayed there.
Zcash Is Doing Almost All the Work
Privacy coins were worth $7.1 billion a year ago. Glassnode now values the group at $33.6 billion, just above Tron (TRX), the eighth-largest crypto. Zcash (ZEC) supplies most of that. It trades near $1,180 and ranks ninth by market value at $19.9 billion.

Notably, while the ZEC price is up 687% since Bitcoin’s high, the privacy sector is up 213%.
Only four of the 25 largest coins beat their October price. Two are privacy names, ZEC and Monero (XMR), which has roughly doubled.
That notwithstanding, the run was not smooth, with Zcash having to patch a critical bug in its shielded pool in June. It then sealed that pool with the Ironwood network upgrade in July.
In August, BeInCrypto asked whether ZEC could reach $1,000 this cycle, when it was trading near $675. It cleared that level days later, and Grayscale’s Zcash ETF assets have reached $463 million.
The Bottom of the Sector Is Thin
Glassnode says all eight privacy coins with a year of history have gained. Three of them barely have. Decred (DCR) showed a 2% gain on that reading. Two others managed 3% and 6%.

CoinGecko now puts Decred down 2.9% over 12 months. The claim’s weakest leg has already flipped. Zcash and Monero together hold about 90% of the sector’s value.
A stall in Zcash price action would wipe out the one green bar on Glassnode’s chart.
The post One Crypto Sector Is Up 213% While the Rest Struggles appeared first on BeInCrypto.


- KuCoin launches KCUSD with a base APR of up to 4%.
- KCUSD offers daily returns on eligible stablecoin balances.
- KuCoin plans to expand KCUSD into collateral and trading utility.
KuCoin has launched KCUSD, a new Earn product designed to help stablecoin holders generate returns on otherwise idle balances.
The product will be available to eligible retail, high-net-worth, and institutional users, with subscriptions initially starting from as little as 1 USDT, USDC, or USDG.
KCUSD will offer a dynamic base annual percentage rate (APR) of up to 4%, with users able to earn returns simply by holding the asset.
KuCoin said there will be no subscription fee, while redemptions will be available in the same asset used for subscriptions.
Returns will be credited daily and automatically added to users’ KCUSD balances.
This structure allows returns to compound daily without requiring users to manually reinvest their earnings.
During the initial launch period, eligible users who participate with qualifying new funds may receive a promotional APR of up to 6%, according to the company.
Product targets idle stablecoin balances
KuCoin said stablecoins play a central role in digital asset market liquidity, but significant balances can remain idle in trading accounts.
Users may keep stablecoins available for margin requirements or time-sensitive trading opportunities, potentially leaving those assets without a yield.
The exchange said moving such balances into traditional staking or standalone Earn products can reduce their immediate trading utility.
The trade-off is particularly relevant for institutions, market makers, professional trading firms, and high-net-worth users that maintain large stablecoin balances for extended periods.
KCUSD initially addresses this issue through a hold-to-earn model, allowing users to generate returns while holding the product.
KuCoin also plans to expand KCUSD’s utility in the future by integrating it as collateral or margin.
The company said this planned functionality is intended to reduce the trade-off between earning returns and maintaining access to capital for trading activities.
KuCoin plans broader utility for KCUSD
KuCoin CEO BC Wong said the launch reflects the company’s view that digital asset infrastructure needs to focus not only on access and liquidity but also on how efficiently capital can be deployed.
“Our long-term view is that yield, liquidity and risk utility should not remain in separate silos,” Wong said.
KuCoin described KCUSD as an infrastructure layer that could connect liquidity, asset productivity and risk management across its ecosystem. The product is expected to begin with yield generation before progressively expanding toward collateral and trading utility.
The company said the development reflects a broader shift in digital finance, with stablecoins increasingly being positioned as productive capital rather than solely as settlement assets or reserves.

Bitcoin posted its first weekly close above $80,000 in roughly four months, landing just after markets refocused on a fresh batch of U.S. inflation releases ahead of the Federal Reserve’s Sept. 16 meeting. The move comes as investors balance softer inflation prints against renewed pressure from a stronger labor market and ongoing policy uncertainty.
At the same time, analysts say BTC’s bounce still lacks the spot-market participation needed to decisively break out of the $80,000 area. On-chain and derivatives data point to a rally that has leaned heavily on futures positioning—an imbalance that typically increases the odds of volatility if macro conditions turn.
Key takeaways
- Bitcoin achieved its first weekly close above $80,000 since early May, according to TradingView data.
- U.S. CPI and PPI prints are due this week ahead of the Sept. 16 Fed decision; CME’s FedWatch Tool shows 0.25% hike odds at 58.4%.
- Japan’s record yen interventions coincide with a reported $79.57 billion drop in foreign reserves, raising questions about ongoing U.S. Treasury sales.
- CryptoQuant argues recent upside volatility was driven more by derivatives open interest than by spot/on-chain accumulation.
- Bitcoin’s weekly supertrend indicator turned “buy” for the first time since late 2025, echoing a pattern seen during the early-2023 recovery.
Inflation week before the Fed: what markets are betting on
Inflation data returned to the center of crypto sentiment after earlier employment news pushed risk assets lower. This week, the August Producer Price Index (PPI) is scheduled for release on Thursday, followed by August CPI on Friday.
Prior CPI figures offered a mixed backdrop: the August CPI print “matched market expectations” at 0.1% month-on-month and 3.4% year-on-year, following softer-than-anticipated June results. Even so, Fed leadership has continued to stress that recent improvement may not yet justify changing course. Speaking at the Jackson Hole economic symposium in late August, Federal Reserve chair Kevin Warsh said lower headline measures did not, by themselves, establish that underlying inflation trends were meaningfully improving.
That distinction matters for traders because the Fed’s policy reaction function depends heavily on “trend” inflation rather than isolated prints. In response to Warsh’s remarks and the broader data flow, markets shifted toward a higher probability of rate hikes for the Sept. 16 meeting.
According to CME Group’s FedWatch Tool, the consensus currently favors a 0.25% rate hike, with odds at 58.4%. This hawkish tilt intensified after last week’s nonfarm payrolls report, which came in “far stronger than expected” and included upward revisions to earlier figures. The U.S. economy added 162,000 jobs in August versus a prior estimate of 56,000.
A stronger labor market generally reduces pressure on the Fed to loosen policy—especially when core inflation remains above the Fed’s 2% objective. While some officials have discussed support for pausing rate hikes, the market is still focused on how PPI and CPI could reshape expectations in the days before the meeting.
Mosaic Asset Company suggested that the jobs report could still carry an equity-friendly angle through corporate earnings, but also warned that seasonality may complicate matters. It noted that September is traditionally equities’ weakest month and that volatility may rise into the Q4 period, with U.S. midterm elections adding another potential catalyst for turbulence.
Japan’s intervention record keeps yen and liquidity in focus
Beyond U.S. inflation, traders are also tracking Japan’s yen dynamics. Japan’s Ministry of Finance reported that foreign reserves fell by $79.57 billion from the end of July amid record currency intervention. The yen strengthened to around 155 per dollar and held that level during Monday’s Asia session.
Bloomberg previously reported that Japan may have relied heavily on selling U.S. Treasuries to fund these operations. That approach could have second-order effects for U.S. bond markets and for how long Japan can sustain intervention without drawing Washington’s response.
The concern extends to the Bank of Japan’s (BOJ) position. If yen weakness returns and further intervention becomes necessary, critics argue it could become harder for both the ministry and the BOJ to act within their constraints.
Polymarket data currently prices in a BOJ September rate increase, reflecting the idea that policy makers may need to tighten to defend the currency. With benchmark rates already at the highest level since 1995 at 1.0%, Polymarket is showing 98% odds of a 0.25% hike.
For crypto, these FX and rates headlines can matter because BTC and broader risk markets are sensitive to changes in USD/JPY, particularly where yen-carry trades and global liquidity conditions are concerned.
Derivatives surge without clear spot confirmation
Even as BTC reclaimed a key weekly milestone, analysts argue the underlying demand signal is still incomplete. CryptoQuant pointed out that the recent upside volatility was paired with sharp increases in derivatives open interest, suggesting that derivatives traders drove a large share of the move rather than spot buyers.
In one example, CryptoQuant reported that aggregate open interest rose from $25.2 billion to $27.53 billion in a single session—an increase of about $2.3 billion (+9.24%). On an hourly basis around 09:00 UTC, price action and open interest began expanding almost simultaneously, which CryptoQuant interpreted as evidence of new position-building.
At the same time, CryptoQuant said realized cap did not keep pace with the open interest jump. In its view, the rally had some spot/on-chain participation, but the dominant driver was futures leverage—creating a market structure that can unwind quickly if funding conditions change.
This imbalance shows up in how spot demand is tracking. CryptoQuant cautioned that spot demand remains negative and that it has been diverging from futures demand on a 30-day rolling basis. The platform also highlighted that spot BTC outflows increased further even after the rebound—its interpretation being that the rally did not yet translate into persistent spot accumulation.
Previous Cointelegraph coverage also flagged similar concerns, describing how apparent demand had turned negative as BTC’s dormant supply growth outpaced new issuance. For traders, the practical implication is that a sustainable breakout typically requires stronger spot absorption—conditions that remain uncertain as long as derivatives lead.
Liquidity walls around $80,000 and a bullish-but-testable trend signal
BTC’s weekly close above $80,000 marks a notable technical shift, but the $80,000 zone is not yet acting as reliable support. Sell-side liquidity continues to cluster just above the level, keeping price pinned within a narrower trading range.
CoinGlass data shows liquidity concentrated around $80,560, forming what the analysis describes as a thick wall of resistance. This helps explain why BTC has been unable to hold above $80,000 consistently despite the bullish weekly close.
Looking higher, on-chain-focused commentary from Glassnode previously identified additional dense liquidity bands—especially a band between $83,000 and $86,000. In its newsletter, Glassnode wrote that an upward impulse consumed some short orders but stopped short of the densest cluster of short liquidation “fuel” in that upper zone. Below spot, it said the move left intact a separate long liquidation band between $60,000 and $63,000, framing the current consolidation as a market trapped between boundaries.
Chart-watchers are also watching for a potential resolution direction. Jesse Olson, developer of the Markets Sniper trading suite, suggested BTC/USD could be repeating a bullish chart fractal from August 2023, with $76,000 described as a potential local reversal point.
Supertrend flips green: why the weekly indicator stands out
One of the clearest trend signals cited in the market commentary is BTC’s weekly supertrend indicator. Sunday’s weekly close flipped the indicator to green for the first time since November 2025, producing a “buy” signal.
The supertrend method uses average true range (ATR) and a multiplier to calculate a trendline, then issues a buy or sell signal based on how price interacts with that level. Weekly signals are closely watched by Bitcoin traders because, as the analysis notes, a weekly close above the supertrend line has not occurred during a bear market. The last time supertrend switched from red to green was in mid-January 2023, when BTC’s bear-market bottom at $15,600 was already about two months behind it.
That historical context is part of why some traders view this as more than a short-term signal. It also aligns with other indicators analysts cited recently, including BTC’s earlier weekly reclaim of its 50-week exponential moving average—an event described as historically important for long-term trend reversals after a prolonged downtrend.
What to watch next is whether the market’s key catalysts—U.S. CPI/PPI ahead of Sept. 16, and ongoing yen-liquidity developments tied to Japan’s intervention path—translate into stronger spot participation. If derivatives remain the primary driver while spot demand stays weak, the $80,000 breakout signal may stay vulnerable despite bullish trend indicators.
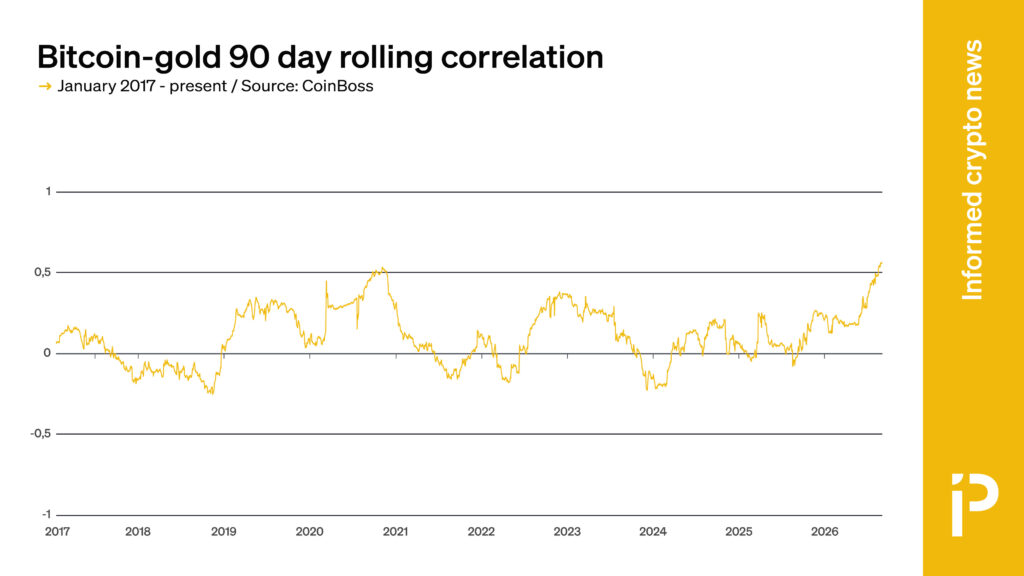
BTC’s 90-day price correlation with gold has reached +0.56, its highest level since most data providers started measuring it in January 2017 and higher than its prior record of +0.5 in November 2020.
Meanwhile, the 90-day correlation of BTC with the Nasdaq 100 index slid to roughly +0.30 over the same window, a one-year low.
Pearson price correlations range from -1 to +1. Perfect correlation is +1, meaning the assets always affect one another’s price and never decouple in their correlated movements.
At 0 or “no” correlation, the assets never affect one another’s price. At -1, the assets move in perfectly opposite directions — one rising and one falling by proportionally consistent amounts.
Mathematicians choose a set length of time to determine how correlated their prices are; for example, over the last 90 days.
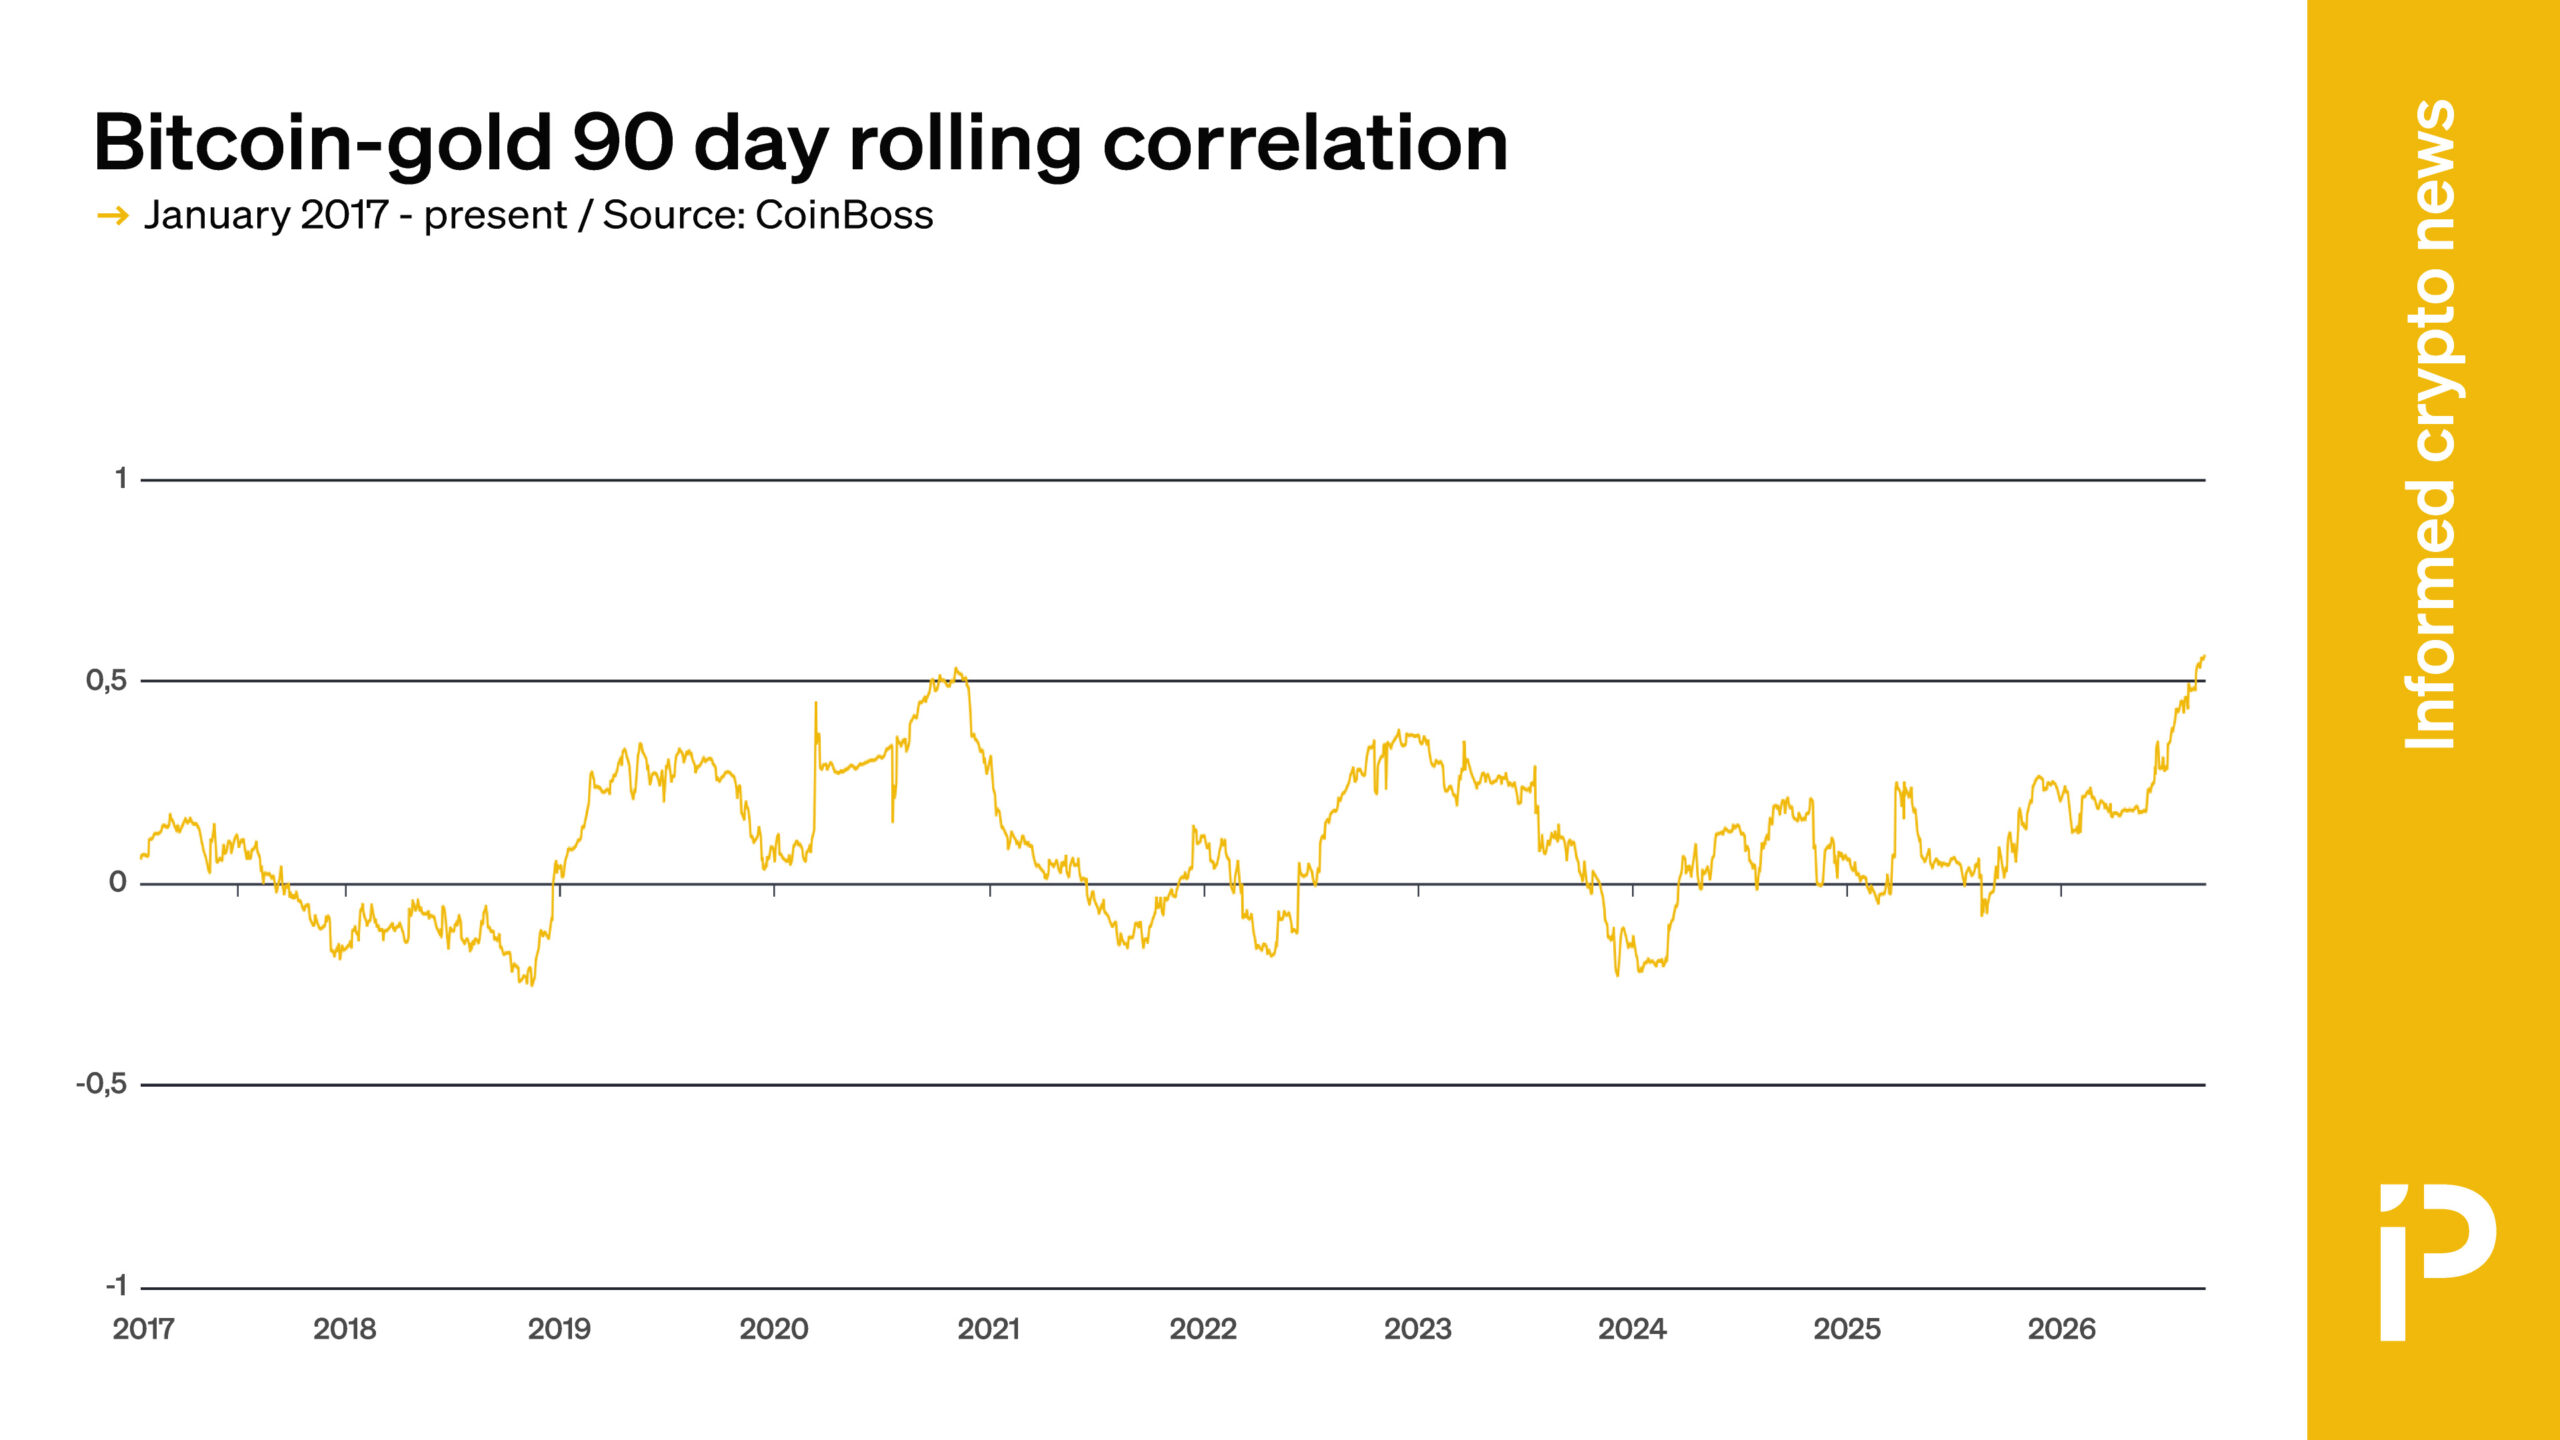
At a +0.56 correlation and rising, the narrative of “digital gold” is back for BTC and displacing its Nasdaq “tech play” narrative.
Noting the increased coupling, Bitwise Asset Management wrote, “The argument that BTC is ‘just a leveraged tech investment’ may not be true after all.”
Bloomberg’s senior ETF analyst similarly found that BTC correlated less with US stocks over six months than gold. The finding “blows up the claim,” he said, that BTC “is just QQQ.”
August’s debasement trade reunited gold and BTC
On a shorter, 30-day timeframe, gold’s correlation with BTC has risen to an even higher Pearson rating of +0.72. On that 30-day rolling period, its Nasdaq composite correlation sunk to 0.22.
The two assets snapped back into high correlation on one date for one reason.
After US Treasury Secretary Scott Bessent commenced Quantitative Easing (QE) Lite by buying back billions of dollars in long-dated bonds, the debasement trade surged. Traders rushed into gold, BTC, and other debasement proxies.
Within 24 hours, gold rallied 4.6%, BTC skyrocketed 9.2%, and silver and platinum both surged 6%. Nasdaq, meanwhile, barely budged that day, closing within 0.6% of its opening price.
In early August, Protos reported that gold had outrun BTC by more than 70% over the prior year. Its amplification continued in August, with BTC rallying 22.8% across August 19-21, far surpassing gold’s 6% rally over these three days of initial “QE Lite” exuberance for ostensible protection against fiat debasement.
Got a tip? Send us an email securely via Protos Leaks. For more informed news and investigations, follow us on X, Bluesky, and Google News, or subscribe to our YouTube channel.
Industry leaders debate whether digital dollar wallets will dismantle traditional bank accounts or simply modernize the underlying infrastructure.
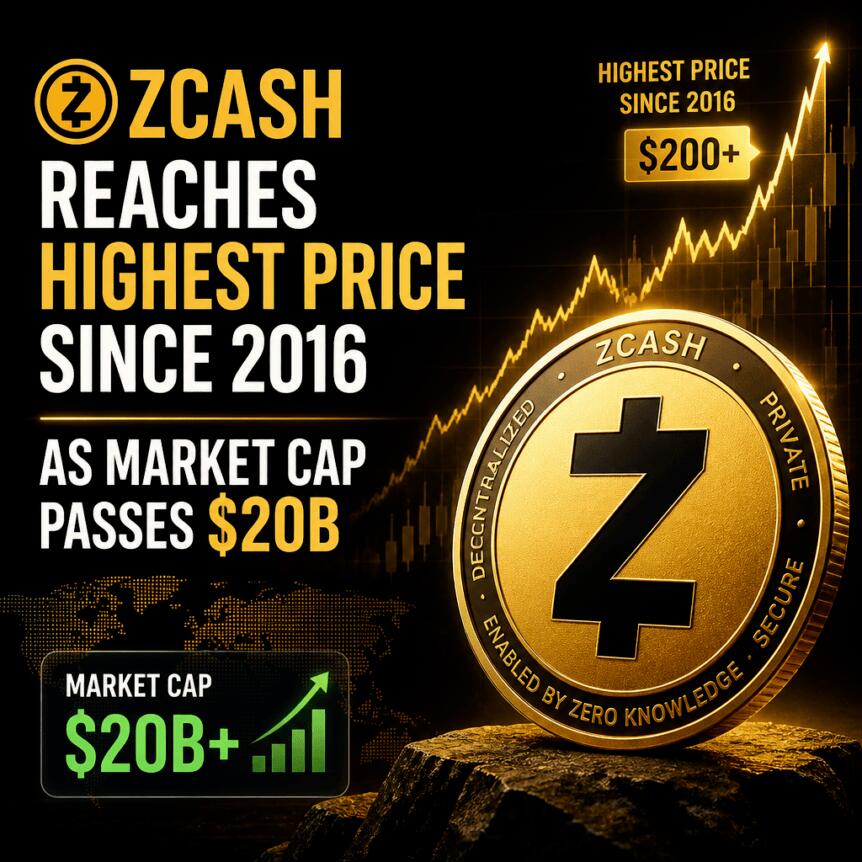
Zcash has surged to its highest level since 2016, pushing the privacy-focused token’s market capitalization past $20 billion as momentum continues into the new week. CoinGecko data shows ZEC briefly touched $1,249.28 before easing to around $1,195 on Monday.
The move has been rapid: ZEC is up roughly 45% over the past week and about 138% across the last 30 days, according to CoinGecko’s price charts. While the latest rally is impressive, it still sits below Zcash’s launch-era peak—CoinGecko lists an all-time high of $3,191.93 on Oct. 28, 2016, when only a small supply of tokens was available.
Key takeaways
- ZEC reached the highest price since 2016, with CoinGecko reporting a peak near $1,249.28 before a pullback to about $1,195.
- The token has gained approximately 45% in a week and 138% in 30 days, helping push Zcash’s market cap above $20 billion.
- Zcash’s privacy model relies on shielded transactions using zero-knowledge proofs to hide sender, recipient, and transfer amount.
- Grayscale’s Zcash ETF—trading on NYSE ARCA under the ticker ZCSH—has supported renewed attention since it began trading Aug. 25.
- Grayscale research argues privacy demand could rise as AI makes it easier to connect public blockchain activity to real-world identities.
A privacy asset resurfaces at multi-year highs
The latest rally has placed Zcash back in the spotlight for investors looking at how privacy features may translate into real market demand. CoinGecko’s figures show the token extending gains that have steadily built over the last month, rather than spiking and fading quickly.
Zcash’s “shielded” option is central to that narrative. Unlike fully public transfers on most traditional blockchains, Zcash allows users to choose between public and shielded transactions. Shielded payments use zero-knowledge proofs to verify that a transfer is valid without exposing key details such as the sender, recipient, or the amount.
That capability matters because it directly addresses a persistent concern in crypto adoption: transparency can be valuable, but it can also create traceability risks for individuals and businesses. If more market participants believe those risks are increasing, privacy-preserving assets may attract renewed capital.
Grayscale links the privacy thesis to AI-era tracing
In an Aug. 31 analysis, Grayscale’s head of research, Zach Pandl, highlighted Zcash’s privacy features as potentially becoming a “must have” for users who prioritize confidentiality. The argument is not limited to general privacy preferences; Pandl specifically pointed to the role AI could play in raising the difficulty threshold for anonymity.
Pandl said AI could increase demand for financial privacy by making it easier to link public blockchain transactions to user identities. The core idea is that even if transactions are technically pseudonymous, pattern recognition and entity linkage tools can reduce anonymity over time.
For Zcash, that framing aligns with what shielded transactions are designed to do: keep critical transaction data private while still maintaining verifiability through cryptographic proofs.
ETF-driven momentum after Grayscale’s Zcash Trust conversion
Grayscale’s product transition appears to be part of the catalyst behind the renewed interest. The firm converted its existing Zcash Trust into an exchange-traded fund, with the resulting ETF trading under the ticker ZCSH. The fund started trading on NYSE ARCA on Aug. 25, giving traditional brokerage investors a more straightforward way to gain exposure to ZEC.
According to the ETF’s website, the fund closed Friday at $83.77 per share and reported $463.2 million in assets under management. That combination—new access routes plus accumulating assets—often reinforces momentum, particularly when a token is already in a strong price trend.
At the same time, ZEC’s recent performance also underlines how investor narratives can accelerate quickly once a key access point changes. The ETF’s listing did not alter Zcash’s underlying protocol, but it did expand who can buy the exposure and how easily that exposure can be held within existing portfolio infrastructure.
What to watch next for ZEC and the privacy trade
With ZEC now at its highest level since 2016, the next question is whether the rally can hold as the market digests the ETF-driven demand narrative. Traders and long-term observers may want to monitor how liquidity and ETF inflows evolve after the initial momentum phase, and whether broader sentiment toward on-chain privacy continues to strengthen alongside the privacy-and-AI argument.
XRP is currently trading near one of the most crucial resistances after moving up from $1.10 to $1.41-$1.44 in August and September, respectively. XRP bulls have taken it up to its highest level for 12 months, but on-chain data is now posing some doubts regarding the strength of the rally.
The daily chart provides more insight into what is going on. For over 12 months, XRP bulls have been able to contain XRP within the $1.00-$1.41 range, with $1.4108 representing its most recent yearly high. The current level sees the XRP price back near this ceiling.
Key Takeaways
- XRP price is testing the $1.4131-$1.42 resistance area after rising by about 28% from $1.10 in August.
- If the breakout above $1.4131 is confirmed, XRP will face $1.50 and $1.60; otherwise, rejection could lead to a fall to $1.38 and $1.35.
- XRP market capitalization increased from $87 billion to $91 billion, supporting the rise in price.
- The number of active addresses increased to 45,000 but fell again to 35,000, indicating that network activity has cooled down amid the highs.
- XRP number of transactions decreased from 2.15 million to 1.85-1.90 million amid the price rise, generating a bearish divergence.
- For confirmation of the breakout, active addresses should return to 40,000-45,000, and transactions should be above 2 million.
Xrp Price Tests $1.41 Resistance
We looked at the XRP chart, and the short-term trend looks stronger than the broader market structure. XRP climbed from about $1.10 to $1.4131 over the past three to four weeks. That works out to a move of roughly 28%, and the rally has produced a clear series of higher highs and higher lows on the 4-hour timeframe.
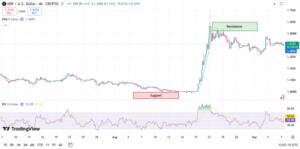
The EMA 9 is also giving buyers some support. It currently stands at $1.4093, with XRP fluctuating near $1.4122. If the price continues above the stated level, short-term momentum will favor buyers. The critical levels are $1.4131-$1.42.
XRP hit a peak of $1.4131 but couldn’t keep it, falling to $1.3988. That shows sellers are still active around this zone. A 4-hour break above $1.4131 will confirm the breakout above the yearly range for the bulls. The next target is $1.50, followed by $1.60. However, in case of failure, the first level to watch is $1.4093. A breakdown of the EMA 9 could see the price fall to $1.35, with support around $1.30-$1.35.
On-Chain Data Raises Some Questions
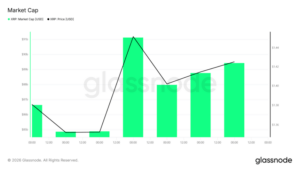
The market-cap figures also indicate the recent surge in XRP. XRP’s market cap increased from around $87 billion to $91 billion as the price surged from around $1.38 to $1.44, an increase of about 4.6%.
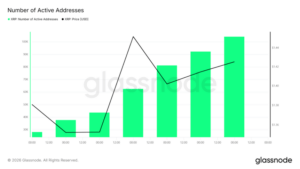
Network activity doesn’t seem particularly convincing. Active addresses rose from around 25,000 to 45,000 as the price reached $1.44, but then dropped to around 35,000.
Transaction activity is even more interesting. Transactions fell from roughly 2.15 million to about 1.85-1.90 million as the XRP price climbed from around $1.36 to $1.44.
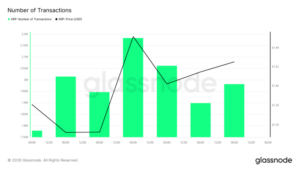
In simple terms, XRP is trading at higher prices, but fewer transactions are taking place on the network. That makes the current rally look more dependent on investors holding XRP than increased network usage. For the move to look healthier, active addresses would need to return toward 40,000-45,000, and transactions would need to push back above 2 million.
What Comes Next for Xrp
The XRP price now has a clear line to watch: $1.4131. A strong 4-hour close above that level could open the door to $1.50 and potentially $1.60. The market-cap data also gives $91 billion an important role, with a move above that level pointing toward the $95 billion area.
If XRP gets rejected again, $1.38 becomes the first major level to watch, followed by $1.35. The technical setup is bullish in the short term, but the on-chain numbers need to improve. XRP can break above $1.41 without them, but stronger transaction activity and more active addresses would give the breakout better confirmation.
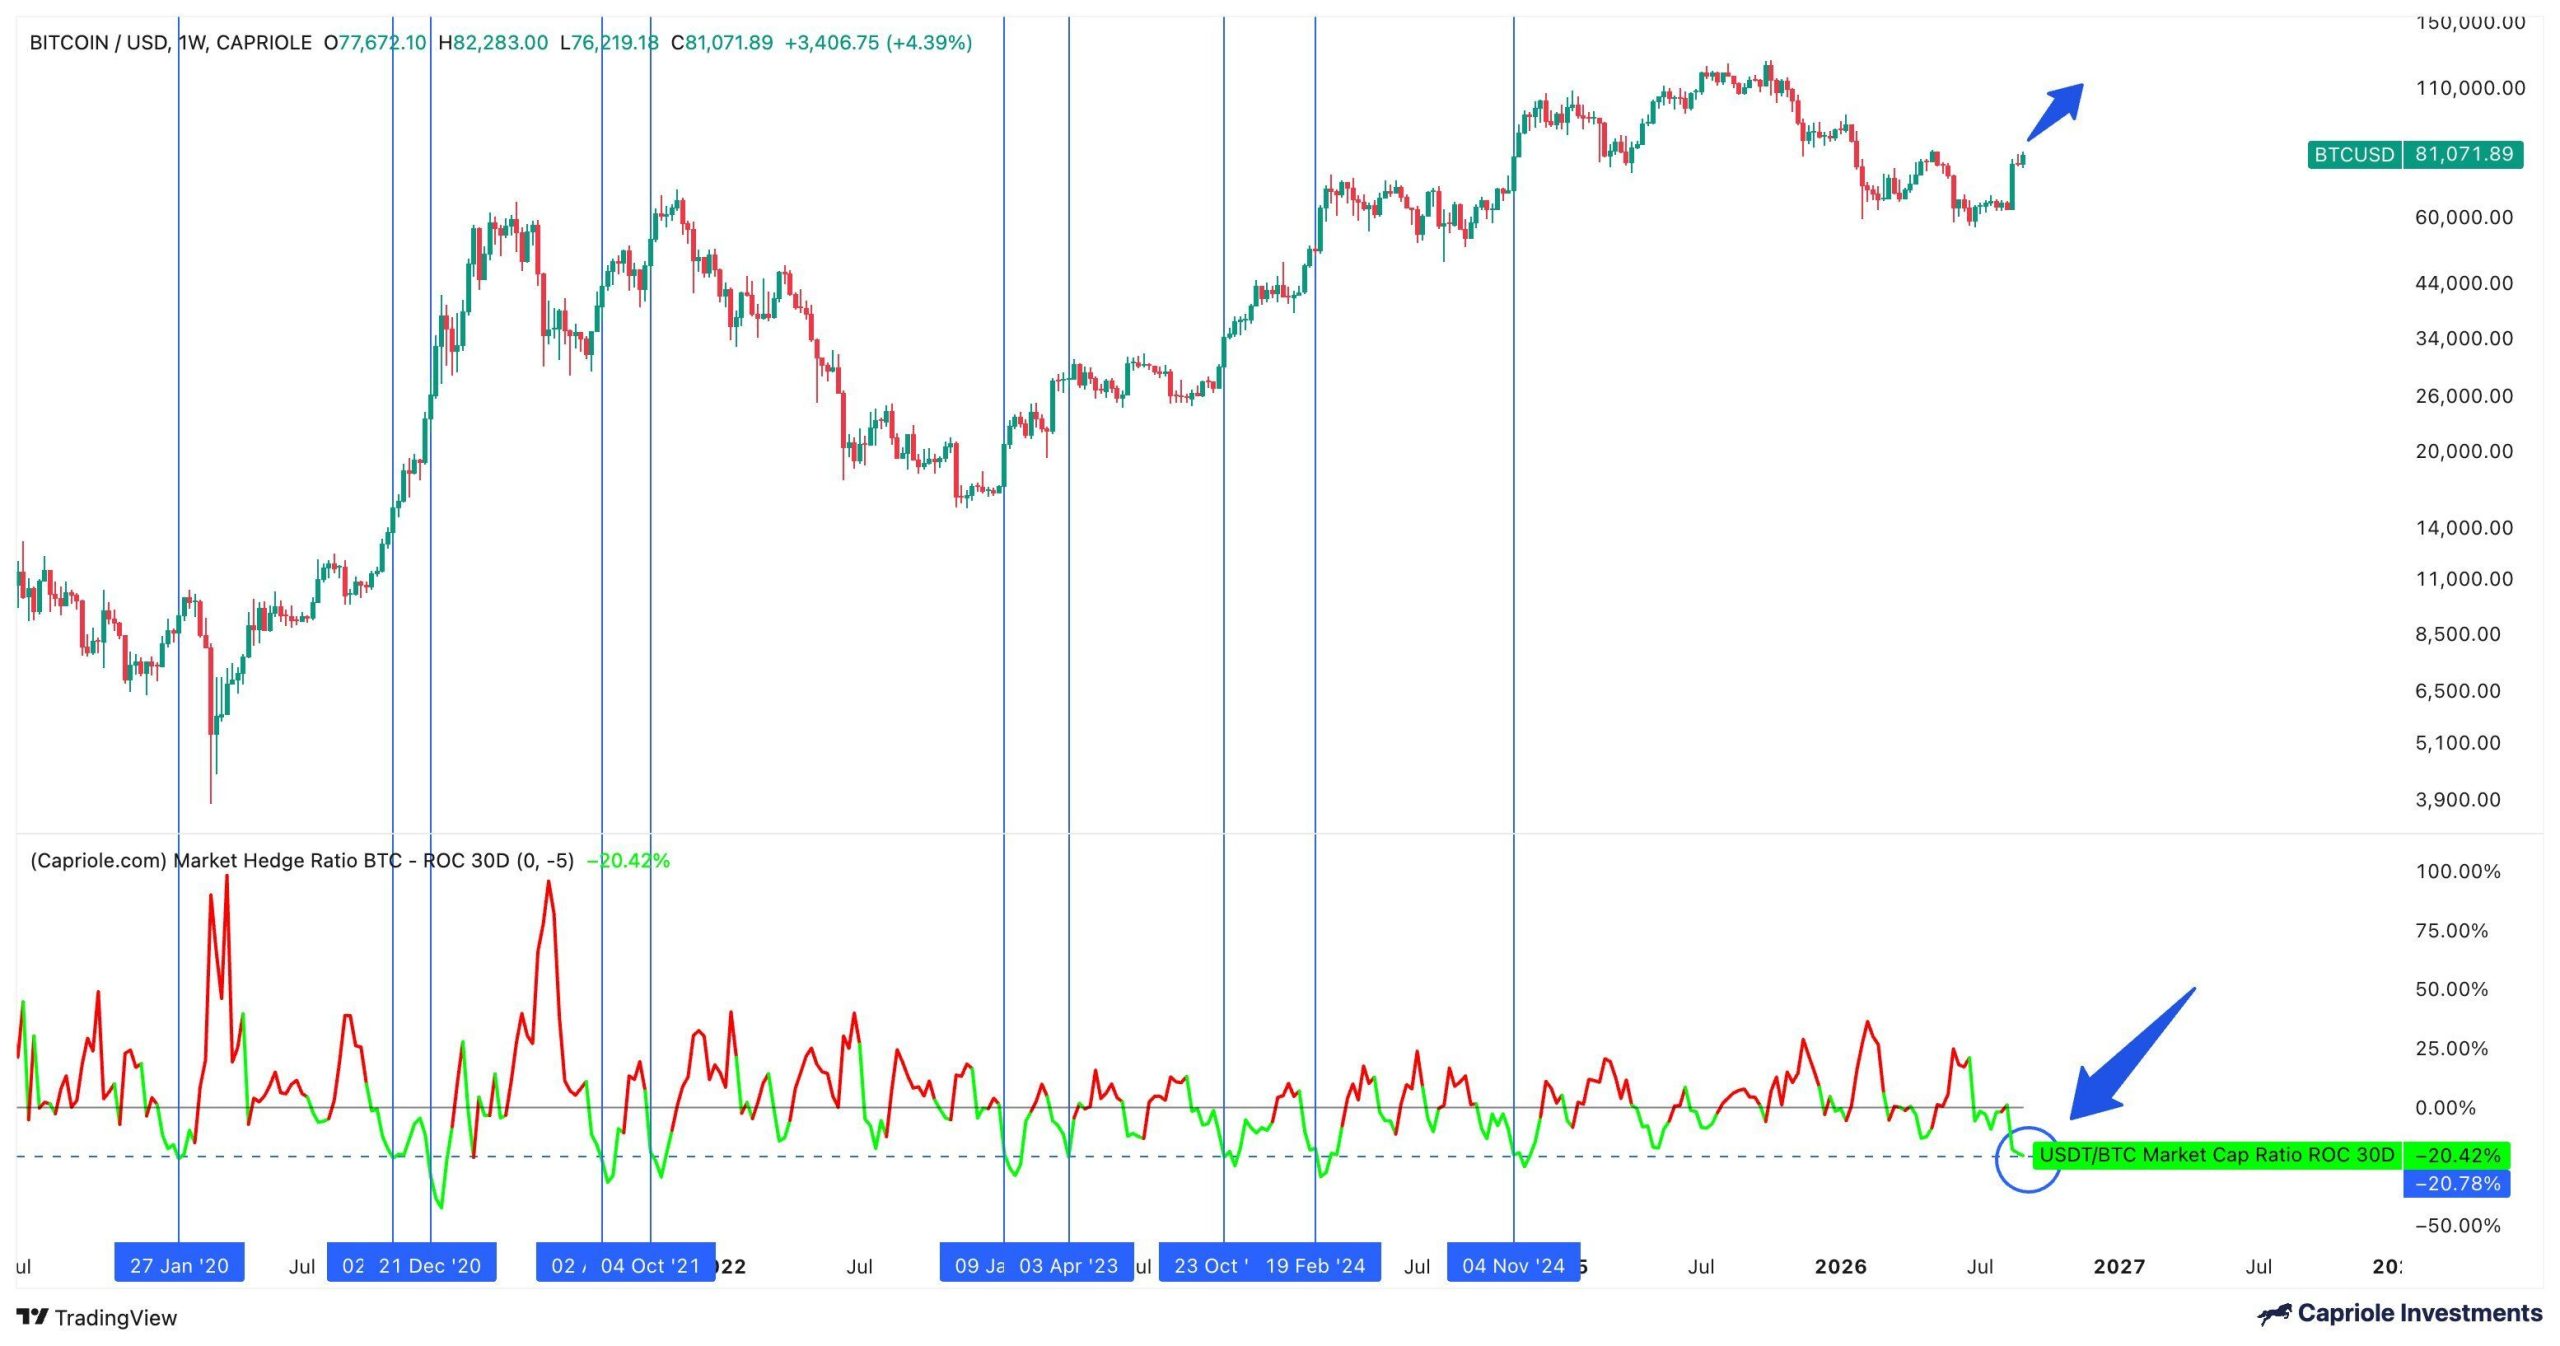
Two independent analysts have concluded that the Bitcoin (BTC) bottom is in, and neither used the other’s data. Charles Edwards tracks stablecoin liquidity, while the analyst known as Root tracks cycle structure.
Both calls arrived within days of each other in early September. Neither analyst predicted a bull run, however. Both argued something narrower, that the conditions defining a bear market have stopped being present.
Capriole’s Hedge Ratio Hit Its Bullish Threshold
Edwards, founder of Capriole Investments, published his signal on Sept. 4. His Market Hedge Ratio measures the USDT/BTC market cap ratio over a rolling 30 days.
The reading fell to -20.42%, touching the -20.78% threshold marked on his chart. A falling ratio indicates capital rotating out of stablecoins and into Bitcoin.

His chart marks roughly nine comparable signals since January 2020. Most preceded rallies, though one signal in October 2021 landed close to a cycle top.
“It’s very hard for bad things to happen to Bitcoin when Capriole’s Market Hedge Ratio is this green. Downside is basically capped in last 5 years until it flips red. Typically this reading means we have week(s) of upside to run.”
Edwards set an explicit invalidation, however. The signal holds only until the ratio flips red, and his stated horizon runs weeks rather than months.
Root’s Breakout Arrived 2 Months Early
Root, who publishes at Bitcoin Strategy, reached the same conclusion from price structure alone. His chart tracks the moment price reclaims the 200-day average, the 21-week average, and the short-term holder cost basis.

Previous breakouts sat 1,375 days and 1,384 days apart, a gap of only nine days across roughly 7.5 years. The current breakout arrived 1,314 days after the 2023 signal, therefore about 65 days ahead of that rhythm.
“The current breakout happened roughly two months ahead of schedule compared to previous cycles. While two months is still substantial, and a reason why we can’t entirely rule out a continuation of the bear market…”
That timing cuts both ways. Root notes the four-year cycle placed this bottom four months early. The breakout, therefore, deviates considerably less than the low did.
BTC Sits Just 0.5% Above the Line That Matters
Bitcoin traded at $79,755 at the time of writing, down 0.23% over 24 hours. Market cap sits near $1.6 trillion. Price holds above all three levels, though barely.
The 21-week average stands at $79,355, leaving a cushion of 0.5%. Beneath it, the short-term holder cost basis sits at $70,853 and the 200-day average at $69,785.

Those two levels sit around $1,000 apart, forming a support shelf near $70,000. Grayscale placed its own bottom estimate in that same zone.
A weekly close beneath that shelf would break both thesis at once. Holding $79,355 keeps them alive.
The two calls agree on direction and share almost nothing else. Edwards measures weeks, whereas Root measures a cycle. Both published the level that would prove them wrong.
The post Is the Bitcoin Bottom In? 2 Analysts Say Yes From Separate Charts appeared first on BeInCrypto.

McDonald’s India’s X account has deleted posts from an alleged intern who claims they weren’t paid for months, and that memecoin trading left them starving.
The first post, uploaded on Sunday, claimed that the writer, an intern, manages several Asian McDonald’s accounts.
They claimed that their boss, “Amit Joshi,” hasn’t paid them since December 2025, leaving them no choice but to take on two extra jobs in customer support and delivery.
On top of this, the “intern” described themselves as an unsuccessful memecoin trader. They claimed, “I literally starve every day because I lose all my money on them.”

Read more: Bitcoin doesn’t need the McRib to rally
The last post in the thread claimed McDonald’s owed them ₹60,000 ($650) and that they’re hoping to achieve community support.
It appears no memecoin has been linked to the posts, so it’s unlikely that the account was hacked as part of a scam memecoin promotion.
Yesterday, McDonald’s India called the posts “#fakenews,” however, X users weren’t convinced.
Protos reached out to McDonald’s for comment and will update this piece should we hear anything back.
Got a tip? Send us an email securely via Protos Leaks. For more informed news and investigations, follow us on X, Bluesky, and Google News, or subscribe to our YouTube channel.

Joey Barton to stay in jail for the rest of the year as he is denied bail over golf club ‘assault’ that could leave victim blind in one eye
Bitcoin Price Analysis: BTC Bulls Need to Break This Key Level to Regain Momentum

Angie Katsanevas Slams ‘Heartless’ Lisa Barlow





-

 Fashion3 days ago
Weekend Open Thread: Beyond Yoga
-
 Crypto World3 days ago
Bitcoin price stalls near $82K as key resistance holds
-

 Politics3 days ago
Best Gaming Laptops, CPUs, TVs, And Keyboards To Upgrade Your Set Up For GTA VI
-

 Tech3 days ago
The Birds Outside, Drawn For You Automatically
-

 Crypto World3 days ago
IMF Says El Salvador’s Post-Review Bitcoin Purchases Used No Public Funds
-
 Crypto World3 days ago
U.S. added stronger than expected 162,000 jobs in August as labor market bounced back
-

 Sports3 days ago
Alexandre Pato consortium’s Northampton Town investment approved
-

 Sports3 days ago
Commanders’ Chig Okonkwo is a top breakout fantasy football candidate
-

 Sports3 days ago
Golden Eaglets Drawn in Group B for 2026 WAFU B U17 Championship
-
 Crypto World3 days ago
XRP price breaks falling channel as bulls target $1.53
-

 Politics3 days ago
A new European chapter for Gibraltar
-

 Politics3 days ago
How To Avoid Winter Colds: 4 Everyday Habits That Spread Germs, Says Pharmacist
-

 Politics3 days ago
The House | Bin the lectures, bring gossip and be ready to banter: how the new PM should prepare for his Trump encounter
-

 Crypto World3 days ago
From warning to listing: UK’s largest retail investment platform opens access to crypto ETNs
-

 Crypto World3 days ago
FinCEN flags $12.7B tied to Southeast Asia crypto investment scams
-

 Tech3 days ago
A Worthy Android Ereader, With Some Tradeoffs
-

 Crypto World3 days ago
Trezor Data Breach Impacts 67,000 More US Customers
-

 Tech3 days ago
How To Edit Claude’s Memory
-

 Politics3 days ago
33 Cosy Autumn Home Decor Ideas: Blankets, Pumpkin Decorations, And Candles
-

 Tech3 days ago
beyerdynamic AVENTHO Y Debuts at IFA 2026 and Makes Wireless Headphones Less Disposable
You must be logged in to post a comment Login