

Crypto World
Solana weakens as liquidations rise and sentiment cools


- Solana (SOL) has fallen below $82 as selling pressure and risk aversion increased.
- Rising liquidations show leveraged traders are exiting positions.
- $80 support remains critical, with $75 and $90 as key levels to watch.
Solana has entered a fragile phase as selling pressure builds and confidence across the market continues to fade.
The token has slipped below the $82 area, a level that previously acted as a short-term cushion for price action.
Liquidations rise as leverage unwinds
The futures market has played a major role in amplifying Solana’s downside move.
Liquidations have increased, and long positions have been forced out as price drifts lower, creating bursts of sharp selling during the intraday declines.
Open interest across derivatives markets has also been falling, pointing to traders closing positions and stepping aside rather than betting on a fast rebound.
Funding rate has also turned negative, showing a growing dominance from short sellers who are willing to pay to maintain bearish exposure.

While leverage flushes can sometimes reset the market, there is little evidence of that shift yet.
Instead, each liquidation wave has been followed by muted buying interest.
Sentiment cools as on-chain activity slows
Beyond price and derivatives, Solana is also facing softer signals from on-chain activity.
Transaction-driven revenue has declined from recent peaks, suggesting lower demand for block space and reduced speculative activity.
A good percentage of the network usage is currently tied to short-lived trends rather than sustained growth.
That reliance leaves the network activity vulnerable as market sentiment cools.
Investor confidence has also softened as the price struggles to reclaim key resistance zones.
Repeated failures near higher levels have reinforced a wait-and-see attitude.
Even though new wallets continue to appear, overall engagement lacks momentum, especially as the hype around memecoins, which form the bulk of Solana’s engagement, fades.
This imbalance highlights the difference between long-term interest and short-term participation.
The result is a market caught between underlying potential and immediate pressure.
Solana price forecast
Traders should closely watch the $80 level as the first major line of defence in case of a further decline.
A clean break below this zone could expose the price to deeper losses.
If selling continues, the next area of interest sits between $75 and $76, which has previously acted as a stabilisation zone during corrections.
Failure there would open the door toward the low $70s, which would result in even more liquidations.
On the upside, analysts note that Solana needs to reclaim the $85-87 range to ease immediate pressure.
If SOL moves above $87, bulls will be in control, and the next target sits around $90.
A move beyond that level would be required to shift sentiment meaningfully.


Robinhood’s (HOOD) testnet has logged four million transactions in its first week that its testnet chain is live, CEO of the investment platform Vlad Tenev said on X on Thursday.
The Robinhood Chain, which focuses on tokenization and trading, comes at a time where centralized exchanges are looking to building their own blockchain infrastructure even as the broader Ethereum ecosystem debates its future.
“Developers are already building on our L2, designed for tokenized real world assets and onchain financial services,” Tenev wrote.
Testnets are risk-free environments for developers to test code and experimental features ahead of its mainnet going live. The two stages of a network’s development could be compared to a flight simulator and a commercial flight.
The Robinhood Chain’s testnet has arrived against the backdrop of a larger reckoning in the Ethereum world.
Earlier this month, Ethereum co-founder Vitalik Buterin declared that the protocol’s long-held layer-2 (L2) rollup-centric roadmap “no longer makes sense,” arguing that many rollups have fallen short of full decentralization and that Ethereum’s base layer is scaling faster than expected.
That philosophical shift has fueled chatter in the Ethereum community about what scaling and meaningful decentralization may look like in 2026. But while some in the developer community push for new frameworks, Tenev and other centralized players appear to be doubling down on proprietary chains and tokenized markets as a way to capture users and liquidity.
The contrast underscores a growing divide in crypto’s direction. While Ethereum’s core architects reassess how scaling should evolve on the base layer, major trading platforms are looking to control more of the stack themselves. For exchanges, owning the infrastructure could mean tighter user capture, new revenue streams and greater influence over how tokenized markets take shape.
Read more: Robinhood starts testing its own blockchain as crypto and tokenization push deepens
Ethereum has finally broken a four-week streak of continuous ETF outflows. The week ending February 18 recorded inflows, marking the first sign of returning institutional demand. At the same time, whale wallets have started accumulating again. Yet long-term holders continue selling into every Ethereum price bounce.
This creates a direct conflict that could decide whether Ethereum’s price recovery continues or stalls.
Sponsored
Sponsored
ETF Outflow Streak Ends as Whale Accumulation Begins
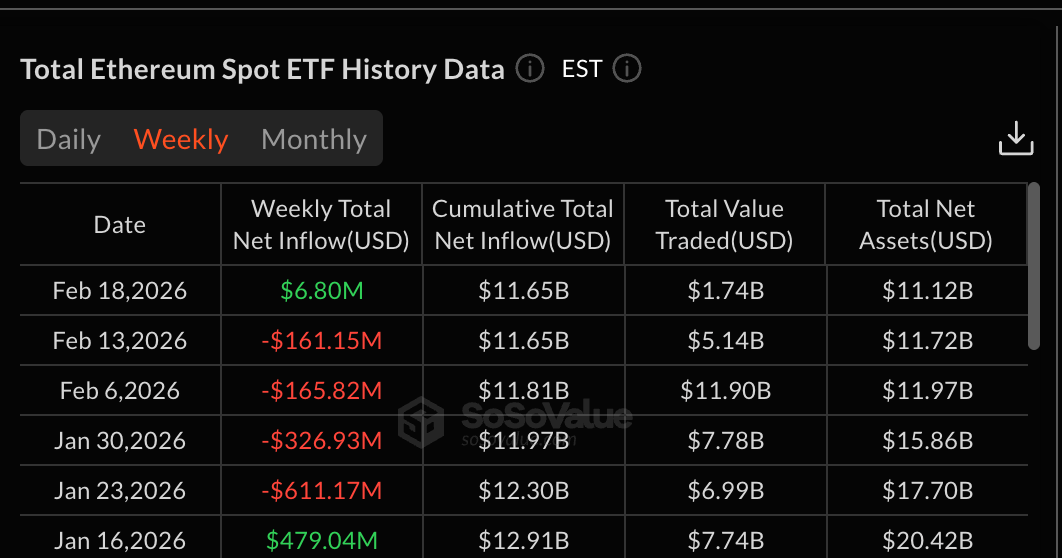
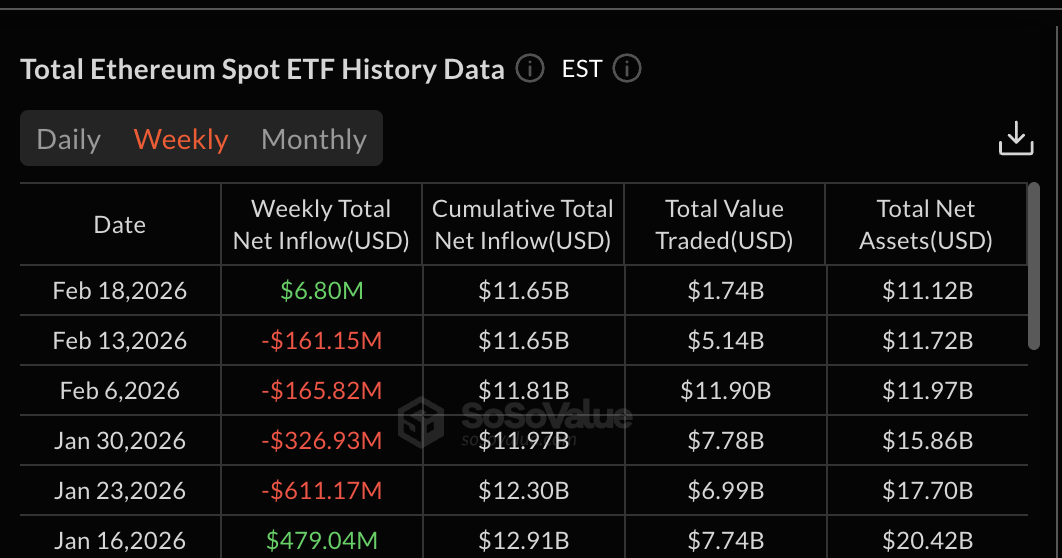
Ethereum spent four straight weeks under consistent institutional selling pressure. Spot Ethereum ETFs recorded net outflows in the weeks ending January 23, January 30, February 6, and February 13. This sustained selling reflected weak institutional confidence and coincided with Ethereum’s broader price decline.
That trend has now changed. The week ending February 18 saw a net inflow of $6.80 million. This shift suggests institutional selling pressure has paused, at least temporarily. When ETF flows turn positive after extended outflows, it often signals early stages of stabilization. However, the inflow figures are still weak and not at par with the outflow strength, yet.
Want more token insights like this? Sign up for Editor Harsh Notariya’s Daily Crypto Newsletter here.
At the same time, whale accumulation has returned. Data shows wallets holding large amounts of Ethereum increased their holdings from 113.50 million ETH on February 15 to 113.63 million ETH currently. This represents an increase of 130,000 ETH. At the current price, this equals roughly $253 million worth of Ethereum accumulated in just a few days.
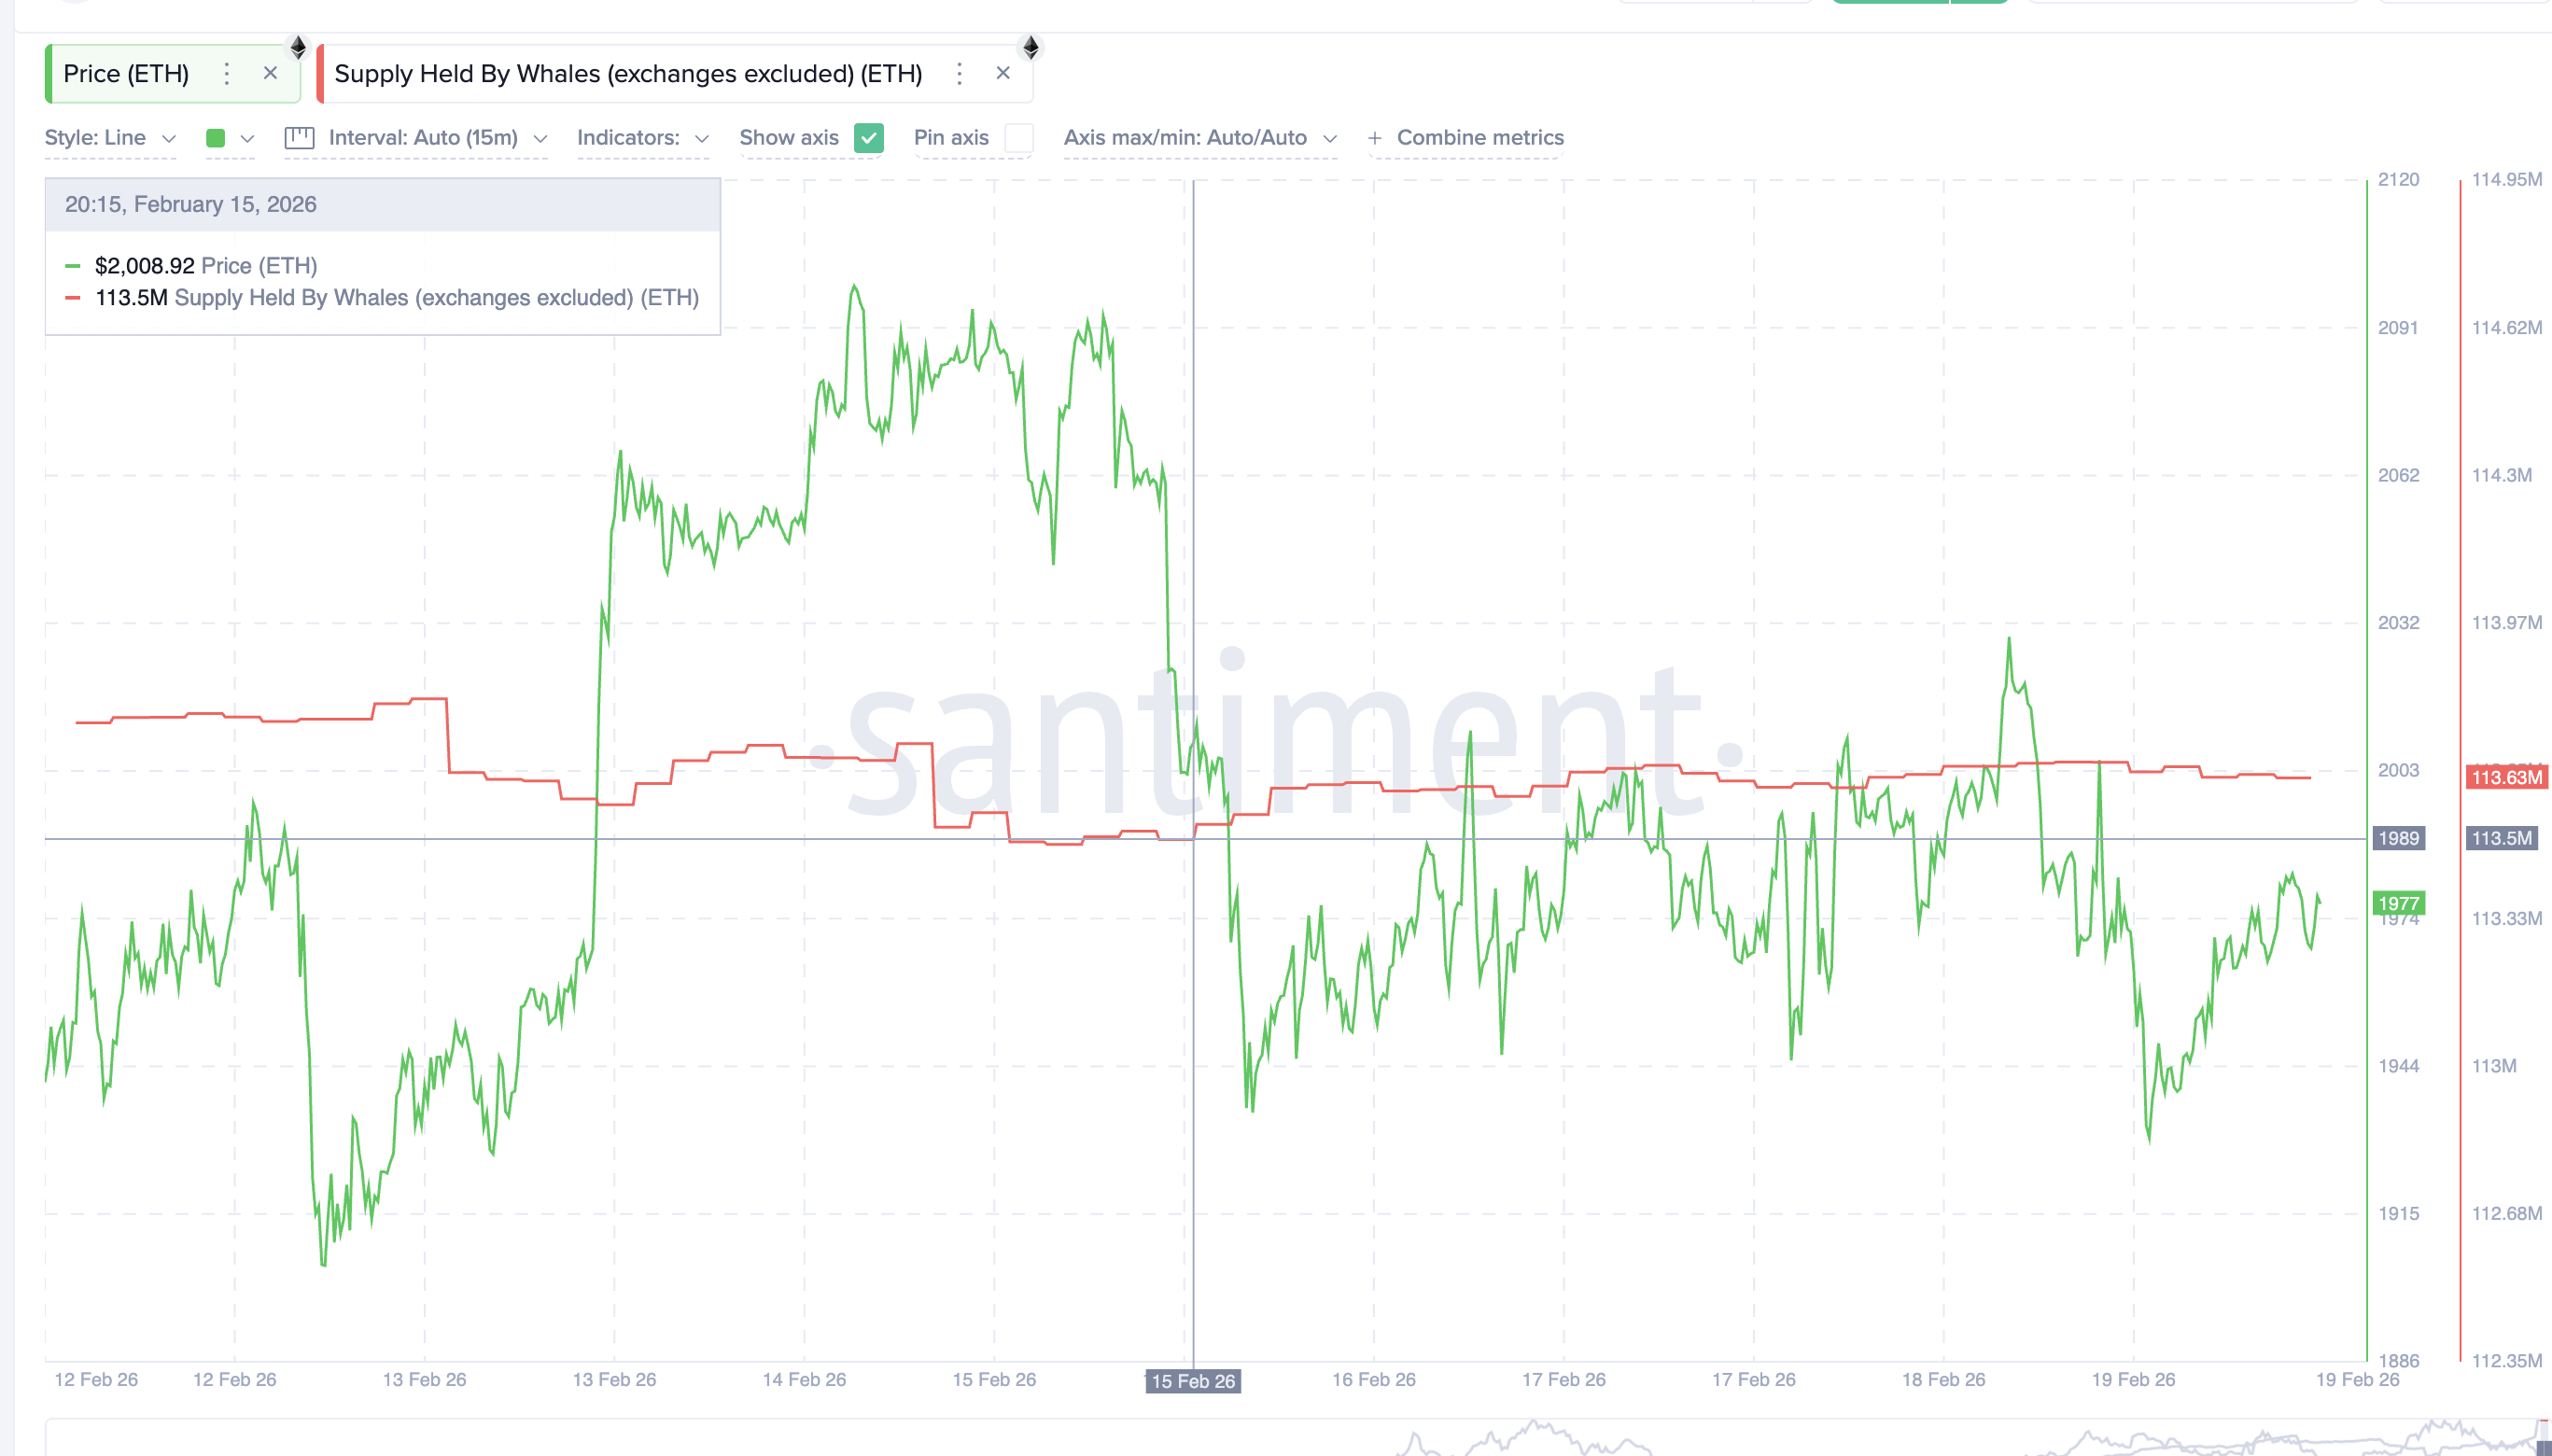
Whale accumulation during weakness is important because large investors often position early before broader recoveries begin. However, this growing optimism faces resistance from another group of investors.
Sponsored
Sponsored
Ethereum Price Flashes Bullish Divergence, But Long-Term Holders Continue Selling
Ethereum’s 8-hour chart shows a key momentum signal that has historically preceded price bounces.
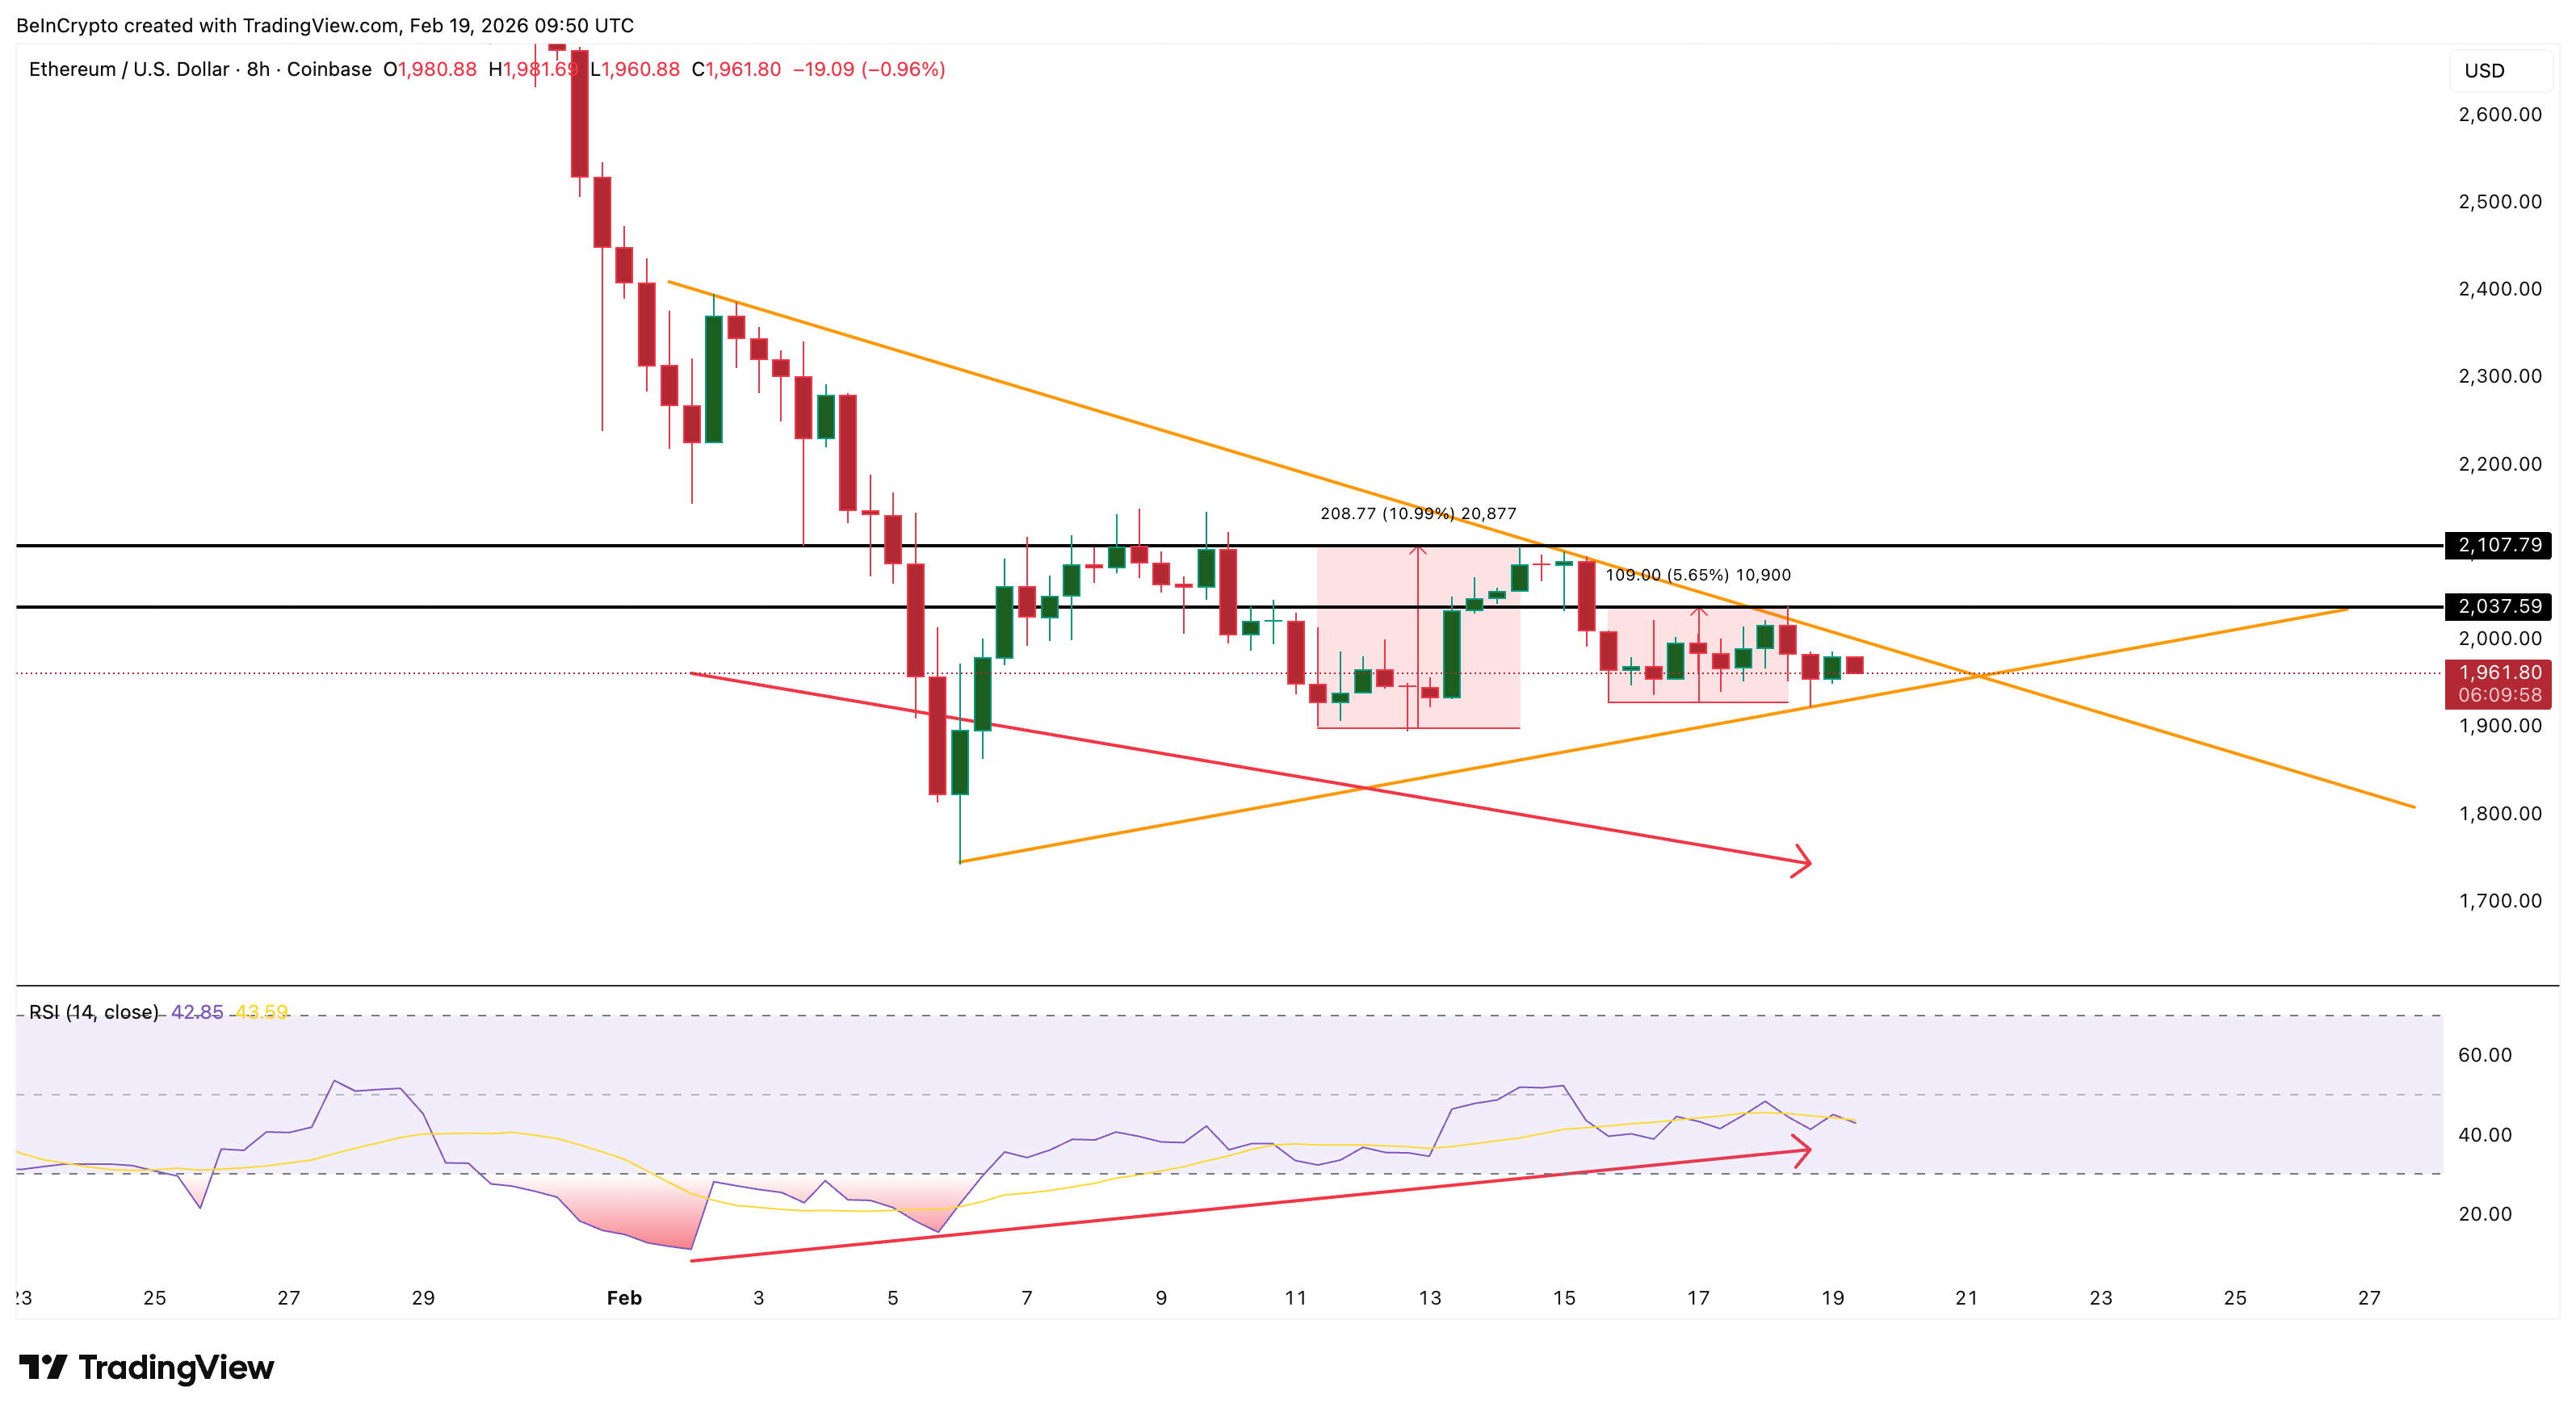
Between February 2 and February 18, Ethereum’s price formed a lower low. This means the price dropped below its previous support level. But during the same period, the Relative Strength Index (RSI) formed a higher low. The RSI measures buying and selling strength and this pattern is called bullish divergence.
This signal has already proven effective twice earlier this month. The first bullish divergence formed between February 2 and February 11. Ethereum’s price then rallied 11%. The second divergence appeared between February 2 and February 15. This led to another 6% recovery.
Both these ETH bounces happened while ETF outflows were still ongoing, showing that buyers were already attempting to regain control. Now, ETF inflows have returned, and whales are accumulating. This increases the probability that another bounce attempt could happen.
Sponsored
Sponsored
However, long-term holders are moving in the opposite direction. The Hodler Net Position Change measures whether long-term holders are accumulating or selling. A negative value means long-term holders are distributing their holdings.
On February 17, long-term holders sold 34,841 ETH over the rolling 30-day period. By February 18, that number increased to 38,877 ETH. This represents a sharp increase in selling pressure in just one day, even as bullish divergence signals appeared.
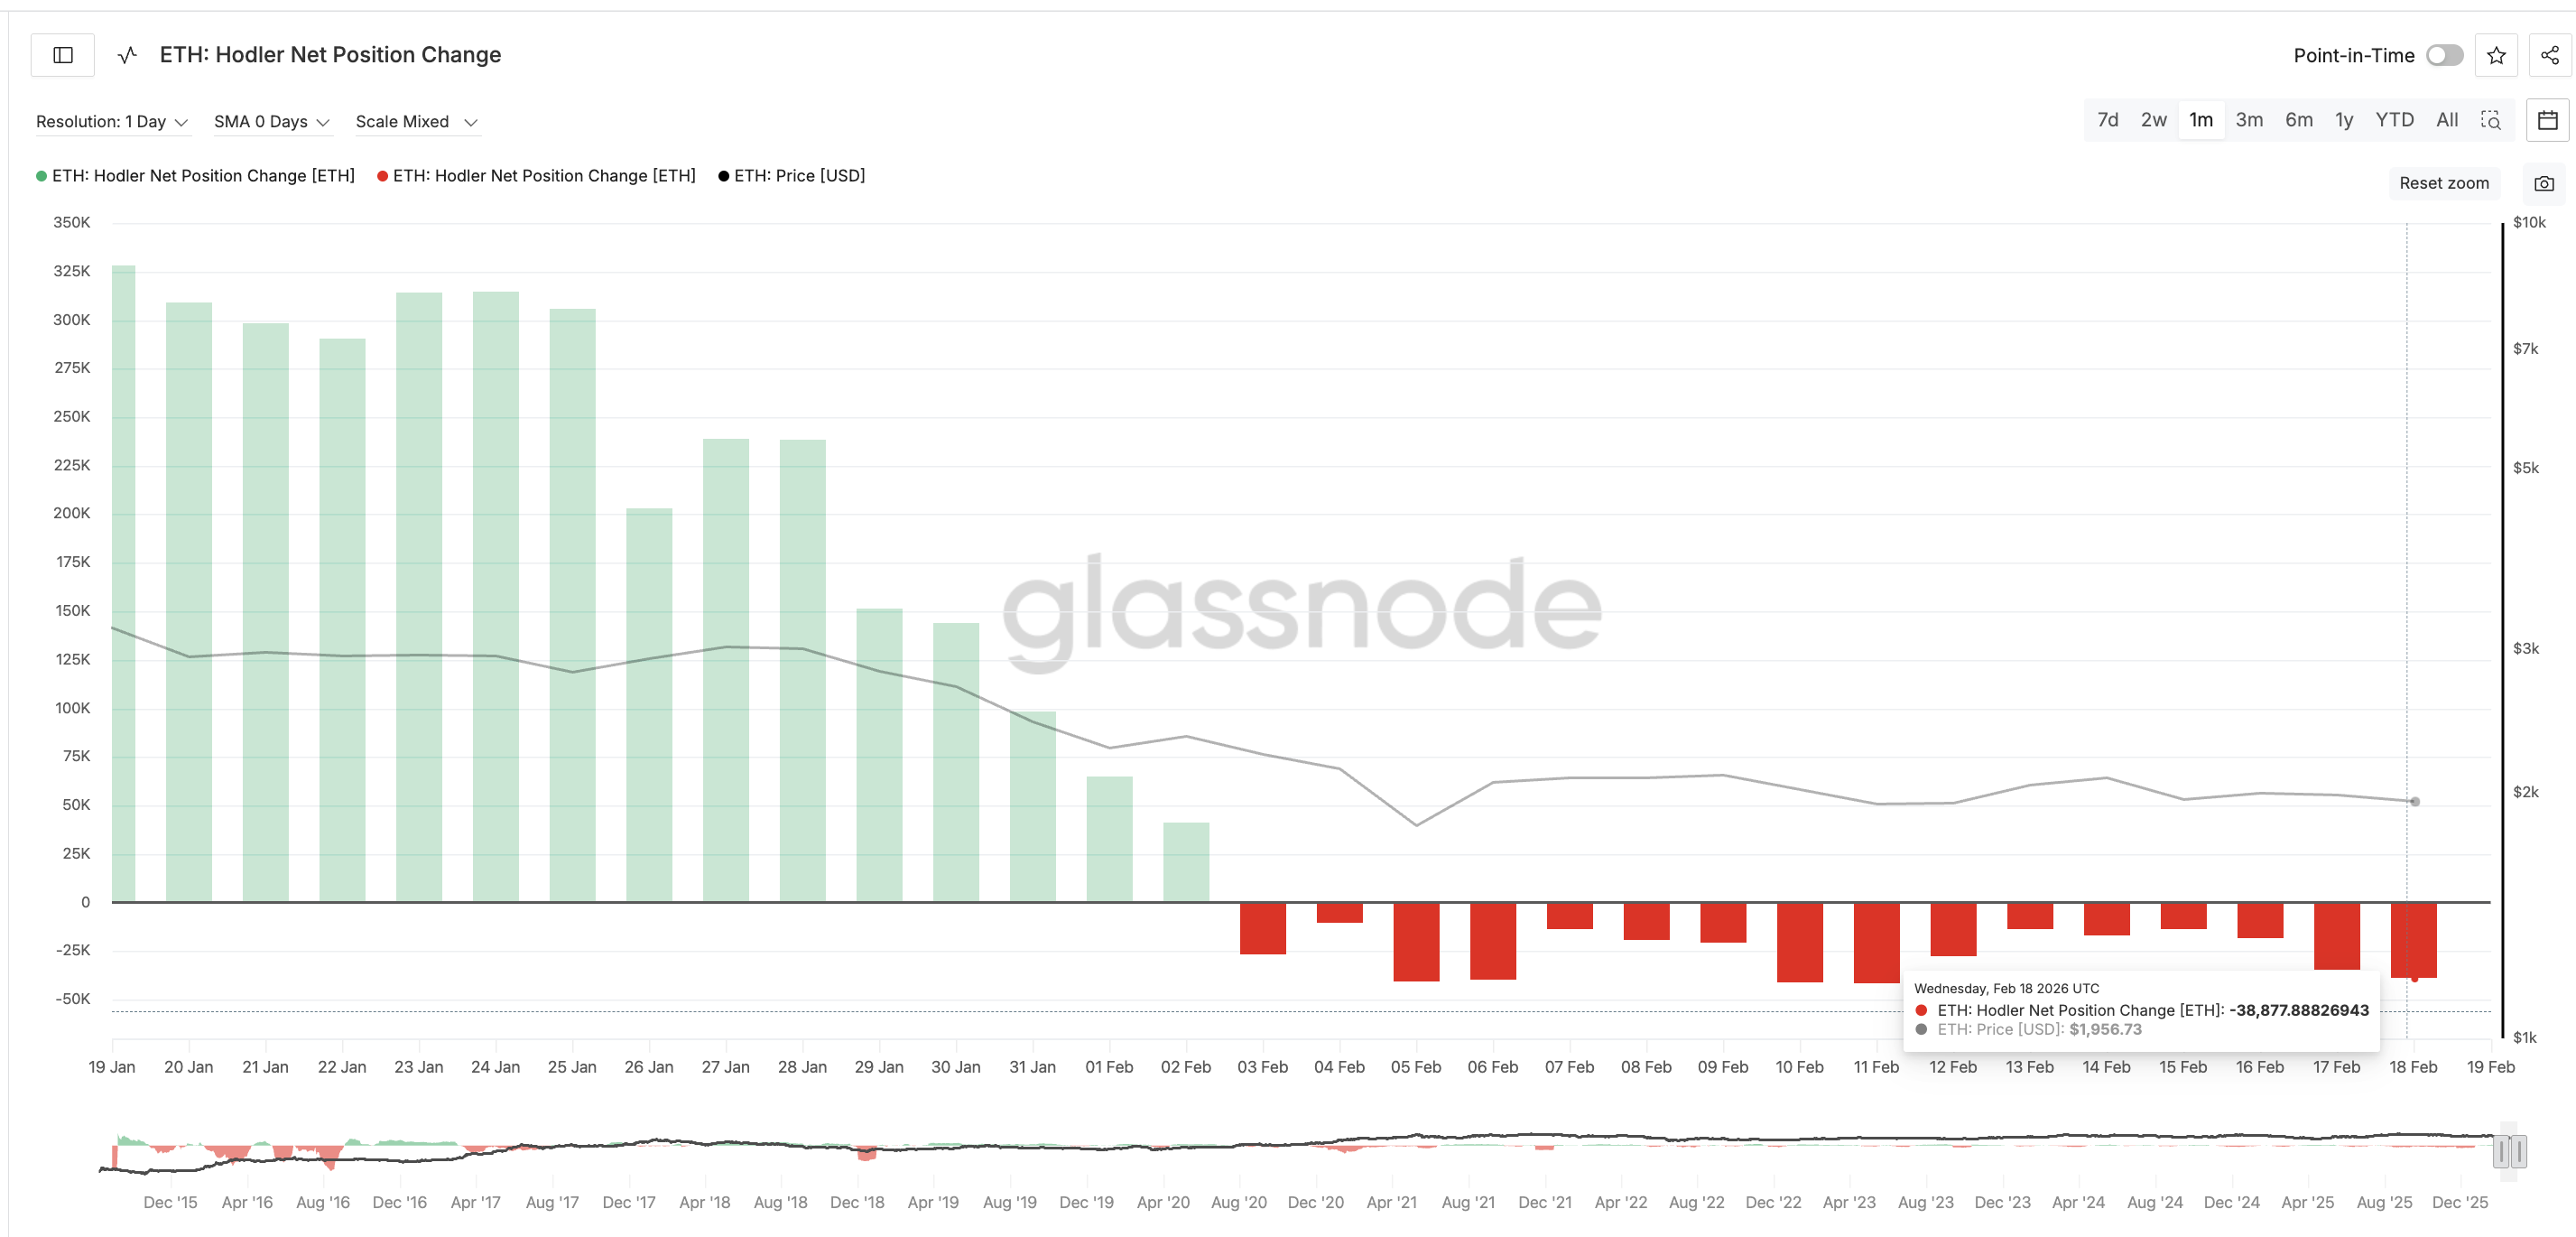
This shows long-term holders are using price strength to exit positions. The same behavior was visible during earlier February rallies. Both previous bounces failed to sustain upward momentum because long-term holder selling capped the recovery.
This creates a clear conflict. Whale accumulation and ETF inflows support recovery, while long-term holder selling limits upside potential, hinting at a clear risk. This conflict is now reflected directly in Ethereum’s price structure.
Sponsored
Sponsored
Triangle Pattern Reveals Critical Levels
Ethereum is currently trading inside a symmetrical triangle pattern on the 8-hour chart. This pattern forms when the price moves between converging support and resistance lines.
A symmetrical triangle represents balance between buyers and sellers. In Ethereum’s case, buyers include whales and institutional investors returning through ETF inflows. Sellers include long-term holders distributing their positions.
This balance explains why Ethereum remains stuck in consolidation.
The first key resistance level sits near $2,030. This level stopped the previous recovery attempt. A successful move above this level would signal strengthening momentum and also confirm the triangle breakout. The next major resistance stands at $2,100, another bounce blocker. Breaking this level would confirm a stronger recovery and could open the path higher.
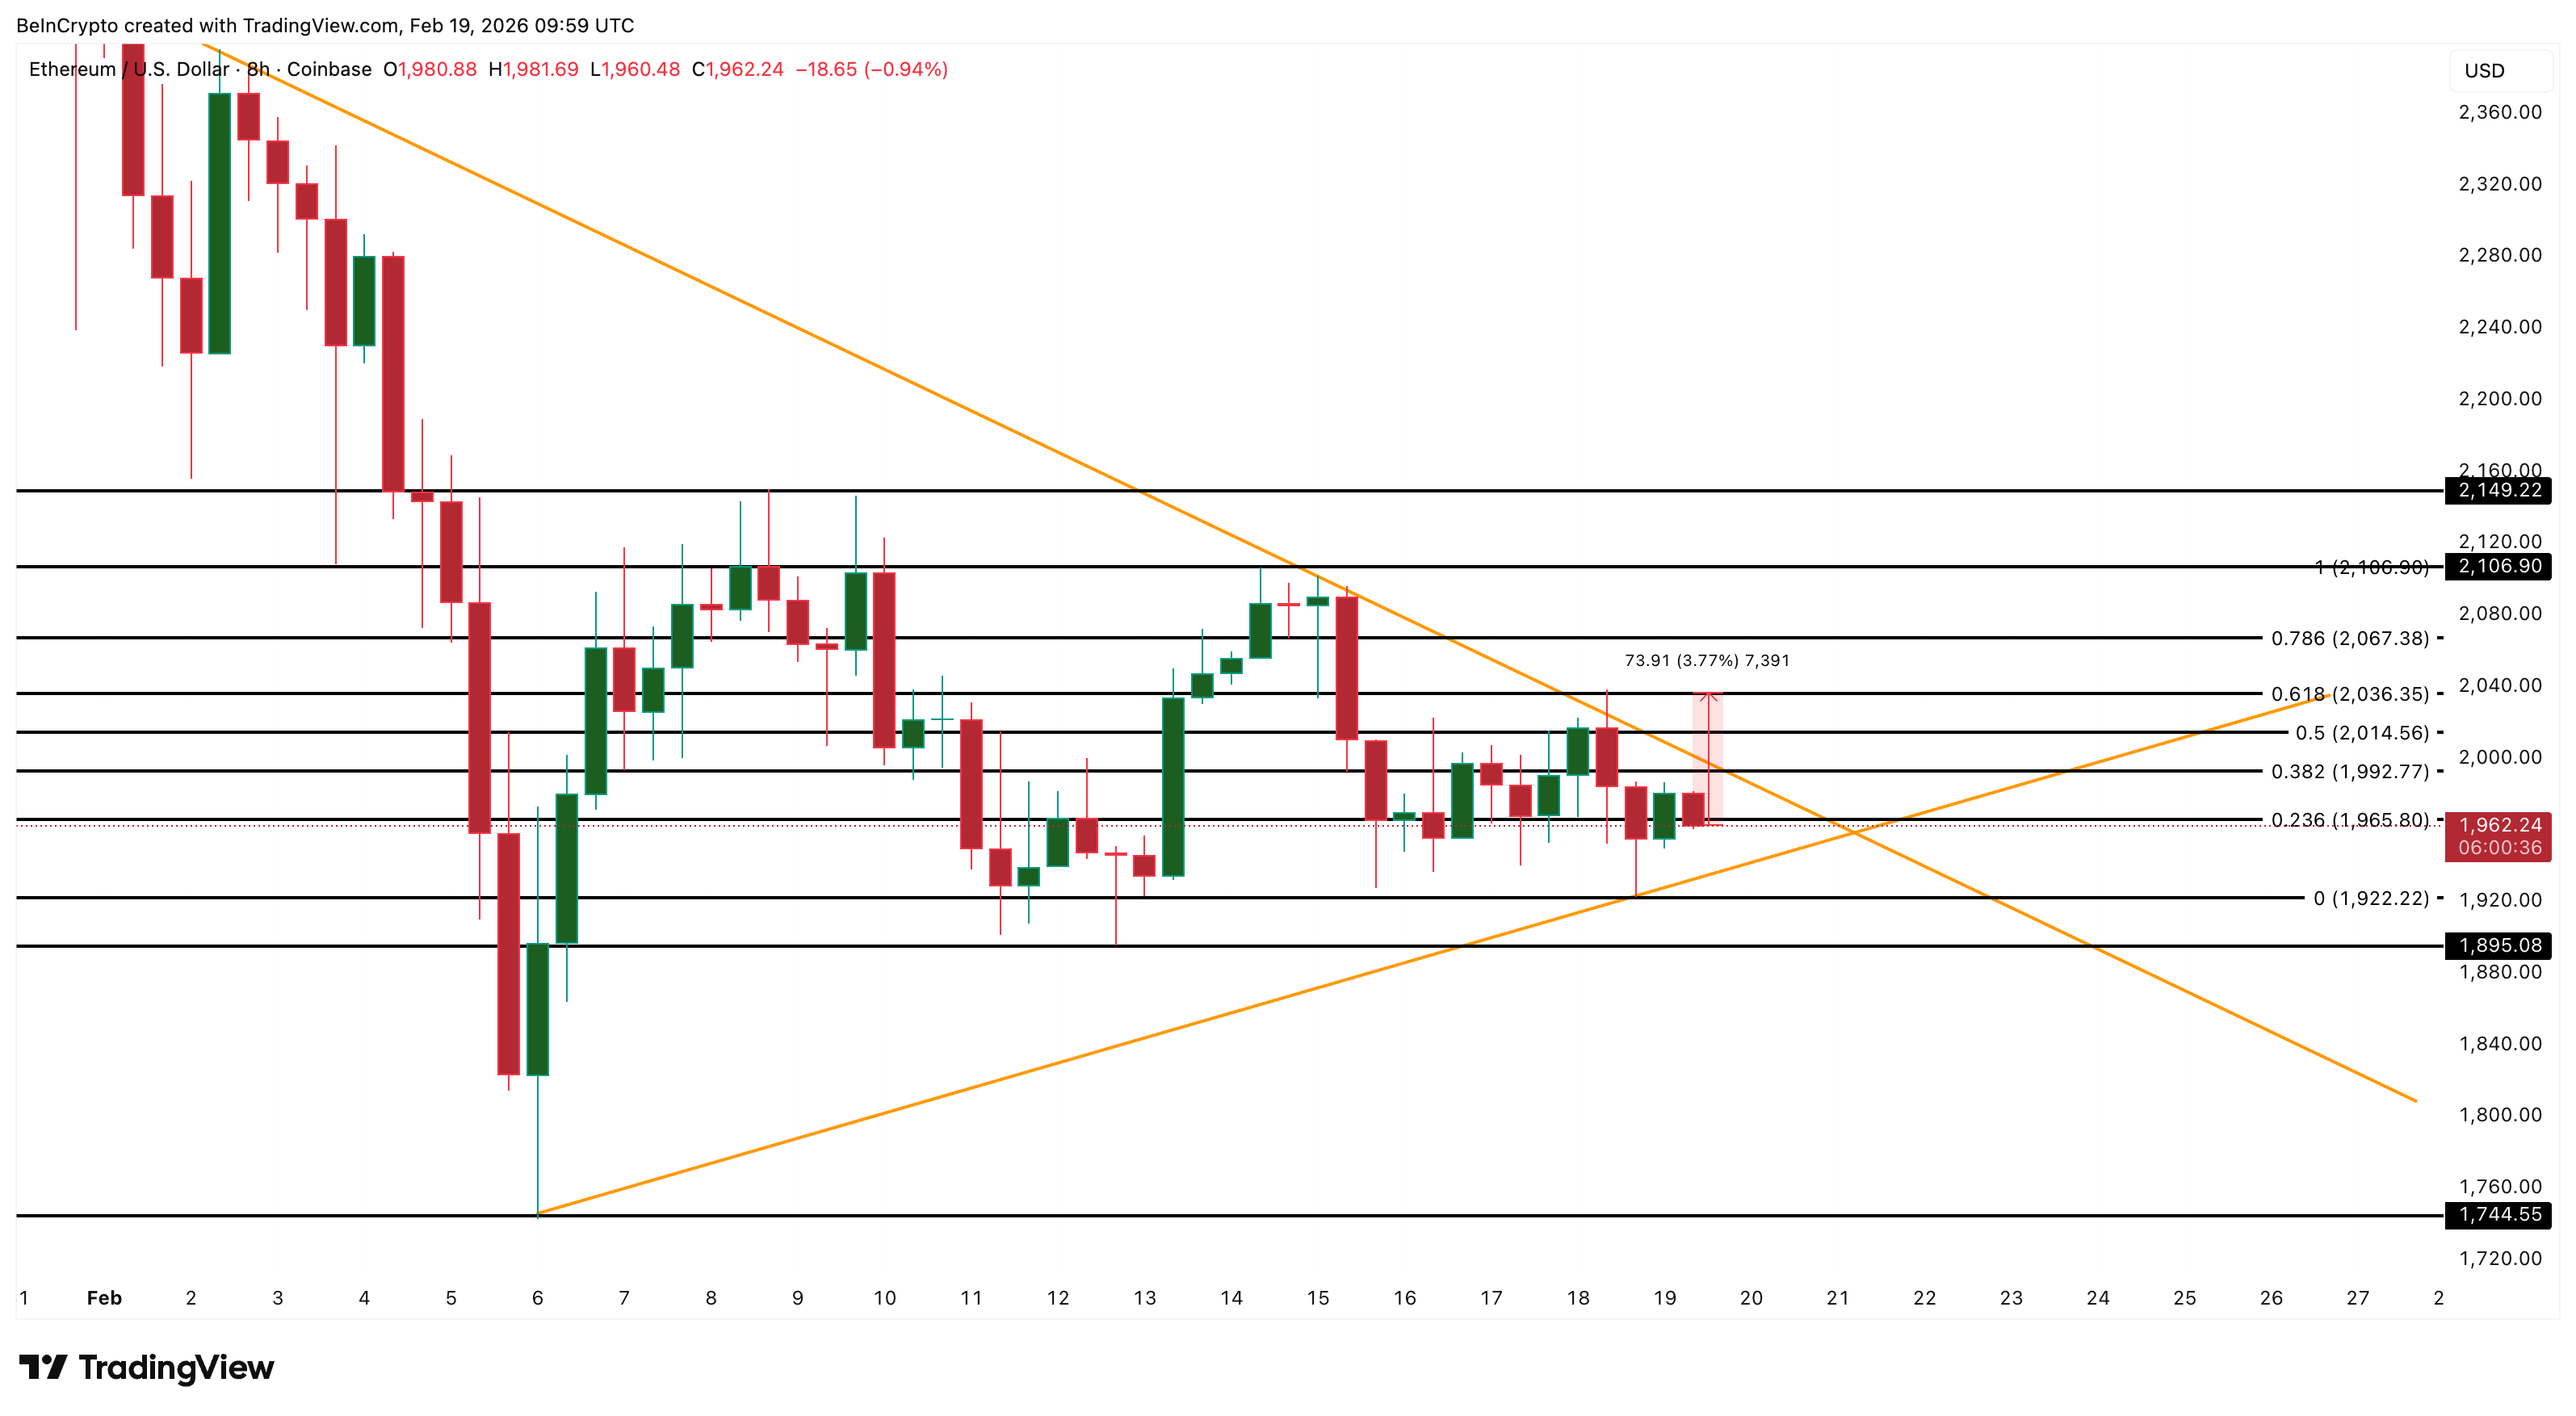
However, downside risks remain. Immediate reclaim level sits at $1,960. Failure to hold this level could push Ethereum down to $1,890. A deeper decline could extend toward $1,740 if selling pressure accelerates.

Sui crypto just stepped into the big boys area.
the first SUI ETFs are now live in the US, Canary Capital and Grayscale both launched products today. And they come with staking yield baked in.
Key Takeaways
- Canary Capital’s SUIS is actively trading on the Nasdaq, while Grayscale’s GSUI launched on the NYSE after converting from a trust.
- Both funds offer staking rewards, a first-of-its-kind feature for US spot crypto ETFs that allows investors to capture network yield.
- The listings arrive as SUI trades near $0.95, down roughly 40% over the last 30 days amidst broader altcoin market capitulation.
Why Sui Crypto ETFs With Staking Matter
While spot Bitcoin and Ethereum ETFs have attracted over $140 billion in inflows, they notably lack staking mechanisms due to initial regulatory hurdles.
The new SUI ETFs from Canary and Grayscale actually can stake the tokens. They tap into Sui delegated proof of stake system and earn rewards. That yield can help offset the usual management fees.
For institutions, that is a big deal. They do not just want price exposure. They want income too.
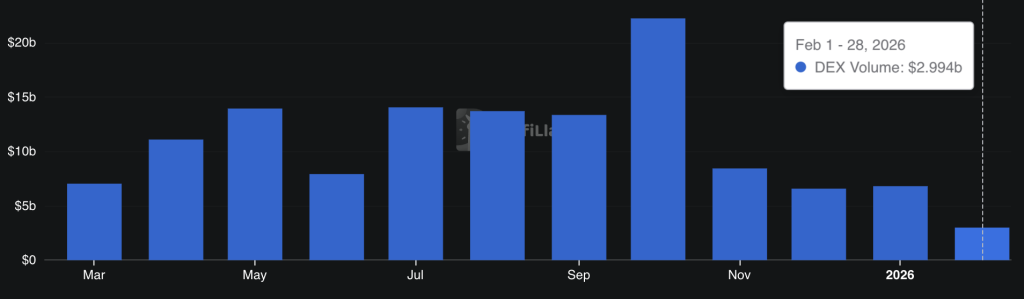
Demand for smarter products is rising rapidly. However, the SUI chain itself has been in decline over the past couple of months. We’re now in mid-January, and DEX volume is at $3B. It may outperform this January, but it is still lower than last year’s numbers.
Breaking Down the ETF Structure
Canary Capital’s ETF is live on Nasdaq under SUIS. It sits under the 1940 Act, which means tighter oversight.
That usually attracts the more cautious money. CEO Steven McClurg made it clear. Investors get direct access to net staking rewards.
At the same time, Grayscale flipped its old Sui trust into an ETF called GSUI on the NYSE. The fee is 0.35%, waived for the first three months or until assets hit $1B.
And here is the kicker. 100% of the tokens were staked at launch. Classic Grayscale move. Turn legacy trusts into spot ETFs and scale fast.
Discover: Here are the crypto likely to explode!
The post Canary and Grayscale Launch Sui ETFs With Staking Rewards in the US appeared first on Cryptonews.
Dash, a layer-1 blockchain protocol with privacy-preserving features, announced on Thursday the integration of Zcash’s “Orchard” shielded pool into the Dash Evolution chain, a secondary layer on the L1 network that supports smart contract functionality.
The integration will go live following the completion of cybersecurity audits and is expected to launch in March, according to an announcement shared with Cointelegraph.
Initially, the integration will support basic transfers of Zcash (ZEC) from one party to another on the Evolution chain, with subsequent upgrades adding Orchard’s privacy features for tokenized real-world assets (RWAs), the announcement said.
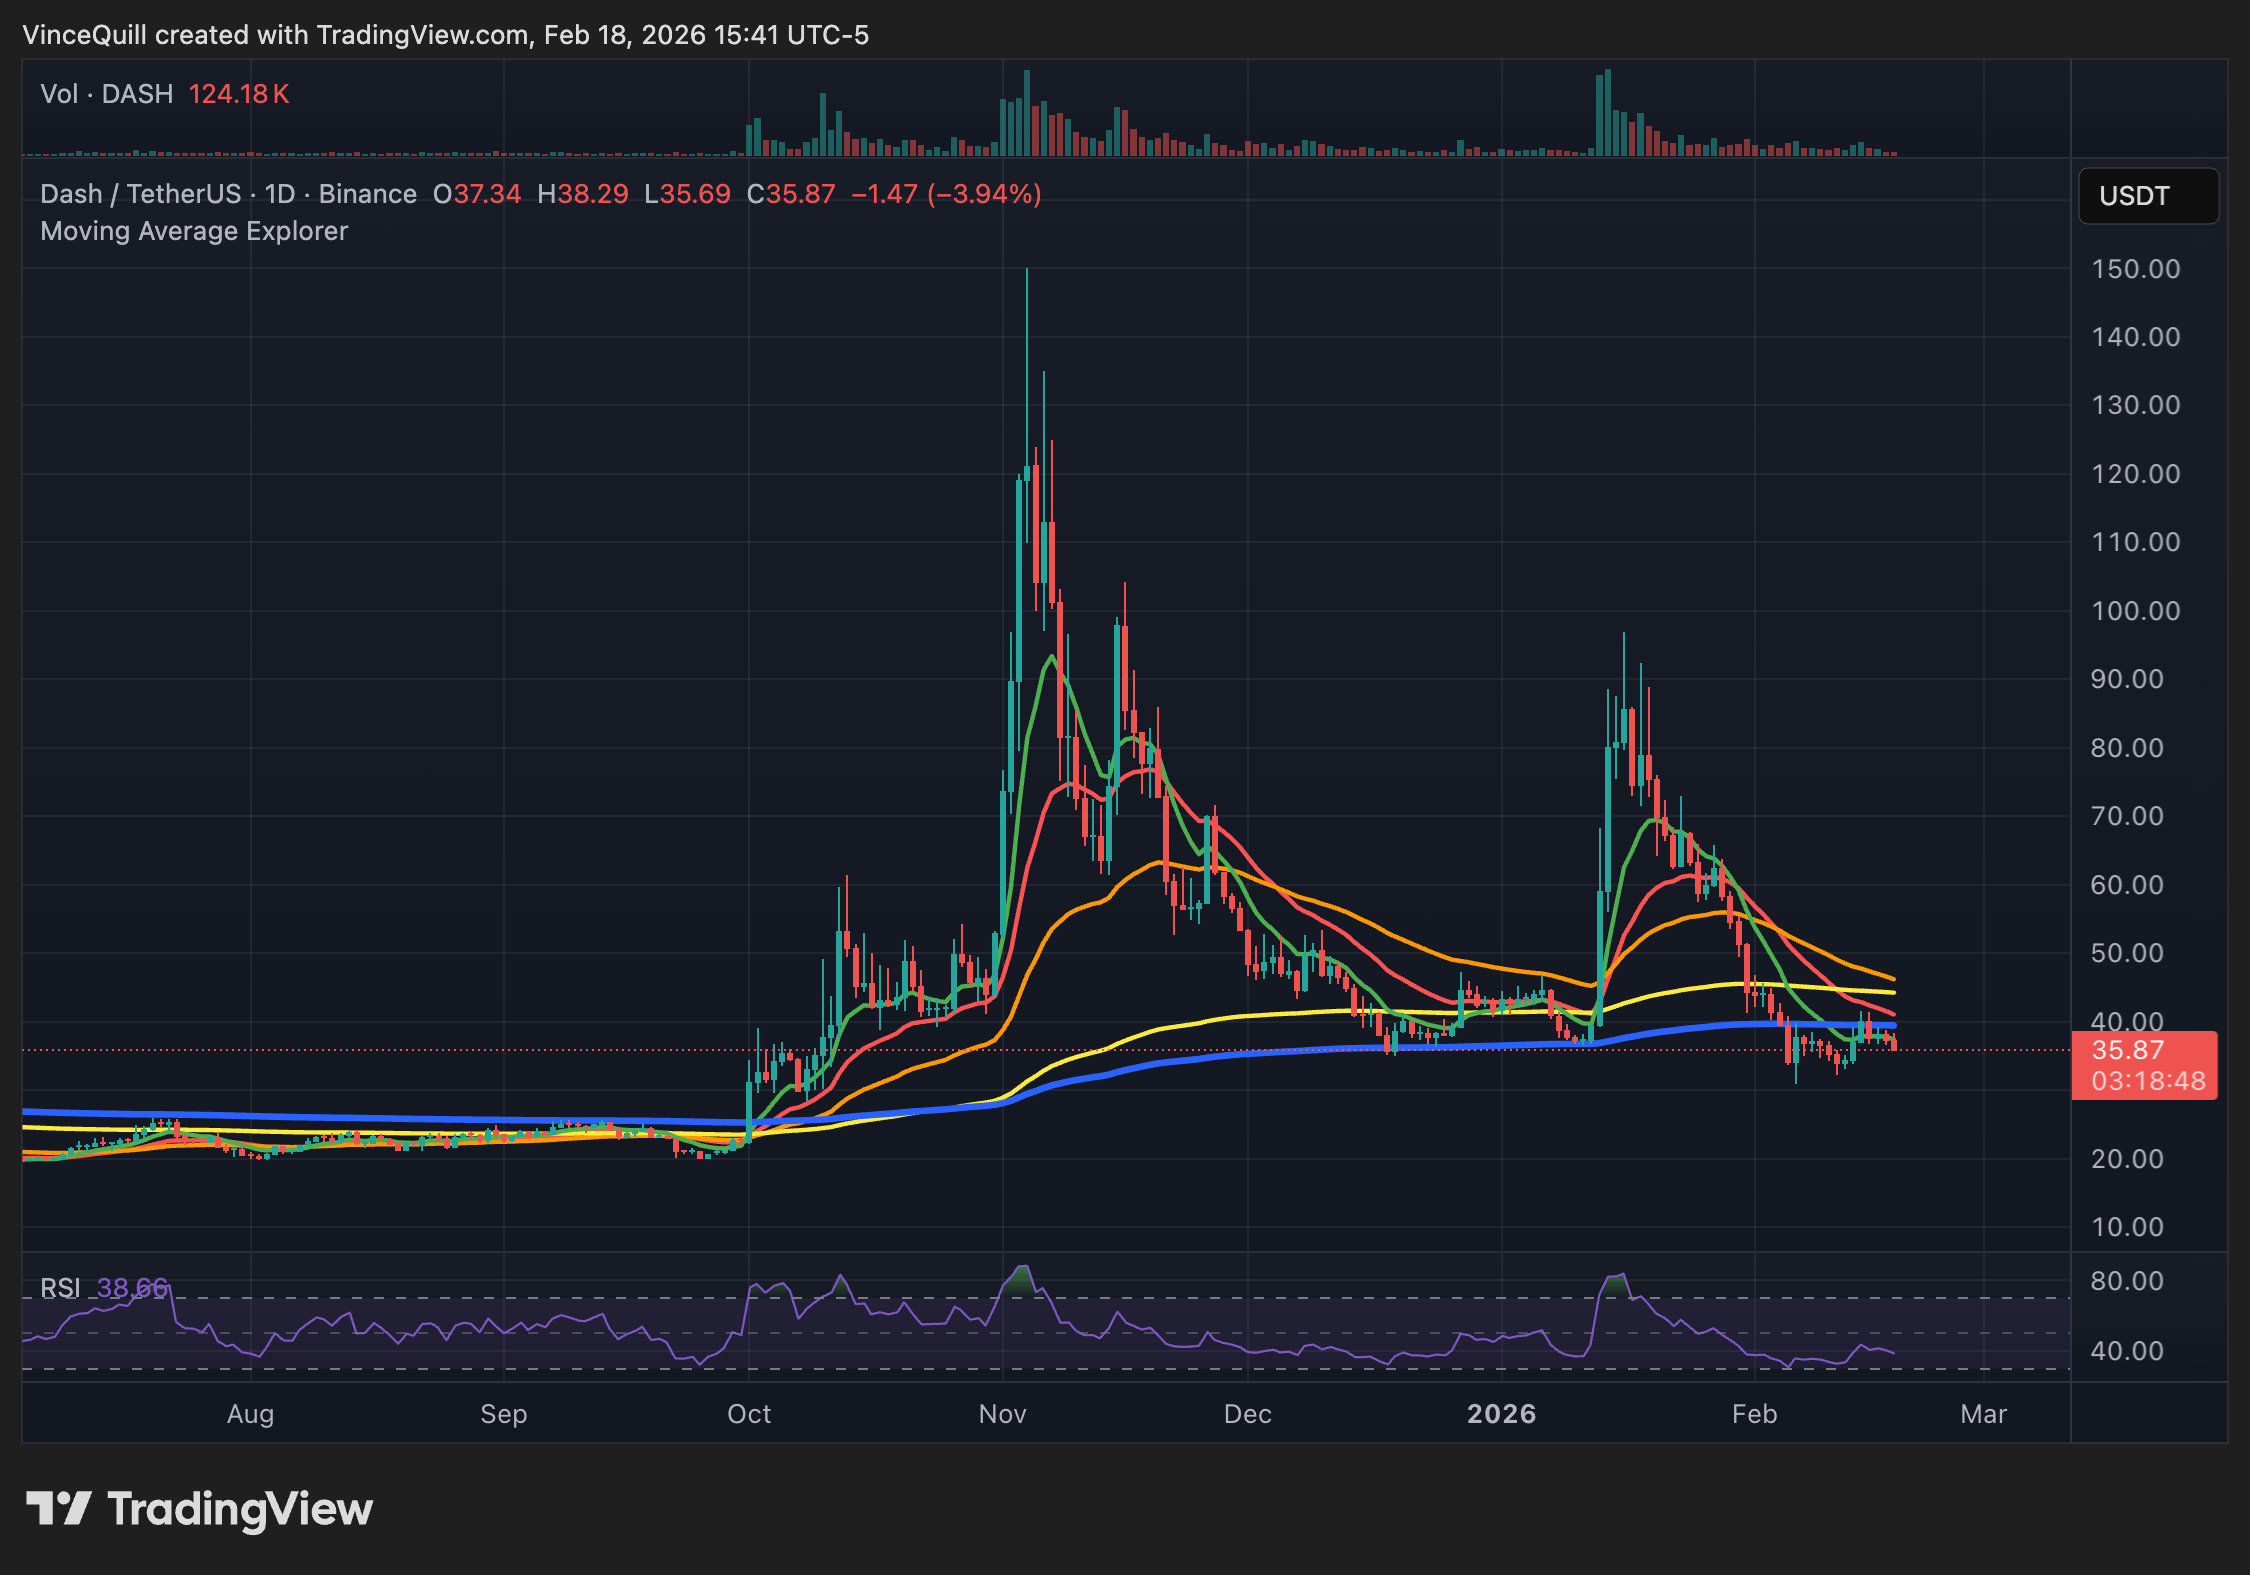
The price of the DASH (DASH), the native token of the network, surged by over 125% in January. Dash briefly reached a local high of about $96 on the Binance crypto exchange before retracing to current levels.

Onchain privacy protocols and privacy blockchain tokens gained significant momentum in 2025 and early 2026, with proponents of the technology framing it as a response to increased financial surveillance from governments and corporations.
Related: Starknet taps EY Nightfall to bring institutional privacy to Ethereum rails
Lack of privacy is holding back crypto payments, while the tech comes under fire
“Lack of Privacy may be the missing link for crypto payments adoption,” according to Changpeng Zhao (CZ), the co-founder of the Binance cryptocurrency exchange.
Businesses will not adopt blockchain technology unless privacy-preserving tools can shield payments, which contain sensitive information about employee compensation, CZ said.
Transaction data could also reveal information about key partnerships and other trade secrets to competitors, Avidan Abitbol, a former business development specialist for the Kaspa cryptocurrency project, told Cointelegraph.
Agata Ferreira, assistant professor at the Warsaw University of Technology, argues that true financial privacy is achieved through a combination of regulation, culture and code, rather than simply protecting onchain metadata.
User anonymity can still be breached, and ownership of privacy tokens can be determined through forensic analysis and law enforcement investigation, according to critics of the technology, like author and Bitcoin (BTC) advocate Saifedean Ammous.

In January 2026, Dubai’s Financial Services Authority (DFSA), a financial regulator for the emirate, banned privacy tokens, including ZEC and XMR (XMR), the native token of the Monero privacy protocol.
The ban does not prevent citizens from holding the tokens, but does prohibit regulated crypto exchanges from selling the tokens to new users, highlighting the tension between state regulators and privacy technology.
Magazine: 2026 is the year of pragmatic privacy in crypto: Canton, Zcash and more

TLDR
- Hims & Hers Health (HIMS) will acquire Australian digital health company Eucalyptus for up to $1.15 billion.
- The deal includes ~$240 million cash at closing, deferred payments over 18 months, and performance-based earnouts through early 2029.
- Eucalyptus runs a ~$450 million annual revenue business with brands like Juniper and Pilot, serving 775,000+ customers.
- The acquisition expands HIMS into Australia and Japan, and deepens its presence in the UK, Germany, and Canada.
- Eucalyptus CEO Tim Doyle will head international operations at Hims & Hers post-closing.
Hims & Hers Health announced Thursday it will acquire Australian digital health company Eucalyptus in a deal valued at up to $1.15 billion.
Hims & Hers Health, Inc., HIMS
The transaction will be structured with roughly $240 million payable in cash at closing, followed by deferred payments over 18 months and additional performance-based earnouts running through early 2029.
Hims & Hers said it plans to fund most of the deal using existing cash and U.S. operating cash flows. The company also retains the option to settle a majority of deferred and earnout obligations in either cash or stock.
The deal is expected to close around mid-2026, subject to regulatory approvals and customary closing conditions.
Eucalyptus brings a fast-growing business to the table. The Australian company is running at nearly $450 million in annual revenue and has served more than 775,000 customers across its portfolio of consumer health brands.
Those brands include Juniper, a weight-loss program, and Pilot, a men’s telehealth service. Both operate across multiple international markets.
A Foothold in New Markets
For Hims & Hers, the strategic appeal is clear. The deal would give it direct operations in Australia and Japan, two markets where it currently has no presence.
It also strengthens existing partnerships in the UK, Germany, and Canada — markets where Hims & Hers has been building out its telehealth footprint.
Post-closing, Eucalyptus CEO Tim Doyle is set to lead all international operations at Hims & Hers. The Eucalyptus brands will be folded into the Hims & Hers platform over time.
Management said the combined business is expected to support category leadership in Australia and reinforce HIMS as a major telehealth provider in Europe.
The Wegovy Shadow
The deal comes at a complicated time for Hims & Hers domestically. The company is currently facing a lawsuit from Novo Nordisk after the FDA crackdown forced it to pull its $49 compounded copy of Wegovy from the market.
That regulatory setback hit a key growth driver for HIMS, making the international diversification story behind this acquisition particularly timely.
The most recent analyst rating on HIMS stock is a Buy with a $30.00 price target.
HIMS shares were up 2.65% in after-hours trading following the announcement, though the stock was down 2.64% during the regular session on Thursday.

Running a business? Still making million-dollar decisions based on the reports of the last quarter? Is your organization simply following the market trends instead of anticipating the changes? If so, you’re already falling behind.
In the current dynamic business environment, the key differentiators are speed and accuracy in decision-making. Companies that are still relying on conventional business intelligence tools, static dashboards, lagging indicators, and intuitive forecasting are being left behind by those who have already adopted Enterprise Predictive Analytics Services and Artificial Intelligence-Powered Decision Intelligence. The gap between reactive and predictive companies is no longer operational; it’s existential.
As McKinsey suggests, companies that leverage data and analytics at scale are 23 times more likely to acquire customers, 6 times more likely to retain them, and 19 times more likely to turn a profit.
However, the truth is that the majority of companies are struggling to move past the basics of reporting. The data exists. The technology exists. What’s missing, for most organizations, is a clear strategy to harness it.
Let’s unpack how predictive analytics and decision intelligence are rewriting the rules of business performance and what industry leaders already know that most businesses are still figuring out.
What Industry Leaders Know About Predictive Analytics That Most Businesses Don’t
The myth is that predictive analytics is a technology for business giants and Fortune 500 companies, that the cost of entry is too high, the infrastructure too complex, and the ROI too uncertain. This myth has long been debunked by industry leaders.

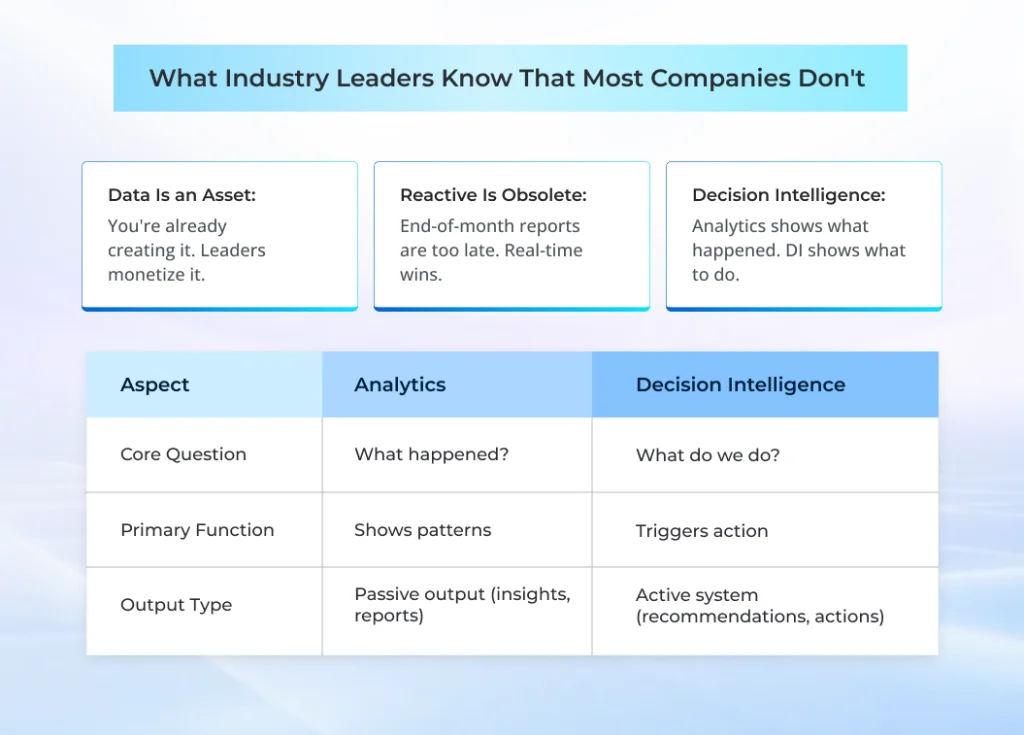
| Aspect | Analytics | Decision Intelligence |
|---|---|---|
| Core Question | What happened? | What do we do? |
| Primary Function | Shows patterns | Triggers action |
| Output Type | Passive output (insights, reports) | Active system (recommendations, actions) |
This is what they know that most mid-sized and growing companies don’t:
1. Data Is an Asset, Not a Byproduct
Most companies create massive amounts of data that are associated with transactions, operations, customer interactions, and supply chains. They view it as a byproduct, not as a strategic asset. Industry leaders, on the other hand, invest in Enterprise Predictive Analytics Services because they know that structured data in real-time is the raw material of competitive advantage.
Amazon, for instance, uses predictive analytics to predict demand and pre-position inventory before customers even click the “buy” button. It’s not just about operational efficiency; it’s a completely different philosophy about what data is for.
2. Reactive Intelligence Is Already Obsolete
The days of waiting for the end-of-month report to gain insight into business performance are now behind us. AI-Powered Decision Intelligence enables leaders to know what will happen and why, before it happens. This includes churn prediction, demand forecasting, fraud detection, and risk analysis, all in real-time.
A global logistics company that implemented an AI-Powered Decision Intelligence solution was able to reduce freight delays by 34% in one year, not by hiring more people or more trucks, but through predictive route optimization and demand analysis.
“The goal is to turn data into information, and information into insight.” — Carly Fiorina, Former CEO of Hewlett-Packard
3. Consulting Expertise Is the Bridge Between Data and Decisions
Outcomes cannot be achieved through technology alone. The leaders who have been able to unlock real value from predictive analytics always emphasize the importance of Predictive Analytics Consulting Services in their success stories. These consultants not only focus on the implementation of technology but also ensure that predictive analytics are linked with the business key performance indicators, and the outputs from algorithms are converted into decisions that are at the executive level.
Most analytics projects get stuck at the “proof of concept” stage.
4. Decision Intelligence Is a Layer Above Analytics
Here’s the key difference that most companies get wrong: Analytics shows you what has happened and what could happen. Decision Intelligence shows you what to do about it. A Decision Intelligence Platform for Business combines predictive analytics with business rules, business processes, and human expertise – building a closed-loop system that automatically acts on insights.
A financial services company with a Decision Intelligence Platform for Business can automatically identify high-risk loan applications, send them to the correct underwriters, and change credit policies in real-time.
5. The ROI Is Real But It Requires the Right Foundation
According to Gartner research, for large companies with annual revenues of $1 billion or more, the average return on investment for emerging technologies in 2023 was 20x (or 2000%) in 2023, primarily due to AI and analytics, as reported in 2024.
However, such ROI is not achieved instantly or by chance. The leadership is well aware that the underlying structure, such as clean data, strong infrastructure, scalable models, and sound interpretation of results, is of prime importance.
Those companies that perceive analytics as a one-time function, rather than an operational capability, are likely to be less successful than companies that perceive it as an operational function.
Make faster strategic decisions with AI-powered decision intelligence services from Antier
The Science Behind Better Business Outcomes: Predictive Analytics & Decision Intelligence
Understanding the mechanics that drive the predictive analytics and decision intelligence processes will help to clarify these technologies for leaders who are skeptical or overwhelmed by them.
How Enterprise Predictive Analytics Services Actually Work
The architecture is not as mysterious as the vendors claim. Enterprise Predictive Analytics Services begin with data, structured input from your CRM, ERP, and supply chain systems, as well as external data such as market data, economic data, and sometimes unstructured data such as customer feedback or web behavior. This data is cleaned and integrated into statistical and machine learning models that are trained to find patterns that would never be detected by human analysts.
What comes out the other side looks like:
- A probability score telling you which customers are most likely to churn in the next 30 days and why.
- A demand forecast accurate enough to adjust inventory by SKU and region three months out.
- A risk flag surfacing a supplier that’s showing early signs of financial distress before your procurement team has noticed.
- A scenario model showing what a 7% price increase would do to volume across your top five customer segments.
None of this is theoretical. These are outputs that enterprise teams are using to make real decisions today.
What Makes a Decision Intelligence Platform for Business Different
A lot of companies have analytics. Fewer have decision intelligence. The difference is what happens after the prediction is made.
A Decision Intelligence Platform for Business doesn’t just point to an insight, it links that insight to a particular decision, sends it to the right person or system, and tracks what happens when it’s implemented (or not). Over time, the platform learns which suggestions are being accepted, which are being overridden, and what the outcomes were. That’s the feedback loop that makes AI-Powered Decision Intelligence truly different from a dashboard with better charts.
How does it work?
A dashboard tells your supply chain manager that inventory is low. A Decision Intelligence Platform for Business tells them what to buy, from whom, at what price, based on current lead times and demand forecasts, and alerts it for approval or automatically implements it, depending on the dollar amount.
Advanced Analytics Services for Enterprises: Where It Works Across Industries

Advanced Analytics Services for Enterprises have a set of diverse capabilities applied differently, depending on the business. Here’s what that looks like in practice across a few verticals:
1. Financial Services
Banks using AI-Powered Decision Intelligence for credit underwriting have moved beyond static FICO scores to real-time models that factor in hundreds of behavioral and contextual signals. As a result, default rates went down 20–30% in documented cases, and credit was extended more accurately to customers who would have been declined by legacy models. Fraud detection teams are catching anomalies in milliseconds rather than reviewing flagged transactions the next morning.
2. Retail and eCommerce
Retailers applying Advanced Analytics Services for Enterprises to markdown optimization have reduced inventory carrying costs by 15–25% while improving margin recovery on aged stock. Customer lifetime value models are helping merchants stop spending acquisition budgets on customers who won’t return, and start investing in the ones who will often get back, by enabling personalized offers for each segment’s actual price sensitivity.
3. Manufacturing and Supply Chain
Predictive maintenance is probably the most well-documented manufacturing use case, with unplanned downtime reductions of up to 50% when implemented well. However, supply chain disruption modeling, which became a survival skill during the pandemic, is now a standard application of Enterprise Predictive Analytics Services in industrial environments. Knowing three weeks early that a key supplier is at risk gives procurement teams options. Finding out when the shipment doesn’t arrive gives them nothing.
4. Healthcare and Life Sciences
Healthcare systems employing predictive models to identify patients eligible for high-risk readmission have been able to focus post-discharge follow-through efforts on those who can significantly lower 30-day readmission rates. For the pharmaceutical industry, predictive models for clinical trial site selection are reducing the time and expense of getting products to market by identifying the most likely sites for on-time and successful recruitment.
What Predictive Analytics Consulting Services Actually Deliver
When companies engage Predictive Analytics Consulting Services, the deliverable isn’t a model. It’s a working capability that is part of the business. That usually means that there are a few different stages that you have to go through: understanding the current state of the data environment and where the actual gaps are, finding use cases that have the best ROI-to-effort ratio, developing and testing models that can withstand exposure to the actual production data, integrating those models into the systems that your teams are actually using, and then implementing governance to make sure that the models are correct as the world changes.
The change management component is the part that most technical vendors tend to underestimate. A model that frontline managers don’t trust or don’t know how to use . It is just an expensive science project. Getting adoption means explaining the output in plain language, giving people a way to flag when something feels off, and demonstrating over time that the model’s track record justifies the trust being asked of them.
Turn enterprise data into actionable insights with AI-powered decision intelligence today
Building a Scalable Advanced Analytics Services for Enterprises Foundation
Enterprises that get sustained value from Advanced Analytics Services for Enterprises don’t build one model and call it done. They build a platform, a unified data layer that all models draw from, a registry that tracks what’s deployed and when it was last validated, an environment where new use cases can be tested before they go live, and deployment infrastructure that makes updating a model straightforward rather than a months-long IT project.
The Decision Intelligence Platform for Business layer that sits on top of all this needs to do one thing exceptionally well, and that is to make it easy for the business to understand why a recommendation was made. In regulated industries, especially banking, insurance, and healthcare, explainability isn’t a nice-to-have. Regulators expect it. Compliance teams require it. Frankly, business leaders shouldn’t be comfortable acting on recommendations they can’t interrogate.
The ROI Conversation: What CFOs Actually Want to Hear
The global decision intelligence market is expected to climb from USD 17.7 billion in 2025 to approximately USD 72.3 billion by 2034, at a 16.9% CAGR.
The most effective AI-Powered Decision Intelligence solutions are built with measurement in mind from day one, with baseline metrics set up before deployment, decision influence tracked, and outcome data collected automatically so that the ROI discussion is always based on actual numbers, not forecasts.
Wrapping Up
The businesses that are pulling away from their competition right now aren’t necessarily smarter or better funded. Many of them simply made the decision earlier to stop operating in the dark. They invested in Enterprise Predictive Analytics Services when it felt premature. They built their Decision Intelligence Platform for Business before they fully understood how they’d use it. Now, they’re operating with a visibility and speed advantage that is genuinely difficult for later movers to close.
You don’t need to have solved your data challenges before starting this journey. You don’t need a perfect data warehouse or a team of in-house data scientists already on payroll.
That’s what Antier does. Our Advanced Analytics Services for Enterprises are built around your specific business context, not a generic platform deployed out of the box. We’ve worked across financial services, retail, healthcare, and manufacturing to help enterprise teams move from fragmented data to decisions they can trust.
If there’s a decision your business is making today that you’re not fully confident in pricing,


- Uniswap (UNI) price drops despite plans to expand protocol fees and burn tokens.
- If approved, the fees will be activated across all v3 pools and eight additional chains.
- Currently, the key support sits at $3.38 while the immediate resistance is at $4.24.
Uniswap’s native token, UNI, has seen its price dip despite the ongoing governance push to expand protocol fees across more chains and all v3 pools.
While the protocol fee expansion promises to increase token burns and revenue for the protocol, short-term price action has remained under pressure.
The dip comes amid a broader downturn in the cryptocurrency market, with traders closely watching key support and resistance levels.
Uniswap protocol fee expansion proposal
The Uniswap community is currently voting on a proposal to activate protocol fees across all remaining v3 pools on Ethereum mainnet.
In addition, the plan includes extending fees to eight other networks, including Arbitrum, Base, Celo, Optimism Mainnet, Soneium, X Layer, Worldchain, and Zora.
This proposal is notable because it is the first to use the updated governance process known as UNIfication.
This system allows fee parameter changes to bypass the traditional proposal stage, speeding up voting while retaining on-chain security.
If approved, fees collected on these chains would flow to chain-specific TokenJar contracts before being bridged back to the Ethereum mainnet.
From there, UNI tokens would be burned, effectively reducing supply and increasing scarcity over time.
The proposal also introduces a new tier-based system for v3 pools, known as v3OpenFeeAdapter.
Instead of setting fees pool by pool, the system applies fees based on liquidity provider fee tiers.
This simplifies governance oversight and ensures every pool automatically contributes to protocol fee revenue.
Market response
Despite these ambitious plans, UNI’s market performance has struggled.
The token opened today at $3.56 but quickly fell, losing 4.8% from its opening price.
UNI briefly rallied to $3.59 but faced resistance and could not sustain momentum.
This highlights that market sentiment is cautious, even as governance improvements promise long-term benefits.
Currently, UNI is trading around $3.40, down roughly 4.7% in the last 24 hours.
Its market cap sits at just over $2.15 billion, while total value locked in Uniswap remains above $3 billion.
Uniswap price forecast
While the protocol fee expansion may boost long-term value and increase token burns, market reaction shows that short-term price action is likely to remain volatile.
The support at $3.38 is critical, according to market analysis.
If the token holds above this level, it may attempt to move toward the first major resistance at $4.24.
If the token breaches $4.24, it could open the path to $4.76, with a third resistance at $5.41.
However, failure to maintain above the support at $3.38 could see UNI struggle in the short term, limiting the impact of positive governance developments.

Metaverse blockchain games are no longer experimental concepts reserved for crypto enthusiasts. They are evolving into persistent digital economies where users socialize, transact, build assets, and invest time and money. For enterprises, this shift signals more than a gaming trend. It signals a new model of digital engagement, ownership, and monetization. Unlike traditional games, metaverse blockchain games combine:
- Persistent virtual worlds
- Digital asset ownership
- Token-driven economies
- User-generated ecosystems
- Decentralized governance
- Interoperable digital identities
These components help turn games into platforms and communities into economies. For enterprises exploring metaverse game development or blockchain game development, studying current leaders provides valuable strategic insights. The most successful projects reveal what actually works and what enterprises must prioritize.
Below are six metaverse blockchain games shaping the space, followed by the practical lessons they have on offer for enterprises.
1) The Sandbox
The Sandbox is one of the most recognized metaverse platforms where players and brands build experiences on virtual land parcels represented as NFTs. Major brands, artists, and entertainment companies have entered The Sandbox to host events, create branded worlds, and sell digital assets.
Why It Matters
The Sandbox demonstrates that metaverse value grows when users are creators, not just consumers. It transforms players into ecosystem contributors.
Enterprise Takeaway
Enterprises entering metaverse game development should not design closed worlds. They should provide creation tools, SDKs, and monetization channels for users. A platform where users build experiences scales faster than one where only developers create content. This, in turn, reduces content burden and increases engagement longevity.
2) Decentraland
Decentraland is a decentralized virtual world where users own land, assets, and governance rights. Decisions are often driven by community votes. Virtual real estate, digital commerce, and virtual events form the backbone of its ecosystem.
Why It Matters
Decentraland shows that digital ownership changes user behavior. When users truly own assets, they invest more time and value into the platform.
Enterprise Takeaway
Ownership is not a feature, it is a retention mechanism. Enterprises leveraging blockchain game development must design ownership structures that give users real control and tradable value. This creates long-term loyalty and repeat engagement.
3) Illuvium
Illuvium pushes the boundary of production quality in Web3 gaming. With high-end graphics and deep gameplay, it challenges the stereotype that blockchain games lack polish.
Why It Matters
Illuvium proves that Web3 players expect AAA-level quality. Blockchain alone does not attract users; gameplay and visual quality still drive adoption.
Enterprise Takeaway
Enterprises should not treat blockchain as the product. The game must stand on its own merit. Strong art direction, smooth mechanics, and immersive design remain essential for user acquisition and retention. For faster launch, enterprises can certainly make use of the Illuvium clone script.
4) Axie Infinity
Axie Infinity introduced millions to play-to-earn mechanics. At its peak, it became a livelihood source in some regions.
Why It Matters
Axie Infinity revealed both the potential and the risks of token-driven economies.
Enterprise Takeaway
Tokenomics must be designed for sustainability, not short-term hype. Enterprises must plan emission schedules, sinks, and reward balancing carefully. Poorly structured economies inflate quickly and collapse user trust. In this regard, enterprises can also try the Axie Infinity clone to build a similar game within a short span of time with help from professional service providers.
5) Star Atlas
Star Atlas combines metaverse scale, space exploration, and political governance systems.
Why It Matters
It highlights the growing ambition of metaverse blockchain games to become persistent virtual universes.
Enterprise Takeaway
Large-scale visions require scalable backend architecture and long-term roadmaps. Enterprises must treat metaverse game development as platform development, not a one-off release.
6) Otherside (Yuga Labs)
Otherside connects major NFT communities into a shared metaverse experience.
Why It Matters
It leverages brand power and community loyalty as a growth engine.
Enterprise Lesson
Community is a growth multiplier. Enterprises should integrate social systems, creator incentives, and shared experiences.
Do You Wish to Make a Mark in Metaverse Blockchain Gaming?
Cross-Game Insights for Enterprises
Analyzing these metaverse blockchain gaming projects reveals some common success factors:
1) Digital Ownership Drives Engagement
Users engage more when they own assets that carry value beyond the game. Ownership creates emotional and financial investment.
2) Community-Led Growth Scales Faster
Platforms that empower communities tend to grow organically. Social engagement drives retention and virality.
3) Sustainable Economies Matter
Token models must balance rewards and sinks. Inflation destroys ecosystems.
4) Quality Cannot Be Ignored
Gameplay, UX, and visuals still determine success, hence cannot be ignored at any cost.
5) Scalability Is Non-Negotiable
Infrastructure must support growth without bringing in any kind of performance issues.
The Hidden Complexity Behind Metaverse Blockchain Games
Many enterprises underestimate what goes into building these ecosystems. Real blockchain game development requires:
- Blockchain architecture
- Smart contract design
- NFT systems
- Multiplayer infrastructure
- Scalable servers
- Security-first design
- Wallet integration
- Marketplace mechanics
- Tokenomics modeling
Thus, enterprises should always keep in mind that it is not typical game development. It is platform engineering.
Why Enterprises Partner with a Specialized Game Development Company
Very few in-house teams combine gaming, blockchain, and economic design expertise. On the other hand, a specialized game development company provide:
- Proven frameworks
- Faster deployment
- Reduced risk
- Cross-domain knowledge
- Long-term support
This, in turn, allows enterprises to focus on strategy while execution is handled by experts.
Final Thoughts
Metaverse blockchain games are early blueprints for future digital economies. Enterprises that enter the field thoughtfully can build platforms where users spend time, creativity, and money. The leaders of tomorrow will not be those who chase hype, but those who build sustainable ecosystems today.
Antier, a leading game development company, works with enterprises to build metaverse blockchain ecosystems designed for scalability and longevity. The experienced team’s capabilities include:
- End-to-end metaverse blockchain game development
- Blockchain and NFT integration
- Tokenomics planning
- Scalable backend architecture
- Security-first engineering
The goal is not just launching a game but building a digital economy that lasts. Let’s collaborate to build your next hit title.
Frequently Asked Questions
01. What are metaverse blockchain games?
Metaverse blockchain games are evolving digital economies where users can socialize, transact, build assets, and invest time and money, combining elements like persistent virtual worlds, digital asset ownership, and token-driven economies.
02. How do metaverse blockchain games differ from traditional games?
Unlike traditional games, metaverse blockchain games offer persistent virtual worlds, user-generated ecosystems, decentralized governance, and digital asset ownership, transforming players into contributors rather than just consumers.
03. What should enterprises consider when developing metaverse games?
Enterprises should focus on creating open platforms that provide users with creation tools, monetization channels, and real ownership structures, as these elements enhance user engagement and retention.

TLDR:
- CME will offer 24/7 crypto futures and options starting May 29, pending approval.
- Year-to-date 2026 ADV hits 407,200 contracts, up 46% from last year.
- Futures ADV rises 47% YoY, signaling strong institutional interest in crypto derivatives.
- CME implements brief weekly maintenance; all holiday trades settle the next business day.
CME Group will begin round-the-clock trading for cryptocurrency futures and options starting May 29. The move awaits regulatory approval. Trading will run continuously on CME Globex, with a brief weekly maintenance window.
The update comes amid record demand for digital asset risk management, according to Walter Bloomberg. In 2025, CME reported $3 trillion in crypto notional volume. Year-to-date 2026 volumes are up 46%, highlighting growing institutional participation.
The announcement was confirmed via a press release from CME Group. It emphasizes access to regulated, transparent crypto products at all times for market participants.
Continuous Trading and Market Access
Starting Friday, May 29 at 4:00 p.m. CT, CME cryptocurrency products will trade 24/7. A
two-hour weekly maintenance period will occur over weekends. Trade dates for holiday or weekend activity will follow the next business day. Clearing, settlement, and regulatory reporting will also be processed on the next business day.
Tim McCourt, Global Head of Equities, FX, and Alternative Products at CME Group, said client demand for digital asset risk management is at an all-time high. Providing 24/7 access aims to let clients manage exposure anytime. Consequently, traders can react to market changes without delay.
This continuous trading structure includes both futures and options. CME Globex will host all transactions. As a result, the exchange meets rising institutional interest in high-frequency crypto risk management.
Record Volumes and Market Impact
Crypto trading at CME continues to reach record levels in 2026. Average daily volume stands at 407,200 contracts, up 46% year-over-year. Futures ADV alone is 403,900 contracts, marking a 47% increase. Open interest has risen 7% to 335,400 contracts.
CME operates across multiple asset classes, including interest rates, equity indexes, and commodities. Its derivatives platform allows clients to manage risk efficiently and capture opportunities.
By offering 24/7 crypto trading, CME provides a regulated alternative to unregulated markets.
The update also aligns with CME’s goal to enhance market transparency. Clients can trade with confidence, knowing all activity occurs under regulated oversight. This development strengthens the exchange’s position as a leading crypto derivatives marketplace.


Cambodia’s Deputy Prime Minister Sar Sokha has announced that 48,000 foreign nationals have been deported since the launch of a widespread scam center crackdown in 2023. However, he’s cautioned that despite this apparent success, the country’s police force is stretched worryingly thin.
Sokha reportedly shared the statistic as part of a “Safer Internet Day” campaign, launched last Tuesday.
However, he also warned that the nation’s police force is “stretched thin” with roughly one officer for every 3,100 citizens. In an effort to mitigate the shortfall, he outlined plans for a new initiative that would pay residents for any tips that lead authorities to scam center compounds.
He said, “We cannot do this alone. We need local residents to be our ‘eyes and ears’ to help sweep these operations out of our country.”
Sokha also said the government will introduce exit restrictions at airports to stop victims from being trafficked.
Women between the ages of 18 and 35 without clear documentation, verified sponsors, and little in the way of funds will be checked, as well as tourist travellers with very little money.
Read more: China executes four more in pig butchering scam crackdown
Additionally, there will be an effort to educate Cambodia’s population about the risks of AI and the ability it has to make scams more difficult to recognise.
Scam center compounds have been disrupted
In January, Sokha also promised to increase the minimum number of local police officers available to deal with drug trafficking and youth crime.
That month saw several scam center compounds significantly disrupted after the arrest of Chen Zhi, the alleged kingpin behind the billion-dollar operation. Since then, thousands have been deported after being inked to similar operations in casinos and other shady businesses.
The majority of these deported nationals are victims of trafficking who are forced to carry out crypto scams known as “pig-butchering.” Chinese victims often make up the bulk of these nationals but many come from other countries across Asia, and in rare cases, America.
Cambodia juggles scam center crackdown with Thailand war
On top of the 48,000 deported, Sokha said that around 210,000 foreign nationals have also voluntarily left the country. While the scam center epidemic has contributed to this exodus, the country’s ongoing armed conflict with Thailand may also be a factor.
Border clashes between the two countries began in May 2025 and have escalated to include exchanges of artillery fire, frequent gunfights, and Thai air bombardment directed towards Cambodia.
Hundreds of thousands of citizens have reportedly been displaced, while at least 149 have been killed. A peace agreement was first brokered in late July before fighting began again in December.
Cambodia’s Prime Minister Hun Manet claimed yesterday that Thai forces are still occupying its territory despite a peace deal brokered by US President Donald Trump in late December.
Read more: Thailand cuts power to Myanmar crypto scam center regions
Cambodia accused Thailand of killing one of its soldiers in May, leading to Thai ambassadors being pulled out of Cambodia. More clashes followed in July, with both sides disputing who fired first.
Many citizens are waiting to return to their homes, while Thailand’s newly elected nationalist Prime Minister, Anutin Charnvirakul, is pushing for a wall to be built along the border.
Got a tip? Send us an email securely via Protos Leaks. For more informed news and investigations, follow us on X, Bluesky, and Google News, or subscribe to our YouTube channel.

Why U.S. stocks are off to the worst start since 1995*
Under Salt Marsh star admits she’s hardly ever recognised in Wales
Stocks Are Lower. The S&P 500’s 3-Day Win Streak Is on the Line.


-

 Video3 days ago
Bitcoin: We’re Entering The Most Dangerous Phase
-

 Tech5 days ago
Luxman Enters Its Second Century with the D-100 SACD Player and L-100 Integrated Amplifier
-

 Crypto World2 days ago
Can XRP Price Successfully Register a 33% Breakout Past $2?
-

 Sports3 days ago
GB's semi-final hopes hang by thread after loss to Switzerland
-

 Video6 days ago
The Final Warning: XRP Is Entering The Chaos Zone
-
 Tech3 days ago
The Music Industry Enters Its Less-Is-More Era
-

 Business2 days ago
Infosys Limited (INFY) Discusses Tech Transitions and the Unique Aspects of the AI Era Transcript
-

 Entertainment1 day ago
Kunal Nayyar’s Secret Acts Of Kindness Sparks Online Discussion
-

 Video2 days ago
Financial Statement Analysis | Complete Chapter Revision in 10 Minutes | Class 12 Board exam 2026
-
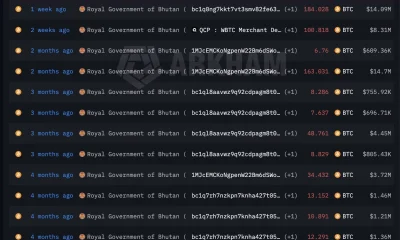
 Crypto World6 days ago
Bhutan’s Bitcoin sales enter third straight week with $6.7M BTC offload
-

 Tech1 day ago
Retro Rover: LT6502 Laptop Packs 8-Bit Power On The Go
-
 Sports12 hours ago
Clearing the boundary, crossing into history: J&K end 67-year wait, enter maiden Ranji Trophy final | Cricket News
-

 Entertainment18 hours ago
Dolores Catania Blasts Rob Rausch For Turning On ‘Housewives’ On ‘Traitors’
-

 Business1 day ago
Tesla avoids California suspension after ending ‘autopilot’ marketing
-

 Crypto World6 days ago
Kalshi enters $9B sports insurance market with new brokerage deal
-
 NewsBeat4 days ago
The strange Cambridgeshire cemetery that forbade church rectors from entering
-

 Crypto World21 hours ago
WLFI Crypto Surges Toward $0.12 as Whale Buys $2.75M Before Trump-Linked Forum
-
 Crypto World7 days ago
Ethereum Price Struggles Below $2,000 Despite Entering Buy Zone
-
 NewsBeat4 days ago
Man dies after entering floodwater during police pursuit
-

 NewsBeat5 days ago
UK construction company enters administration, records show